 Jianmin Dou
 Zhipeng Tao
 Yongbao Ji4
- 1School of Urban and Regional Science, Shanghai University of Finance and Economics, Shanghai, China
- 2PICC Asset Management Company Limited, Shanghai, China
- 3Antai College, Shanghai Jiao Tong University, Shanghai, China
- 4Yantai Vocational College, Yantai, China
This study aims to analyse the heterogeneous impact of the China’s Western Development Strategy (WDS) on the productivity of different types of firms. Based on the heterogeneous firm model and simulation, this study utilizes the WDS as a quasi-natural experiment and uses the difference-in-difference-in-differences (DDD) method to study the heterogeneous impact on the productivity of polluting and non-polluting firms. The WDS has increased the productivity of polluting firms in the western region by 8.0–12.6%, compared to the central region and non-polluting industries. This phenomenon is the result of the environmental cost effect and the migration effect, but not the result of the Porter effect. In addition, this study shows that the heterogeneity of productivity improvement in state-owned firms, large-scale firms, and firms not located in the acid rain and sulfur dioxide control zones is more significant. The study suggests that it is necessary to implement industry-differentiated regional policies, implement different regional preferential policies for polluting firms, and to strengthen environmental regulations, so as to achieve a win-win situation between firm efficiency improvement and environmental protection.
1 Introduction
Since the implementation of the reform and opening-up policy in 1978, China’s economy has developed rapidly, but regional differences have also widened. To reduce these differences, Chinese government began implementing a regional development strategy, known as Western Development Strategy (WDS), in 2001. This strategy aims to improve the level of economic development and ecological environment construction in the western region (Lai, 2002). The WDS provided a series of policy support to the western region of China, such as increasing capital investment such as fiscal expenditure, credit support, transfer payment, improving the investment environment such as tax incentives, preferential land and mineral resources, opening wider to the outside world, and developing technology and education. After the implementation of WDS, the economy in the western region has grown rapidly, but at the same time, the environmental pollution problem in the western region has continued to deteriorate (Cui et al., 2016).
In recent years, many articles have begun to identify and analyse the policy results of the WDS from both economic and environmental perspectives. Yang et al. (2018) constructed a provincial-level eco-productivity index and found that since the implementation of the WDS, the eco-productivity of the western region had continued to increase, and the difference on comparison with other regions had reduced. Zhuo and Deng (2019) measured the efficiency of the green economy at the inter-provincial level and found that although the WDS had improved the efficiency of green economy in the western region through the synthetic control method, there were still significant differences compared to other regions. Zhang et al. (2019) used the Propensity Score Matching Difference in Differences (PSM-DID) method to find that the WDS cannot reduce the carbon emission intensity of the western region.
In contrast to the above literature, which focuses on macro-aggregated variables, this study uses firm-level data and considers the WDS as a quasi-natural experiment to study the heterogeneous impact of the strategy on the productivity of polluting and non-polluting firms. More importantly, studying the impact on the productivity of polluting firms can evaluate the effect of the implementation of the environmental protection goals of WDS. This study aims to evaluate the implementation effect of WDS, that is, the impact of WDS on the productivity of different types of firms, to explain why WDS has a greater impact on the productivity of polluting firms in the western region, and how to achieve a win-win situation between firm efficiency improvement and environmental protection. Based on the heterogeneous firm model and simulation, this study utilizes the WDS as a quasi-natural experiment and uses the difference-in-difference-in-differences (DDD) method to study the heterogeneous impact on the productivity of polluting and non-polluting firms.
The marginal contribution of this article may be explained as follows: 1) Incorporating place-based policy and environmental regulations into the heterogeneous firm model. Through simulation, it is verified that the WDS is more conducive to increasing the efficiency of polluting firms in the western region. 2) Based on firm-level data, it is verified that the WDS is more conducive to increasing the productivity of polluting firms in the western region. 3) It is found that this phenomenon is the result of the combined effect of environmental cost advantage and migration effects, but the Porter effect did not have a significant impact on this process. 4) Based on the characteristics of firms or regions such as ownership, firm size, and “acid rain and sulfur dioxide control zones”, this article analyses the impact of the WDS on the heterogeneous improvement of productivity of polluting and non-polluting firms.
2 Theoretical Model
This study expands the heterogeneous firm model and incorporates place-based policies and environmental regulations to analyse the impact of the WDS on polluting and non-polluting firms.
2.1 Consumer Behaviour
Suppose there are only two regions in the entire economy: the western region W and the central region M. All consumers share the utility function given by:
where
Assuming that consumption of homogeneous goods is always positive, on solving the consumer utility maximisation problem, the inverse demand function of differentiated good r can be obtained as:
where
where
where
2.2 Producer Behaviour
Labour is the only element in production. The labour market is perfectly competitive; the elasticity of supply is 0, and the wage of unit labour is standardised to 1. The homogeneous good, produced under constant returns to scale using one unit of labour per output, is freely traded across regions. The differentiated goods sector is characterised by increasing returns, monopolistic competition, and iceberg trade costs, which generate emissions of a transboundary pollutant. According to the different pollution emissions per unit of product, firms producing differentiated goods can be further divided into
where
The place-based policy has the same impact on all industries in the region and
Drawing on the research of Zeng and Zhao (2009), firms hire more labour to comply with the environmental regulations of local governments. To simplify the analysis, we assume
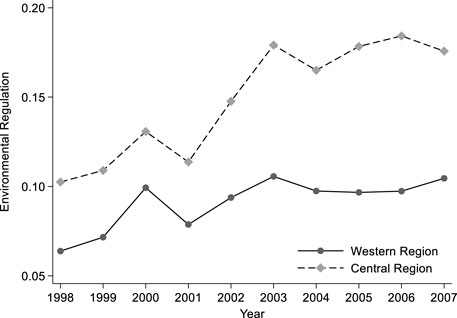
FIGURE 1. Differences in environmental regulation on both sides of the boundary between central and western China. Note: The SO2 removal rate was used to measure the degree of environmental regulation.
For the firm
where
where
On solving the profit maximisation problem, we obtain the following optimal price:
In addition, if the firm’s profit is negative, it will stop operating; therefore, its equilibrium profits are:
where
2.3 Equilibrium Analysis
In equilibrium, the price thresholds in the central and western regions can be solved using the following equations:
Following Combes (2012), the productivity threshold values of
The heterogeneity of productivity in industry
As Equation 13 cannot be solved explicitly, this study conducts a comparative static analysis through a numerical simulation. According to Del Gatto et al. (2006),
Based on the simulation results, it can be seen that with the WDS, the productivity of firms in the western region has effectively improved, when compared with that of the central region. In particular, the productivity of polluting industries has increased more significantly with the strengthening of policy advantage (
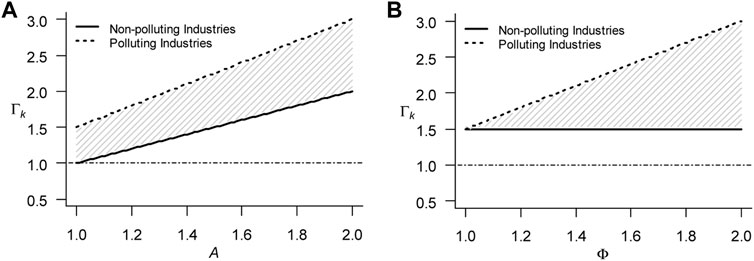
FIGURE 2. Simulation results of heterogeneity improvements of firm productivity. Note: The solid lines (dashed lines) in the figure represent the heterogeneity of the productivity of non-polluting industries (polluting industries) in the western and central regions, and the shadows represent the heterogeneity between polluting and non-polluting industries. In addition, loose environmental regulation parameter
Based on the above theoretical model analysis and numerical simulation results, we can put forward the following research hypothesis:
Hypothesis: the WDS has a heterogeneous impact on the productivity of different types of firms; when the environmental regulation in the western region is relatively loose, the WDS is more conducive to the improvement of the productivity of polluting firms in the western region.
3 Data and Empirical Strategy
3.1 Variable and Data
To test the conclusions reached in the theoretical section, this study utilises firm-level data for the period 1998–2007, from the annual surveys conducted by the National Bureau of Statistics. Additionally, this study treats the development of the western region as a quasi-natural experiment to identify its heterogeneous impact on different industries. This is to ensure that there are parallel trend assumptions in the strategy and non-strategy regions before strategy implementation (Bertrand et al., 2004). Therefore, this study selected a sample of firms in the cities on both sides of the provincial boundary line dividing the central and western regions in the WDS, including 57 cities in 14 provinces along the boundary line, of which 26 cities are located in the western region and 31 cities are located in the central region. For the cities on both sides of the boundary line, their geographical environment, climatic conditions, and culture are similar, and the heterogeneous influence between different cities can be eliminated as much as possible. The migration cost of firms on both sides of the boundary line is relatively low. In addition, although the WDS was determined in 2000, the strategy implementation began in 2001. Hence, the strategy’s implementation year is considered as 2001 for this study.
3.1.1 Firm Data
Referring to the research of Brandt et al. (2012), outliers are cleaned up and the samples are collected in the cities mentioned earlier. Total factor productivity (TFP) is one of the best proxy variables for firm productivity, and the LP method (Levinsohn and Petrin, 2003) is used to calculate TFP. In addition, Yu (2015) pointed out that firm size, whether to export, and ownership would affect the choice of a firm’s production technology and thus, affect TFP. Therefore, this study controls for the following variables: firm size (log(size), measured by the logarithm of the firm’s total assets), export (log(ex), measured by the logarithmic measure of the export value of firm +1), and whether the firm is a state-owned firm, and whether the firm is foreign-funded (State-owned and Foreign; measured by a dummy variable; assumed to be 1 if yes and 0otherwise).
With reference to Dou and Han (2019), the samples are divided into polluting and non-polluting firms by calculating the Pollution Density Index (PDI). Simultaneously, to improve robustness, this study also divides the sample according to the Pollution Intensity Index (PII) and the Pollution Comprehensive Index (PCI). The specific calculation method and classification results are presented in the Appendix.
This study draws the kernel density map of the non-polluting industry and polluting industry firms’ TFP in the central and western regions in 1998 before the implementation of the WDS and after its implementation in 2007 (Figure 3). It can be seen that in 1998, for both polluting and non-polluting firms, the TFP distribution in the western region showed a significant left deviation relative to that in the central region (Figures 3A, Figures 3B). By 2007, compared with 1998, the TFP distribution of all firms in the western region shifted significantly to the right compared to the central region. In 2007, the TFP distribution of polluting firms in the western region shifted significantly to the right compared to the central region (Figures 3C and Figures 3D).
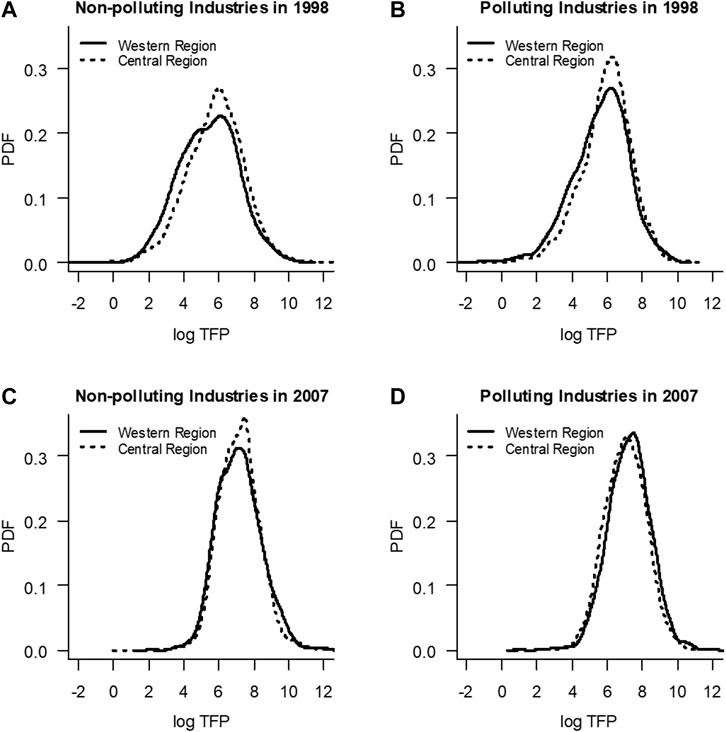
FIGURE 3. Log TFP distributions before and after the WDS.
This shows that with the implementation of the WDS, the distribution of TFP of non-polluting and polluting firms in the central and western regions has undergone structural changes. Compared with the central region, the TFP of firms in the western region has effectively improved but the increase in TFP is heterogeneous, and the strategy is more conducive to the increase in productivity of polluting firms in the western region. Among them, the distribution coefficient of the pollution firms in 2007 was significantly positive at the 1% level, indicating that the overall productivity of the polluting firms in the western region surpassed that of the central region. This also intuitively verifies the results of the numerical simulations.
3.1.2 Environmental Regulation
China’s city-level environmental statistics have been published since 2003, which does not coincide with the period considered in this study. However, the EPS China Green Development Database has provided emissions data for firms since 1998. Therefore, referring to Zhou et al. (2017), the emissions data for firms were summed up at the city level and the SO2 removal rate was used to measure the degree of environmental regulation in the study.
3.2 Specification
This study adopts the difference-in-difference-in-differences (DDD) approach to identify the heterogeneity of the WDS on the productivity improvement of polluting and non-polluting firms. Referring to Cai et al. (2016), the baseline regression model is set as follows:
where
4 Empirical Analysis
4.1 Main Results
The baseline regression results are presented in Table 1. The empirical results indicate that irrespective of the method used to identify polluting industries, as the WDS progresses, the polluting firms in the western region increases significantly by 8.0–12.6%, on average, compared with the central regions and non-polluting industries. In other words, the WDS has led to heterogeneity in the improvement of firm productivity; that is, this strategy is more conducive to the improvement of the productivity of polluting firms in the western region.
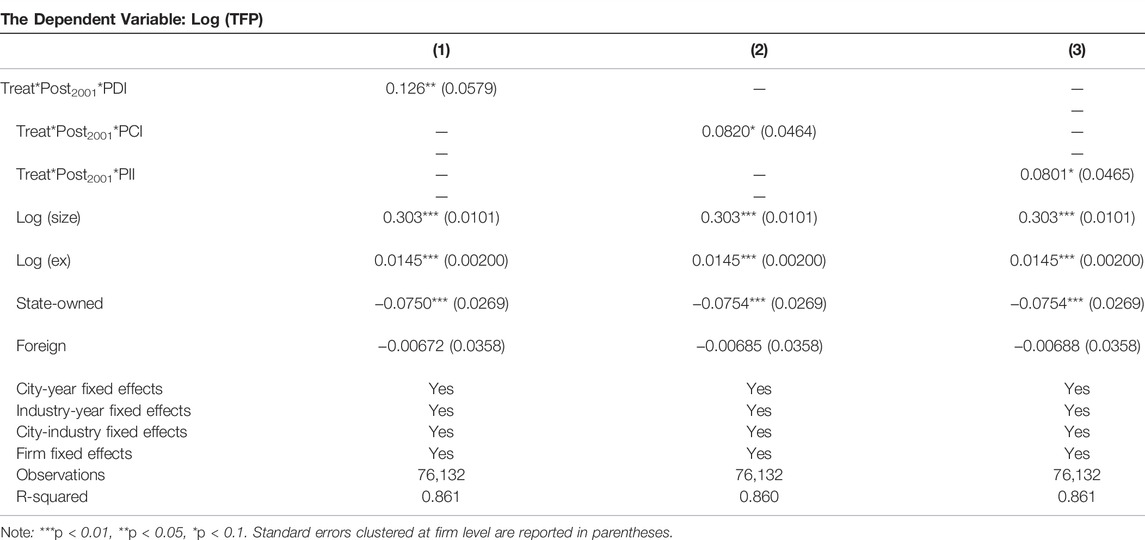
TABLE 1. Effect of the WDS on improvement of productivity of firms.
4.2 Robustness Checks
4.2.1 Testing for Variation Over Time
The premise of adopting the DDD method is that the data meet the parallel trend assumption, that is, before the implementation of the WDS, the trend of TFP changes in the western and central regions should be consistent. With reference to Liu and Qiu (2016), this study sets the following model:
where
Figure 4 shows the estimated value of
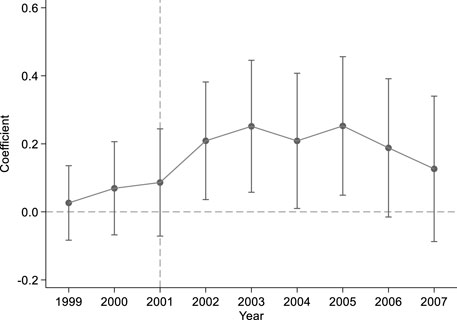
FIGURE 4. Result of the parallel trend test.
4.2.2 Placebo Test
To rule out the possibility of missing city-industry-time level variables, referring to Chetty et al. (2009), this study conducts a placebo test by randomly selecting 26 out of the 57 cities as virtual strategy cities. Then, a virtual triple difference term,

FIGURE 5. Result of Placebo test.
4.3 Mechanism Analysis
The previous section verifies that this strategy is more conducive to increasing the TFP of polluting firms in the western region. Regarding the analysis of the internal mechanism, according to the theoretical model, the looser environmental regulations in the western region have led to the region’s polluting firms having a larger environmental compliance cost advantage under the impact of the WDS, thereby increasing productivity. In contrast, the strategy may also cause highly efficient polluting firms to move to the western region, thereby increasing the overall efficiency of polluting firms. In addition, according to Porter’s hypothesis (Porter and Linde, 1995), polluting firms may also have innovation compensation effects.
4.3.1 Cost Effect
Figure 1 shows that the environmental regulations in the western region are relatively loose. Therefore, if it can be verified regional firms with lower environmental regulations are more efficient, cost advantage can then be considered as an important factor that leads to a more significant increase in the productivity of polluting firms in the western region.
The empirical results show that when the environmental regulation (ER) is reduced by one unit, the firms’ TFP will significantly increase by 8.4–8.5% at the full sample level (Table 2(1–3)). In the surviving sample (the firms that survived during the period), when the environmental regulation is reduced by one unit, the TFP will significantly increase by 5.4–5.5%. This shows that loose environmental regulations can indeed increase TFP by reducing the cost of environmental compliance for firms, and may increase the attractiveness of polluting firms.
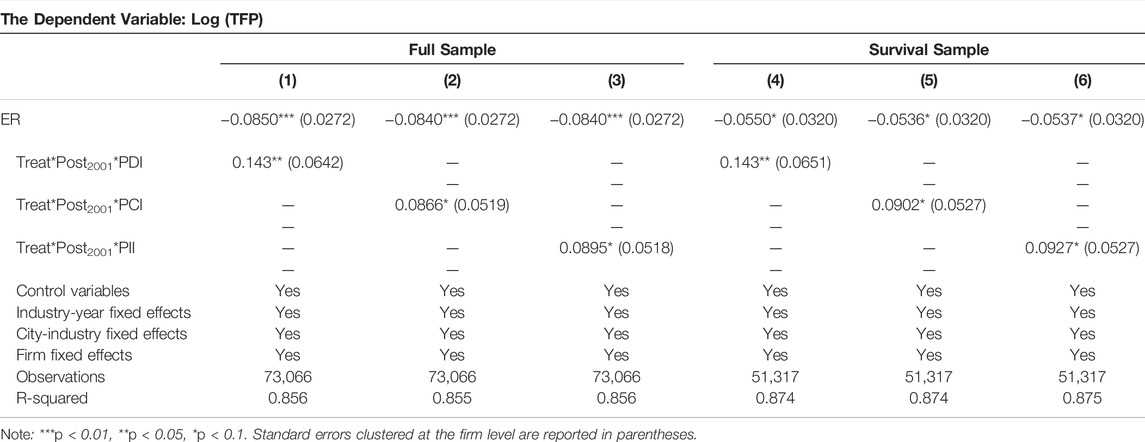
TABLE 2. Results of cost effect.
Notably, under the control of environmental regulations, the triple difference term is still significantly negative at the level of at least 10%. This shows that the WDS will magnify the cost advantage of polluting firms in the western region, which will lead to a greater increase in the productivity of polluting firms in that region.
4.3.2 Migration Effect
Based on the previous analysis, polluting firms in the western region have dual advantages in policy and environmental costs, which will inevitably attract firms to migrate to the west. If a large number of highly efficient polluting firms do so, the productivity of polluting firms in the western region will increase. On screening the samples of newly built firms in the western region after 2001, it can be observed that compared to the newly built non-polluting firms, the distribution of newly built polluting firms is significantly rightward (Figure 6), and the TFP is significantly increased by 10.6%.
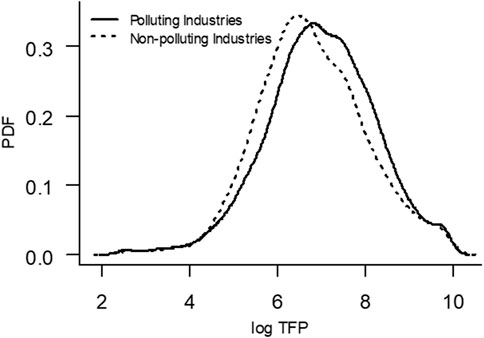
FIGURE 6. Log TFP distributions in the western region.
4.3.2 Porter Hypothesis
In addition to cost-side improvements, technological innovation is also a potential way to improve firm productivity (Aloini et al., 2015; Elahi et al., 2021; Elahi et al., 2022). As demonstrated in this study, when compared with non-polluting firms, polluting firms face stricter environmental regulations. According to Porter effect, this may force polluting firms to innovate more. This study adopts the logarithm of the output value of new products (log(XCP)) to measure the innovation behaviour of the firm and test it through the following two steps. The results are shown in Table 3.
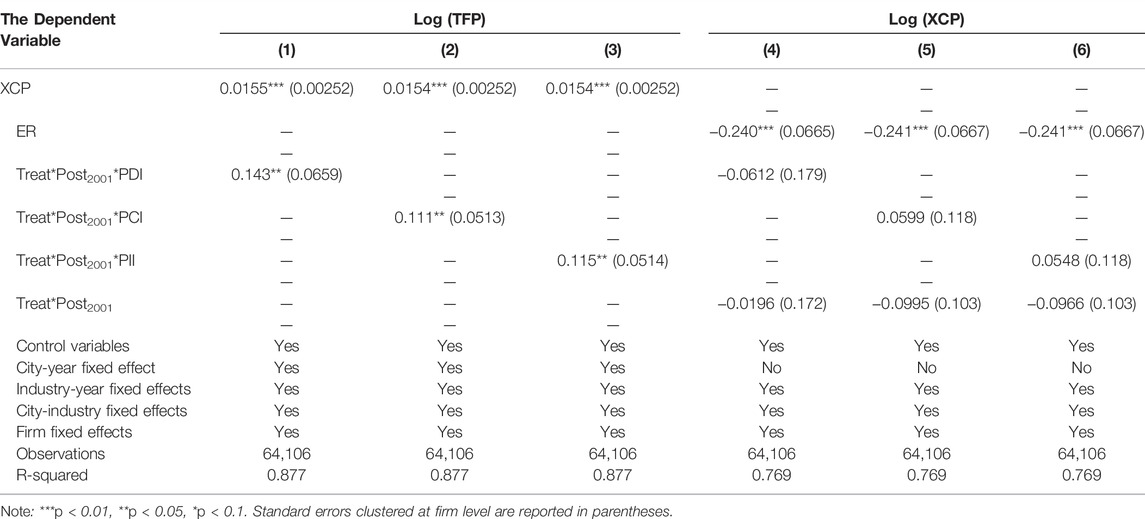
TABLE 3. Testing for Porter hypothesis.
On the one hand, firm innovation significantly increases TFP. On average, a 1% increase in the output value of new products will drive a 1.5–1.6% increase in TFP (Table 3 (1–3)). On the other hand, the regression analysis of environmental regulation on firm innovation shows that for every unit reduction in environmental regulation, the output value of new products of the firm will increase by 24% (Table 3 (4–6)). This shows that strict environmental regulations do not force firms to carry out more innovative activities. On the contrary, stricter environmental regulations increase the cost input, thereby reducing innovation input. The triple difference and double difference terms are not significant, which also shows that there is no significant difference in innovation behaviour between the central and western regions, and between polluting and non-polluting firms. In other words, no significant innovation compensation effect has been observed for polluting firms in the western region.
4.4 Heterogeneous Effects
In the baseline regression, the heterogeneity characteristics of firms or regions are controlled only in the form of controlled variables or fixed effects. The following section further clarifies the impact of these heterogeneous characteristics. The results are listed in Table 4.
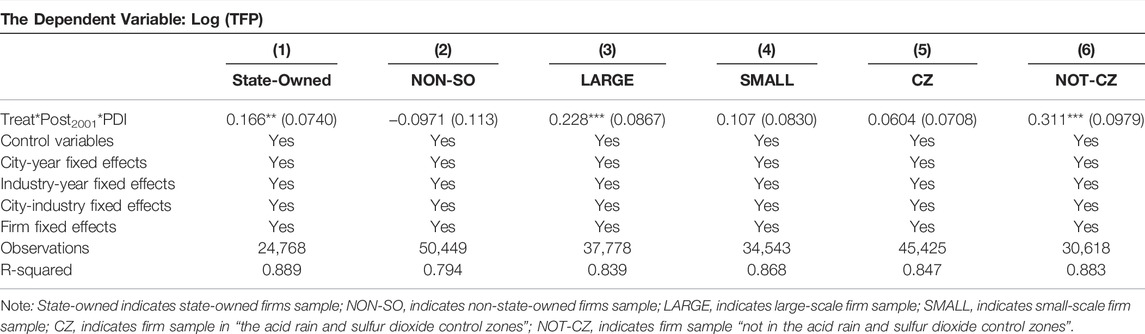
TABLE 4. Testing for heterogeneous effects.
First, in contrast to other types of ownership firms, there is a closer political connection between state-owned polluting firms and the government, and they often have stronger bargaining power in the environmental protection game with local governments (Wu et al., 2017). The subsample regression shows that the productivity of state-owned polluting firms in the western region has increased significantly by 16.6%, which is higher than the full-sample regression result. For the sub-sample of non-state-owned firms, the triple difference term is not significant. This shows that the advantage of the WDS in improving the productivity of polluting firms in the western region is more significant in state-owned firms. The reason for this phenomenon is likely to be that local governments have looser environmental regulations on state-owned polluting firms.
Second, the difference in firm size may also affect the productivity of polluting firms in the western region. This study uses the average of total assets of the firm as the threshold to perform subsample regression. It can be seen that the productivity of polluting firms above the average scale in the western region increased significantly by 22.8%, while there was no significant difference below the scale. This also shows that large-scale firms have greater environmental cost advantages, and therefore their productivity has been greatly improved in the development of the western region. This may be because larger firms are often “big taxpayers” benefiting from local protectionism, and may be given preferential treatment in specific environmental law enforcement.
Finally, as one of China’s most important environmental policies, the policy of “the acid rain and sulfur dioxide control zones,” implemented in 1998, will also affect the productivity of polluting firms. Tang et al. (2020) verified that polluting firms in the acid rain and sulfur dioxide control zones will face higher environmental regulation costs and their productivity growth will be hindered. The sample in this study included 31 cities belonging to the acid rain and sulfur dioxide control zones, of which 14 cities are located in the western region. By dividing the sample into two subsamples of “the acid rain and sulfur dioxide control zones” and “not in the acid rain and sulfur dioxide control zones”, it can be seen that in the former, the productivity of polluting firms in the west does not have a significant advantage, while in the latter, the productivity of polluting firms in the west has significantly increased by 31.1%, much higher than the regression result of the full sample. In other words, the lower environmental compliance costs of polluting firms not in the acid rain and sulfur dioxide control zones led to more significant heterogeneity in productivity improvement among industries.
5 Conclusion
As one of the government’s regional policies, the effectiveness of regional strategies has always been the focus of debate in academic circles. This study considers the WDS as the starting point and focuses on the analysis of the heterogeneity and mechanism of TFP promotion of polluting and non-polluting firms based on theoretical simulation and empirical research.
The research results of this study indicated that the WDS, without considering industry heterogeneity, has resulted in a significant increase of 8.0–12.6% in the productivity of polluting firms in the western region when compared with the central region and non-polluting firms. In other words, the WDS is more conducive to polluting firms to improve efficiency. The enlarged cost advantages brought about by the looser environmental regulations in the western region and the preference of highly efficient polluting firms to relocate to the western region have contributed to this phenomenon. In addition, the results further point out that in the western region, the productivity of polluting firms that are state-owned, large in scale, and not located in the acid rain and sulfur dioxide control zones, has increased even more.
Therefore, in the future, the government must ensure the effective implementation of regional development strategies, consider the heterogeneous effects of such strategies on different industries, and combine such strategies with industrial environmental policy. It is necessary to change the traditional “one size fits all” approach and systematically consider the heterogeneity between industries and regions. Only then can we achieve a win-win situation between the improvement of firm efficiency and the green development of the economy.
There are also some limitations in this study. Due to data limitations, it is impossible to study the long-term effects of the WSD. In the future, with the continuous disclosure of micro-data, it is possible to further examine the long-term heterogeneity impact on firm productivity after 10–20 years.
Data Availability Statement
The raw data supporting the conclusions of this article will be made available by the authors, without undue reservation.
Author Contributions
JD: Conceptualization, Writing-Reviewing and Editing, Validation, Resources. ZT: Methodology, Writing-Original. YJ: Data Processing.
Funding
Financial support from the National Natural Science Foundation of China (Grants No. 71974120), the Shanghai Philosophy and Social Science Planning Project (Grants No. 2018BJL005), the Social Science Foundation Project of Shandong Province (Grants No. 20DJJJ033), and the Shandong Natural Science Foundation Project (Grants No. ZR2020QG043) are gratefully acknowledged.
Conflict of Interest
ZT is employed by PICC Asset Management Company Limited.
The remaining authors declare that the research was conducted in the absence of any commercial or financial relationships that could be construed as a potential conflict of interest.
Publisher’s Note
All claims expressed in this article are solely those of the authors and do not necessarily represent those of their affiliated organizations, or those of the publisher, the editors and the reviewers. Any product that may be evaluated in this article, or claim that may be made by its manufacturer, is not guaranteed or endorsed by the publisher.
References
Aloini, D., Pellegrini, L., Lazzarotti, V., and Manzini, R. (2015). Technological Strategy, Open Innovation and Innovation Performance: Evidences on the Basis of a Structural-Equation-Model Approach. Meas. Bus. Excell. 19 (3), 22–41. doi:10.1108/mbe-04-2015-0018
Bertrand, M., Duflo, E., and Mullainathan, S. (2004). How Much Should We Trust Differences-In-Differences Estimates? Q. J. Econ. 119, 249–275. doi:10.1162/003355304772839588
Brandt, L., Van Biesebroeck, J., and Zhang, Y. (2012). Creative Accounting or Creative Destruction? Firm-Level Productivity Growth in Chinese Manufacturing. J. Dev. Econ. 97, 339–351. doi:10.1016/j.jdeveco.2011.02.002
Cai, X., Lu, Y., Wu, M., and Yu, L. (2016). Does Environmental Regulation Drive Away Inbound Foreign Direct Investment? Evidence from a Quasi-Natural Experiment in China. J. Dev. Econ. 123, 73–85. doi:10.1016/j.jdeveco.2016.08.003
Chen, Z., Kahn, M. E., Liu, Y., and Wang, Z. (2018). The Consequences of Spatially Differentiated Water Pollution Regulation in China. J. Environ. Econ. Manag. 88, 468–485. doi:10.1016/j.jeem.2018.01.010
Chetty, R., Looney, A., and Kroft, K. (2009). Salience and Taxation: Theory and Evidence. Am. Econ. Rev. 99, 1145–1177. doi:10.1257/aer.99.4.1145
Combes, P., Duranton, G., Gobillon, L., Puga, D., and Roux, S. (2012). The Productivity Advantages of Large Cities: Distinguishing Agglomeration from Firm Selection. Econometrica 80, 2543–2594.
Cui, Y., Lin, J., Song, C., Liu, M., Yan, Y., Xu, Y., et al. (2016). Rapid Growth in Nitrogen Dioxide Pollution over Western China, 2005-2013. Atmos. Chem. Phys. 16, 6207–6221. doi:10.5194/acp-16-6207-2016
Del Gatto, M., Mion, G., and Gianmarco, I. P., O. (2006). Trade Integration, Firm Selection and the Costs of Non-europe. SSRN Electronic Journal, CEPR Discussion Papers 5730. doi:10.2139/ssrn.926528
Dou, J., and Han, X. (2019). How Does the Industry Mobility Affect Pollution Industry Transfer in China: Empirical Test on Pollution Haven Hypothesis and Porter Hypothesis. J. Clean. Prod. 217, 105–115. doi:10.1016/j.jclepro.2019.01.147
Ehsan, E., Zhang, Z., Khalid, Z., and Xu, H., (2021). Application of an Artificial Neural Network to Optimise Energy Inputs: An Energy- and Cost-Saving Strategy for Commercial Poultry Farms. Energy 244:123169. doi:10.1016/j.energy.2022.123169
Elahi, E., Khalid, Z., Tauni, M. Z., Zhang, H., and Lirong, X. (2021). Extreme Weather Events Risk to Crop-Production and the Adaptation of Innovative Management Strategies to Mitigate the Risk: A Retrospective Survey of Rural Punjab, Pakistan. Technovation 2021 (4), 102255. doi:10.1016/j.technovation.2021.102255
Elahi, E., Khalid, Z., and Zhang, Z. (2022). Understanding Farmers' Intention and Willingness to Install Renewable Energy Technology: A Solution to Reduce the Environmental Emissions of Agriculture. Appl. Energy 309, 118459. doi:10.1016/j.apenergy.2021.118459
Elahi, E., Zhang, H., Lirong, X., Khalid, Z., and Xu, H. (2021). Understanding Cognitive and Socio-Psychological Factors Determining Farmers' Intentions to Use Improved Grassland: Implications of Land Use Policy for Sustainable Pasture Production. Land Use Policy 102, 105250. doi:10.1016/j.landusepol.2020.105250
Ferrara, E. L., Chong, A., and Duryea, S. (2012). Soap Operas and Fertility: Evidence from Brazil. Am. Econ. J. Appl. Econ. 4, 1–31. doi:10.1257/app.4.4.1
Kim, H. Y. (2019). Statistical Notes for Clinical Researchers: Simple Linear Regression 3 - Residual Analysis. Restor. Dent. Endod. 44 (1), e11. doi:10.5395/rde.2019.44.e11
Lai, H. H. (2002). China's Western Development Program. Mod. China 28, 432–466. doi:10.1177/009770040202800402
Levinsohn, J., and Petrin, A. (2003). Estimating Production Functions Using Inputs to Control for Unobservables. Rev. Econ. Stud. 70, 317–341. doi:10.1111/1467-937x.00246
Liu, Q., and Qiu, L. D. (2016). Intermediate Input Imports and Innovations: Evidence from Chinese Firms' Patent Filings. J. Int. Econ. 103, 166–183. doi:10.1016/j.jinteco.2016.09.009
Melitz, M. J., and Ottaviano, G. I. P. (2008). Erratum: Market Size, Trade, and Productivity. Rev. Econ. Stud. 75, 985. doi:10.1111/j.1467-937x.2007.00463.x
Pang, R., Zheng, D., Shi, M., and Zhang, X. (2019). Pollute First, Control Later? Exploring the Economic Threshold of Effective Environmental Regulation in China's Context. J. Environ. Manag. 248, 109275. doi:10.1016/j.jenvman.2019.109275
Porter, M. E., and Linde, C. v. d. (1995). Toward a New Conception of the Environment-Competitiveness Relationship. J. Econ. Perspect. 9, 97–118. doi:10.1257/jep.9.4.97
Tang, H.-l., Liu, J.-m., and Wu, J.-g. (2020). The Impact of Command-And-Control Environmental Regulation on Enterprise Total Factor Productivity: A Quasi-Natural Experiment Based on China's "Two Control Zone" Policy. J. Clean. Prod. 254, 120011. doi:10.1016/j.jclepro.2020.120011
Wang, X., Zhang, C., and Zhang, Z. (2019). Pollution Haven or Porter? the Impact of Environmental Regulation on Location Choices of Pollution-Intensive Firms in China. J. Environ. Manag. 248, 109248. doi:10.1016/j.jenvman.2019.07.019
Wu, H., Guo, H., Zhang, B., and Bu, M. (2017). Westward Movement of New Polluting Firms in China: Pollution Reduction Mandates and Location Choice. J. Comp. Econ. 45, 119–138. doi:10.1016/j.jce.2016.01.001
Yang, F., Yang, M., Xue, B., and Luo, Q. (2018). The Effects of China's Western Development Strategy Implementation on Local Ecological Economic Performance. J. Clean. Prod. 202, 925–933. doi:10.1016/j.jclepro.2018.08.203
Yu, M. (2015). Processing Trade, Tariff Reductions and Firm Productivity: Evidence from Chinese Firms. Econ. J. 125, 943–988. doi:10.1111/ecoj.12127
Zeng, D.-Z., and Zhao, L. (2009). Pollution Havens and Industrial Agglomeration. J. Environ. Econ. Manag. 58, 141–153. doi:10.1016/j.jeem.2008.09.003
Zhang, C., Zhou, B., and Wang, Q. (2019). Effect of China's Western Development Strategy on Carbon Intensity. J. Clean. Prod. 215, 1170–1179. doi:10.1016/j.jclepro.2019.01.136
Zhou, Y., Zhu, S., and He, C. (2017). How Do Environmental Regulations Affect Industrial Dynamics? Evidence from China's Pollution-Intensive Industries. Habitat Int. 60, 10–18. doi:10.1016/j.habitatint.2016.12.002
Keywords: regional development strategy, productivity of polluting firms, heterogeneity, environmental regulation, migration effect
Citation: Dou J, Tao Z and Ji Y (2022) Impact of Regional Development Strategy on the Productivity of Polluting Firms:Evidence From China. Front. Environ. Sci. 10:831643. doi: 10.3389/fenvs.2022.831643
Received: 08 December 2021; Accepted: 02 May 2022;
Published: 26 May 2022.
Edited by:
Ehsan Elahi, Shandong University of Technology, ChinaReviewed by:
Luigi Aldieri, Leipzig University, GermanyXinru Han, Institute of Agricultural Economics and Development (CAAS), China
Copyright © 2022 Dou, Tao and Ji. This is an open-access article distributed under the terms of the Creative Commons Attribution License (CC BY). The use, distribution or reproduction in other forums is permitted, provided the original author(s) and the copyright owner(s) are credited and that the original publication in this journal is cited, in accordance with accepted academic practice. No use, distribution or reproduction is permitted which does not comply with these terms.
*Correspondence: Jianmin Dou, am1kb3VAbWFpbC5zaHVmZS5lZHUuY24=; Zhipeng Tao, dHpwMTAyNEBxcS5jb20=
†These authors contributed to the work equally and should be regarded as co-first authors