 Yaru Zhang
 Yi He
Yi He Xingmin Mu
 Liping Jia
 Yanlin Li
94% of researchers rate our articles as excellent or good
Learn more about the work of our research integrity team to safeguard the quality of each article we publish.
Find out more
ORIGINAL RESEARCH article
Front. Environ. Sci., 16 August 2022
Sec. Environmental Informatics and Remote Sensing
Volume 10 - 2022 | https://doi.org/10.3389/fenvs.2022.831122
This article is part of the Research TopicHydroclimatic Extremes: Human-Natural System Adaptation and ImpactsView all 13 articles
In recent years, with the deterioration of the ecological environment, runoff in the Yellow River has been decreasing. Given these phenomena, it is necessary to research the base-flow segmentation methods and its characteristics. The Huangfuchuan Basin in the middle reaches of the Yellow River basin was selected as the research area. This paper calculated the base-flow with commonly used base-flow segmentation methods, including Base-flow index method (BFI), Hydrograph-separation techniques (HYSEP), and the digital filtering methods, and compared the applicability of these methods in the study area. Then the variation characteristics, abrupt change year, periodic change, and future trend of the base-flow were analyzed. The results are as follows: 1) Through the analysis and comparison of several common base-flow segmentation methods, these methods had a marked difference in base-flow segmentation. The variance and extreme-ratio of DF4 in the digital filtering methods were small. The correlation between DF4 and other methods was high. DF4 in the digital filtering methods was the most appropriate method in the research area. 2)The runoff and base-flow index presented a decreasing trend. The annual average runoff was 1,100.27 × 104 m3, and the maximum base-flow was 0.21. The base-flow also showed a significant decrease trend by the Mann-Kendall trend test, the average base-flow was 10,578.35 × 104 m3. 3) The base-flow had periodic variations of 3–6, 7–18, and 19–32. In the 19–32 years time scale, three oscillations alternated between abundant and dry. The whole time was 31 years as the center of the periodic change, the first primary cycle of base-flow change. 4) The base-flow mutation occurred in 1986. The Hurst index of base-flow in the Huangfuchuan Basin was 0.84. It was shown that the trend of future development is positively correlated with past change, showing a trend of continuous decrease. Selecting the appropriate method of base-flow segmentation and reasonably analyzing the variation characteristics of base-flow can provide scientific guidance for the ecological environment construction and water resource evaluation in the Huangfuchuan Basin and even the Yellow River Basin.
Water resources are the primary condition for the sustainable development of the Earth’s ecological environment. Meanwhile, it is an indispensable material for the survival of organisms (Liao et al., 2020). With the rapid growth of the social economy, many countries face different degrees of water shortages (Chang, 2009). Climate change and human activities pose significant threats to water resources and water cycles. The complex relationship between the water cycle, climate change, and human activities has become the focus of scientific research today (Bastin et al., 2019).
Base-flow is a considerable part of water resources and plays a vital role in the water cycle (Chen et al., 2006). Base-flow is the essential runoff replenished by groundwater, and it is also the primary runoff to maintain the stability of the ecosystem (Brutsaert and Nieber, 1977; Tallaksen, 1995). It has the characteristics of stable flow and slight variation in annual distribution. The distribution features of base-flow are influenced by climate type, topography, and soil properties. Meanwhile, the influence of human activities is also gradually growing (Veldkamp et al., 2017). Base-flow plays a crucial role in maintaining the water balance, managing water resources reasonably and scientifically, and maintaining ecological river health. Base-flow is a hot topic that attracts attention and exploration in hydrology research (Lin and Li, 2010). In recent years, experts and scholars have performed much research on the base-flow and obtained some breakthroughs, but the definition of base-flow has not been unified, which has led to the diversity of base-flow segmentation methods (Santhi et al., 2008; Janke et al., 2014).
Base-flow segmentation is the focus and difficulty of current base-flow research. To date, many base-flow segmentation methods have been proposed by scholars from various countries, but it is still difficult to find a universally recognized base-flow segmentation method (Xu et al., 2016; Eckhardt, 2008). The traditional techniques of base-flow segmentation include the straight-line segmentation method and regression curve method. Nevertheless, these methods are difficult to apply to long time series data due to their complex calculation (Zuo et al., 2007). With the wide application of computer technology in hydrology, automatic base-flow segmentation methods have been developed, including BFI (Wels et al., 1991), HYSEP (Sloto and Crouse, 1996), digital filter methods (Arnold et al., 1995), Kalinin method (Wittenberg and Sivapalan, 1999), hydrological model method, and isotope method (Li et al., 2009). The United States Geological Survey (USGS) developed the Base-flow Partitioning Method (PART) and compared it with the manual mode. The difference between the result of this method and manual calculation was less than 10%, so the result was reasonable (Rutledge, 1993). The digital filtering method was first proposed in 1979. Nathan and McMahon improved the technique and verified the base-flow segmentation results of different watersheds. The segmentation results of the digital filtering method were reasonable. Automatic base-flow segmentation technology has become mature and widely used (Lyne and Hollick, 1979; Chapman, 1991). The smoothed minimum method proposed by the British Institute of Hydrology was compared with the manual method to segment the base-flow. A better result can be obtained when the optimal inflection point test factor is 0.9 (Mazvimavi et al., 2004). With the wide application of 3S technology, the emergence of distributed hydrological models, such as the TOPgraphy based hydrotogical Model (TOPMODEL) and Soil and Water Assessment Tool (SWAT), provided a suitable method for base-flow segmentation (Partington et al., 2012). These methods had reasonable objectivity and repeatability; consequently, they had been applied and developed rapidly in current studies. However, the segmentation results of these methods were not identical or even entirely different.
In practical applications, selecting stable and reliable base-flow segmentation according to hydrogeological conditions of different basins has become the research focus. Eckhardt used seven other methods to calculate the base-flow of 65 watersheds in the northern United States. The results showed that the calculation results based on the two-parameter Eckhardt filtering method were more reasonable and more consistent with the receding process of base-flow (Eckhardt, 2008). Zhang et al. used the SWAT model to simulate surface runoff and base-flow in a small watershed in the United States. The results showed that SWAT model simulation had superior performance. This technology can be used as a valuable tool to explore surface runoff and base-flow. It also provided a reference for further diagnostic evaluation and model recognition (Zhang et al., 2011). Wang et al. used five automatic base-flow segmentation methods to segment the runoff data of Luoshan Station in the Yangtze River from 1965 to 2012. They found that the annual base-flow process segmented by the five methods was significantly different. The calculation results of BFI were more in line with the various characteristics of base-flow. It was a suitable method for base-flow segmentation in the middle reaches of the Yangtze River (Wang et al., 2015). Lv et al. used the fixed interval method, sliding time method, local minimum method, and digital filtering method to calculate base-flow in the Fen River Basin. The curve of the digital filtering method was smooth and consistent with runoff, which conformed to the regularity of base-flow. The digital filtering method can objectively reflect the base-flow condition of the Fenhe River basin (Lv et al., 2021). Yang et al. used the SWAT model to simulate the base-flow of the Luohe River Basin. The results showed that the accuracy of the SWAT model simulation is higher than that of the digital filtering methods (Yang et al., 2003).
The Yellow River is an essential river in northern China. The Huangfuchuan Basin is one of the most severe areas of soil erosion in the middle of the Yellow River Basin. Climate change, plant change, and soil and water conservation measures have significantly affected the watershed. In recent decades, the runoff of the Huangfuchuan Basin has shown a declining trend (Sui et al., 2008). Studies by experts and scholars have shown that climate change and human activities are the main reasons for the decrease in runoff and sediment movement law (Shao et al., 2014; Liu et al., 2021). However, most of the research was mainly on runoff, and few types of analysis were on the division and trend change of base-flow. In the middle reaches of the Yellow River Basin, the soil erosion control measures for a long time have resulted in the change of the flow matrix and the base-flow. Studying base-flow in the Huangfuchuan Basin is essential content for water balance and water resources management. It is also an essential basis for maintaining river ecological health (Yi and Zhou, 2017).
Based on the daily runoff data of the Huangfuchuan Basin this paper used BFI, HYSEP, and the digital filtering methods to calculate the base-flow. Through comparative analysis, this paper obtained the most suitable base-flow segmentation method in Huangfuchuan basin. This paper used the Mann-Kendall trend test, Pettitt mutation point test, Hurst index method, and wavelet analysis method to systematically research the properties of base-flow. We revealed the interannual and periodic changes of runoff and base-flow in the study area from 1960 to 2015, and predicted the future changes of baseflow. With the contradiction between the supply and demand of water resources becoming increasingly prominent, the study of this paper could provide essential information on the production mode and flow decision, the redistribution of water resources, and the optimization of the economic layout in the Huangfuchuan Basin.
The Huangfuchuan Basin is located in the middle reaches of the Yellow River (Figure 1). It is in the transition zone between the Loess Plateau and the desert steppe. The latitude and longitude range are 113.3°–111.2° E, 39.2°–39.9° N, with a catchment area of 3,246 km2 and the main steam of 137 km (Li et al., 2019). As a result of the high difference in topography and heavy rain erosion, the Huangfuchuan Basin formed a hilly gully landform. The basin has an arid and semiarid climate, with an annual average temperature of 6–7°C and an annual rainfall of 350–450 mm. The annual variation of rainfall is considerable, and most of them are concentrated in summer in the form of heavy rain. Rainfall and groundwater recharge are the primary water sources, and the correlation between annual runoff and rainfall is obvious and uneven (Hu et al., 2018). It is a typical farming-pastoral ecotone, and the land use types are mainly grassland, cultivated land, and artificial forestland. Drought and rainstorm disasters frequently occur in the Huangfuchuan Basin. Soil erosion and land desertification make the river ecological environment and hydrological process very sensitive (Wei and Jiao, 2017).
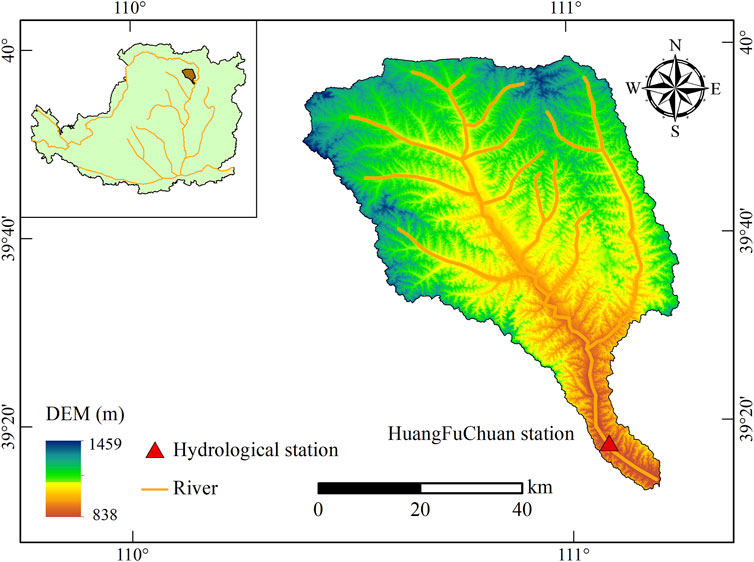
FIGURE 1. The geographical location and elevation of the Huangfuchuan Basin.
The runoff data were from the Hydrological Yearbook of the Yellow River Basin by the Yellow River Water Conservancy Commission of the Ministry of Water Resources. We used the daily runoff data of the hydrological station in the Huangfuchuan Basin from 1960 to 2015.
The Base-flow index method (BFI) is a way to calculate base-flow with base-flow index as weight coefficient, which is mainly expressed by the ratio of base-flow and total runoff. There are three main steps in the calculation process. First, the same time interval was selected to divide the annual daily runoff process into 365/N periods. The study usually uses trial analysis to determine N. N could be 1, 2, 3…, until the base-flow index tends to be stable. This paper calculated the daily runoff data of the Huangfuchuan Basin and found that when N
Pettyjohn and Henning first compiled the base-flow calculation program and proposed the Hydrograph-separation techniques (HYSEP) in 1979 (Pettyjonh and Henning, 1979). It mainly includes Fixed interval method, Sliding time method, and Local minimum method (Sloto and Crouse, 1996). The formula is:
where, A is the basin area, N is the duration of surface runoff. The area of the Huangfuchuan Basin is 3,246 km2. Through calculation, N = 6.09 is obtained. The base-flow segmentation interval parameter t is an odd number that is closest to 2t and between 3 and 11. In this paper, N = 11 is used to calculate the base-flow.
Fixed interval method: the base-flow in the segmentation interval is equal to the minimum flow in the period. Sliding time method: the base-flow at the current moment is the minimum flow in the period before and after (2N-1)/2d. Local minimum method: in the selected time interval, the base-flow at the central moment is the minimum flow in the period before and after (2N-1)/2d. The flow at other times is obtained by linear interpolation with the flow at the major moment of the adjacent break.
The digital filtering method is a common technology of base-flow segmentation. It can decompose the signal into a high-frequency signal (surface runoff) and a low-frequency signal (base-flow) through a digital filter to achieve base-flow segmentation (Eckhardt, 2012). Digital filtering methods include Lyne-Hollick filtering (DF1) (Lyne and Hollick, 1979), Chapman-Maxwell filtering (DF2) (Chapman, 1999), Boughton-Champan filtering (DF3) (Boughton, 1993), and Eckhardt filtering (DF4) (Eckhardt, 2005).
Lyne-Hollick filtering (DF1):
where,
Chapman-Maxwell filtering (DF2)
where,
Boughton-Champan filtering (DF3)
where,
Eckhardt filtering (DF4)
where,
The Mann-Kendall (MK) test is an effective tool to show the trend of change recommended by meteorological and hydrological institutions at home and abroad (Burn and Elnur, 2002). The MK test method is nonparametric. The nonparametric test method has the advantage of strictly following a specific distribution and is not affected by a few outliers. The MK test has been widely used in the change trend analysis of meteorological and hydrological time series. Its calculation formula is as follows:
Define the test statistic S:
Calculate the standard statistic Z:
where, n is the number of samples, xj and xk are the ranks of samples, xi and xj of the time series.
When Z < 0, the sequence shows an upward trend; when Z > 0, the series shows a downward trend. When the absolute value of Z is greater than or equal to 1.28, 1.64, 2.32, it means that it passes the significance test of the confidence interval of 90, 95, and 99% (Chen and Xu, 2016).
The Pettitt mutation point test is an analysis method for the mutation point of hydrological time series based on the nonparametric test, and its premise is that there is trend change in the series (Pettitt, 1979). The formula can be calculated as follows:
When testing the sequence, it uses the K-S two-sample test according to the theory of sequential statistics. The position of the mutation point (P) is the accumulation probability of the difference between the maximum values of the two-sample distribution functions.
Wavelet analysis provides the possibility to study time series better. It can reveal a variety of trends hidden in the time series and can qualitatively estimate the future development trend of the system (Wang, 2005).
The calculation formula of wavelet transforms:
The calculation formula of wavelet square difference:
where,
The Hurst index is an effective method to describe the long-term dependence of a time series and is used to estimate the persistence or anti-persistence of trends in time series (Bashir et al., 2020). The R/S analysis method is commonly used to obtain the Hurst index.
The Hurst index has three methods: 1) H > 0.5 means the persistence of the series, and the same trend changes in the future time series. 2) H = 0.5 stands for the randomness of the time series without persistence, indicating that the changing trend of the future time series has nothing to do with other changes. 3) H < 0.5 indicates the anti-persistence of the series, indicating that there is an opposite change trend in the future time series.
In this paper, the study area was segmented by nine base-flow segmentation methods in three categories (Table 1). The results of different segmentation methods differ significantly.
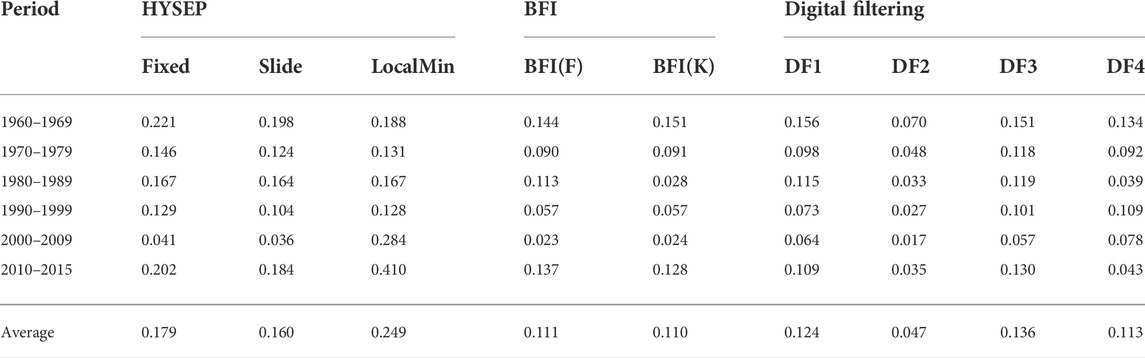
TABLE 1. The result of base-flow segmentation method.
Among the base-flow index results calculated by HYSEP, the results calculated by LocalMin were too large, 0.249. The Fixed and Slide results were 0.179 and 0.16, respectively. BFI showed little difference and was stable at 0.1; the results obtained by the digital filtering methods were relatively scattered. In particular, the base-flow index calculated by DF2 was less than 0.1, which was the ratio of base-flow to river runoff was less than 10%. The calculation result was too small to conform to the characteristics of groundwater discharge in the study area. The other three calculation results were relatively stable, at 0.124, 0.136, and 0.113. The results of base-flow index calculated based on BFI, DF1, and DF4 are relatively close, which are all between 0.11 and 0.12. Among the nine base-flow segmentation methods, except the LocalMin, the base-flow index calculated by other methods presented a decreasing trend.
We calculated the variance and extreme-ratio (the ratio of the difference between maximum and minimum to minimum) of nine methods and compared their stability (Table 2). From the mean value, the results of the HYSEP were generally high, which was between 0.16 and 0.25; the result of BFI was relatively stable; in the digital filter methods, the values of DF1, DF3, and DF4 were between 0.1 and 0.14, and DF2 calculation had a small mean value. In terms of variance, HYSEP had high variances, and the value was above 0.1. The variance of BFI was 0.079. In the digital filter methods, DF2 and DF4 had minor variance. From the extreme-ratio, the smaller values were LocalMin in HYSEP and DF4; the largest values were Fixed in HYSEP and DF2. From the comprehensive perspective of the mean value, variance, and extreme-ratio, the variance and extreme-ratio of DF4 were relatively small. The base-flow index of different years was between 0.009 and 0.221. The calculation results of this method have slight interannual variation and are in line with the characteristics of slight fluctuation of base-flow age.

TABLE 2. Characteristic plant of base-flow segmentation method.
The correlation of the nine base-flow segmentation methods was calculated (Table 3). The correlation between the base-flow index values calculated by the LocalMin in the HYSEP and other methods was very low, so the following discussion did not include it.
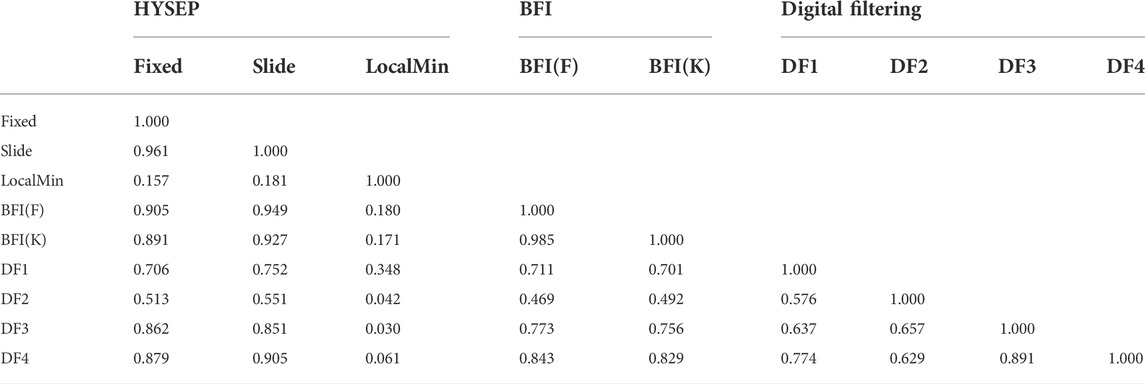
TABLE 3. Correlation of base-flow segmentation methods.
In the HYSEP, the correlation between the Fixed and other methods was more than 0.5. Similarly, the correlation between the Slide and other methods was more than 0.5. The correlation of the base-flow index obtained by BFI (F) and BFI (K) was close to other methods, and the correlation with other methods was more than 0.45. In the digital filtering methods, the correlation coefficient between DF1 and other methods was between 0.57 and 0.77, and DF2 and other methods were between 0.46 and 0.66. The correlation coefficient between DF3 and other techniques was 0.63–0.89. The correlation between F4 and other methods was higher than 0.77 except for the correlation with DF2. In the three categories of methods, the correlation between the BFI and HYSEP is better than digital filtering methods, indicating that BFI is close to the base-flow segmentation results of HYSEP.
By analyzing the base-flow segmentation method, the value of the LocalMin in HYSEP was too small, and DF2 in the digital filtering methods was too high; neither of these two methods can accord with the change characteristics of base-flow in the study area. In general, the base-flow index of DF4 had the highest correlation with the other methods. Its variance and extreme-ratio were generally very small, showing high stability. In the Huangfuchuan Basin, the base-flow result calculated by DF4 in the digital filtering method was more appropriate, and base-flow results were also used in this paper to analyze the base-flow changes.
Through the trend line in the research area, the runoff presented a decreasing trend (Figure 2). The maximum runoff occurred in 1979, which was 43,712.22 × 104 m3, and the annual average runoff was 1,100.27 × 104 m3. The base-flow index also showed a downward trend. The maximum base-flow index was 0.21, which appeared in 1962. The average base-flow was 10,578.35 × 104 m3, the maximum yearly base-flow was 46.679 × 10⁴ m3. The Mann-Kendall trend approach to calculate the Z-testing statistical value was −6.349, indicating that the base-flow presented a significant downward trend and reached a significant level of 99% reliability.

FIGURE 2. Change curves of runoff, base-flow, and base-flow index.
We used the Pettitt mutation point test method to analyze the base-flow mutation years in the Huangfuchuan Basin from 1960 to 2015 (Figure 3). The mutation year was 1986, and the confidence level was 99%. The Hurst index of base-flow in the study area was 0.84 (H = 0.84). H > 0.5, there was a long-term correlation between the future trend and its historical trend. As seen from the above, the base-flow in the study area is decreasing continuously, and it will be further reduced in the future.
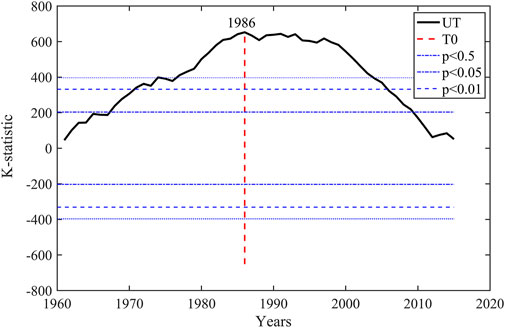
FIGURE 3. Mutagenicity analysis of the Huangfuchuan Basin.
The periodic variation of base-flow in the study area was analyzed by a wavelet coefficient diagram and wavelet variance (Figure 4). The base-flow presented periodic variation characteristics at scales of 3–6, 7–18, and 19–32. In the 19–32 years time scale, three oscillations alternated between abundant and dry. The center of the periodic change was 31 years, corresponding to the first peak value of the wavelet variance. The oscillation was weak on the time scale of 3–6 years and gradually disappeared in 1980. On a time scale of 7–18 years, there were six oscillations and the oscillations gradually became weaker.
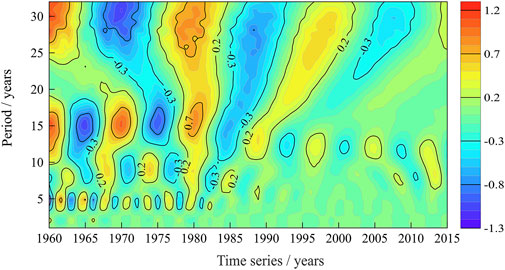
FIGURE 4. The wavelet coefficient of base-flow in the Huangfuchuan Basin.
In the wavelet variance of base-flow, there are three peaks, corresponding to 5, 15, and 31 years (Figure 5). Below 10 years, the cycle oscillates violently without apparent regularity. On scales 15 and above, periodic and regular regions were evident. The first peak value of the wavelet square difference was 31 years, which was the first main period of base-flow change.
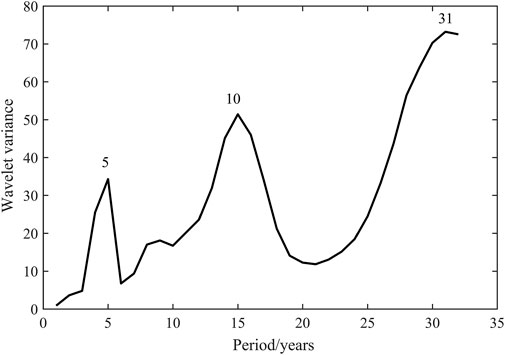
FIGURE 5. The wavelet variance of base-flow in the Huangfuchuan Basin.
The Huangfuchuan Basin is one of the areas with the most severe soil erosion on the Loess Plateau. In recent years, climate change and human activities have changed the base-flow, so researching the base-flow is indispensable for constructing the local ecological environment. This paper used HYSEP, BFI, and the digital filters methods to calculate the base-flow in the study area. By comparing the stability and correlation of the nine methods, the variance and extreme-ratio of DF4 in the digital filter methods were generally minor, and the correlation with other methods was also high. It is concluded that the base-flow segmentation result of DF4 was the most appropriate. According to the DF4 results, the average annual base-flow in the study area is 1,057.84 × 104 m3, and the average yearly base-flow index is 0.113. Liu et al used BFI and the digital filtering methods to calculate the base-flow of the Huangfuchuan Basin, and the study showed the changes of runoff and base-flow showed a decreasing trend, which was consistent with the results of this paper (Liu et al., 2016). In addition, this paper analyzed the periodicity, mutation year and future trend of base-flow. The abrupt change of base-flow occurred in 1986. The first principal period of the base-flow is 31 years. There was also a trend of further decrease in the future.
Base-flow segmentation is a common problem in hydrological analysis and calculation of watersheds. At present, there are many methods for base-flow segmentation; however, there is no universally accepted technology. The segmentation results of each technology are not exactly the same, and sometimes even very different. Due to the differences in hydrogeological conditions and basic abortion flow processes, the appropriate methods are different in different basins. In the Yangtze River Basin, BFI is the most suitable method for base-flow segmentation, while in the Fenhe River Basin and the Huangfuchuan Basin, digital filtering method is the most suitable method (Wang et al., 2015; Lv et al., 2021). In addition to the above automatic segmentation methods, hydrological modeling methods also began to develop rapidly. SWAT was used to study a small area in the United States and the Luohe River basin, and the study showed that the accuracy of SWAT was higher than that of the digital filtering method (Yang et al., 2003).
Base-flow is a component of runoff, which is affected by climatic characteristics, precipitation, human activities, vegetation and soil characteristics (Hu et al., 2021). Li et al showed that forest disturbance not only increased the runoff of the basin, but also increased the base-flow. Climate change, contrary to the effect of forest disturbance, reduced the flow of all runoff components (Li et al., 2018). Guo et al showed that different land use types, precipitation, drainage density and river gradient affected the change of base-flow on the Loess Plateau. The change of runoff and base-flow shows a decreasing tendency in the Huangfuchuan Basin (Guo et al., 2011). According to the climate characteristics of the Huangfuchuan Basin, the temperature shows a rising trend, while the precipitation shows a declining trend (Hu et al., 2018). Evapotranspiration intensifies the water pressure, and the decrease of rainfall caused by climate change has an important impact on runoff and base-flow. In addition, the changes of runoff and base-flow are also affected by human activities, such as conversion of farmland to forest and water conservation processes, which change the underlying surface and reduce the runoff (Zhao et al., 2013; Liu et al., 2016). In recent years, there has been excessive exploitation of coal resources and the increase of urban land area in the Huangfuchuan Basin (Jin et al., 2013; Yu et al., 2014). These human activities have greatly reduced the water area and affected runoff and base-flow.
Due to the limitations of data, research methods, and techniques, this paper still has some deficiencies and uncertainty. In this paper, we used a variety of methods widely recognized to calculate the base-flow and selected the most suitable segmentation method. However, base-flow is difficult to measure directly, so it was difficult to verify the results of base-flow segmentation method. The results in this paper were only the estimated value of the actual base-flow, rather than the real value (Lei et al., 2021). Using the results to analyze the variation characteristics of base-flow, and only using the method of mathematical statistics, there are certain errors between the results and the actual situation. Therefore, in future research, we should further optimize the practicability of the base-flow segmentation method in the Huangfuchuan Basin.
In this paper, nine base-flow segmentation methods were used to calculate the base-flow, and then their suitability in the Huangfuchuan Basin was discussed. Based on MK trend analysis, Pettitt mutation point test, Wavelet analysis method, and Hurst index, the characteristics of base-flow were studied. The main conclusions of this paper are as follows:
1) Among the results of HYSEP, BFI, and the digital filtering methods for base-flow, the variance and extreme-ratio of DF4 in the digital filtering methods were slight. The correlation between DF4 and other base-flow segmentation methods was the highest. The DF4 results were consistent with the stable characteristics of base-flow; thus, it was the most stable and appropriate method in the Huangfuchuan Basin.
2) The runoff and base-flow presented a decreasing trend. We used MK trend test to analyze the movement of base-flow, which showed a decreasing trend, and the annual base-flow was 1,057.84 × 104 m3.
3) The Pettitt abrupt change point and the Hurst index were used to analyze the catastrophe point and future change trend of base-flow. The abrupt change point occurred in 1986. The trend of future development was positively correlated with the past change, showing a trend of continuous decrease.
4) According to the results of wavelet analysis, the base-flow showed a periodic change of 3–6, 7–18, 19–32 scales. Base-flow showed a period change centered on 31 years, corresponding to the first front value of wavelet square.
The original contributions presented in the study are included in the article/supplementary materials, further inquiries can be directed to the corresponding author.
Conceptualization—YH and XM; methodology—YH, YZ, LJ, and YL; Writing—original draft preparation, YZ; Writing—review and editing, YH and XM. All authors have read and agreed to the published version of the manuscript.
This research was jointly supported by the National Natural Science Foundation of China (42077075, 41671285, U2243211), the China Postdoctoral Science Foundation (Grant No. 2018M633602), Postdoctoral Research Fund of Shaanxi Province (Grant No. 2017BSHEDZZ144), and the Natural Science Basic Research Plan in Shaanxi Province of China (Grant No. 2021JQ-449).
We would like to thank the reviewers and editors for their valuable comments and suggestions.
The authors declare that the research was conducted in the absence of any commercial or financial relationships that could be construed as a potential conflict of interest.
All claims expressed in this article are solely those of the authors and do not necessarily represent those of their affiliated organizations, or those of the publisher, the editors and the reviewers. Any product that may be evaluated in this article, or claim that may be made by its manufacturer, is not guaranteed or endorsed by the publisher.
Arnold, J. G., Allen, P. M., Muttiah, R. S., and Bernhardt, G. (1995). Automated base flow separation and recession analysis techniques. Ground Water 33, 1010–1018. doi:10.1111/j.1745-6584.1995.tb00046.x
Bashir, B., Cao, C., Naeem, S., Joharestani, M., Mumtaz, F., Afzal, H., et al. (2020). Spatio-temporal vegetation dynamic and persistence under climatic and anthropogenic factors. Remote Sens. 12, 2612. doi:10.3390/rs12162612
Bastin, L., Gorelick, N., Saura, S., Bertzky, B., Dubois, G., Fortin, M. J., et al. (2019). Inland surface waters in protected areas globally: Current coverage and 30-year trends. PLoS One 1, e0210496. doi:10.1371/journal.Pone.0210496
Boughton, W. C. (1993). A hydrograph-based model for estimating the water yield of ungauged catchments. Australia: Hydrology and Water Resources Symposium.
Brutsaert, W., and Nieber, J. L. (1977). Regionalized drought flow hydrographs from a mature glaciated plateau. Water Resour. Res. 13, 637–643. doi:10.1029/WR013i003p00637
Burn, D. H., and Elnur, M. (2002). Detection of hydrologic trends and variability. J. Hydrology 255, 107–122. doi:10.1016/S0022-1694(01)00514-5
Chang, M. Q. (2009). The securing of water resource issue and its nature. China Saf. Sci. Journal(CSSJ) 19, 1003–3033. doi:10.16265/j.cnki.issn1003-3033.2009.09.027
Chapman, T. (1999). A comparison of algorithms for stream flow recession and baseflow separation. Hydrol. Process 13, 701–714. doi:10.1002/(SICI)1099-1085(19990415)13:5<701::AID-HYP774>3.0.CO;2-2
Chapman, T. G. (1991). Comment on “evaluation of automated techniques for base flow and recession analyses” by R. J. Nathan and T. A. McMahon. Water Resour. Res. 27, 1783–1784. doi:10.1029/91WR01007
Chen, L. Q., Liu, C. M., and Li, F. D. (2006). Review of base-flow research. Prog. Geogr. 25, 1–15. doi:10.1007/s00198-012-2119-2
Chen, Z. P., and Xu, Q. (2016). Analysis of precipitation characteristics in Jinhua by Mann-Kendall test method. Bull. Sci. Technol. 32, 47–50. doi:10.13774/j.cnki.kjtb.2016.06.012
Eckhardt, K. (2008). A comparison of baseflow indices, which were calculated with seven different baseflow separation methods. J. Hydrology 352, 168–173. doi:10.1016/j.jhydrol.2008.01.005
Eckhardt, K. (2005). How to construct recursive digital filters for baseflow separation. Hydrol. Process. 19, 507–515. doi:10.1002/hyp.5675
Eckhardt, K. (2012). Technical note: Analytical sensitivity analysis of a two parameter recursive digital baseflow separation filter. Hydrol. Earth Syst. Sci. 16, 451–455. doi:10.5194/hess-16-451-2012
Guo, J. T., Zhang, Z. Q., Wang, S. P., Zhang, J. J., and Peter, S. (2011). Features of baseflow and its influencing factors for small watersheds in Loess Hilly and Gully region. Bull. Soil andWater Conservation 31 (1), 87–92. doi:10.13961/j.cnki.stbctb.2011.01.024
Hu, Y. N., Duan, W. L., Chen, Y. N., Zou, S., Kayumba, P. M., and Sahu, N. (2021). An integrated assessment of runoff dynamics in the Amu Darya River Basin: Confronting climate change and multiple human activities, 1960–2017. J. Hydrology 603, 126905. doi:10.1016/j.jhydrol.2021.126905
Hu, Z. D., Xia, T., Luo, L., and Wang, Z. (2018). Impact from climate change on amount of river runoff - a case of Huangfuchuan Watershed. Water Resour. Hydropower Eng. 49, 30–36. doi:10.13928/j.cnki.wrahe.2018.02.005
Janke, B. D., Finlay, J. C., Hobbie, S. E., Baker, L. A., Wilson, B. N., Nidzgorski, D., et al. (2014). Contrasting influences of stormflow and baseflow pathways on nitrogen and phosphorus export from an urban watershed. Biogeochemistry 121, 209–228. doi:10.1007/s10533-013-9926-1
Jin, S. Y., Lin, C. Y., Zhang, Z., and Chen, Y. (2013). Effect of underlying surface change on“July 21”Flood in Huangfuchuan Basin. Yellow River 35 (04), 19–21. doi:10.3969/j.issn.1000-1379.2013.04.008
Lei, Y., Jiang, X., Geng, W., Zhang, J. Y., Zhao, H., Ren, L. Q., et al. (2021). The variation characteristics and influencing factors of base flow of the Hexi Inland Rivers. Atmosphere 12, 356. doi:10.3390/ATMOS12030356
Li, C. Q., Guo, S. L., Zhang, J., and Lin, K. R. (2009). A modified TOPMODEL based on horton infiltration capacity curve. J. China Hydrology 29, 4–7. doi:10.1042/BSR20080061
Li, M., Zhang, H. L., and Meng, C. C. (2019). Study on characteristics of water-sediment relationship and key influencing factors in Huangfuchuan Watershed of Yellow River. Adv. Sci. Technol. Water Resour. 39, 27–35. CNKI:SUN:SLSD.0.2019-05-006.
Li, Q., Wei, X. H., Zhang, M. F., and Liu, W. F. (2018). The cumulative effects of forest disturbance and climate variability on streamflow components in a large forest-dominated watershed. J. Hydrology 557, 448–459. doi:10.1016/j.jhydrol.2017.12.056
Liao, Z. M., Li, Y. Y., Xiong, W. S., Wang, X., Dan, L., and Zhang, Y. L. (2020). An in-depth assessment of water resource responses to regional development policies using hydrological variation analysis and system dynamics modeling. Sustainability 12, 1–18. doi:10.3390/su12145814
Lin, Q. C., and Li, H. E. (2010). Influence and guarantee on ecological basic flow of Weihe River from Baojixia water diversion. J. Arid Land Resour. Environ. 24, 114–119. doi:10.1631/jzus.A1000244
Liu, B. J., Lei, X. H., Liu, Z. S., Quan, J., and Wang, H. (2016). Respective characteristics and mutual response relationship of precipitation and base-flow in Huangfuchuan Basin. Yellow River 38 (4), 7–12. doi:10.3969/j.issn.1000-1379.2016.04.002
Liu, B. L., Li, P., Yang, Y. Y., Ren, Z. P., and Long, S. B. (2021). Response of variation of runoff and sediment to landscape pattern in Huangfuchuan Basin. Res. Soil Water Conservation 28, 102–107. doi:10.13869/j.cnki.rswc.2021.05.012
Lv, X. L., Ji, S. B., and Chou, Y. Q. (2021). Analysis of characteristics of base flow of Fen River upstream and its influencing factor. Water Conserv. 11, 1–12. doi:10.3880/j.issn.1004-6933.2022.02.020
Lyne, V. D., and Hollick, M. (1979). “Stochastic time-variable rainfall-runoff modeling,” Institute of Engineers Australia National Conference, 89–93.
Mazvimavi, D., Meijerink, M. J., and Stein, A. (2004). Prediction of base flows from basin characteristics: a case study from Zimbabwe/prévision de débits de base à partir de caractéristiques du bassin: une étude de cas au Zimbabwe. Hydrological Sci. J. 49, 703–715. doi:10.1623/hysj.49.4.703.54428
Partington, D., Brunner, P., Simmons, C. T., Werner, A. D., Therrien, R., and Maier, H. R. (2012). Evaluation of outputs from automated baseflow separation methods against simulated baseflow from a physically based, surface water-groundwater flow model. J. Hydrology 458, 28–39. doi:10.1016/j.jhydrol.2012.06.029
Pettitt, A. N. (1979). A non-parametric approach to the change-point problem. Appl. Stat. 28, 126. doi:10.2307/2346729
Pettyjonh, W. A., and Henning, R. J. (1979). Preliminiary estimate of ground-water recharge rates, related stream-flower and water quality in Ohio. Columbus, Ohio, United States: Ohio State University Water Resources Center Project Completion Report.
Rutledge, A. T. (1993). Computer programs for describing the recession of ground-water discharge and for estimating mean ground-water recharge and discharge from streamflow records. United States: US Geological Survey Water-Resources Investigations Report.
Santhi, C., Allen, P. M., Muttiah, R. S., Arnold, J. G., and Tuppad, P. (2008). Regional estimation of base flow for the conterminous United States by hydrologic landscape regions. J. Hydrology 351, 139–153. doi:10.1016/j.jhydrol.2007.12.018
Shao, G. W., Guan, Y. Q., Guan, Z. Q., Sha, Z. G., and Zhang, D. R. (2014). Analysis of variation trend of runoff and driving factors in Huangfuchuan. J. Water Resour. Water Eng. 25, 54–56. doi:10.11705/j.issn.1672-643X.2014.03.11
Sloto, R. A., and Crouse, M. Y. (1996). HYSEP: a computer program for streamflow hydrograph separation and analysis. United States: US Geological Survey Water-Resources Investigations Report.
Sui, J., He, Y., and Karney, B. W. (2008). Flow and high sediment yield from the Huangfuchuan watershed. Int. J. Environ. Sci. Technol. (Tehran). 5, 149–160. doi:10.1007/BF03326008
Tallaksen, L. M. (1995). A review of baseflow recession analysis. J. Hydrology 165, 349–370. doi:10.1016/0022-1694(94)02540-R
Veldkamp, T., Wada, Y., Aerts, J., Doll, P., Gosling, S. N., Liu, J., et al. (2017). Water scarcity hotspots travel downstream due to human interventions in the 20th and 21st century. Nat. Commun. 8, 15697. doi:10.1038/ncomms15697
Wang, G., Lu, C. P., Li, S. L., Chen, S., and Li, J. J. (2015). Applied comparision of five separation methods of base flow at Luoshan station of Yangtze River. J. Water Resour. Water Eng. 26, 118–123. doi:10.11705/j.issn.1672-643X.2015.03.25
Wei, Y. H., and Jiao, J. Y. (2017). Variation tendency and periodic characteristics of streamflow and sediment discharge in Huangfuchuan Watershed from 1955 to 2013. Res. Soil Water Conservation 24, 1–6. doi:10.13869/j.cnki.rswc.2017.03.001
Wels, C., Cornett, R. J., and Lazerte, B. D. (1991). Hydrograph separation: A comparison of geochemical and isotopic tracers. J. Hydrology 122, 253–274. doi:10.1016/0022-1694(91)90181-G
Wittenberg, H., and Sivapalan, M. (1999). Watershed groundwater balance estimation using streamflow recession analysis and baseflow separation. J. hydrology 219, 20–33. doi:10.1016/s0022-1694(99)00040-2
Xu, R. H., Wang, X. G., and Zheng, W. (2016). Research progresses in Baseflow separation methods. Bull. Soil Water Conservation 36, 352–359. doi:10.13961/j.cnki.stbctb.2016.05.061
Yang, G., Hao, F. H., and Liu, C. (2003). The study on Baseflow estimation and evaluation based on SWAT-Luohe River Basin as Example. Prog. Geogr. 22, 463–471. doi:10.1002/ppap.201400126
Yi, L. Q., and Zhou, R. (2017). An analysis of the various characteristics and influencing factors of the settlement in the view of new district construction of city in recent 10 years. J. Inn. Mong. Normal Univ. 46, 140–145. CNKI:SUN:NMGS.0.2017-01-029.
Yu, F., Li, X. B., and Wang, H. (2014). Optimization of land use pattern based on eco-security: a case study in the huangfuchuan watershed. Acta eco. Sin. 34 (12), 3198–3210. doi:10.5846/stxb201307011807
Zhang, X. S., Srinivasan, R., Arnold, J., Lzaurralde, C. R., and Bosch, D. (2011). Simultaneous calibration of surface flow and baseflow simulations: a revisit of the SWAT model calibration framework. Hydrol. Process. 25, 2313–2320. doi:10.1002/hyp.8058
Zhao, G. J., Mu, X. M., Wen, Z. M., Wang, F., and Gao, P. (2013). Impacts of precipitation and human activities on streamflow and sediment load in the Huangfuchuan Watershed. Sci. Soil Water Conservation 11 (04), 1–8. doi:10.16843/j.sswc.2013.04.001
Keywords: base-flow, the Huangfuchuan basin, base-flow segmentation, wavelet analysis, Mann-Kendall test
Citation: Zhang Y, He Y, Mu X, Jia L and Li Y (2022) Base-flow segmentation and character analysis of the Huangfuchuan Basin in the middle reaches of the Yellow River, China. Front. Environ. Sci. 10:831122. doi: 10.3389/fenvs.2022.831122
Received: 08 December 2021; Accepted: 11 July 2022;
Published: 16 August 2022.
Edited by:
Chuanfu Zang, South China Normal University, ChinaReviewed by:
Weili Duan, Xinjiang Institute of Ecology and Geography (CAS), ChinaCopyright © 2022 Zhang, He, Mu, Jia and Li. This is an open-access article distributed under the terms of the Creative Commons Attribution License (CC BY). The use, distribution or reproduction in other forums is permitted, provided the original author(s) and the copyright owner(s) are credited and that the original publication in this journal is cited, in accordance with accepted academic practice. No use, distribution or reproduction is permitted which does not comply with these terms.
*Correspondence: Yi He, eWloZUBud3UuZWR1LmNu; Xingmin Mu, OTYzOTE2MzM3QHFxLmNvbQ==
Disclaimer: All claims expressed in this article are solely those of the authors and do not necessarily represent those of their affiliated organizations, or those of the publisher, the editors and the reviewers. Any product that may be evaluated in this article or claim that may be made by its manufacturer is not guaranteed or endorsed by the publisher.
Research integrity at Frontiers
Learn more about the work of our research integrity team to safeguard the quality of each article we publish.