 Jiazhi Fan
 Qinzhe Han
 Shiqi Tan
 Ji Li1
95% of researchers rate our articles as excellent or good
Learn more about the work of our research integrity team to safeguard the quality of each article we publish.
Find out more
ORIGINAL RESEARCH article
Front. Environ. Sci. , 11 February 2022
Sec. Environmental Informatics and Remote Sensing
Volume 10 - 2022 | https://doi.org/10.3389/fenvs.2022.829046
This article is part of the Research Topic Earth Observation Applications in Agrometeorology and Agroclimatology View all 5 articles
Long-term near-surface soil moisture (SM) data can be obtained on a regional scale through microwave remote sensing. Therefore, to quantitatively analyze the accuracy of multisource remote sensing–based observation products, improve the retrieval algorithm, and effectively use in terminal environments, a standardized comprehensive evaluation is imperative. The SM data obtained by the China Meteorological Administration and Ministry of Water Resources were used as reference data to verify the performance of six passive microwave remote sensing–based SM products from the SMOS, SMAP, GCOM-W, FY-3B, and FY-3C satellites in Hunan province, China. These data were also used to analyze the effects of topographical, land cover, and meteorological factors on SM retrieval accuracy. Results show that SMAP shows the best overall performance in Hunan province; furthermore, it exhibits stable accuracy and is not easily affected by environmental factors. The FY series of satellite products shows the worst performance, and some grid remote sensing data are negatively correlated with the ground measurement data. AMSR2 possesses the largest amount of data and the largest deviation, and only this product exhibits significant differences with the fluctuation trend of the measured SM and precipitation. Passive microwave detection technology presents the best performance in the central part of Hunan province and the largest bias in the Dongting Lake area. SMOS-L3 and SMOS-IC, two products of the same satellite, show the lowest bias but present differences in the SM fluctuation range, orbital accuracy, as well as dry or wet bias. Furthermore, FY-3B and FY-3C, two satellites belonging to the same series, exhibit excellent consistency in performance. The evaluation results and accuracy variation between products as well as other factors identified in the study provide a baseline reference for improving the retrieval algorithm. This study provides a quantitative basis for developing improved applications of passive microwave SM products.
Soil moisture (SM) is a critical variable that links the atmospheric system and terrestrial ecosystem and is an important parameter of climate change. Therefore, the accurate observation of SM is crucial for drought and flood monitoring, climate model forecasting, and agricultural production (Chawla et al., 2020; Karthikeyan et al., 2020; Wu et al., 2021).
SM parameters are mainly obtained through automated ground observations and remote sensing. The ground observation data are authentic and accurate but limited owing to the number of stations and the representativeness of single-point observations. Therefore, they cannot meet the demand of SM data acquisition in a wide spatial range. Alternatively, satellite data in the microwave wavelength region show excellent potential for SM estimation because of their penetration capability (Koley and Jeganathan, 2020). Therefore, they are conventionally used in SM detection because their detection capability is unaffected by weather conditions and they can provide all-weather global observation data with long time series.
The remote sensing–based SM detection technology has been developed for many years. Since 1978, when the Scanning Multichannel Microwave Radiometer, carried by Nimbus-8, began providing SM products, sensors and retrieval methods have been constantly updated. The spatiotemporal resolution and accuracy of the products have been continuously improved (Qin et al., 2021). The current mainstream microwave remote sensing–based SM products are obtained from multiple satellites with different retrieval algorithms, and their quality and continuity vary spatiotemporally (Dorigo et al., 2010). Thus, for satellite-based SM products, authenticity verification is an important task.
The authenticity test of remote sensing–based products is essential for their effective use in data modeling, data assimilation, and terminal environments. To test and evaluate remote sensing–based SM products, studies have employed in situ SM measurements (Bindlish et al., 2017; Zhu et al., 2019; Beck et al., 2021), assimilation data (Gruber et al., 2017), remote sensing indices (Tian et al., 2019), and precipitation data (Karthikeyan and Kumar, 2016) as well as performed comparisons between satellite missions (Chen et al., 2018). The performance of different SM products varied significantly, and different validation data and research methods would induce errors in evaluation results (Gruber et al., 2020). Measurement data are the most fundamental and accurate reflection parameters of the surface SM. Therefore, validation research based on measurement data can provide the most reliable results for satellite product evaluations. However, owing to the high cost associated with ground observations, obtaining high-quality, high-density, long-term SM measurement data at regional-scale stations is difficult, which also limits the development of related research.
Verification studies, application of new theories, and improved parameterization methods have enhanced remote sensing–based retrieval algorithms for SM quantification (Wigneron et al., 2017). Together with the constant updating of remote sensing–based SM products, these advances necessitate the revalidation of the products. For example, the SM products obtained from the SMAP satellite, updated in mid-October 2021, have not been comprehensively evaluated at the regional scale. The present study is based on the in situ surface SM measurement data obtained by the China Meteorological Administration (CMA) and Ministry of Water Resources (MWR). The quality and consistency of the time-series data were analyzed to verify the reliability of the measured SM products, and an authenticity test was conducted on products SMOS-L3, SMOS-IC, SMAP, AMSR2, FY-3B, and FY-3C in Hunan province, Central China. Combined with environmental factors, the effects of topographical, land cover, and meteorological factors on the performance of microwave remote sensing–based SM products were comprehensively evaluated. The findings of this study can provide support for improving the retrieval algorithm of each product, technical support for the application of remote sensing–based SM products in Hunan province, and a decision-making basis for governmental departments for disaster prevention and mitigation.
Hunan province is located in south–central China between 24°38′–30°08′N and 108°47′–114°15′E, covering an area of 211,800 km2 Figure 1. This province is located in the transition zone from the Yunnan–Guizhou Plateau to Jiangnan Hills and Nanling Mountains to the Jianghan Plain. The highest and lowest elevations of the province are observed in the south and north regions, respectively, and the province is surrounded by mountains on three sides. The geographical position of this province is unique (Liao et al., 2014). The province has a humid continental subtropical monsoon climate and is favored with light, heat, and water resources; however, the annual variation of these natural resources is significant and the vertical variation is evident.
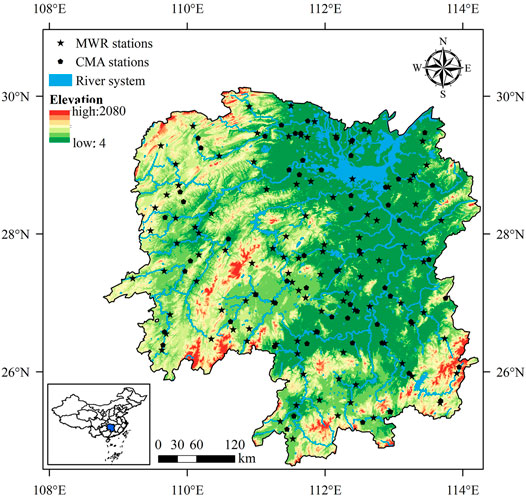
FIGURE 1. Distribution map of topographical, drainage, and automated soil moisture observation stations in Hunan province.
The six remote sensing–based daily-data products used herein cover all the recent mainstream passive microwave remote sensing–based SM products from the SMOS, SMAP, GCOM-W, FY-3B, and FY-3C satellites, as detailed below (Table 1).
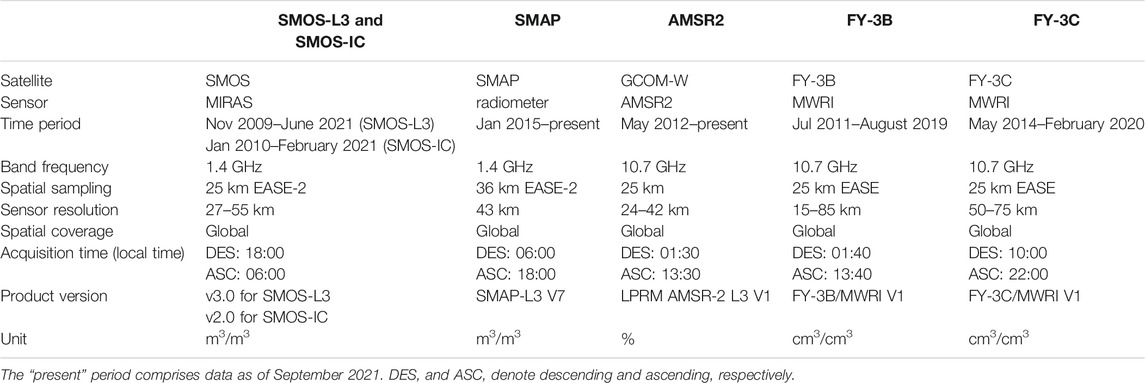
TABLE 1. Overview of remote sensing–based soil moisture products.
1. SMOS is the world’s first satellite mission to measure the SM content on land surface, and its SM products are widely used (Xiang et al., 2017). The satellite performs observations using an L-band (1.4 GHz) microwave imaging radiometer (MIRAS). The spatial resolution and induction depth of the SMOS products are 27–55 km and 3–5 cm, respectively. The SMOS-L3-SM product comprises gridded SM data obtained after the spatiotemporal recombination of L2 SM data, provided by Barcelona Expert Center (version 3.0) and downloaded from http://bec.icm.csic.es. The data include daily data from January 2015 to May 2021. The SMOS-IC product is based on the two-parameter inversion of the L-MEB model (Wigneron et al., 2007), where pixels are considered homogeneous. This product is provided by the Centre Aval de Traitement des Données SMOS (version 2.0) and downloaded from www.catds.fr/. It comprises daily data from January 2015 to February 2021. Both the SMOS-based SM products show a spatial resolution of 25 km and are projected using the Equal-Area Scalable Earth Grids 2.0 (EASE-Grid 2.0), with data stored in the netCDF format.
2. SMAP is the latest satellite dedicated to SM detection. Its L-band SM products are widely used in climatic and environmental monitoring. The passive remote sensing–based L3 product has a spatial resolution of 36 km, and the product is projected using EASE-Grid 2.0. The data version is 7.0, and the source is https://nsidc.org/. The daily data are obtained for the period January 2015–September 2021, with data in the HDF format.
3. AMSR-E/2 SM retrieval products are widely used in various fields. The AMSR-2 L3 X-band (10.7 GHz) SM product obtained from the land parameter retrieval model (LPRM) can avoid radio-frequency interference (RFI). The product has a spatial resolution of 25 km, the data version is 001, and the source is https://disc.gsfc.nasa.gov. The data are obtained from August 2015 to September 2021, with data in the netCDF format.
4. FY-3B and FY-3C are the second-generation polar-orbiting meteorological satellites independently developed by China. The observation products are widely used in weather forecasting, climate change monitoring, and applications that support agriculture, transportation, shipping, and other fields. SM data are observed using dual-polarized X-band (10.7 GHz) detectors. The National Satellite Meteorological Center of China provides the MWRI daily SM products of FY-3B and FY-3C. The spatial resolution of the products is 25 km, and the products are projected using EASE-Grid. The data version is 1.0.0, and the source is http://satellite.nsmc.org.cn/. The FY-3B and FY-3C data periods are August 2015–August 2019 and August 2015–February 2020, respectively. The data are in the HDF format.
The automated SM observation instrument DZN3 produced by China Huayun Group is used in the automated SM observation station of CMA in Hunan province. The instrument uses the frequency-domain reflectance measurement technique for determining the volumetric water content of the SM in the soil depth range of 10–100 cm. The resolution and accuracy of the instrument are 0.1% and ±2.5%, respectively. There are 60 operational observation stations in Hunan province that provide hourly SM observation data of multiple soil layers from September 2015 to the present. The time parameter of the original data is universal time. The product is released on the China Integrated Meteorological Information Sharing System after data quality control by the meteorological department. Consequently, the data quality is high, the missing data measurement rate is ∼3%, and the overall outlier ratio is <1%.
The automated SM observation instrument HT-SMAA-V produced by Beijing Huitu Technology is used in the automated SM observation station of MWR in Hunan province. The instrument uses the frequency-domain reflectance measurement technique for determining the volumetric water content of SM in soil layers of 10, 20, and 40 cm with an accuracy of up to ± 2%. Because of the difference in the construction time of each observation site, the observation period of each site is different, and this dataset are obtained every 8 h since August 2017 when the first site was established. The time parameter of the original data is Beijing time, the overall missing data measurement rate is ∼17%, and the overall outlier ratio is <1%.
The topographic factors used in this study are the mean and range of elevations within the grids for each product, calculated using a 30Automated SM observationm resolution elevation dataset from NASA’s Advanced Spaceborne Thermal Emission and Reflection Radiometer Global Digital Elevation Model Version 3 (https://doi.org/10.5067/ASTER/AST14DEM.003). The land cover factors are the modal numbers and information entropy within the grids for each product, calculated using the Multi-Period Land Use Land Cover Remote Sensing Monitoring Dataset (CNLUCC) for 2018 with a spatial resolution of 1 km, downloaded from the Institute of Geographic Sciences and Natural Resources Research, Chinese Academy of Sciences (https://www.resdc.cn/data.aspx?DATAID = 264). The information entropy can reflect surface heterogeneity as a measure of the system uncertainty (Song et al., 2019; Russo et al., 2021). The probability distribution of a random variable X with n possible outcomes is P (X = 11) = pi for i = 1, 2, … , n. The information entropy H(X) is calculated as
The meteorological factors are the mean daily temperature and precipitation observed by the national observation stations of CMA for September 2017–September 2021 within the observation grid for all remote sensing–based products.
The SM data of MWR and CMA are collected and sorted from the date of establishment of the station to September 2021. The CMA data comprise hourly experimental parameters, and the MWR data comprise data observed every 8 h. The penetration depth of the microwave L-band products (SMOS-L3, SMOS-IC, and SMAP) is ∼5 cm, while that of the X-band products (AMSR2, FY-3B, and FY-3C) is < 5 cm (Nolan and Fatland, 2003). Therefore, the SM measurement data obtained at the shallowest depth of 10 cm are used as the in situ data for data matching and analysis. Outliers are parameters exceeding the range of [0, 1] cm3/cm3 or values surpassing the average value plus or minus three standard deviations for the site. The CMA missing data measurement rate is small, and predictive mean matching (PMM) is used to interpolate the missing values. PMM is a variant of linear regression (Little, 1988) and is used to estimate the missing values by extracting samples (usually multiple candidate samples) from the observed values, which are close to the missing data. As a method widely used for interpolating the missing values, PMM is easy to use and robust (Allison, 2015).
Hunan province is located in the subtropical climate zone, and the soil typically does not freeze in winter. Hence, there is not necessary to remove the data for frozen soil. Among them, some SM parameters in the SMOS-IC data products with outliers exceeding the range of [0, 1] cm3/cm3 are excluded. The unit of data of each product is converted to the volumetric water content (cm3/cm3), and the time parameters of the remote sensing–based products are universal time. The daily observations of the remote sensing–based products are single ascending and descending orbit observations, and different instantaneous observation times exist for each observation grid. To improve the research stringency, each remote sensing–based product is matched with the in situ hourly CMA data and 8 h MWR data using the temporal nearest neighbor matching, and forming two matched datasets for CMA data and MWR data, respectively.
To decrease the representativeness problem caused by the difference in the observation scale, the matching of ground and remote sensing–based SM data was based on the observation grid of each remote sensing–based product for multisite matching. Assume that there are two or more ground observation stations in the remote sensing grid and the data obtained from the daily in situ observations are abundant. In this case, the average value from multiple stations in the matching dataset is used as the in situ measurement value of the grid. Furthermore, the mean value of the ascending and descending orbits of remote sensing–based products (missing measurement value is ignored) is used as the remote sensing detection value, forming the comparison dataset for each product. Based on this, the authenticity of remote sensing–based SM products in Hunan province was verified and a comprehensive evaluation was performed using environmental factors.
The performance of different remote sensing–based SM products in Hunan province was evaluated using error parameters. Five statistical measures widely used for SM products were used to assess the performance of each product. 1) The Pearson correlation coefficient (r in Eq. 1) and 2) coefficient of determination (R2 in Eq. 2) were used to assess the ability of remote sensing inversion methods to capture changes in the surface SM. 3) The bias (Eq. 3) was used to measure the degree of SM, which is dry or wet compared with the in situ measurement. 4) The root mean square error (RMSE; Eq. 4) was used to measure the deviation between remote sensing and measurement data. 5) The unbiased RMSE (ubRMSE; Eq. 5) removes the effect of random errors on the RMSE for improved measurements of the absolute deviation. The five indicators are calculated using the following equations:
where RSSM is the SM of each remote sensing–based product, OBSM is the SM measured by CMA and MWR, cov () is the covariance, and σ is the standard deviation.
In the aforementioned error coefficients, when the r and R2 are large and the bias, RMSE, and ubRMSE are small, the performance of the product is enhanced.
The multisource SM detection data in this study are obtained via satellite remote sensing and in situ measurements. Among them, remote sensing measurements are obtained using various microwave sensors (Table 1) and the in situ measurement data are obtained from the ground observation stations by CMA and MWR. The CMA SM data are mainly used for agrometeorological operations, while the MWR observation data are mainly used for hydrological monitoring. Therefore, the location of observation stations, performance of sensors, instrument verification method, frequency, and data quality control process are different from each other. Moreover, no study has conducted a comparative test on the data of CMA and MWR. Therefore, the following measures must be taken: 1) time-series-based comparative analysis of multisource SM observation data must be performed to verify data quality and consistency; 2) the stringency of combining the measurement data obtained from CMA and MWR as standard data must be determined; and 3) the accuracy of microwave remote sensing technology in capturing changes in the surface SM must be analyzed.
The nearest CMA and MWR stations (∼1.3 km away from each other) in Hunan province are located in Yizhang County, Chenzhou city, southern Hunan province. The SM time-series data of SMOS-L3, SMOS-IC, SMAP, AMSR2, FY-3B, FY-3C, and in situ measurements and daily precipitation at the grid of the two in situ stations are shown as time-series data diagram in Figure 2, the SM parameters of remote sensing and measurement data are averaged in daily data.
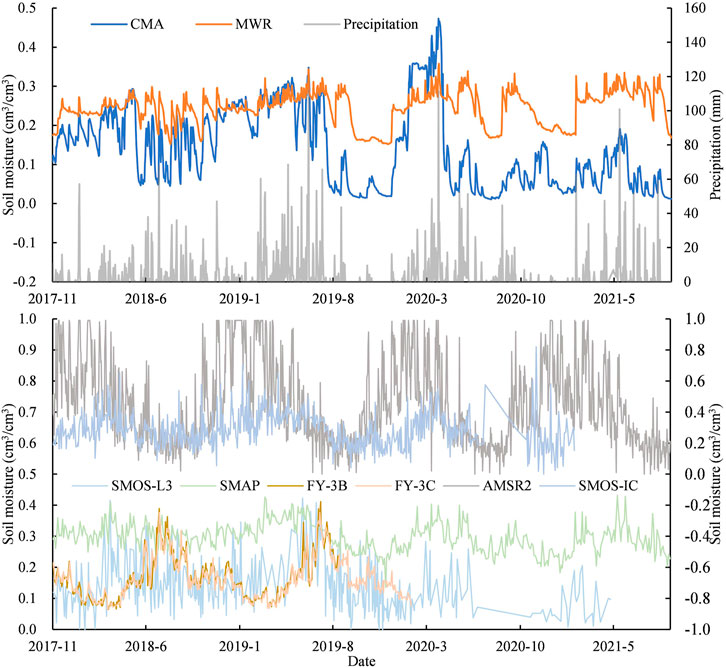
FIGURE 2. Time-series data of soil moisture based on in situ measurement data, remote sensing–based products, and daily precipitation at the Yizhang station. In situ measurement, SMOS-L3, SMAP, FY-3B, and FY-3C data correspond to the main axis (left). Daily precipitation, AMSR2, and SMOS-IC data correspond to the secondary axis (right).
The results show that the SM measurement data of CMA and MWR are consistent in the long time series, and both can respond to the trend of precipitation fluctuation. In most cases, the MWR parameter values are higher than the CMA parameter values, which may be related to the proximity of the site to the water system. However, the variation trend of the two datasets is consistent and the peak and valley fluctuations overlap. Precipitation is the most critical factor affecting the SM, and its peak and valley variations are highly compatible with the fluctuation trends of the SM at the CMA and MWR stations. Therefore, although the sources of the two sets of measurement data are different, both show high quality and can be used as benchmarks for the effective assessment of remote sensing–based products.
The lower part of Figure 2 present the time-series data diagram of the six remote sensing–based SM products in the grid where the ground site is located, in which the data of SMOS-L3, SMAP, FY-3B, and FY-3C fluctuate within the range of [0, 0.5] cm3/cm3, consistent with the measurement data. Alternatively, the data of AMSR2 and SMOS-IC fluctuate widely. Except for AMSR2, the data of the other remote sensing products can fluctuate with the peak precipitation value, consistent with the SM fluctuation data. Because the data of AMSR2 fluctuate randomly, although the time resolution is high, the data consistency is poor and the parameter values are very unstable. The SMAP product exhibits the smallest SM fluctuation range; however, it can still respond to the peak and valley fluctuations of precipitation. Therefore, the consistency of FY-3B and FY-3C product data is excellent and the changing trend of the two datasets can match that of the measurement SM and precipitation data. However, there is an inevitable delay in time.
Table 2 shows the overall error coefficients between satellite products and in situ measurement SM data in Hunan province. As stated previously, the error coefficient was calculated based on the comparison dataset of each product from August 2017 to September 2021 (the comparison period of FY-3B and FY-3C is short).
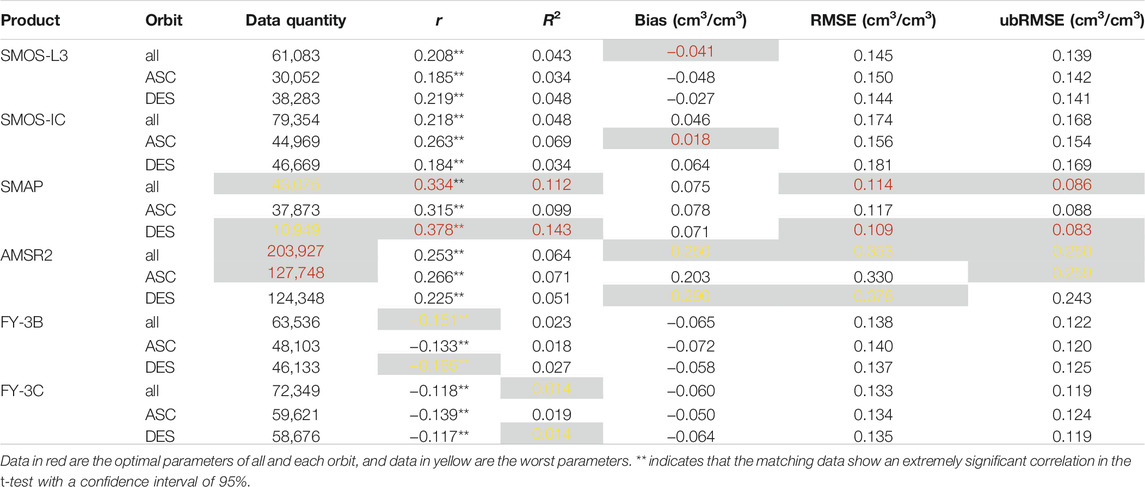
TABLE 2. Overall parameters between remote sensing and in situ measurement soil moisture data in Hunan province.
The overall comparison analysis shows that the observation accuracy of the SMAP products in Hunan province is significantly higher than that of the other five products, consistent with relevant studies (Kumar et al., 2018; Al-Yaari et al., 2019; Wu et al., 2020). Among all products, the SMAP products achieve the highest r, R2, RMSE, and ubRMSE parameters for “all” and “DES” orbits (Table 2). The AMSR2 product achieves high observation accuracy with the largest deviation and many outliers. The AMSR2 product achieves the second-best r and R2 values but the worst bias, RMSE, and ubRMSE values. The optimum bias values are achieved by SMOS-L3 and SMOS-IC for “all” and “ASC” orbits, respectively, reflecting the high performance of the SMOS sensor. Note that the FY-series products show the worst r and R2 values. FY-3B and FY-3C achieve negative r values for each orbit and lower R2 values compared with the other remote sensing–based products. These findings are consistent with those reported in the literature (Zhu et al., 2019) for Henan province, Central China.
The biases of each remote sensing-based product with in situ measurements are different. SMOS-L3, FY-3B, and FY-3C tend to underestimate SM (satellite products are dry), while SMOS-IC, SMAP, and AMSR2 tend to overestimate SM (observation products are wet). The data quantity of each remote sensing–based product in the matched dataset is presented in the descending order: AMSR2, SMOS-IC, FY-3C, FY-3B, SMOS-L3, and SMAP. Among them, the data quantity of AMSR2 is considerable higher than those of the other products. All matching data passed the t-test with a confidence interval of 95%, and all p values were <.01, indicating an extremely significant correlation between each remote sensing-based product with in situ measurements.
Based on the error coefficient distribution for each product in Hunan province, the high-r-value area is mainly concentrated in the central region, while the low–r-value area is primarily in the west and south (Figure 3). These results show that microwave remote sensing can capture changes in the surface SM in the central part of Hunan province and most of the evaluation indices showed good performance and were comparable with relevant studies (Mousa and Shu, 2020; Wang et al., 2021b). Therefore, the observation products of microwave remote sensing show high reliability. However, in the SM products of SMOS-L3, FY-3B, and FY-3C, several grids showed negative correlation between remote sensing and ground observation data; this phenomenon has also been observed in a study (Wang et al., 2021a) on the SM of FY-3B and FY-3C in Shandong province. This part of the grid significantly affects the overall accuracy and even yields the overall negative r performance of the two FY satellite products (Table 2). However, grids with a negative correlation almost appear in the western mountainous area of Hunan province, which can be related to the fact that the remote sensing retrieval algorithm cannot appropriately filter the interference of topographic factors. Furthermore, the mountainous area of western Hunan and additional water bodies in northern Hunan are unfavorable for microwave SM detection; however, these conditions deteriorate the performance of all products, including SMAP, which shows good overall performance; hence, the overall r value of all products is low (Table 2).
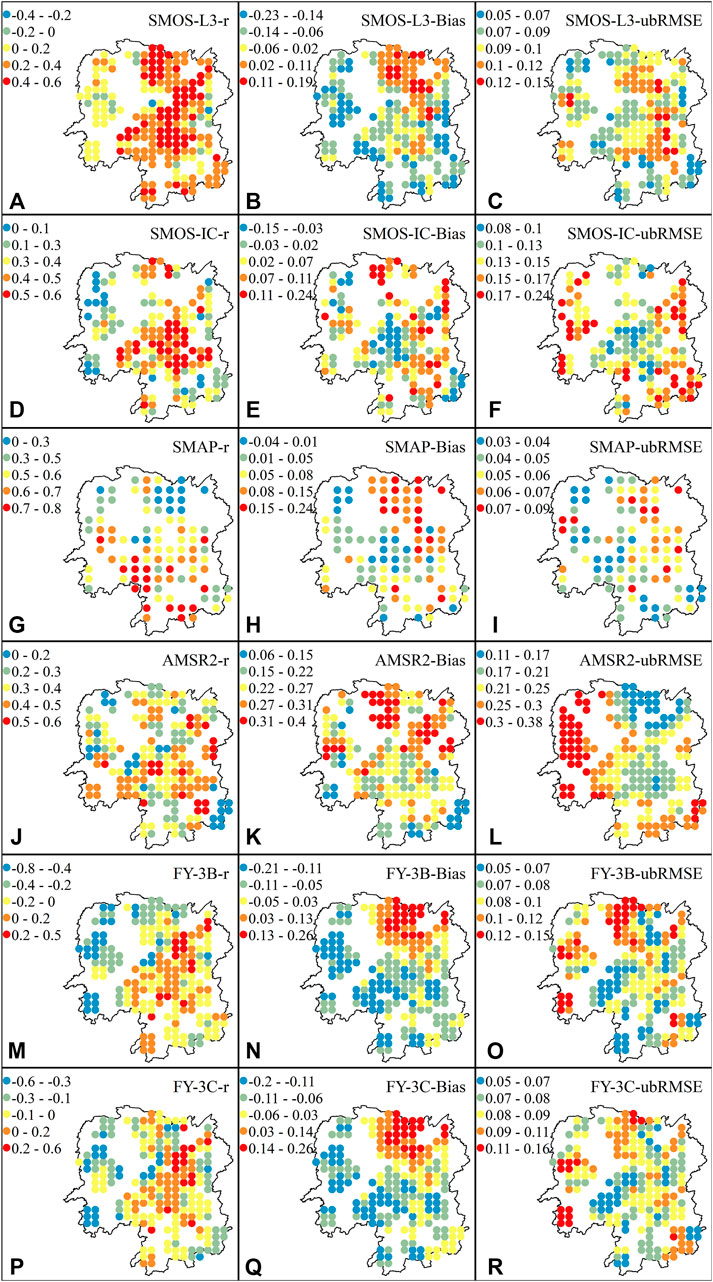
FIGURE 3. Distribution map of error coefficients between remote sensing and in situ measurement data of soil moisture in Hunan province.
The maximum bias value between remote sensing–based products and in situ measurement SM data was observed in the Dongting Lake area in the northeast of Hunan province, indicating that the microwave remote sensing-based SM was extremely wetter with more water in the observation grid. The grid point of the bias value of the SMOS-L3, FY-3B, and FY-3C products at nearly 0 cm3/cm3 mostly appeared in the central region, and a negative bias value (dry) was mostly detected in the western region. The bias values of SMOS-IC and SMAP showed no obvious distribution pattern in the area except the Dongting Lake area. No negative bias grid point of the AMSR2 products was observed in Hunan province, and very few negative bias grid points of the SMAP products were detected.
The ubRMSE values differed between each remote sensing–based product and in situ measurements. Generally, the ubRMSE values were high and low in western and central Hunan, respectively. The absolute deviation of SM detected using microwave remote sensing is proven to increase because of the topography of mountainous areas after removing the random error effect. As the retrieval product of different algorithms of the same satellite, the SMOS-L3 and SMOS-IC products show almost opposite patterns in terms of the ubRMSE value. For SMOS-L3, high ubRMSE values were mainly observed in the central region, while the areas with low ubRMSE values were mainly in the southeast and northwest. For SMOS-IC, the high ubRMSE values were mostly observed in the west, east, and southeast, while the low ubRMSE values were mainly observed in the central region. The high-ubRMSE-value grid of SMAP mostly appeared in the Dongting Lake area, while the high-ubRMSE-value grids of AMSR2, FY-3B, and FY-3C mostly appeared in the west and southeast.
The principle of microwave remote sensing in SM detection is based on the relation between the soil brightness temperature and SM. Moreover, the accuracy of microwave remote sensing is closely related to the detection frequency of sensors (Escorihuela et al., 2010). It is generally accepted that the L band is the best band for SM detection because it is more sensitive to the SM than other bands and more easily penetrates vegetation than high-frequency C and X bands (Jackson et al., 2010). Furthermore, the L band is less susceptible to heavy precipitation, such as rainstorms. In this study, the overall error coefficients of L-band products (SMOS-L3, SMOS-IC, and SMAP) are higher than those of X-band products (AMSR2, FY-3B, and FY-3C), confirming the superiority of the L band in SM detection. The better performance of SMAP than SMOS among the three L-band products may be related to the fact that SMAP is equipped with a real aperture radiometer, whereas SMOS uses a synthetic aperture radiometer. Therefore, SMOS observations will show higher internal noise (Oliva et al., 2012) than SMAP observations. Moreover, SMOS products are more susceptible to RFI, the extent of which is unknown before launch. Alternatively, SMAP provides observation data for a particular location at a fixed incidence angle, likely contributing to the decreased noise in the retrieved data and improving the observation performance, as confirmed in our analysis.
Environmental factors, including topographical, land cover, and meteorological factors, afford different SM performances based on microwave remote sensing (Al-Yaari et al., 2014; Wigneron et al., 2017; Wang et al., 2019). Therefore, a comparative evaluation was performed using the aforementioned factors; the results are presented below.
The analysis of topographic factors is shown in Figure 4. Except for the SM of SMAP, the r value of other remote sensing–based products based on in situ measurements was high when the mean DEM value was low; further, as the mean DEM value increased, the r value tended to decrease. There was no apparent change in the r value between SMAP product and measured SM with the mean DEM value, and the significance test also confirmed this result. The bias values of all remote sensing–based products based on ground observations were large when DEM was small. This indicates that the SM was wetter than the ground observations and tended to be drier with increasing DEM. This phenomenon was more evident in the analysis performed within the DEM range. The average topography and terrain undulations affect the observation bias of the microwave remote sensing–based SM.
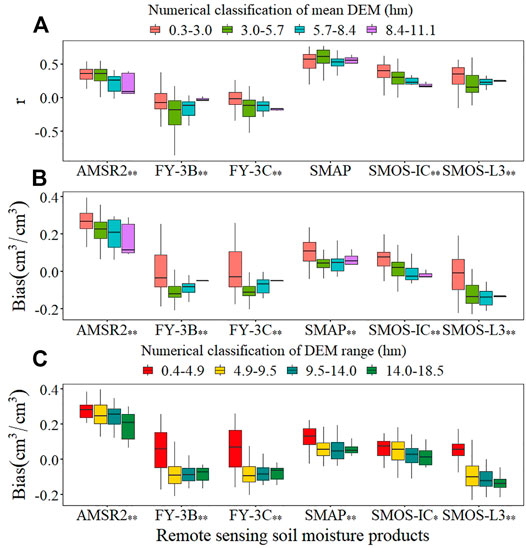
FIGURE 4. Box diagrams of topographic factors and error coefficients of each product. * indicates the significance t-test’s p < .05 and indicates p < .01.
Based on the modal number of types of land cover in each remote sensing–based product grid, the land cover in the comparison dataset can be divided into three types: paddy field, dense forest, and sparse forest. Except for SMAP, the r value between other remote sensing–based products and the ground observation showed the same changing trend with the types of land cover. The paddy field showed the highest r value, followed by the dense forest and then the sparse forest. SMAP achieved the highest and lowest r values in the dense and sparse forests, respectively. The mean r value of the paddy field was medium but fluctuated noticeably (Figure 5). The bias trend between all products and in situ measurements was consistent with the change in the typed of land cover from the paddy field to the dense and sparse forests. The wet SM trend was strongest in paddy fields, while the dense and sparse forests showed moderate (AMSR2, SMAP, and SMOS-IC) and dry (FY-3B, FY-3C, and SMOS-L3) SM trends. The bias values of FY-3B, FY-3C, and SMOS-L3 varied significantly with different types of land cover.
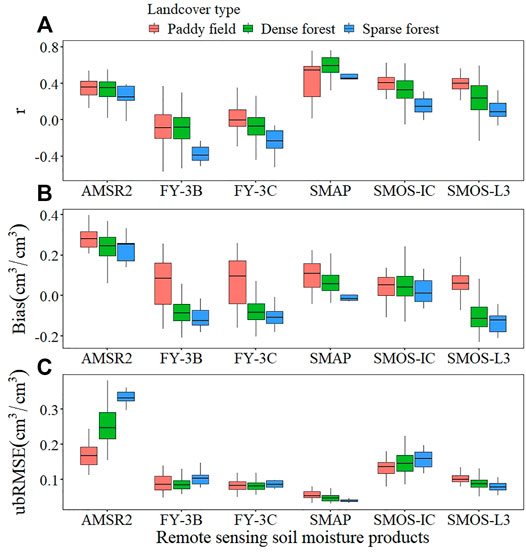
FIGURE 5. Box diagrams of types of land cover with error coefficients of each product.
The information entropy (H), a parameter representing the surface heterogeneity of a grid, shows a certain response relation with the SM observation accuracy based on remote sensing (Figure 6). The r and bias values of the AMSR2 products did not change with an increase in H. However, the ubRMSE value increased with increasing H, indicating that when the surface heterogeneity was high, the absolute deviation of the AMSR2 products was large. The r value of SMAP increased with increasing H, while the bias and ubRMSE values decreased, indicating that when the surface heterogeneity was high, the performance of SM of the SMAP products improved. For FY-3B and FY-3C (same series of the satellite), the performance of SM products was consistent with the H changing trend. The r value increased and then decreased with increasing H, while the bias value decreased with increasing H (from wetter to drier) and the ubRMSE value remained unchanged. Generally, the SM products of the FY series showed the best performance in the case of a moderate surface heterogeneity. Regarding the retrieval products of different algorithms of the same satellite, the SM performance of SMOS-IC and SMOS-L3 showed differences with the H changing trend. The r and bias values of both the SM products decreased with increasing H, and the trend of SMOS-L3 was more pronounced than that of SMOS-IC. The ubRMSE value of SMOS-IC increased with increasing H, opposite to the SMOS-L3 trend. Most of the land cover information entropy and product error coefficients could pass the significance t-test with a confidence interval of 95%.
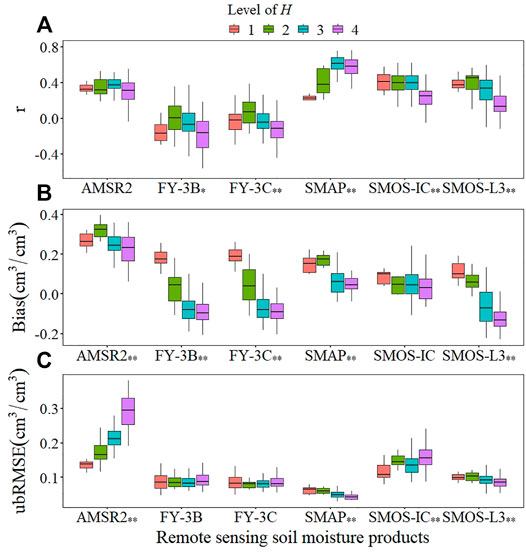
FIGURE 6. Box diagram of land cover information entropy and error coefficient of each product. H denotes the information entropy, * indicates the significance t-test’s p < .05, and ** indicates p < .01.
Owing to the monsoon and complex topography, different regions of Hunan province show significant differences in the climatic conditions. Different meteorological conditions will also affect the SM performance based on microwave remote sensing (Wang et al., 2019). The r value between remote sensing and ground observation data was the smallest in regions where the 3 year average temperatures were 14–17°C. Microwave remote sensing showed the worst ability to capture dynamic changes in the SM. Most of the negative correlation grids of the SM of FY-3B and FY-3C with in situ measurements were observed in this temperature range. With increasing daily precipitation, the ubRMSE value of AMSR2 and SMOS-IC increased with a gradient, that of FY-3B changed slightly, and those of the other three products remained unchanged. This indicates that although precipitation was the most significant cause of the dynamic change in the SM, most satellite retrieval algorithms can adequately handle this factor. No significant correlation was observed between the error coefficients of r values from AMSR2, SMAP, and SMOS-L3 with air temperature and ubRMSE from FY-3C, SMAP, and SMOS-L3 with daily precipitation.
In the analysis of environmental factors, the overall accuracy of SMAP was high and was not easily affected by topographic factors and precipitation, consistent with relevant studies (Ma et al., 2017). Alternatively, the accuracy of AMSR2 products was easily affected by topographic factors, heterogeneity and types of land cover, and precipitation changes. Similar phenomena have also been reported in related studies (Liu et al., 2019; Liu et al., 2021). The changing trend in the performance of FY-3B and FY-3C with each environmental factor was consistent. Most negative correlation grids were observed when the average elevation ranged from 300 to 570 m, land cover was mainly a sparse forest with high heterogeneity, and temperature ranged from 14 to 17°C.
One of the main objectives of the SMOS-IC product was to be as independent as possible from auxiliary data and to be more robust and less affected by potential uncertainties in the aforementioned corrections. Different from SMOS-L3, SMOS-IC did not exclude the strongly RFI-contaminated areas, which can significantly increase the RMSE of the soil brightness temperature, affecting the SM retrieval parameters (Wigneron et al., 2021). The algorithmic differences between SMOS-L3 and SMOS-IC are also evident in the performance of their data products. The influence of topography and land cover factors on performance is less in the case of SMOS-IC than in the case of SMOS-L3 (Figures 4–6). However, in terms of the RMSE and ubRMSE values that can reflect systematic errors, SMOS-L3 showed better performance than SMOS-IC (Table 2 and Figures 5–7).
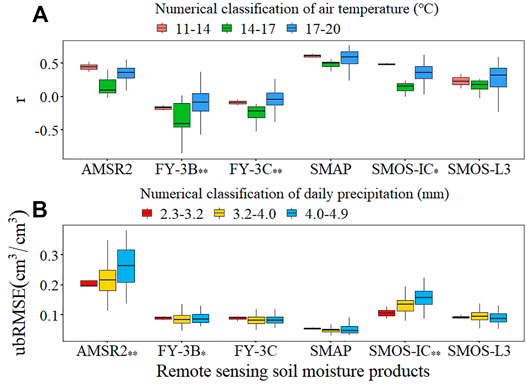
FIGURE 7. Box diagrams of meteorological factors and error coefficients of each product. * indicates the significance t-test’s p < .05 and ** indicates p < .01.
Soil surface moisture is one of the most challenging land surface parameters to observe accurately in remote sensing quantitative retrieval (Zhao et al., 2003). Therefore, accurate remote sensing–based SM products depend on the ongoing validation, evaluation, and improvement of the retrieval algorithms (Wigneron et al., 2017; Gruber et al., 2020; Wang et al., 2020). Based on the in situ measurement data of the surface SM in Hunan province obtained from two government departments of China, this study conducted a time-series analysis, an authenticity test, and an assessment based on environmental factors on the six mainstream passive microwave remote sensing–based SM products. The conclusion are presented below.
1 SMAP showed the overall best SM accuracy in Hunan province, achieving the optimal r, R2, RMSE, and ubRMSE values, with the descending orbit (morning) parameters higher than the ascending orbit (afternoon) parameters. The performance of this remote sensing–based product fluctuated slightly in different regions of Hunan province, and the accuracy was slightly higher in the central region. The product can capture the time-series dynamic changing trend of the SM on the ground. The detection accuracy of this product was not easily affected by topographic and meteorological factors. The product showed a slightly worse performance when the surface was a paddy field; however, the accuracy would increase with the increasing surface heterogeneity.
2 The ability of the AMSR2 product to capture dynamic changes in the surface SM was second to SMAP in Hunan province, and this product had the largest amount of observation data. However, its deviation was the largest and there were many outliers. Only the fluctuation trend of the AMSR2 product was significantly different from those of the in situ measurements and precipitation in the time-series analysis. The retrieval product was easily affected by environmental factors, and the retrieval algorithm must be improved by considering topographic, land cover, and meteorological factors.
3 Regarding different algorithm products of the same satellite, SMOS-L3 and SMOS-IC showed similar overall performance in Hunan province and achieved the lowest bias values. However, the fluctuation range of SMOS-L3 parameters was 0–0.5 cm3/cm3, the descending orbit (afternoon) parameters were higher than the ascending orbit (morning) parameters, and the overall observation was in a dry bias. The fluctuation range of SMOS-IC parameters was 0–1 cm3/cm3, the ascending orbit (morning) parameters were higher than the descending orbit (afternoon) and, and the overall observation was in a wet bias. For two satellite products of the same series, FY-3B and FY-3C showed an overall poor performance compared with the other products; however, they exhibited excellent consistency. The specific manifestations were time series, the variation trend of data was consistent, the error coefficients and distribution were similar, and the product performance was equally affected by environmental factors. However, a negative correlation was observed between some grid remote sensing and measurement SM data for both FY-3B and FY-3C, yielding a negative correlation between the overall correlation coefficient of the two products. The average elevation of these grids was mainly 300–570 m, the average temperature was predominantly 14–17°C, and the land cover was mainly a sparse forest with high heterogeneity.
4 Environmental factors can affect microwave remote sensing–based SM detection. Passive microwave technology showed the best surface SM detection capability in the central part of Hunan province, and the bias in the Dongting Lake area was the largest. Among the six products, FY-3B, FY-3C, and SMOS-L3 were influenced by topographic factors. Furthermore, all products were affected by land cover factors, except SMOS-IC. In addition, all six products were impacted by meteorological factors, except SMOS-L3.
The original contributions presented in the study are included in the article/supplementary material, further inquiries can be directed to the corresponding authors.
JF and QH designed the work. JF and ST realized the idea, analyzed the results, and completed the manuscript. JL collected and processed the data. QH supervised and improved the evaluation experiments. ST reviewed and corrected the manuscript. QH and ST contributed to the revision of the paper.
This research was supported by the Scientific Research Project of Hunan Meteorological Bureau, China (Grant No. XQKJ21B001), and the third phase of Business Capacity Building Project of Hunan Meteorological Bureau, China.
The authors declare that the research was conducted in the absence of any commercial or financial relationships that could be construed as a potential conflict of interest.
All claims expressed in this article are solely those of the authors and do not necessarily represent those of their affiliated organizations, or those of the publisher, the editors and the reviewers. Any product that may be evaluated in this article, or claim that may be made by its manufacturer, is not guaranteed or endorsed by the publisher.
The authors would like to thank Shibo Fang at Chinese Academy of Meteorological Sciences for his suggestions on this study.
Al-Yaari, A., Wigneron, J.-P., Dorigo, W., Colliander, A., Pellarin, T., Hahn, S., et al. (2019). Assessment and Inter-comparison of Recently Developed/reprocessed Microwave Satellite Soil Moisture Products Using ISMN Ground-Based Measurements. Remote sensing Environ. 224, 289–303. doi:10.1016/j.rse.2019.02.008
Al-Yaari, A., Wigneron, J.-P., Ducharne, A., Kerr, Y. H., Wagner, W., De Lannoy, G., et al. (2014). Global-scale Comparison of Passive (SMOS) and Active (ASCAT) Satellite Based Microwave Soil Moisture Retrievals with Soil Moisture Simulations (MERRA-Land). Remote Sensing Environ. 152, 614–626. doi:10.1016/j.rse.2014.07.013
Allison, P. (2015). Imputation by Predictive Mean Matching: Promise & Peril. Ardmore, Pennsylvania: Statistical Horizons.
Beck, H. E., Pan, M., Miralles, D. G., Reichle, R. H., Dorigo, W. A., Hahn, S., et al. (2021). Evaluation of 18 Satellite- and Model-Based Soil Moisture Products Using In Situ Measurements from 826 Sensors. Hydrol. Earth Syst. Sci. 25 (1), 17–40. doi:10.5194/hess-25-17-2021
Bindlish, R., Cosh, M. H., Jackson, T. J., Koike, T., Fujii, H., Chan, S. K., et al. (2017). GCOM-W AMSR2 Soil Moisture Product Validation Using Core Validation Sites. IEEE J. selected Top. Appl. earth observations remote sensing 11 (1), 209–219.doi:10.1109/igarss.2016.7729421
Chawla, I., Karthikeyan, L., and Mishra, A. K. (2020). A Review of Remote Sensing Applications for Water Security: Quantity, Quality, and Extremes. J. Hydrol. 585, 124826. doi:10.1016/j.jhydrol.2020.124826
Chen, F., Crow, W. T., Bindlish, R., Colliander, A., Burgin, M. S., Asanuma, J., et al. (2018). Global-scale Evaluation of SMAP, SMOS and ASCAT Soil Moisture Products Using Triple Collocation. Remote Sensing Environ. 214, 1–13. doi:10.1016/j.rse.2018.05.008
Dorigo, W. A., Scipal, K., Parinussa, R. M., Liu, Y. Y., Wagner, W., De Jeu, R. A. M., et al. (2010). Error Characterisation of Global Active and Passive Microwave Soil Moisture Datasets. Hydrol. Earth Syst. Sci. 14 (12), 2605–2616. doi:10.5194/hess-14-2605-2010
Escorihuela, M. J., Chanzy, A., Wigneron, J. P., and Kerr, Y. H. (2010). Effective Soil Moisture Sampling Depth of L-Band Radiometry: A Case Study. Remote Sensing Environ. 114 (5), 995–1001. doi:10.1016/j.rse.2009.12.011
Gruber, A., De Lannoy, G., Albergel, C., Al-Yaari, A., Brocca, L., Calvet, J.-C., et al. (2020). Validation Practices for Satellite Soil Moisture Retrievals: What Are (The) Errors. Remote sensing Environ. 244, 111806. doi:10.1016/j.rse.2020.111806
Gruber, A., Dorigo, W. A., Crow, W., and Wagner, W. (2017). Triple Collocation-Based Merging of Satellite Soil Moisture Retrievals. IEEE Trans. Geosci. Remote Sensing 55 (12), 6780–6792. doi:10.1109/tgrs.2017.2734070
Jackson, T. J., Cosh, M. H., Bindlish, R., Starks, P. J., Bosch, D. D., Seyfried, M., et al. (2010). Validation of Advanced Microwave Scanning Radiometer Soil Moisture Products. IEEE Trans. Geosci. Remote Sensing 48 (12), 4256–4272. doi:10.1109/tgrs.2010.2051035
Karthikeyan, L., Chawla, I., and Mishra, A. K. (2020). A Review of Remote Sensing Applications in Agriculture for Food Security: Crop Growth and Yield, Irrigation, and Crop Losses. J. Hydrol. 586, 124905. doi:10.1016/j.jhydrol.2020.124905
Karthikeyan, L., and Kumar, D. N. (2016). A Novel Approach to Validate Satellite Soil Moisture Retrievals Using Precipitation Data. J. Geophys. Res. Atmos. 121 (1911), 516–535. doi:10.1002/2016jd024829
Koley, S., and Jeganathan, C. (2020). Estimation and Evaluation of High Spatial Resolution Surface Soil Moisture Using Multi-Sensor Multi-Resolution Approach. Geoderma 378, 114618. doi:10.1016/j.geoderma.2020.114618
Kumar, S. V., Dirmeyer, P. A., Peters-Lidard, C. D., Bindlish, R., and Bolten, J. (2018). Information Theoretic Evaluation of Satellite Soil Moisture Retrievals. Remote sensing Environ. 204, 392–400. doi:10.1016/j.rse.2017.10.016
Liao, Y., Peng, J., and Guo, Q. (2014). Response of Hunan Climate to Global Climate Change. Trans. Atmos. Sci. 37 (1), 75–81.
Little, R. J. A. (1988). Missing-data Adjustments in Large Surveys. J. Business Econ. Stat. 6 (3), 287–296. doi:10.1080/07350015.1988.10509663
Liu, J., Chai, L., Dong, J., Zheng, D., Wigneron, J.-P., Liu, S., et al. (2021). Uncertainty Analysis of Eleven Multisource Soil Moisture Products in the Third Pole Environment Based on the Three-Corned Hat Method. Remote Sensing Environ. 255, 112225. doi:10.1016/j.rse.2020.112225
Liu, J., Chai, L., Lu, Z., Liu, S., Qu, Y., Geng, D., et al. (2019). Evaluation of SMAP, SMOS-IC, FY3B, JAXA, and LPRM Soil Moisture Products over the Qinghai-Tibet Plateau and its Surrounding Areas. Remote Sensing 11 (7), 792. doi:10.3390/rs11070792
Ma, C., Li, X., Wei, L., and Wang, W. (2017). Multi-scale Validation of Smap Soil Moisture Products over Cold and Arid Regions in Northwestern china Using Distributed Ground Observation Data. remote sensing 9 (4), 327. doi:10.3390/rs9040327
Mousa, B., and Shu, H. (2020). Spatial Evaluation and Assimilation of SMAP, SMOS, and ASCAT Satellite Soil Moisture Products over Africa Using Statistical Techniques. Earth Space Sci. 7 (1), e2019EA000841. doi:10.1029/2019ea000841
Nolan, M., and Fatland, D. R. (2003). Penetration Depth as a DInSAR Observable and Proxy for Soil Moisture. IEEE Trans. Geosci. Remote Sensing 41 (3), 532–537. doi:10.1109/tgrs.2003.809931
Oliva, R., Martin-Neira, M., Corbella, I., Torres, F., Kainulainen, J., Tenerelli, J. E., et al. (2012). SMOS Calibration and Instrument Performance after One Year in Orbit. IEEE Trans. Geosci. remote sensing 51 (1), 654–670.
Qin, X., Pang, Z., Jiang, W., Feng, T., and Fu, J. e. (2021). Progress and Development Trend of Soil Moisture Microwave Remote Sensing Retrieval Method. J. Geo-information Sci. 23 (10), 1728–1742.
Russo, I. M., Di Bisceglie, M., Galdi, C., Lavalle, M., and Zuffada, C. (2021). Entropy-Based Coherence Metric for Land Applications of GNSS-R. IEEE Trans. Geosci. Remote Sensing, 1. doi:10.1109/tgrs.2021.3125858
Song, S., Liu, J., Pu, H., Liu, Y., and Luo, J. (2019). The Comparison of Fusion Methods for HSRRSI Considering the Effectiveness of Land Cover (Features) Object Recognition Based on Deep Learning. Remote Sensing 11 (12), 1435. doi:10.3390/rs11121435
Tian, S., Renzullo, L. J., Van Dijk, A. I. J. M., Tregoning, P., and Walker, J. P. (2019). Global Joint Assimilation of GRACE and SMOS for Improved Estimation of Root-Zone Soil Moisture and Vegetation Response. Hydrol. Earth Syst. Sci. 23 (2), 1067–1081. doi:10.5194/hess-23-1067-2019
Wang, J., Pang, Y., Zhu, X., and Sun, Z. (2019). A Review of Researches on Inversion of Eigenvariance of Soil Water. Acta Pedofil. Sinica 56, 23–35. doi:10.3724/sp.j.1011.2011.00447
Wang, L., Fang, S., Pei, Z., Zhu, Y., Khoi, D. N., and Han, W. (2020). Using FengYun-3C VSM Data and Multivariate Models to Estimate Land Surface Soil Moisture. Remote Sensing 12 (6), 1038. doi:10.3390/rs12061038
Wang, Y., Yang, Y., Liu, C., and Shi, C. (2021a). Analysis on the Applicability of Fengyun-3 Satellite Microwave Remote Sensing Soil Moisture Products in Shandong. Chin. J. Agrometeorology 42 (04), 318–329.
Wang, Z., Che, T., Zhao, T., Dai, L., Li, X., and Wigneron, J.-P. (2021b). Evaluation of SMAP, SMOS, and AMSR2 Soil Moisture Products Based on Distributed Ground Observation Network in Cold and Arid Regions of China. IEEE J. Sel. Top. Appl. Earth Observations Remote Sensing 14, 8955–8970. doi:10.1109/jstars.2021.3108432
Wigneron, J.-P., Jackson, T. J., O'neill, P., De Lannoy, G., De Rosnay, P., Walker, J. P., et al. (2017). Modelling the Passive Microwave Signature from Land Surfaces: A Review of Recent Results and Application to the L-Band SMOS & SMAP Soil Moisture Retrieval Algorithms. Remote Sensing Environ. 192, 238–262. doi:10.1016/j.rse.2017.01.024
Wigneron, J.-P., Kerr, Y., Waldteufel, P., Saleh, K., Escorihuela, M.-J., Richaume, P., et al. (2007). L-band Microwave Emission of the Biosphere (L-MEB) Model: Description and Calibration against Experimental Data Sets over Crop fields. Remote Sensing Environ. 107 (4), 639–655. doi:10.1016/j.rse.2006.10.014
Wigneron, J.-P., Li, X., Frappart, F., Fan, L., Al-Yaari, A., De Lannoy, G., et al. (2021). SMOS-IC Data Record of Soil Moisture and L-VOD: Historical Development, Applications and Perspectives. Remote Sensing Environ. 254, 112238. doi:10.1016/j.rse.2020.112238
Wu, D., Li, Z., Zhu, Y., Li, X., Wu, Y., and Fang, S. (2021). A New Agricultural Drought index for Monitoring the Water Stress of winter Wheat. Agric. Water Manag. 244, 106599. doi:10.1016/j.agwat.2020.106599
Wu, X., Lu, G., Wu, Z., He, H., Scanlon, T., and Dorigo, W. (2020). Triple Collocation-Based Assessment of Satellite Soil Moisture Products with In Situ Measurements in china: Understanding the Error Sources. Remote Sensing 12 (14), 2275. doi:10.3390/rs12142275
Xiang, Y., Zhang, M., Zhang, L., He, C., Wang, Y., and Bai, X. (2017). Validation of SMOS Soil Moisture Products on Different Vegetation Types in Qilian Mountain. Remote Sensing Tech. Appl. 32 (5), 835–843.
Zhao, Y., Chen, D., Yang, L., Li, X., and Tang, W. (2003). The Principle and Method of Analysis of Remote Sensing Application. Beijing: Science Press, 20 13.
Keywords: soil moisture, passive microwave, remote sensing, in situ measurement, evaluation, hunan province of China
Citation: Fan J, Han Q, Tan S and Li J (2022) Evaluation of Six Satellite-Based Soil Moisture Products Based on in situ Measurements in Hunan Province, Central China. Front. Environ. Sci. 10:829046. doi: 10.3389/fenvs.2022.829046
Received: 04 December 2021; Accepted: 19 January 2022;
Published: 11 February 2022.
Edited by:
Shibo Fang, Chinese Academy of Meteorological Sciences, ChinaReviewed by:
Amen Al-Yaari, Université Paris-Sorbonne, FranceCopyright © 2022 Fan, Han, Tan and Li. This is an open-access article distributed under the terms of the Creative Commons Attribution License (CC BY). The use, distribution or reproduction in other forums is permitted, provided the original author(s) and the copyright owner(s) are credited and that the original publication in this journal is cited, in accordance with accepted academic practice. No use, distribution or reproduction is permitted which does not comply with these terms.
*Correspondence: Qinzhe Han, aHF6NjY2NTU5OUAxNjMuY29t; Shiqi Tan, cm5wZHdAb3V0bG9vay5jb20=
Disclaimer: All claims expressed in this article are solely those of the authors and do not necessarily represent those of their affiliated organizations, or those of the publisher, the editors and the reviewers. Any product that may be evaluated in this article or claim that may be made by its manufacturer is not guaranteed or endorsed by the publisher.
Research integrity at Frontiers
Learn more about the work of our research integrity team to safeguard the quality of each article we publish.