 Ying Ding
 Huihui Feng
 Bin Zou1,2
 Shuchao Ye
94% of researchers rate our articles as excellent or good
Learn more about the work of our research integrity team to safeguard the quality of each article we publish.
Find out more
ORIGINAL RESEARCH article
Front. Environ. Sci., 20 January 2022
Sec. Atmosphere and Climate
Volume 10 - 2022 | https://doi.org/10.3389/fenvs.2022.825732
This article is part of the Research TopicAir Pollution Remote Sensing and the Subsequent Interactions with Ecology on Regional ScalesView all 31 articles
Understanding of the contribution of LUCC to air pollution is the basis for land management and air pollution control. This study aimed to estimate the contribution of LUCC to PM2.5 pollution levels in the Changsha-Zhuzhou-Xiangtan (CZT) urban agglomeration in the central south China. Methodologically, residual analysis was adopted to isolate the LUCC contribution with the aid of multiple datasets from satellite observations and reanalysis products. The results revealed that the PM2.5 concentration increased significantly from 2001 to 2008 and then decreased. LUCC tended to enhance both the increasing and decreasing trends, while the magnitudes varied under different climate conditions. During 2001–2008, LUCC exerted more important influence on the air pollution, which contributed 40.59% of the total increase. During 2008–2014, the changing climate enhanced air pollution removal. During this time, the government of the CZT proposed the “Two Oriented Society” policy for sustainable urban development. Under this condition, the LUCC accounted for only 25.66% of the total PM2.5 decrease. This result suggested that it is necessary to further strengthen the goal of sustainable development rather than following the traditional way of “governance after development”.
The global urban area has expanded by ∼ 130% in recent decades (He et al., 2019), which exerts significant impacts on the environment through changes in surface energy and the hydrologic cycle, i.e., air pollution, global and regional climate change and biodiversity reduction (Foley et al., 2005). Among them, air pollution poses a severe threat to human health (Zou et al., 2019; Zou et al., 2020), climate change (Feng and Zou 2019; Feng et al., 2019), atmospheric visibility (Wang et al., 2019) and economic development (Chen et al., 2019), which has attracted increasing attention from researchers and governments.
It is crucial to clarify the land use and cover change (LUCC) impact on air pollution for land planning and environmental management during urban growth. Physically, LUCC affects air pollution in direct and indirect ways (Feng et al., 2017). First, LUCC can directly affect the spatial distribution of emission sources (Heald and Spracklen, 2015). Second, different land types exert various influences on dry deposition (Dzierzanowski et al., 2011). In addition, LUCC helps alter the dispersion and transportation of air pollution by changing the local or regional climate conditions (Bai et al., 2017). On the other hand, air pollution is also strongly affected by natural factors and anthropogenic emissions (Yang et al., 2018; Zheng et al., 2018). For example, precipitation controls wet deposition, which acts as one of the main removal methods of atmospheric pollutants (Ouyang et al., 2015). Wind has a direct influence on the variation in the air pollution concentration by enhancing its dispersion (Janhall 2015). Temperature and relative humidity play crucial roles in the formation of secondary aerosols by affecting the gas-to-particle process (Raes et al., 2000). Natural and anthropogenic factors affect air pollution through complex interactions, making it difficult to isolate individual effects.
Researchers have adopted several air quality models to isolate the LUCC impact by measuring the difference in air pollution with and without the influence of LUCC (i.e., WRF-Chem and GEOS-Chem) (Avise et al., 2009; Wu et al., 2012; Martin et al., 2015). However, the results are controversial due to the unavoidable uncertainty originating from the initial input, model error and prediction scenarios in different models (Bonan and Doney, 2018). For example, the modeled LUCC contribution to ozone variation ranges from −5 ppb to +5 ppb in different published works (Ganzeveld and Lelieveld, 2004; Chen et al., 2009; Squire et al., 2014). Considering these uncertainties, it has been suggested that direct observations (satellite and in situ) are required for accurately performing an air pollution evaluation and determining the corresponding driving factors (Bellouin et al., 2005; Seinfeld et al., 2016).
Focusing on the driving factors of air pollution, this study attempted to estimate the effect of LUCC using a statistical method with the aid of multisource satellite observations and reanalysis products. The Changsha-Zhuzhou-Xiangtan (CZT) urban agglomeration in central China, which suffers from serious air pollution of fine particulate matter (PM2.5), was selected as the study area. First, the spatial-temporal variations in the annual PM2.5 concentration were analyzed during the last decade (2001–2014). Then, residual analysis of the MLR model was performed to isolate the influence of LUCC on PM2.5. The results of this study will help capture the characteristics of air pollution evolution and provide valuable information for improving urban air quality by optimizing land management strategies.
The Changsha-Zhuzhou-Xiangtan (CZT) urban agglomeration, which spans 111°53′E to 114°15′E longitude and 23°2′N to 28°39′N latitude, was selected as the study area for this investigation. The study area is located in northeast Hunan Province, China, and includes the cities of Changsha, Zhuzhou and Xiangtan (Figure 1). The climate of the CZT is characterized by the subtropical humid monsoon with abundant precipitation and warm temperatures. The center of the CZT is at a low altitude and is surrounded by mountains, resulting in unfavorable diffusion conditions. As one of the regions with the fastest economic development and urbanization in midwest China, the study area has experienced severe atmospheric environmental problems. Considering the serious air pollution in the CZT, this area was designated one of the thirteen priority areas for air pollution control according to the National Plan on Air Pollution Control by the Chinese government during the 12th Five-Year Plan (2011–2015) (Chen et al., 2013).
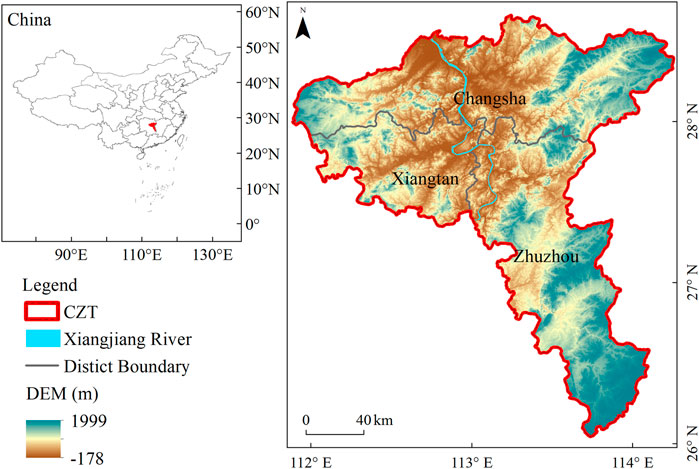
FIGURE 1. Study area.
According to our previous study (Feng and Zou, 2020), the variation in air pollution is controlled by natural and anthropogenic factors. Natural factors mainly refer to meteorological or natural surface parameters, including precipitation, surface and air temperatures, surface wind speed, relative humidity and terrain. Anthropogenic factors are strongly represented by human activities, such as anthropogenic emissions and land use and cover change (LUCC) (Feng and Zou, 2019). These datasets were also adopted to carry out the investigation in this study. Multi-source data sets have different spatial and temporal scales, which must be uniform before the investigation. Thus, All the datasets were resampled to the same spatial resolution (0.01°) through the NEAREST interpolation method and temporal scale (annual).
1) PM2.5 concentration. The annual surface PM2.5 concentration, at a resolution of 0.01°, was collected from the Atmospheric Composition Analysis Group (http://fizz.phys.dal.ca/∼atmos/martin/). The data were estimated by combining aerosol optical depth (AOD) retrievals from MODIS, MISR, and SeaWIFS with the GEOS-Chen chemical transport model. The annual mean PM2.5 estimate from this dataset was highly consistent with global ground observations (R2 = 0.81; slope = 0.90). This study used the China regional datasets of V4.CH.03 from 2001 to 2014, which are widely used in national- and regional-scale research (van Donkelaar et al., 2019; Shi et al., 2020; Yue et al., 2020).
2) Natural parameter datasets. Natural parameter data were used to investigate the natural factors of air pollution, including precipitation, surface and air temperatures, wind speed, relative humidity and terrain. Integrated Multi-Satellite Retrievals for Global Precipitation Mission (IMERG) monthly precipitation data at a resolution of 0.1° were downloaded from the NASA Goddard Earth Sciences Data and Information Services Center (GES DISC) (https://disc.gsfc.nasa.gov/datasets/GPM_3IMERGM_V06/summary). The data showed the best expression of precipitation, with a correlation of 0.79 (Yu et al., 2020). The land surface temperature of MODIS/Terra Land Surface Temperature/Emissivity Monthly L3 Global 0.05Deg CMG (MOD11C3) (https://lpdaac.usgs.gov/products/mod11c3v006/) at a resolution of 0.05° was selected over the time period of 2001–2014. The annually averaged air temperature and wind speed data from the China Meteorological Forcing Dataset (CMFD) were downloaded from the National Tibetan Plateau Data Center (http://data.tpdc.ac.cn/zh-hans/data/8028b944-daaa-4511-8769-965612652c49/), which were produced by merging a variety of data sources (He et al., 2020a). The relative humidity data at a resolution of 0.1° were collected from the Copernicus Climate Change Service (C3S) Climate Data Store (https://cds.climate.copernicus.eu/cdsapp#!/dataset/reanalysis-era5-land-monthly-means?tab = overview). In addition to the atmospheric data, terrain DEM data were adopted; these data were available from the ASTER GDEM at a resolution of 30 m collected from the Geospatial Data Cloud (http://www.gscloud.cn).
3) Anthropogenic factors datasets. In addition to the natural parameter data, land use and cover data and anthropogenic emissions inventories were used to investigate the anthropogenic drivers of air pollution. Specifically, land use data at a 1 km resolution in 2000, 2005, 2010, and 2015 from the Resource and Environment Science and Data Center, Chinese Academy of Science (http://www.resdc.cn), were reclassified into classes of built-up, forest, grassland, water, agricultural land, and bare soil. The land use data were generated by artificial visual interpretation from Landsat TM/ETM remote sensing images, and the overall accuracy was above 91.20% (Liu et al., 2014). Anthropogenic emissions inventories of PM2.5 with a spatial resolution of 0.1° were obtained from the Peking University website (http://inventory.pku.edu.cn/).
Considering the unavoidable uncertainty of the model, this study used the statistical method of residual analysis to estimate the LUCC impact. The method has been applied in several studies and has shown great potential for identifying and clarifying the driving factors of environmental change (Tai et al., 2010; Che et al., 2019; Li et al., 2019; He et al., 2020b). Methodologically, the trend of observed PM2.5 was used to present the actual change in air pollution. Then, the theoretical PM2.5 concentration without LUCC impact was simulated by a stepwise MLR model. Finally, the residual trend between the observed and theoretical PM2.5 trends was adopted to represent the LUCC influence.
For each grid, the theoretical PM2.5 concentration estimated by the MLR model can be written as:
where
Because the MLR model does not consider the LUCC impact, a residual exists between the observed and MLR-simulated PM2.5 concentrations, which reflects the land use influence. The residual is calculated by the following equation:
where
The trends of the observed PM2.5 concentration and the residual represent the actual variation and the LUCC impact of the PM2.5 concentration. We then estimate the relative contribution of LUCC as:
where
It is necessary to first capture the spatial and temporal trends of LUCC, climate and anthropogenic emissions to understand the mechanism of air pollution in the CZT. The distributions of land use in 2000, 2005, 2010, and 2015 are presented in Figure 2 and Table 1. Generally, forest (63.46%) is the dominant land use type in the CZT, followed by agricultural land (30.11%) and built-up land (3.07%). Spatially, forests are mainly distributed in the west, east and south of the urban agglomeration at a high altitude. urban are located mainly along the Xiangjiang River, and agricultural land is distributed around the built-up areas. Since China implemented the reform and opening up policy in 1978, urban sprawl and industrial development in the CZT have been increasingly occupying forest and farmland. The proportion of built-up areas increased from 637.57 km2 in 2000 to 1168.42 km2 in 2015. The expansion of built-up areas is mainly from the conversion of agricultural land and forest, whose areas were reduced to 331.43 and 216.27 km2, respectively. The water area increased slightly (from 1.87 to 1.96%). In addition, grassland decreased from 1.46 to 1.43%.
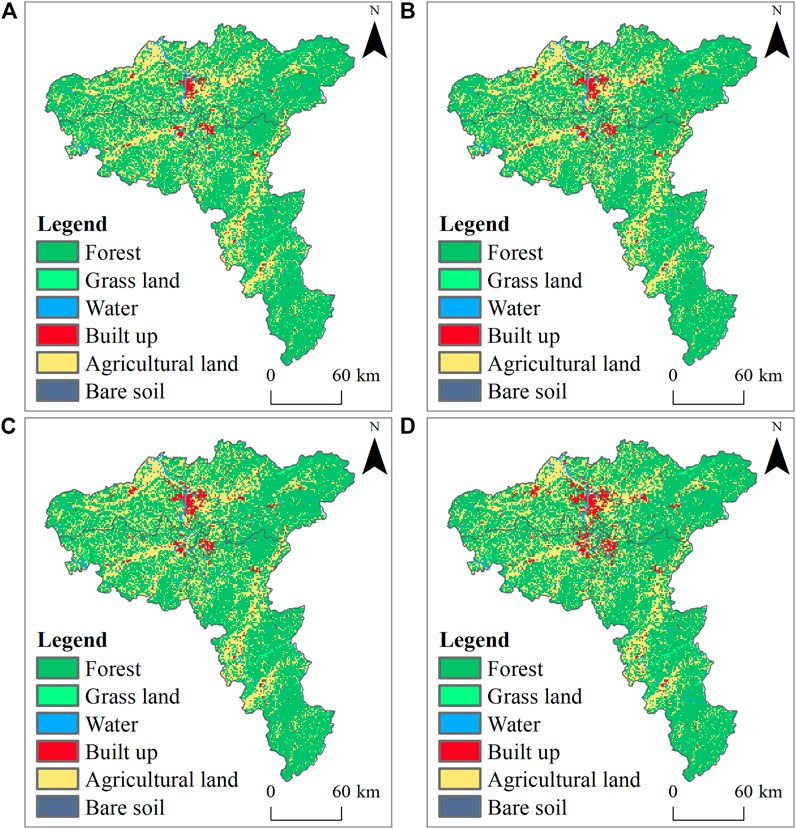
FIGURE 2. Spatial distribution of land use in (A) 2000, (B) 2005, (C) 2010, and (D) 2015 in the CZT.
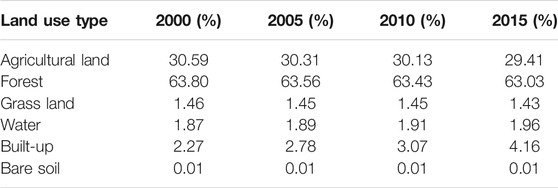
TABLE 1. Area percentage statistics of land use types.
Figures 3, 4 present the spatial patterns of the temporal trends of the meteorological factors and anthropogenic emission. The relative humidity decreased in the central CZT and slightly increased in southern Zhuzhou. The rising trend of precipitation gradually weakened from east to west and showed a decreasing trend in the west. Because of the urban heat island effect, the land surface temperature increased in both urban and suburban areas. Air temperature dropped in the western CZT, while it increased in eastern Changsha and southern Zhuzhou. Wind speed presented a significantly increasing trend in the entire CZT, with the greatest increase occurring in the western region. Some studies also found the recovery of surface wind speed from stilling (Kim and Paik 2015; Li et al., 2018; Zeng et al., 2019). During the 2001–2008 period, anthropogenic emissions increased significantly in urban areas of the central CZT. From 2008 to 2014, emissions in Changsha and Zhuzhou urban areas decreased, while other areas changed slightly.
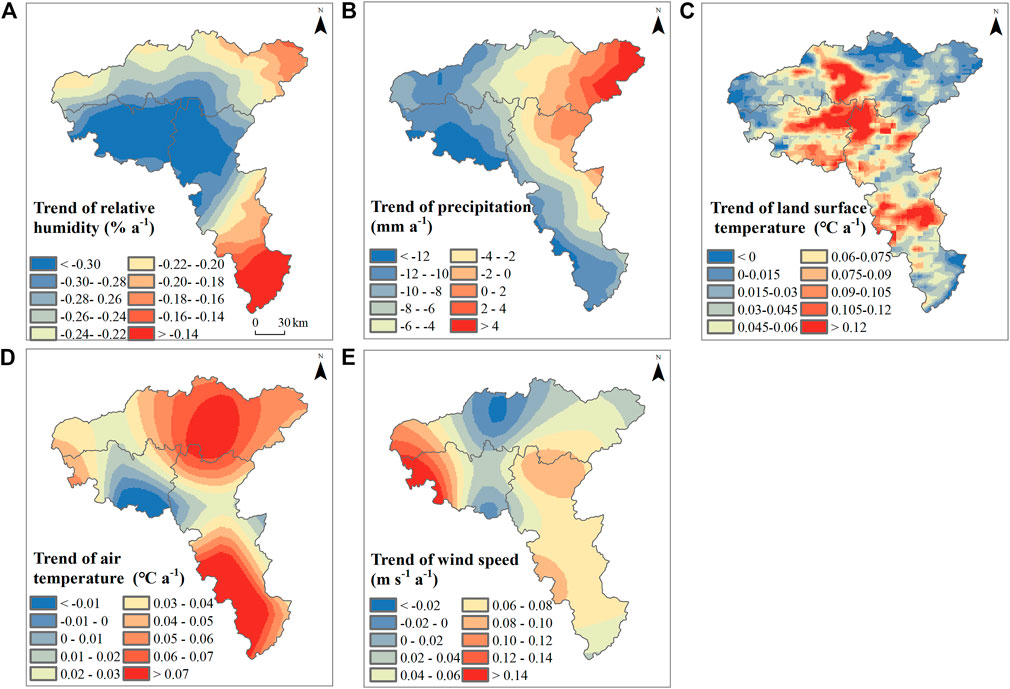
FIGURE 3. Spatial patterns of the trends in (A) relative humidity, (B) precipitation, (C) land surface temperature, (D) air temperature and (E) wind speed from 2001 to 2014.
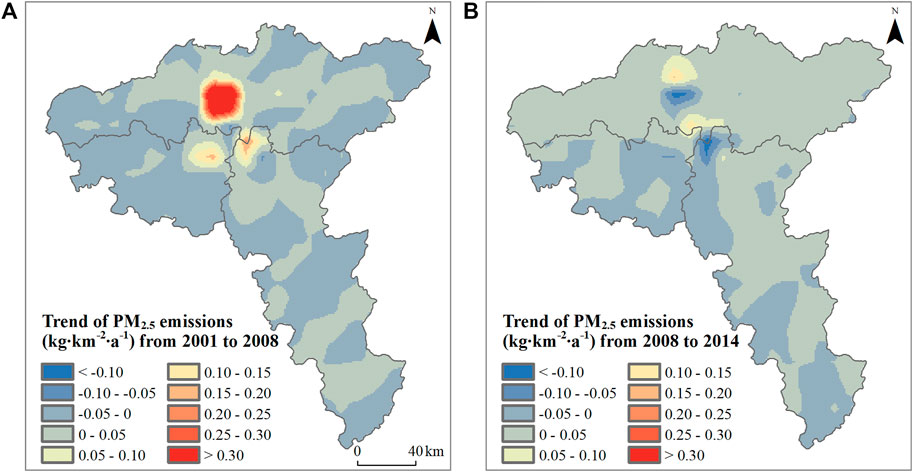
FIGURE 4. Spatial pattern of the trends in anthropogenic PM2.5 emissions during (A) 2001–2008 and (B) 2008–2014.
Under the background of regional LUCC, air pollution was characterized by significant spatial and temporal variations in the CZT (Figure 5). Generally, the multiyear mean of the PM2.5 concentrations was 53.71 μg/m3, with the spatial distribution mainly characterized as high in the west and north and low in the east and south (Figure 5A). At the scale of land use types, the PM2.5 concentrations are high in urban areas and relatively low in rural and suburban areas, which is consistent with most of the previous studies (Zou et al., 2016; Liu et al., 2020). Specifically, the most polluted districts were central Changsha, northeastern Xiangtan and northwestern Zhuzhou, while the areas with the best air quality were eastern Changsha and southern Zhuzhou. Figure 5B shows the temporal changes in the PM2.5 concentrations, which present a significant peak pattern. During the 2001–2008 period, the PM2.5 concentrations increased significantly by 3.40 μg m−3∙a−1 (R2 = 0.93, p < 0.05). During the period 2008–2014, however, the PM2.5 concentrations decreased by −1.14 μg m−3∙a−1 (R2 = 0.33, p = 0.18). The decreasing trend of the PM2.5 concentration starting from 2008 resulted because the CZT became one of the areas that implemented the “Two Oriented Society” policy in 2007. To build a resource-saving and environmentally friendly society, local governments have adopted a series of policies of land management and air pollution mitigation, including encouraging high-tech industries with clean production to replace traditional industries, afforesting waste hills or unclaimed lands, and building greenbelts along streets. Moreover, the original disordered productive land use has gradually been replaced by science parks (Zou et al., 2016).
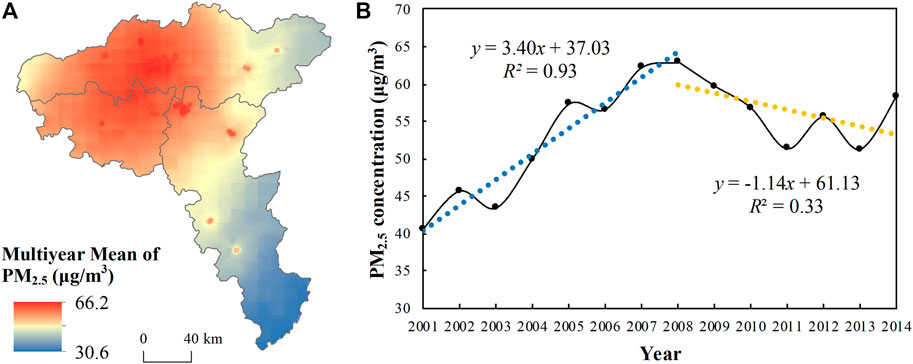
FIGURE 5. (A) Multiyear mean of the PM2.5 concentration and (B) the annually averaged PM2.5 concentration variations from 2001 to 2014.
Figure 6 further shows the spatial distribution of the PM2.5 concentration trends during the periods 2001–2008 and 2008–2014. From 2001 to 2008, the PM2.5 concentrations increased over the entire CZT. The worsening air pollution was mainly found in northern Zhuzhou, where the PM2.5 concentration was relatively low. With respect to the period 2008–2014, the PM2.5 concentration showed a significant reduction over the entire study area. The largest decreasing trend occurred in the central regions, where PM2.5 pollution was relatively severe. Despite great improvement, the study area still faced serious air pollution in 2014, with 96.62% of the area still greatly exceeding the Chinese National Ambient Air Quality Standards (CNAAQS, i.e., Level-2, 35 μg/m3). Strict controlling policies need to be continued in the future.
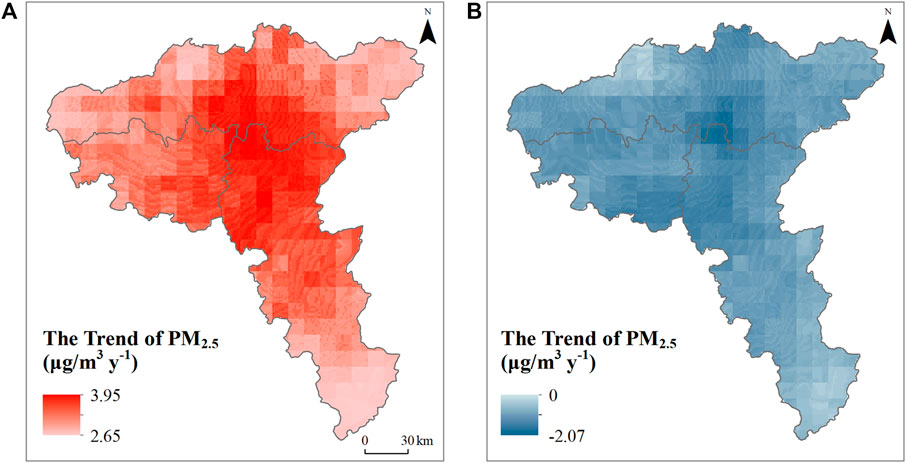
FIGURE 6. Spatial distribution of the PM2.5 concentration trends during (A) 2001–2008 and (B) 2008–2014.
This study next explores the LUCC impact on PM2.5 for land and environmental management. Figure 7 shows the annually averaged PM2.5 concentrations for five land use types in 2000, 2005, 2010, and 2015. From 2000 to 2005, the annual mean PM2.5 concentrations for all land use types greatly increased. The magnitude of the increase was highest in built-up areas. This increase may be because urban land concentrates high anthropogenic emissions, such as automobile exhaust and industrial activities. Notably, the PM2.5 concentrations in the water body and farmland use types were also relatively high. The water body land use type is mainly distributed in urban and suburban areas. Thus, particles from the built-up area are transmitted to water areas with low altitudes through diffusion, resulting in a higher PM2.5 concentration. Agricultural waste burning and clearing, including open field burning and burning as household fuel, are significant emission sources of PM2.5 (Zhang et al., 2017). In contrast, the PM2.5 concentrations in forests and grasslands were relatively low, indicating that these land types could promote a decrease in the PM2.5 concentration through the deposition effect and stomatal absorption from the vegetation blade surface (Nowak et al., 2013; Reddington et al., 2015). Correlations between air pollution and natural factors were also evaluated (see Supplementary Figure S1). Specifically, the PM2.5 concentration showed negative correlations with relative humidity, precipitation and wind speed. Conversely, both air temperature and land surface temperature showed positive correlations with the PM2.5 concentration.
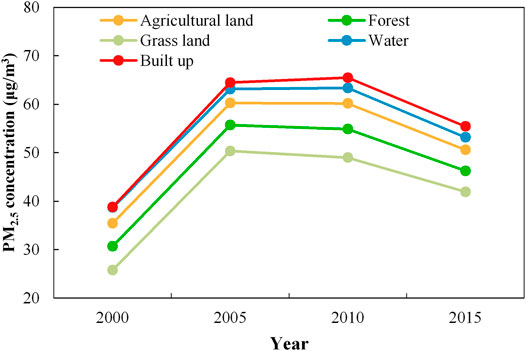
FIGURE 7. Annually averaged PM2.5 concentrations for different land uses.
To quantify the LUCC influence, the MLR model was used to simulate the PM2.5 concentrations under the control of other factors (factors except for land use). Figure 8 shows the trends of the MLR-simulated PM2.5 concentrations and the residual during the periods 2001–2008 and 2008–2014, which present similar trends with the observed PM2.5. Specifically, the simulated PM2.5 concentration and the residual increased by 2.02 μg m−3∙a−1 (R2 = 0.96, p < 0.05) and 1.37 μg m−3∙a−1 (R2 = 0.76, p < 0.05) during 2001–2008. As a result, the relative contributions of the LUCC and other factors were 40.59 and 59.41%, indicating the predominant factors of emissions and meteorological conditions for the worsening air quality. During 2008–2014, the observed PM2.5 concentration decreased by −1.13 μg m−3∙a−1, while the simulated PM2.5 concentration and residual decreased by −0.85 μg m−3∙a−1 (R2 = 0.46, p = 0.09) and −0.29 μg m−3∙a−1 (R2 = 0.13, p = 0.43). The relative contributions of land use and other factors were therefore 25.66 and 74.34%, suggesting the increasing influences of climate factors and anthropogenic emission. The main reason might be attributed to the strengthening influence of the climate conditions. As shown in Supplementary Figure S3, the meteorological conditions changed significantly after 2008, characterized by increased humidity, precipitation, and wind speed and decreased land surface temperature. Under these conditions, the climate tends to mitigate air pollution effectively. Our results are similar to Zhang et al. (2020), which implemented sensitivity experiments based on atmospheric chemistry model and demonstrated that contribution of more favorable meteorological conditions on decrease in PM2.5 were higher than emission in Beijing. In conclusion, the signs of the LUCC impact remain positive, suggesting that land activities promote air pollution evolution. On the other hand, the magnitude is much greater in the process of the increase in PM2.5, suggesting that the costs of unreasonable land activities are much higher than the benefits of rational land policy. Therefore, strengthening sustainable land management rather than following the traditional way of “governance after development” is required.
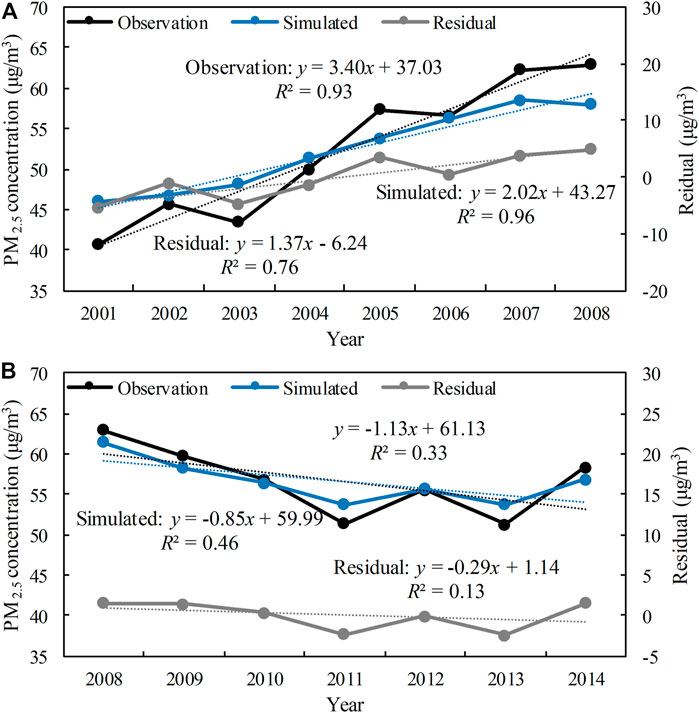
FIGURE 8. Temporal trends of the observed, MLR simulated, and residual PM2.5 concentrations during the periods (A) 2001–2008 and (B) 2008–2014.
Figure 9 further shows the pixelwise contributions of the LUCC impact. From 2001 to 2008, the influences of natural factors and emissions were relatively large in urban areas. In contrast, land use acted as the primary contributor in western Changsha and southern Zhuzhou. During 2008–2014, the decreasing trend of the PM2.5 concentration was also mainly controlled by natural factors and anthropogenic emissions, with most of the LUCC contributions less than 50%. The land use-dominant areas were located in southern Xiangtan, the urban area of Changsha and southern Zhuzhou. Additionally, LUCC weakened the decreasing trend in the suburbs located in western Changsha, which might be attributed to the increase of built-up areas and the decrease of vegetation coverage during the rapid urbanization after 2008 (Figure 2 and Supplementary Figure S4).
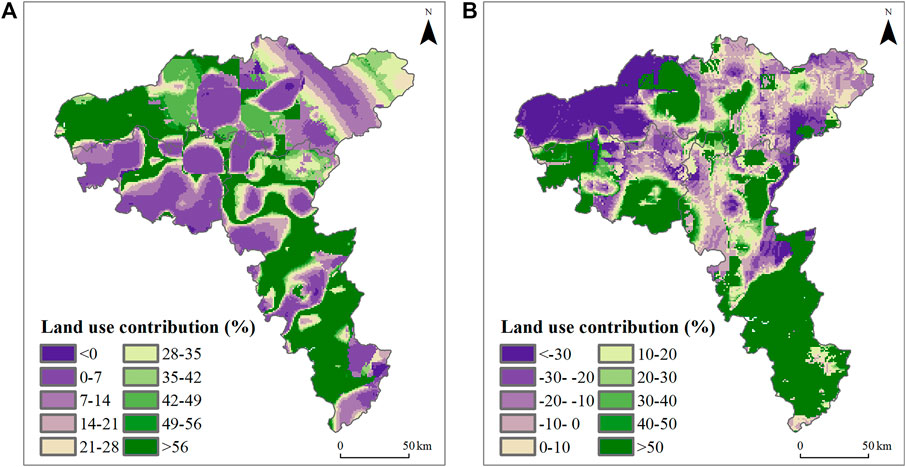
FIGURE 9. Pixelwise contributions of LUCC impact during the period (A) 2001–2008 and (B) 2008–2014.
This study aimed to explore the impact of LUCC on PM2.5 pollution levels in the CZT from 2000 to 2014. Residual analysis of the MLR model was adopted with the aid of multiple source datasets (including satellites and reanalysis). The main conclusions are as follows:
Because of the implementation of the Two-Orientated Society policy since 2007, there was a turning point of air pollution evolution after 2008 in the CZT. Specifically, the PM2.5 concentration increased significantly by 3.40 μg m−3∙a−1 (R2 = 0.93, p < 0.05) from 2001 to 2008 and then decreased by -1.14 μg m−3∙a−1 (R2 = 0.33, p = 0.18) after 2008. However, the study area still suffered from serious air pollution, which requires sustained efforts from environmental management.
LUCC exhibited a strong influence on air pollution. The statistical results show that the PM2.5 concentrations were high in built-up, water body and farmland land use types, while they were relatively low in forest and grassland land use types. The correlations between air pollution and climate were relatively complex. The PM2.5 concentration had negative correlations with relative humidity, precipitation and wind speed and positive correlations with air temperature and land surface temperature. However, the weak correlation (p > 0.05) between the PM2.5 concentration and individual meteorological parameters suggests that it is difficult for individual factors to explain the PM2.5 concentration variation.
With the MLR model, the LUCC influence was finally estimated. From 2001 to 2008, LUCC accounted for 40.59% of the increase. During 2008–2014, the meteorological conditions changed, significantly enhancing the air pollution cleaning ability, which was characterized by increased humidity, precipitation and wind speed and decreased land surface temperature. Under this condition, the natural and emissions contributions (74.34%) were much greater than the contribution of LUCC (25.66%). This result suggested that the negative impact of unreasonable land management was much stronger than the positive impact of sustainable land development. Therefore, it is necessary to further strengthen the goal of sustainable development in regional land and environment management rather than following the traditional way of “governance after development”. Furthermore, the LUCC impact presented significant spatial variabilities. From 2001 to 2008, LUCC significantly worsened the air quality in western Changsha and southern Zhuzhou. During 2008–2014, the PM2.5 concentration variation was mainly controlled by natural factors and emissions, and land use-dominant areas were only located in southern Xiangtan, the urban area of Changsha and southern Zhuzhou.
This study clarified the impact of LUCC on air pollution, which could help capture the driving factors of air pollution and support sustainable land planning. Several issues should be addressed in future research. First, the physical mechanism of the LUCC impact should be fully investigated to understand its influences. Furthermore, natural factors and anthropogenic factors exert significant interactions under the complex system of Earth, which will require further evaluation to capture the sign and magnitude of the LUCC impacts.
The original contributions presented in the study are included in the article/Supplementary Material, further inquiries can be directed to the corresponding author.
YD: Data curation, Software, Visualization, Writing-Original draft preparation. HF: Conceptualization, Methodology, Supervision, Editing. BZ: Investigation and Reviewing. SY: Editing.
This work was supported in part by the National Natural Science Foundation of China (Grant No. 42071378) and the Natural Science Foundation of Hunan Province (No. 2020JJ3045).
The authors declare that the research was conducted in the absence of any commercial or financial relationships that could be construed as a potential conflict of interest.
All claims expressed in this article are solely those of the authors and do not necessarily represent those of their affiliated organizations, or those of the publisher, the editors and the reviewers. Any product that may be evaluated in this article, orclaim that may be made by its manufacturer, is not guaranteed or endorsed by the publisher.
The Supplementary Material for this article can be found online at: https://www.frontiersin.org/articles/10.3389/fenvs.2022.825732/full#supplementary-material
Avise, J., Chen, J., Lamb, B., Wiedinmyer, C., Guenther, A., Salathé, E., et al. (2009). Attribution of Projected Changes in Summertime US Ozone and PM2.5 Concentrations to Global Changes. Atmos. Chem. Phys. 9 (4), 1111–1124. doi:10.5194/acp-9-1111-2009
Bai, X., McPhearson, T., Cleugh, H., Nagendra, H., Tong, X., Zhu, T., et al. (2017). Linking Urbanization and the Environment: Conceptual and Empirical Advances. Annu. Rev. Environ. Resour. 42, 215–240. doi:10.1146/annurev-environ-102016-061128
Bellouin, N., Boucher, O., Haywood, J., and Reddy, M. S. (2005). Global Estimate of Aerosol Direct Radiative Forcing from Satellite Measurements. Nature 438 (7071), 1138–1141. doi:10.1038/nature04348
Bonan, G. B., and Doney, S. C. (2018). Climate, Ecosystems, and Planetary Futures: The challenge to Predict Life in Earth System Models. Science 359, eaam8328. doi:10.1126/science.aam8328
Che, H., Gui, K., Xia, X., Wang, Y., Holben, B. N., Goloub, P., et al. (2019). Large Contribution of Meteorological Factors to Inter-Decadal Changes in Regional Aerosol Optical Depth. Atmos. Chem. Phys. 19 (16), 10497–10523. doi:10.5194/acp-19-10497-2019
Chen, J., Avise, J., Guenther, A., Wiedinmyer, C., Salathe, E., Jackson, R. B., et al. (2009). Future Land Use and Land Cover Influences on Regional Biogenic Emissions and Air Quality in the United States. Atmos. Environ. 43 (36), 5771–5780. doi:10.1016/j.atmosenv.2009.08.015
Chen, J., Chen, K., Wang, G., Chen, R., Liu, X., and Wei, G. (2019). Indirect Economic Impact Incurred by Haze Pollution: an Econometric and Input-Output Joint Model. Int. J. Environ. Res. Public Health 16 (13), 2328. doi:10.3390/ijerph16132328
Chen, Z., Wang, J.-N., Ma, G.-X., and Zhang, Y.-S. (2013). China Tackles the Health Effects of Air Pollution. Lancet 382 (9909), 1959–1960. doi:10.1016/s0140-6736(13)62064-4
Dzierżanowski, K., Popek, R., Gawrońska, H., Sæbø, A., and Gawroński, S. W. (2011). Deposition of Particulate Matter of Different Size Fractions on Leaf Surfaces and in Waxes of Urban forest Species. Int. J. Phytoremediation 13 (10), 1037–1046. doi:10.1080/15226514.2011.552929
Feng, H., Zou, B., and Ding, Y. (2019). Satellite Detection of Aerosol-Produced Temperature Change. Remote Sensing Lett. 10 (9), 854–863. doi:10.1080/2150704x.2019.1629707
Feng, H., and Zou, B. (2019). Satellite-Based Estimation of the Aerosol Forcing Contribution to the Global Land Surface Temperature in the Recent Decade. Remote Sensing Environ. 232, 111299. doi:10.1016/j.rse.2019.111299
Feng, H., and Zou, B. (2020). Satellite-Based Separation of Climatic and Surface Influences on Global Aerosol Change. Int. J. Remote Sensing 41 (14), 5443–5456. doi:10.1080/01431161.2020.1731934
Feng, H., Zou, B., and Tang, Y. (2017). Scale- and Region-Dependence in Landscape-PM2.5 Correlation: Implications for Urban Planning. Remote Sensing 9 (9), 918. doi:10.3390/rs9090918
Foley, J. A., DeFries, R., Asner, G. P., Barford, C., Bonan, G., Carpenter, S. R., et al. (2005). Global Consequences of Land Use. Science 309 (5734), 570–574. doi:10.1126/science.1111772
Ganzeveld, L., and Lelieveld, J. (2004). Impact of Amazonian Deforestation on Atmospheric Chemistry. Geophys. Res. Lett. 31 (6), L06105. doi:10.1029/2003gl019205
He, C., Liu, Z., Gou, S., Zhang, Q., Zhang, J., and Xu, L. (2019). Detecting Global Urban Expansion over the Last Three Decades Using a Fully Convolutional Network. Environ. Res. Lett. 14 (3), 034008. doi:10.1088/1748-9326/aaf936
He, J., Yang, K., Tang, W., Lu, H., Qin, J., Chen, Y., et al. (2020a). The First High-Resolution Meteorological Forcing Dataset for Land Process Studies over China. Sci. Data 7 (1), 25. doi:10.1038/s41597-020-0369-y
He, L., Wang, L., Huang, B., Wei, J., Zhou, Z., and Zhong, Y. (2020b). Anthropogenic and Meteorological Drivers of 1980-2016 Trend in Aerosol Optical and Radiative Properties over the Yangtze River Basin. Atmos. Environ. 223, 117188. doi:10.1016/j.atmosenv.2019.117188
Heald, C. L., and Spracklen, D. V. (2015). Land Use Change Impacts on Air Quality and Climate. Chem. Rev. 115 (10), 4476–4496. doi:10.1021/cr500446g
Janhäll, S. (2015). Review on Urban Vegetation and Particle Air Pollution - Deposition and Dispersion. Atmos. Environ. 105, 130–137. doi:10.1016/j.atmosenv.2015.01.052
Kim, J., and Paik, K. (2015). Recent Recovery of Surface Wind Speed after Decadal Decrease: A Focus on South Korea. Clim. Dyn. 45 (5-6), 1699–1712. doi:10.1007/s00382-015-2546-9
Li, K., Jacob, D. J., Liao, H., Shen, L., Zhang, Q., and Bates, K. H. (2019). Anthropogenic Drivers of 2013-2017 Trends in Summer Surface Ozone in China. Proc. Natl. Acad. Sci. USA 116 (2), 422–427. doi:10.1073/pnas.1812168116
Li, Y., Chen, Y., Li, Z., and Fang, G. (2018). Recent Recovery of Surface Wind Speed in Northwest China. Int. J. Climatol 38 (12), 4445–4458. doi:10.1002/joc.5679
Liu, J., Ding, J., Li, L., Li, X., Zhang, Z., Ran, S., et al. (2020). Characteristics of Aerosol Optical Depth over Land Types in central Asia. Sci. Total Environ. 727, 138676. doi:10.1016/j.scitotenv.2020.138676
Liu, J., Kuang, W., Zhang, Z., Xu, X., Qin, Y., Ning, J., et al. (2014). Spatiotemporal Characteristics, Patterns, and Causes of Land-Use Changes in China since the Late 1980s. J. Geogr. Sci. 24 (2), 195–210. doi:10.1007/s11442-014-1082-6
Martin, M. V., Heald, C. L., Lamarque, J.-F., Tilmes, S., Emmons, L. K., and Schichtel, B. A. (2015). How Emissions, Climate, and Land Use Change Will Impact Mid-century Air Quality over the United States: a Focus on Effects at National parks. Atmos. Chem. Phys. 15 (5), 2805–2823. doi:10.5194/acp-15-2805-2015
Nowak, D. J., Hirabayashi, S., Bodine, A., and Hoehn, R. (2013). Modeled PM2.5 Removal by Trees in Ten U.S. Cities and Associated Health Effects. Environ. Pollut. 178, 395–402. doi:10.1016/j.envpol.2013.03.050
Ouyang, W., Guo, B., Cai, G., Li, Q., Han, S., Liu, B., et al. (2015). The Washing Effect of Precipitation on Particulate Matter and the Pollution Dynamics of Rainwater in Downtown Beijing. Sci. Total Environ. 505, 306–314. doi:10.1016/j.scitotenv.2014.09.062
Raes, F., Dingenen, R. V., Vignati, E., Wilson, J., Putaud, J.-P., Seinfeld, J. H., et al. (2000). Formation and Cycling of Aerosols in the Global Troposphere. Atmos. Environ. 34 (25), 4215–4240. doi:10.1016/s1352-2310(00)00239-9
Reddington, C. L., Butt, E. W., Ridley, D. A., Artaxo, P., Morgan, W. T., Coe, H., et al. (2015). Air Quality and Human Health Improvements from Reductions in Deforestation-Related Fire in Brazil. Nat. Geosci 8 (10), 768–771. doi:10.1038/ngeo2535
Seinfeld, J. H., Bretherton, C., Carslaw, K. S., Coe, H., DeMott, P. J., Dunlea, E. J., et al. (2016). Improving Our Fundamental Understanding of the Role of Aerosol−Cloud Interactions in the Climate System. Proc. Natl. Acad. Sci. USA 113 (21), 5781–5790. doi:10.1073/pnas.1514043113
Shi, T., Hu, Y., Liu, M., Li, C., Zhang, C., and Liu, C. (2020). How Do Economic Growth, Urbanization, and Industrialization Affect Fine Particulate Matter Concentrations? an Assessment in Liaoning Province, China. Int. J. Environ. Res. Public Health 17 (15), 5441. doi:10.3390/ijerph17155441
Squire, O. J., Archibald, A. T., Abraham, N. L., Beerling, D. J., Hewitt, C. N., Lathière, J., et al. (2014). Influence of Future Climate and Cropland Expansion on Isoprene Emissions and Tropospheric Ozone. Atmos. Chem. Phys. 14 (2), 1011–1024. doi:10.5194/acp-14-1011-2014
Tai, A. P. K., Mickley, L. J., and Jacob, D. J. (2010). Correlations between fine Particulate Matter (PM2.5) and Meteorological Variables in the United States: Implications for the Sensitivity of PM2.5 to Climate Change. Atmos. Environ. 44 (32), 3976–3984. doi:10.1016/j.atmosenv.2010.06.060
van Donkelaar, A., Martin, R., Li, C., and Burnett, R. T. (2019). Regional Estimates of Chemical Composition of Fine Particulate Matter Using a Combined Geoscience-Statistical Method with Information from Satellites, Models, and Monitors. Environ. Sci. Technol. 53 (5), 2595–2611. doi:10.1021/acs.est.8b06392
Wang, X., Zhang, R., and Yu, W. (2019). The Effects of PM 2.5 Concentrations and Relative Humidity on Atmospheric Visibility in Beijing. J. Geophys. Res. Atmos. 124 (4), 2235–2259. doi:10.1029/2018jd029269
Wu, S., Mickley, L. J., Kaplan, J. O., and Jacob, D. J. (2012). Impacts of Changes in Land Use and Land Cover on Atmospheric Chemistry and Air Quality over the 21st Century. Atmos. Chem. Phys. 12 (3), 1597–1609. doi:10.5194/acp-12-1597-2012
Yang, Y., Zheng, X., Gao, Z., Wang, H., Wang, T., Li, Y., et al. (2018). Long-term Trends of Persistent Synoptic Circulation Events in Planetary Boundary Layer and Their Relationships with Haze Pollution in winter Half Year over Eastern China. J. Geophys. Res. Atmos. 123 (19), 10991–11007. doi:10.1029/2018JD028982
Yu, C., Hu, D., Liu, M., Wang, S., and Di, Y. (2020). Spatio-Temporal Accuracy Evaluation of Three High-Resolution Satellite Precipitation Products in China Area. Atmos. Res. 241, 104952. doi:10.1016/j.atmosres.2020.104952
Yue, H., He, C., Huang, Q., Yin, D., and Bryan, B. A. (2020). Stronger Policy Required to Substantially Reduce Deaths from PM2.5 Pollution in China. Nat. Commun. 11, 1462. doi:10.1038/s41467-020-15319-4
Zeng, Z., Ziegler, A. D., Searchinger, T., Yang, L., Chen, A., Ju, K., et al. (2019). A Reversal in Global Terrestrial Stilling and its Implications for Wind Energy Production. Nat. Clim. Chang. 9 (12), 979–985. doi:10.1038/s41558-019-0622-6
Zhang, H., Hu, J., Qi, Y., Li, C., Chen, J., Wang, X., et al. (2017). Emission Characterization, Environmental Impact, and Control Measure of PM2.5 Emitted from Agricultural Crop Residue Burning in China. J. Clean. Prod. 149, 629–635. doi:10.1016/j.jclepro.2017.02.092
Zhang, W., Wang, H., Zhang, X., Peng, Y., Zhong, J., Wang, Y., et al. (2020). Evaluating the Contributions of Changed Meteorological Conditions and Emission to Substantial Reductions of PM2.5 Concentration from winter 2016 to 2017 in Central and Eastern China. Sci. Total Environ. 716, 136892. doi:10.1016/j.scitotenv.2020.136892
Zheng, Z., Ren, G., Wang, H., Dou, J., Gao, Z., Duan, C., et al. (2018). Relationship between Fine-Particle Pollution and the Urban Heat Island in Beijing, China: Observational Evidence. Boundary-layer Meteorol. 169 (1), 93–113. doi:10.1007/s10546-018-0362-6
Zou, B., Li, S., Lin, Y., Wang, B., Cao, S., Zhao, X., et al. (2020). Efforts in Reducing Air Pollution Exposure Risk in China: State versus Individuals. Environ. Int. 137, 105504. doi:10.1016/j.envint.2020.105504
Zou, B., Xu, S., Sternberg, T., and Fang, X. (2016). Effect of Land Use and Cover Change on Air Quality in Urban Sprawl. Sustainability 8, 677. doi:10.3390/su8070677
Keywords: fine particulate matter, land use and cover change, multiple linear regression model, changsha-zhuzhou-xiangtan urban agglomeration, remote sensing
Citation: Ding Y, Feng H, Zou B and Ye S (2022) Contribution Isolation of LUCC Impact on Regional PM2.5 Air Pollution: Implications for Sustainable Land and Environment Management. Front. Environ. Sci. 10:825732. doi: 10.3389/fenvs.2022.825732
Received: 30 November 2021; Accepted: 03 January 2022;
Published: 20 January 2022.
Edited by:
Xinyao Xie, Institute of Mountain Hazards and Environment (CAS), ChinaReviewed by:
Guicai Ning, Hong Kong Polytechnic University, Hong Kong SAR, ChinaCopyright © 2022 Ding, Feng, Zou and Ye. This is an open-access article distributed under the terms of the Creative Commons Attribution License (CC BY). The use, distribution or reproduction in other forums is permitted, provided the original author(s) and the copyright owner(s) are credited and that the original publication in this journal is cited, in accordance with accepted academic practice. No use, distribution or reproduction is permitted which does not comply with these terms.
*Correspondence: Huihui Feng, aGhmZW5nQGNzdS5lZHUuY24=
Disclaimer: All claims expressed in this article are solely those of the authors and do not necessarily represent those of their affiliated organizations, or those of the publisher, the editors and the reviewers. Any product that may be evaluated in this article or claim that may be made by its manufacturer is not guaranteed or endorsed by the publisher.
Research integrity at Frontiers
Learn more about the work of our research integrity team to safeguard the quality of each article we publish.