 Yongyang Wang1,2
 Gengyuan Liu2,3*
 Yanpeng Cai1
 Biagio F. Giannetti2,4
 Feni Agostinho2,4
 Cecilia M. V. B. Almeida2,4Marco Casazza5
- 1Key Laboratory for City Environmental Safety and Green Development of the Ministry of Education, Institute of Environmental and Ecological Engineering, Guangdong University of Technology, Guangzhou, China
- 2State Key Joint Laboratory of Environmental Simulation and Pollution Control, School of Environment, Beijing Normal University, Beijing, China
- 3Beijing Engineering Research Center for Watershed Environmental Restoration and Integrated Ecological Regulation, Beijing, China
- 4Paulista University, Graduate Program in Production Engineering, São Paulo, Brazil
- 5Department of Medicine, Surgery and Odontology “Scuola Medica Salernitana”, University of Salerno, Salerno, Italy
Agri-products have an impact on food security, ecology protection, and crucial strategic deployment. With this respect, the economic value of agri-products should be paralleled with a non-monetary assessment of ecological value for humans. This study set up an emergy-based life-cycle assessment (Em-LCA) framework to calculate the ecosystem service (ES) and ecosystem dis-services (EDS) that was applied to six typical crops, exploring the implementation path of the agricultural eco-product value. The results showed the agriculture system mainly depends on non-renewable resources. EDS generated by China’s agri-products is higher than the ES provided by them. Nevertheless, there is a low correlation between the current price of agri-products and their greenness, but, economic value presents a rising trend with agri-product greenness increasing. Further to discussing effective approaches to sustainable agriculture, it can be seen that 1) sustainable agriculture will lead to increased greenness, but it is impossible to improve greenness indefinitely. 2) Improving greenness is an effective way to implement ecological value, another way to preserve and raise ecological value is to reduce EDS generation. 3) Reducing energy consumption leads to a decrease in EDS but it is not an appropriate way to achieve sustainable development. These findings provide meaningful suggestions for decision-makers to realize the ecological value of agri-products.
1 Introduction
Crop systems provide an important material basis for human survival and development. Rapid population and economic growth are triggering an increase in crop demands, which, in turn, impacts the conversion of natural land for agriculture. Agricultural land covers nearly 40% of the ice-free land on Earth. Studies have forecasted that this expansion will be further accelerated in the next decades (Foley et al., 2011), growing by 18% in 2050 (Tilman et al., 2001). This acceleration impacts adversely on the environment. Preserving the natural system while meeting human demands for food has become a challenge that needs to be faced and solved and the implementation of eco-products is becoming more imperative. An eco-product is an ecosystem product derived from the interaction of biological and human productions (Yang et al., 2014).
An agricultural system not only provides products for human beings but also supports ecosystem services during the process of product growth, as well as some dis-services, such as soil and water pollution (Shah et al., 2019). However, the generation of ecosystem services by agri-products remains often unaccounted for in assessing their value.
There are still some challenges in the realization of eco-products. The first challenge is the definition of eco-products. The definition of eco-product is similar to ecosystem services, emphasizing the relationship between humans and nature (Costanza et al., 2014). Ecosystem services, deriving from 17 ecological function classes, were defined as benefits that human beings derive directly or indirectly from ecological functions (Costanza et al., 1998). De Groot divided ecological functions into four major categories and 25 sub-functions, including provision service, regulation service, habitat service, and information service (De Groot et al., 2002). In the characterization of ecosystem services, humans and ecosystems are considered separate systems.
Applying this approach, an eco-product is an economic product of human society produced by human labor. However, agriculture can combine these two dimensions, since agricultural products are generated by the joint action of humans and nature, exerting an impact on ecosystems and their services. This study defines an agricultural eco-product as an economic product, that can increase human well-being under the joint action of humans and nature.
A second challenge is the accounting and quantification of an ecological value. As noted earlier, our review examined the methods of quantifying the value of eco-products outlined in related literature (Table 1). However, most of the studies tend to reflect a value based on human preference, rather than one based on the natural contribution to agricultural activities (Franzese et al., 2017). The interdependence and interference of ecosystem services complicates the process of accurately capturing the economic value due to the risk of double counting (Van Oijstaeijen et al., 2020). Some theoretical methods and models, such as InVEST modeling often generate errors in the form of overestimation and double accounting, excluding the preservation of natural resources from the core purpose of the accounting process. In addition, current research on agricultural ecological value is mainly focused on the impact of agricultural land reduction on ecosystem services (Macfadyen et al., 2012; Marrero et al., 2016; Tang et al., 2018) as well as the relationship between food production and ecosystem services (Gordon et al., 2010; Barral et al., 2020). However, few scholars have discussed the ecological value of agriculture and the realization of the ecological value of agricultural production.
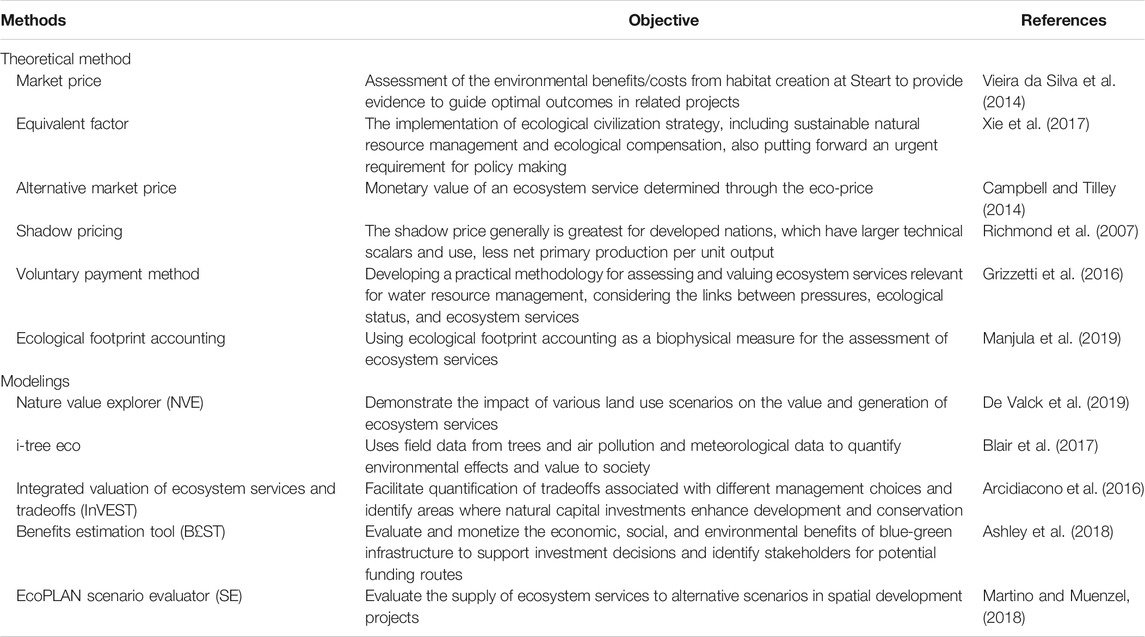
TABLE 1. Shortlist of methods for quantifying the value of eco-products.
To solve these problems, this study first defined the concept of agricultural eco-products and demarcated agricultural ecosystem services and boundaries. Then we established a non-monetary framework to quantify the ecosystem services and disservices of six typical crop systems in China based on a ternary value theory. An eco-efficiency indicator was adopted to evaluate the eco-efficiency performance of each agri-product. Finally, we further discussed whether the current market mechanism realizes the ecological value of the agri-products and explored the value of agricultural eco-product, and put forward the feasibility of the implementation of ecological value. All of these findings provide effective suggestions for decision-makers to develop sustainable agriculture and realize the value of eco-products.
2 Methods
2.1 The Classification of Agricultural Eco-Products
An agricultural eco-product has multi-dimensional features. One is economic, which is the object traded in the market to satisfy the human demand for food (Lu and Campbell, 2009). Another is ecological, being related to certain services provided to human beings (Ma et al., 2021). While economic features depend on agricultural production, ecological features are related to the services provided. These services, according to their functions, are classified into two categories, ecosystem services, and ecosystem dis-services. As shown in Figure 1, an agricultural ecosystem service is a benefit that humans get from the ecosystem. Among such processes, photosynthesis is one of the main mechanisms, providing services, such as food supply and carbon sequestration, and local microclimate regulation (Yang et al., 2020). Surface water remaining from plants absorption can penetrate the ground through soil cracks to recharge groundwater.
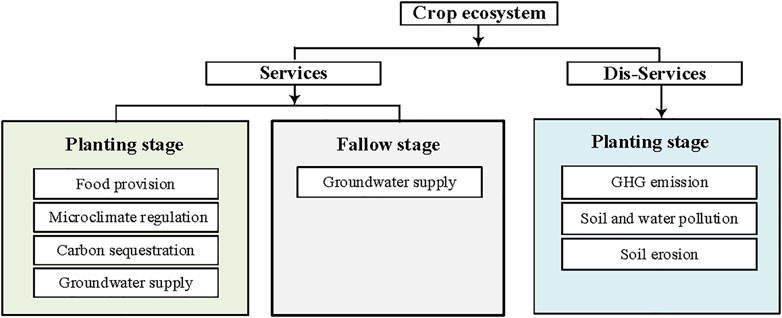
FIGURE 1. The classification of agricultural ecosystem services.
In this study, the time interval between two cultivation is a turnover year. Due to the short time of fallowing, crop residues were not enough time to generate corresponding soil nurturing services, so this study was left out.
Ecosystem dis-services are related to products or processes, that can cause harm to the environment during crop growth. For example, these include the use of excessive external resources, such as pesticides and fertilizers, that produce greenhouse gas emissions, as well as residual pesticides and fertilizers, that can cause soil and water pollution (Liu et al., 2021). Concurrently, other factors, such as steep terrain and widespread irrigation, can cause soil erosion. Besides, crop systems are harvested after crop maturity, thus, cultural and educational services are not considered in this study.
2.2 Short Review on Methods
Agriculture plays an important role in the economy of China. Being the premise and source of China’s economic development, to some extent, agricultural development determines the development of the national economy. As an important product in the foundation of the national economy, the features of agri-product are different from those of other industrial products. For example, the limitation of price reflection. The agri-product price adjusts resource allocation through the price mechanism and promotes a balance between total supply and demand. The price mechanism mainly consists of market prices and policy prices. The price fluctuation of agri-products is directly related to the immediate interests and enthusiasm of agricultural product producers.
Many scholars have studied the price of agri-products, and researchers have mainly focussed on the influencing factors of the price fluctuation of agricultural products, such as macro-policy (Mattila et al., 2010), inflation (Zhang et al., 2014), the impact of trade on agricultural prices (Bekkers et al., 2017), and others (Myers, 2006; Zilberman et al., 2013). Furthermore, some researchers used models to study agri-products price, Fox adopted a spatial equilibrium model to examine the implications of simultaneous equilibrium in three related markets: retail food, farm output, and marketing service, implications for the viability of simple markup pricing rules, and the determinants of the farmer’s share of the food dollar are discussed (Fox, 1953). The equilibrium movement model served to assess the price fluctuation and its transmission of agri-products from the perspective of industrial organization. A two-way price transmission model of agri-product acquisition to food retail link was deduced accordingly (Gardner, 1975). At the same time, new methods are being developed, such as the ARCH model (Engle, 1982) and general equilibrium model (Valdivia et al., 2012). Moreover, studies have examined the impact of consumer behavior on agri-product pricing (Gerbens-Leenes and Nonhebel, 2002). Naseem et al. investigated consumer preferences for various attributes of the rice market in Benin. They empirically analyzed the relationship between the price paid by consumers for their choice of rice and its attributes in the markets using hedonic pricing and discrete choice models of demand (Naseem et al., 2013). Yin et al. surveyed consumers from three cities in China, consequently establishing a logit model to analyze the main factors affecting consumers’ choice for organic food. Their result indicated that Chinese consumers’ intent to purchase organic food is strongly affected by factors such as income, degree of trust in organic food, degree of acceptance of organic food price, and concern about self-health (Yin et al., 2010). However, a few scholars have studied the ecological value and the pricing of agri-products based on ecological value.
2.3 Accounting Method and Analytical Indicators
2.3.1 Emergy-Based LCA Analysis
Life cycle thinking recognizes that all product life cycle stages generate environmental impacts that need to be evaluated and, then, reduced (Finnveden et al., 2009). During the past few decades, LCA has become a core element in environmental policy or voluntary actions in various countries (Guinee et al., 2011). This method, however, applies a “consumer-side” approach. Outside the LCA community, another environmental assessment method, emergy evaluation, is gaining international recognition and is increasingly being applied. Emergy was first introduced by Odum in the 1980s and is defined as the sum of the available energy required indirectly and directly to make a product or to provide a service (Odum, 1984). The emergy value of a resource can reflect the amount of past work a natural process uses to produce or regenerate it (Liu et al., 2019). All inputs that enter the systems are converted into emergy by multiplying relevant UEVs (Unit Emergy Value) (Wang et al., 2018). By accounting for the quantity and quality of input flows, keeping track of interactions among system components across scales, emergy provides a suitable systemic framework for assessing the performance and sustainability of processes (Geng et al., 2013). Emergy-based Life-Cycle Analysis (Em-LCA) accounting has been widely used to evaluate environmental impact in different fields (Duan et al., 2011; Gala et al., 2015; Wang et al., 2015). Through the Em-LCA method, various kinds of resources (i.e., energy, materials, information) are converted into a common measurement unit of solar energy equivalents (sej), giving uniform metrics to the system, and further proceed and are interpreted in terms of direct and potential ecosystems caused by environmental impact (van der Werf et al., 2020).
In LCA practice, labor is most often not accounted for as an energy input (Brown et al., 2012). However, in Em-LCA accounting, labor and services can be involved. The amount of input emergy per reference unit (e.g., energy; currency; information amount) is the unit emergy value (UEV), quantified as solar equivalent joule per unit. As a systematic method, it can be used to evaluate the interplay of economic, social, and environmental systems, aiming to obtain the integrated performance of sustainability (Liu et al., 2019).
Figure 2 represents a diagram of the crop production system to present emergy processes, storage, and flows. In particular, the diagram represents inflows of sunlight (i.e., solar radiation), wind, rain, and runoff chemical energy produced by irrigating farmland, which are the basic renewable sources included in the accounting of an agricultural production system. These resources are combined into processes, where other inputs are necessary to support the production of crops. Being represented as external circles, their flows are drawn as solid lines. These inputs include the use of fertilizers, pesticides, fuel, human labor, and services. Dashed black lines represent monetary flows. Dashed green lines represent the ecosystem services generated by the crop production system and the red lines represent ecosystem dis-services. Only renewable resources, as a primary input, flow into the system during the fallow period.
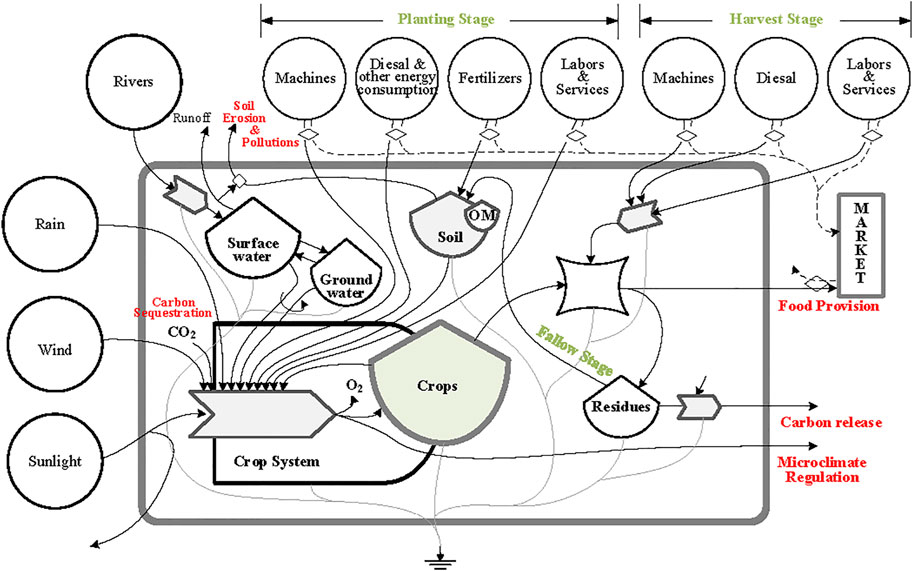
FIGURE 2. Emergy flow diagram of the crop system.
Based on the given emergy diagram, matter and energy flows can be divided into renewable resources and purchased resources. The inventory of system components used for the diagram is detailed in Table 1. Emergy flows and corresponding UEVs are calculated according to Eq. 1:
where Ei represents solar emergy (sej), fi represents ith input flow of energy or matters, UEVi represents the unit emergy value of the ith flow.
2.3.2 Agricultural Ecosystem Services and Dis-Services Accounting
In the agriculture system, renewable and human inputs together have performed various processes and functions to support services. At the same time, excessive external inputs also caused corresponding ecosystem dis-services. This study quantifies crop ecosystem services and dis-services.
2.3.2.1 Crop Ecosystem Services
1) Food Provision (FP)
Food supply is the agri-products provided by the crop ecosystem. In this paper, we define food supply as the total energy value input into the crop system. The calculation formula is as follows:
where EFP denotes food supply emergy (sej), R denotes renewable resources (sej), which is the sum of the maximum of sunlight, wind, and rain (chemical energy), and Irrigating water, P(Xi) represents emergy of i-th purchased resource (sej).
2) Microclimate Regulation (MR)
The crop ecosystem regulates microclimate by increasing humidity and rainfall, and decreasing temperature. The heat quantity absorbed by plants during evaporation equals the increase in humidity and the decrease in temperature in the ecosystem. Thus, the energy required for evaporation can be used to measure the increase in humidity and the decrease in temperature. The formula follows:
where EMR represents emergy required by evaporation (sej), ECE represents farmland evaporation (mm/year),
3) Carbon Sequestration (CS)
Carbon sequestration is a process through which atmospheric freely available carbon dioxide (CO2) is captured and stored through a natural process, occurring naturally in plants (photosynthesis) and soil for a long period of time (Granier and Tardieu, 1999). The formula follows:
where CP represents crop yields (g),
4) Groundwater Supply (GWS)
Groundwater recharge refers to the process of absorption by the soil of residual water, left by precipitation and crop irrigation. The calculation formula is:
During the fallow period of farmland, because there is no artificial input of irrigation water, the calculation formula changes as follows:
where EGS and EGSF represent the emergy of groundwater supply during the cultivated and fallow period respectively (sej), P represents precipitation (mm), A represents the irrigating area (m2), I represents the volume of irrigating water (m3),
2.3.2.2 Crop Ecosystem Dis-Services
1) GHG Emission (GE)
GHG emissions mainly come from CO2, CH4, and N2O emissions caused by human inputs human input of chemical fertilizers, pesticides, and diesel. In this study, according to ReCipe 2016, we used human health loss and ecosystem quality loss to measure dis-service caused by greenhouse gases, the details are as follows:
a) Human health loss
where EHL is the emergy of human health loss (sej), Mi is the quantity or mass of the i-th greenhouse gas released to the environment (kg/year). DALYi is the Disability Adjusted Life Years caused by the i-th greenhouse gas (capita*year/kg),
b) Ecosystem quality loss
where EEL is the emergy of agriculture ecosystem quality loss (sej), Mi is the quantity or mass of the i-th greenhouse pollutants released into the environment (kg/year), PDF i means the Potential species extinction ratio caused by the i-th greenhouse pollutant [(PDF*year)/kg], EBIO indicates the UEV of biomass (sej/year).
2) Soil and Water Pollution (SWP)
In agricultural production, people use numerous fertilizers and pesticides to increase crop yield. But excessive use of them leave a large number of pesticides in the soil, causing soil pollution, and affecting the sustainable operation of the agricultural system, with implications for human health through the food chain. Meanwhile, some pesticides flow into the river with runoff, causing water eutrophication and other pollution. In this paper, the loss of human health and ecosystem quality is used to measure soil and water pollution. The calculation formula is the same as (Eqs 7, 8).
3) Soil Erosion (SE)
From an agricultural perspective, soil erosion is defined as “the faster removal of topsoil from land used for agricultural purposes through tillage, wind, water or it is one of the main processes through human influence in critical zones” (Mattila et al., 2010). Soil erosion intensity is measured by hydrologic and topographic features. The formula follows:
where ESE is the emergy required by soil erosion, SE represents soil erosion (g/km2), A represents the cultivated area (km2), OM means organic matter content (%) (Zeng et al., 2011), G is the energy conversion coefficient (kcal/g), C means the conservation ration of Joule and Kcal (J/Kcal = 4,186), UEVE is the UEV of soil erosion (sej/J).
2.3.3 Greenness Assessment
Usually, the definition of greenness refers to surface vegetation coverage (Zhang et al., 2013; Gao et al., 2020). In recent years, some scholars have considered the associated greenness in relation to the production process, which is defined as the degree of environmental impact or environmental friendliness in the production process (Zhong and Chen, 2019). These definitions still suffer from the disadvantage of considering only natural or human systems separately.
In this paper, we consider the role of both natural and human systems, based on Em-LCA analysis, proposing an agri-product greenness, which is defined as the percentage of renewable resources used to the total resources used. The formula is as follows:
where R represents the emergy value of renewable, U represents the emergy value of the total resources. The higher this ratio, the more renewable resources the product used, indicating it is more environmentally friendly.
2.4 Eco-Efficiency Framework
Even though eco-products have been developed and people want to acquire them, there has been no measurement standard to date. This paper uses the eco-efficiency indicator to measure whether a product is an eco-product. Eco-efficiency is one of leading ideals of sustainable development (Janicke, 2008), which leads to economies, industries, or plants and can create a ‘win-win’ by simultaneously producing economic-business and environmental gains (Porter and Linde, 1999). Eco-efficiency is among the most commonly used concepts and approaches in environmental and ecological economics and international and national environmental policies (Hukkinen, 2003). The traditional Eco-efficiency indicator is the ratio between the cost and the impact generated along the life cycle of a product (Korhonen and Snäkin, 2015).
In this study, we considered the total cost multiplied by emdollar value as life cycle costing. The details can be seen in Appendix S3. Based on this, the eco-efficiency was calculated according to the Eq. 10. The higher the eco-efficiency score, the better the ecological performance achieved
Where EE is the indicator of eco-efficiency; costing is the cost of materials; Em ¥ is the ratio of Emergy and Currency; Dis-servicei is the i th dis-service.
2.5 Data Resources
In this study, data were collected from different sources including the China Statistic Yearbook 2016, China Rural Statistic Yearbook (2016), and China Water Resources Bulletin (2015). In addition, to verifying the data, some interviews with different stakeholders were conducted, such as National Agricultural product cost-benefit data collection. These additional interviews play an important role in improving the accuracy of data. The planetary emergy baseline in this study is 12.1E + 24 sej/yr (Brown and Ulgiati, 2016).
3 Results
3.1 China’s Agro-Product Ecosystem Services and Dis-Services
Figure 3 represents the emergy flows of six typical crop systems and the ecosystem services and the dis-services they generated. The results showed that renewable resources had the lowest input in the crops system. Among six typical crops, the oil plants and tubers process were the largest and lowest renewable inputs respectively, 1.70E+12 sej/kg and 7.7E+11 sej/kg. Human input was divided into cultivating and harvesting periods. In the cultivated stage, the human input in beans was the largest at 6.56E+13 sej/kg, and the oil plants were the highest during the fallow period, which was 1.98E+13 sej/kg.
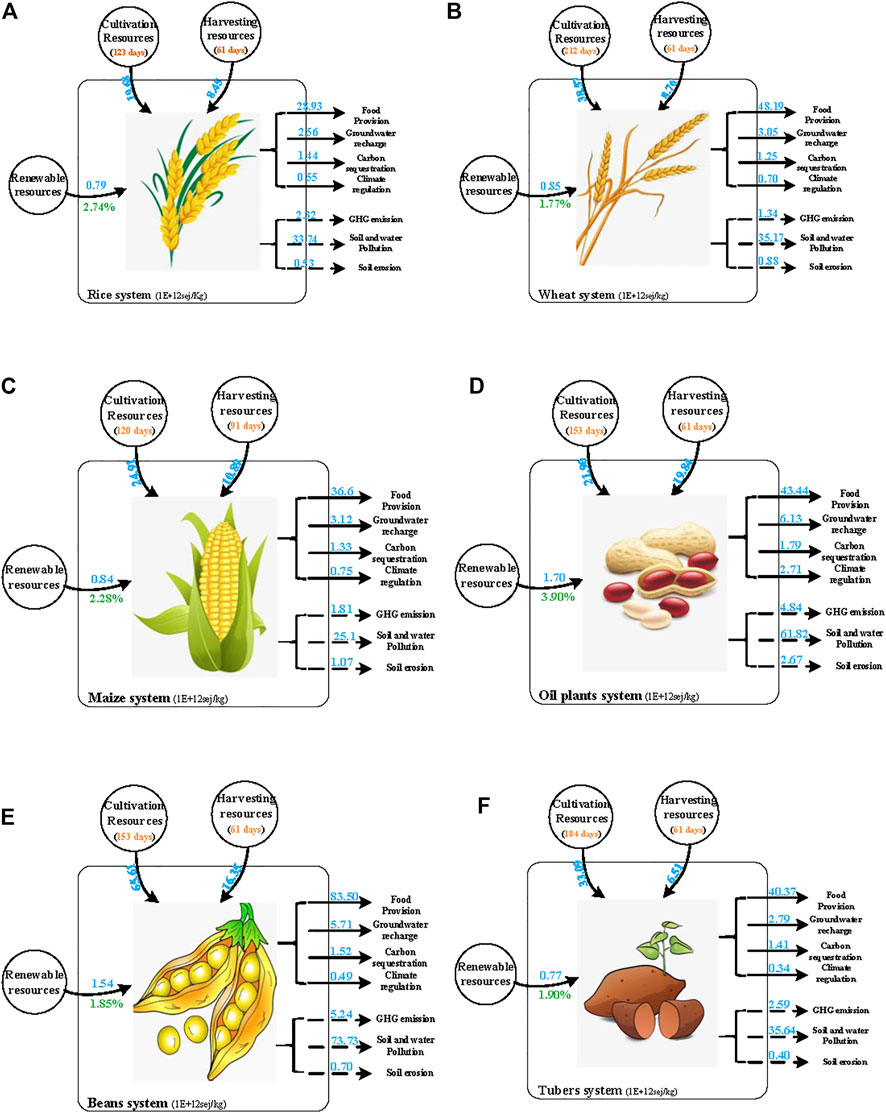
FIGURE 3. Ecosystem services (ES) and dis-services (EDS) diagrams for a set of typical Chinese crops: (A) rice; (B) wheat; (C) maize; (D) oil plants; (E) beans; (F) tubers.
The R% can reflect the degree of natural resources used and system sustainability. The R% of the typical crops are all lower than 5%, indicating that crops grow more depending on the external resources input that was controlled and dominated by humans. The highest and lowest were oil plants and wheat respectively, at 3.90% and 1.77%.
The ecosystem services provided by the crop system mainly include food supply, carbon sequestration, microclimate regulation, and groundwater recharge. Among them, the food supply service is the highest provided by the crops system. The highest food supply was derived from oil plants, with 8.35E+13 sej/kg, and rice with 2.83e+13 sej/kg, at the bottom. Groundwater recharge indicates that rainfall and irrigation are partially absorbed by crops, while part of the water flows underground through soil and rock cracks to recharge groundwater. Carbon sequestration is the lowest service provided by crops. On the whole, the main ecosystem service is food supply, other services constitute about 10% of the total. Although the crop system produces some ecosystem services to the surrounding environment by its photosynthesis, it makes a less ecological contribution to the environment.
The ecosystem dis-services include GHG emission, human health, and ecological quality loss caused by soil and water pollution and soil erosion. Soil and water pollution are the highest dis-services, the value of this service of rice, wheat, maize, oil plants, beans, and tubers are 3.37E+13 sej/kg, 3.52E+13 sej/kg, 2.51E+13 sej/kg, 6.18E+13 sej/kg,7.37E+13 sej/kg, 3.56E+13 sej/kg, respectively. GHG emissions are only lower than soil and water pollution, and that of beans and wheat was highest and lowest (5.24E+12 sej/kg and 1.34E+12 sej/kg), respectively. Soil and water pollution are the main ecosystem disservices, followed by the excessive production of crop systems while unscientific, unreasonable use of fertilizers and pesticides, and residues of fertilizers and pesticides can cause soil pollution. This surface runoff can flow into the river, leading to water pollution and producing a large number of ecological services for the ecological environment.
3.2 Spatial Distribution of Ecosystem Services and Dis-Services in China
Figure 4 synthesizes the results of crop ecosystem services and dis-services for the food supply service. Shanxi had the largest service. An agricultural province with sufficient agricultural cultivation resources and conditions, Shanxi has more than 10,000 hectares of cultivated land but little food supply service per hectare, indicating that the agricultural development of this province has not fully used cultivated land resources. On the contrary, although the cultivated area of Shanghai is only 345.6 thousand hectares, just higher than Beijing and Tibet, its grain yield per area is 7042 kg/ha, only lower than Jilin, which indicated that due to the limited area, Shanghai needs to obtain a higher yield from less planting area to meet social and market demands. For the microclimate regulation service, Shanxi is still the highest province and Shanxi is the lowest province. In the northwest region of China (Shannxi, Gansu, Qinghai, Ningxia, Xinjiang), due to higher temperatures, farmland has larger evapotranspiration compared to the region where the temperature is moderate, which led to the microclimate regulation service increasing.
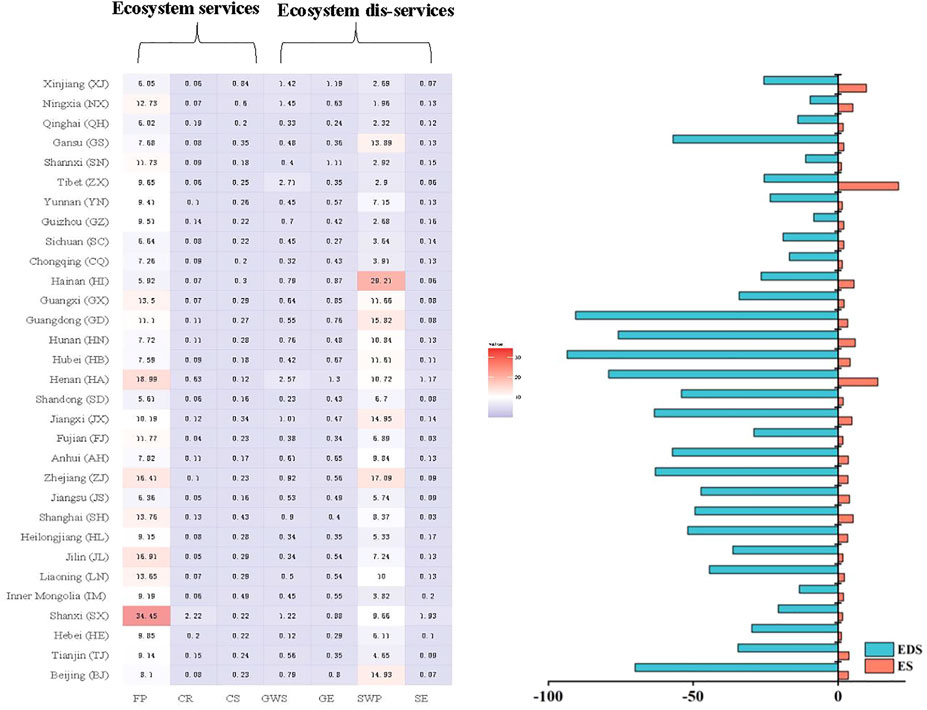
FIGURE 4. Ecosystem services and dis-services in each province in China (1E+12sej/kg).
Xinjiang and Jiangsu are the highest and lowest provinces in carbon sequestration services, respectively. Compared with the northern region, the southern region processes abundant rainfall, thus, except for the moisture absorbed by plants, there is still more water seeping into the ground to recharge groundwater.
For the ecosystem dis-service, Xinjiang is the province with the highest GHG emission service from crop systems among 31 provinces, 1.19E+12 sej/kg, the main reason is that it has a unique total power of agricultural machinery (2.3148E+7 kwh), which comes from the massive use of fossil fuels in the planting process. Due to the widespread use of pesticides and fertilizers per area in Beijing, a large number of pesticide residues lead have led to high soil and water pollution. The soil erosion service in Zhejiang province is the most serious among the 31 provinces, mainly because the terrain is complicated, mountains and hills occupy 70.4% of the land area, and the terrain slopes from southwest to northeast, which led to more serious soil erosion.
To avoid double accounting, the net ecosystem services (NES) is the sum of the maximum ecosystem services expected for food supply and ecosystem dis-services (Yang et al., 2018). In Figure 4, it can be seen that the ecosystem dis-services generated in the production process of the vast majority of crop systems were much higher than the ecosystem services brought by them, by about 10 times. Hainan (1.16E+13 sej/kg) had the highest ecosystem services in the 31 provinces (about 10 times that of Ningxia), which mainly comes from the soil and water pollution service, the use of fertilizers in Hainan made it one of the highest of the 31 provinces, at approximately 4.71 g per farmland area. Ningxia had only one over ten, 0.21 g, residues of pesticides causing water and soil pollution. Henan supported a high level of ecosystem services with abundant cultivated conditions, with an agricultural sown area of 14,425 thousand hectares, the highest in 31 provinces, and rainfall and land conditions that are suitable for crop cultivation.
Figure 5 represents a map of the spatial distribution of net ecosystem services value. The net ecosystem service value was mainly concentrated in Hebei, Shandong, Henan in Northern China. The main reason is that these provinces have rich land resources. The cultivated land there occupied 21% of the total arable land in China. This widely cultivated area increases the profits of the three provinces. The agricultural output accounts for 22.5% of the national output. Based on the characteristics of ecosystem services and dis-services, the 31 provinces can be classified into three categories: low service and high dis-service, Middle service and middle dis-service, and High service and low dis-service. Hainan, Beijing, Gansu, and Zhejiang are in the Low service and high dis-service group, Hainan is the highest amount of fertilizers per unit area among all provinces (4.71 g/m2). While Beijing has the highest mechanical power using per unit area (1.77 kwh/ha). The terrain of Zhejiang has a decreasing trend from south to north, mainly due to it having hilly mountains. Henan, Xinjiang, Ningxia, and Tibet are in the High service and low dis-service category. Henan provides the highest ecosystem service because it has rich farming conditions. The agricultural planting area is about 14.425 million hectares, which is the highest of the 31 provinces, and the fertilizers used per unit area in Ningxia 0.21 g/m2, which is only 1/20 of Hainan. Tibet is more focused on the development of other industries, and the arable area is just higher than that of Beijing and Shanghai. Less agricultural cultivation may bring fewer dis-services. The other provinces are in the Middle service and middle dis-service category.
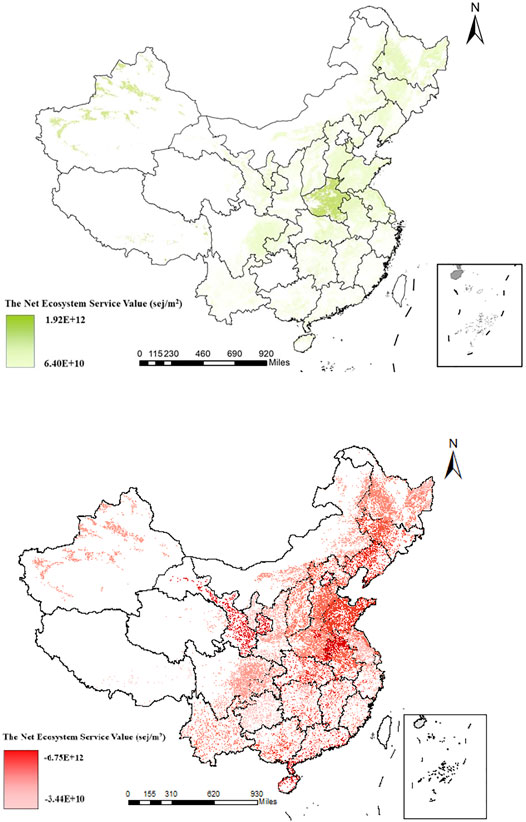
FIGURE 5. The spatial distribution of the net ecosystem services value.
3.3 Correlation Analysis of Greenness and Market Price
At present, agri-products have been priced in the market, however, as we do not know whether there is a correlation between current agri-product market prices and their greenness we further explored this situation. Table 2 shows the current agri-product price and greenness (R%). The details of the calculation process can be seen in the Appendix. By analyzing the correlation between the agri-product price and greenness of each province, it can be seen in Figure 6A that, under the market equilibrium of agri-products in China, the price of typical agri-products is relatively stable and has a low correlation with the greenness of products (R2 < 0.1), the price of agri-products is more determined by market demand. If the greenness of the agri-products is considered, as shown in Figure 6B, the results show that the price of agri-products increases with the increase of greenness, and the correlation between them is high (p > 0.75, R2 > 0.5). Meanwhile, various agri-product price increase range is different, indicating that the improvement of the degree to which they are green is one of the important reasons for improving the price of agri-products, which is also one of the directions that could help us further realize the value of agri-products.
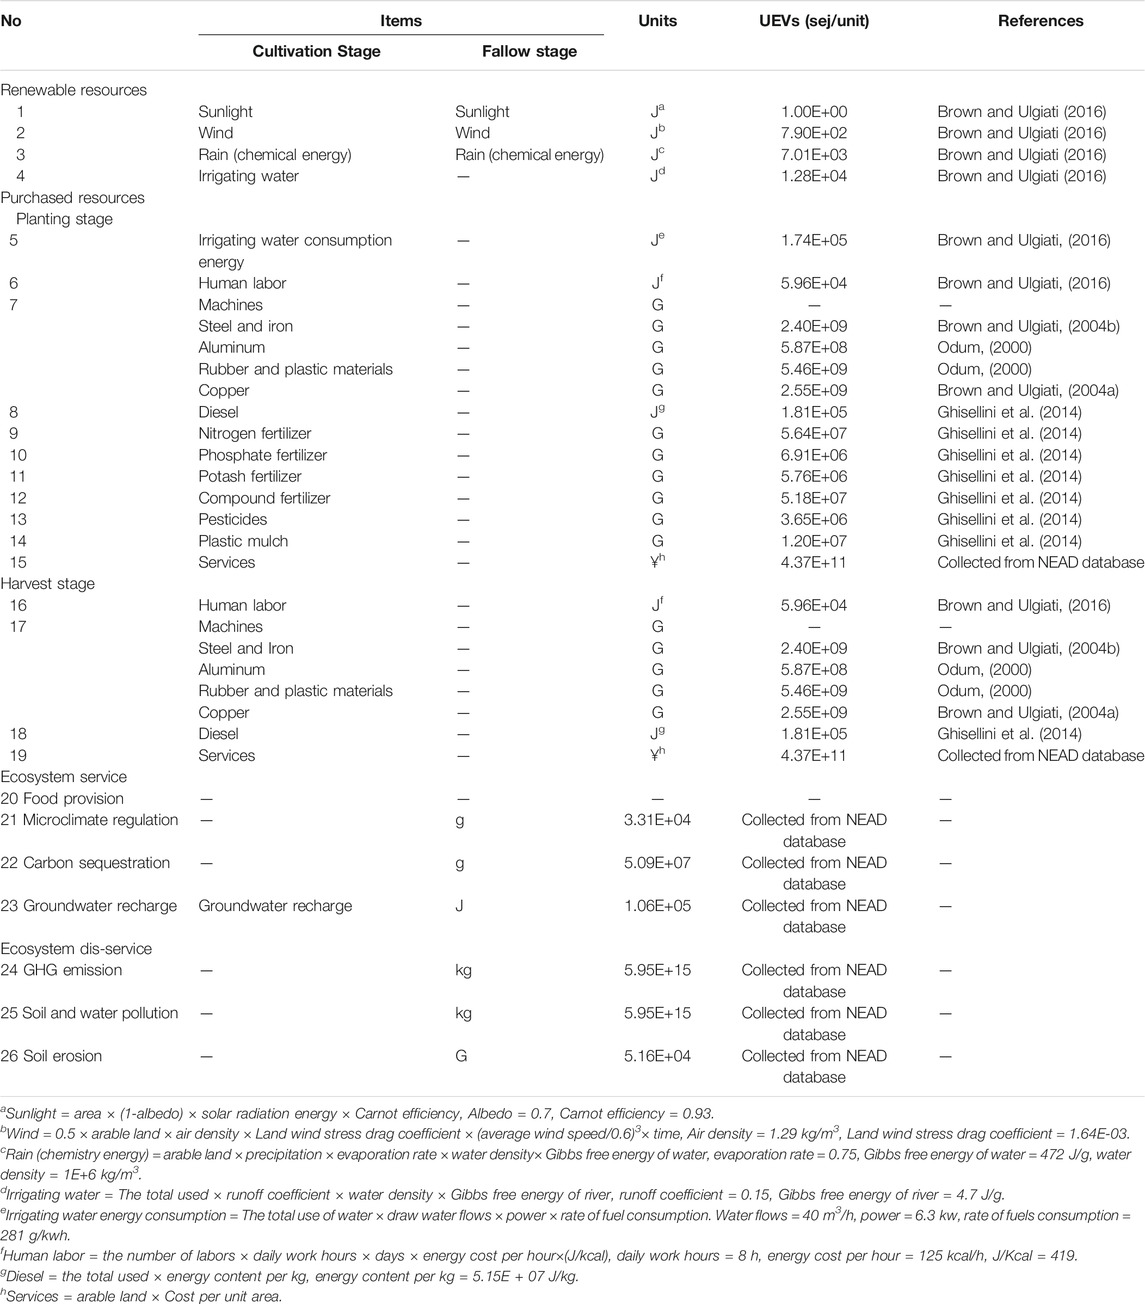
TABLE 2. Emergy flows and corresponding unit emergy values (UEVs).
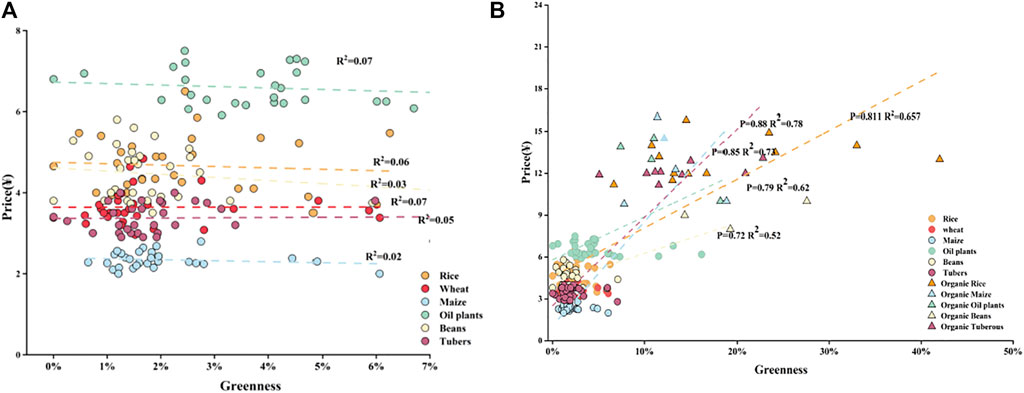
FIGURE 6. Greenness (A) and price (B) of typical agricultural products.
3.4 Eco-Efficiency Indicator for Each Agri-Products
Based on the total cost as well as Em-LCA results, the eco-efficiency scores of each crop were calculated for each dis-service according to Eq. 10. The corresponding results are presented in Tables 3, 4, the higher the score in each category, the better the eco-efficiency performance achieved. The soil erosion related eco-efficiency of Shanghai and Shanxi are, in particular, far higher than other provinces, mainly caused by the slope of the terrain. Soil and water pollution had the lowest eco-efficiency due to the excessive amount of fertilizers and pesticides used. Compared to six typical crops, grain and oil plants are the largest and lowest performing in terms of eco-efficiency, respectively, which puts more pressure on the ecology and requires the adjustment of the crop planting process. The wheat cultivation in Jilin and Shanghai, with high eco-efficiency scores, were triggered by lower cultivation conditions. The cultivated area of wheat in Jilin is 0.3 thousand hectares that smaller than Beijing (20.8 thousand hectares). Furthermore, in sum, the eco-efficiency in the eastern region is higher than that of the western region. The main reason for this is that the agricultural planting process is more efficient with a high degree of mechanization.
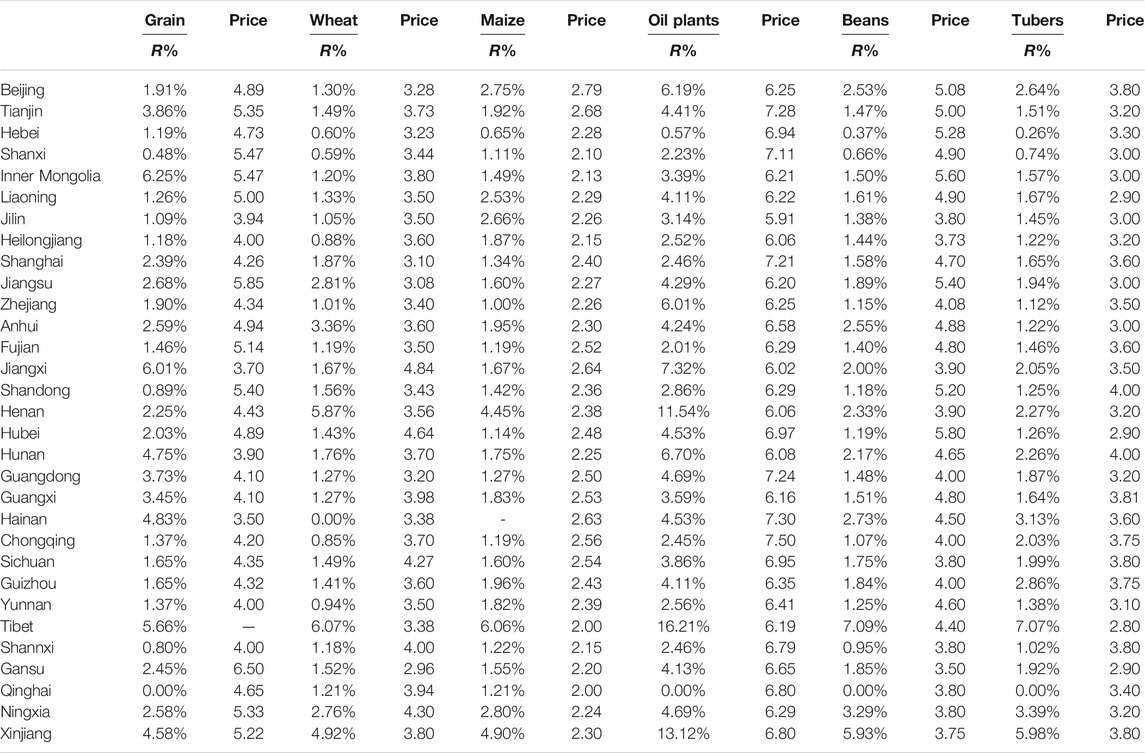
TABLE 3. The greenness (R%) and average annual price (¥/kg) of typical agricultural products in different provinces.
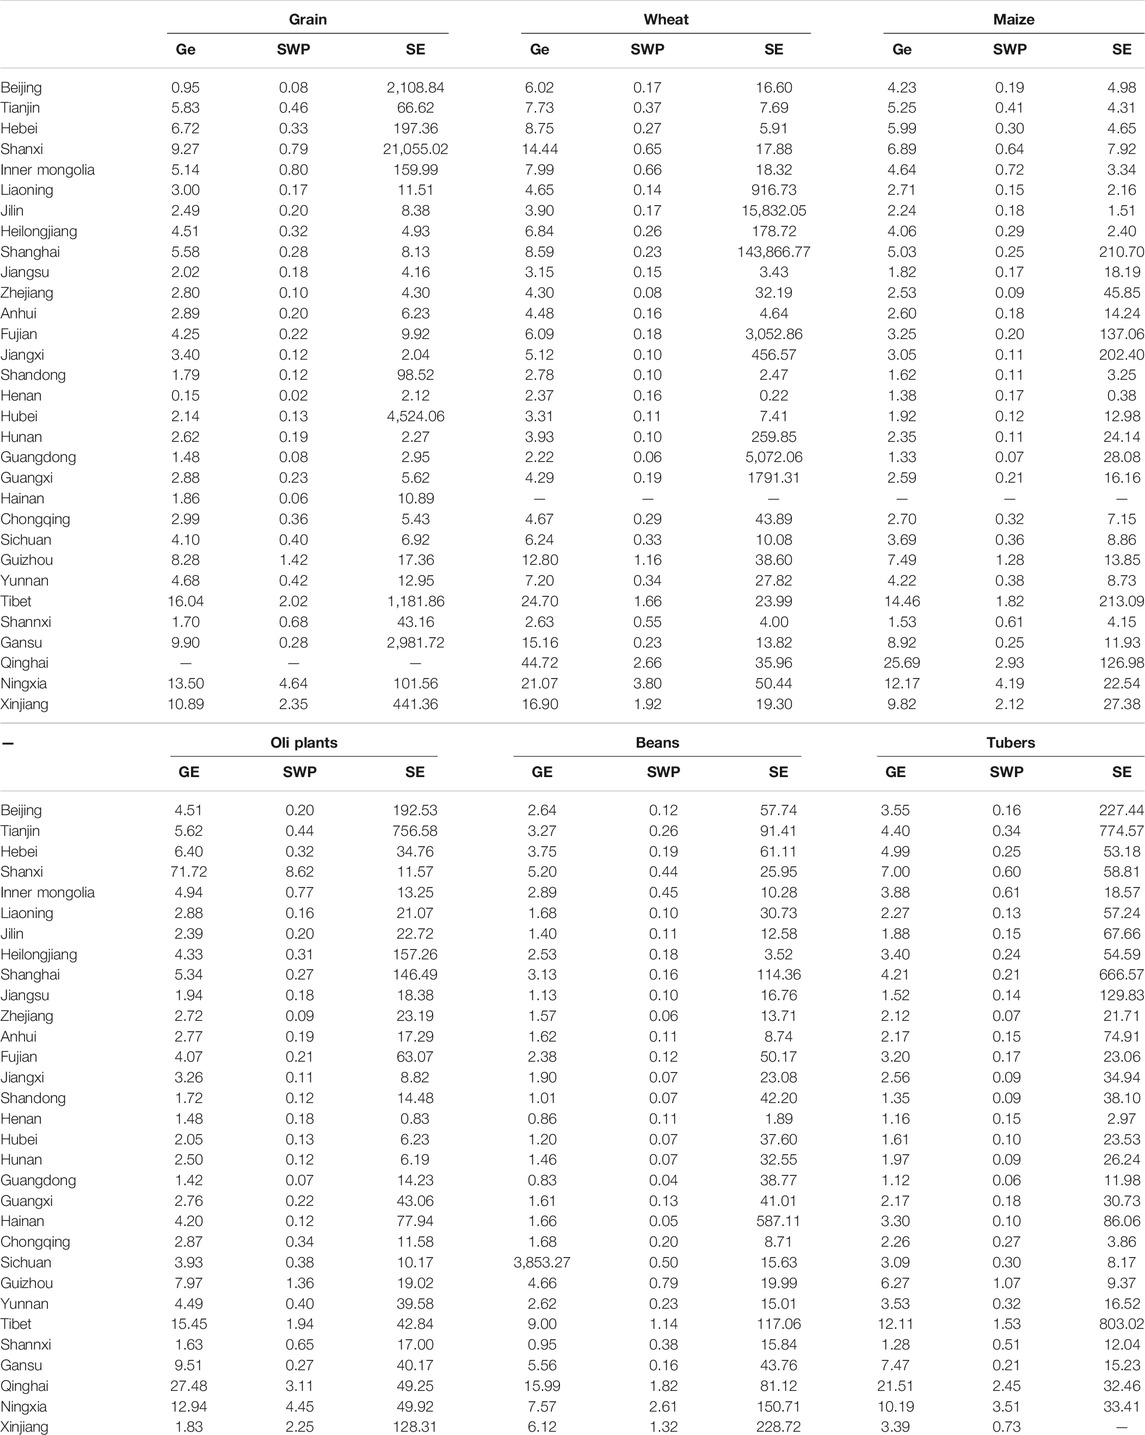
TABLE 4. The eco-efficiency (EE) of each crop in 31 provinces.
4 Discussion
4.1 The Value of Ecosystem Services and Dis-Services for Typical Crop Systems
In this study, an emergy-based Life Cycle Analysis (Em-LCA) was established to quantify the ecosystem services and dis-services for the typical crop system. The results showed that the R% of the typical crop system in China was less than 5%, demonstrating that the growth of the current crops was dominated by humans. Compared with Italy’s agricultural system (R% equals 29%) (Ghisellini et al., 2014), China’s agriculture is still on the path to sustainable development, and more measures need to be taken to improve sustainability.
Food supply service was the largest ecosystem service provided by the crop systems, which contributed about 90% of the total ecosystem services. The highest dis-service was the soil and water pollution service. The dis-service of crop systems was much higher than the other services, indicating that crop systems have a huge potential impact on the environment from an ecological perspective. The highest region was mainly concentrated in northern China, with rich land resources.
4.2 Impact of Greenness on Sustainable Agriculture
Agri-products quality affects the physical and mental health of consumers and received more and more attention from society and government, more traditional agri-products are transformed into organic or green agri-products through the improvement of greenness. In this study, we assume that certain external resource input levels reached that of developed countries, such as mechanical efficiency, irrigation regime. But that only changes improvement of the resources used efficiency, the cultivation pattern remains the same. This could be one way to achieve sustainable agriculture, nevertheless, simply increasing the efficiency of resource utilization does not meet the requirement of sustainable agriculture. In our opinion, sustainable agriculture is not only achieved through the long-time resources used, but also the synergy between nature, ecology, society, and maximizing agricultural production. Sustainable agriculture will naturally lead to greenness increasing. For example, farmers who adopt circular agriculture can improve greenness and meet food demands. Su et al. evaluate the overall performance of traditional rice systems, integrated farming, and non-point production system. The results indicate that economic benefits increase by 2.32–2.35 times and the agricultural non-point source pollution decreases by 10.21%–59.01% in comparison with rice monoculture, and that the R% will reach 45% (Su et al., 2020a).
Greenness in this study is defined as the rate of renewable inputs to the total input. However, with respect to each province, only a small part of renewable inputs are used for agricultural production. Table 5 lists the renewable resource input of each province and agri-products, it can be seen that the percentage of the renewable inputs of agri-products to the total renewable inputs is lower than 1%, except for Shanghai, Jiangsu, Anhui, Shandong, Henan, and Hainan, indicating that the use of renewable resources in agriculture is relatively low and that renewable resources are not used fully. Meanwhile, the relation of Greenness and agricultural yield, due to lack of corresponding experience data cannot directly ensure the relation of greenness to production. However, some researchers have proven that appropriately increasing the use of renewable resources attributes to yield improvement (Faramarzi et al., 2010). Despite this, agri-products currently depend more on non-renewable resources, which means that agriculture is still based on “potatoes made of oil”. Thus, increasing Greenness in agriculture is another way to achieve sustainable agriculture.
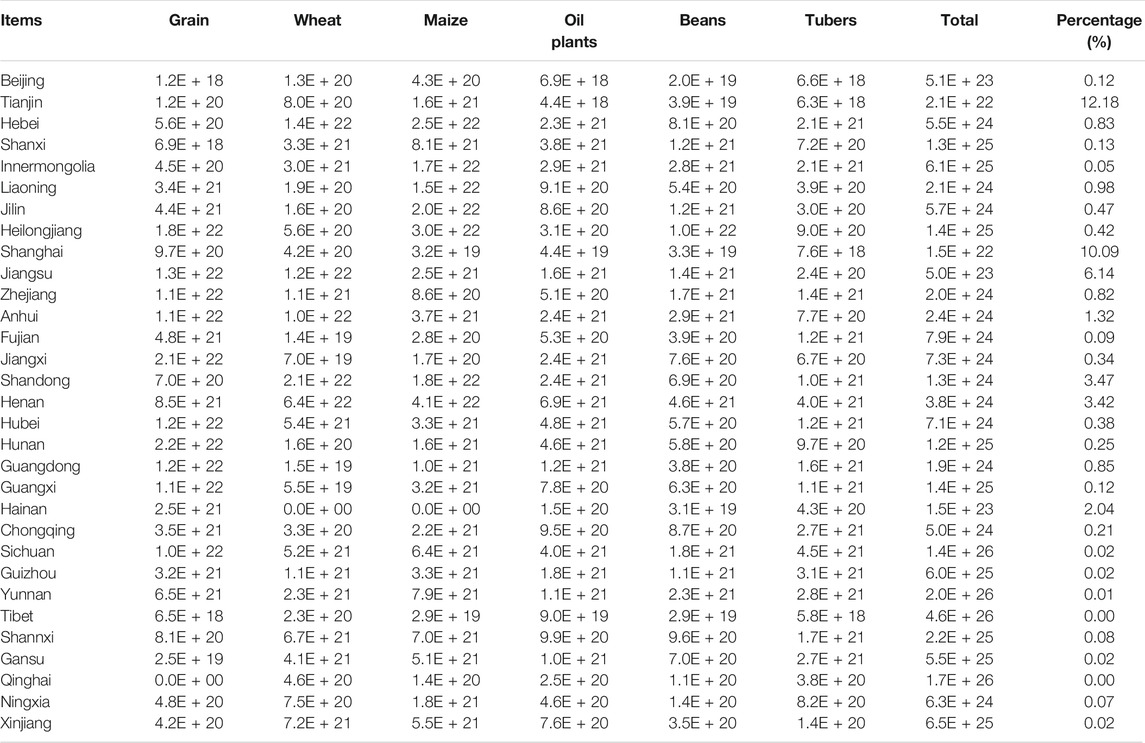
TABLE 5. The renewable inputs of each province and agri-products.
Simultaneously, there are physical limits to greenness, and it is impossible to increase greenness without limit. Table 6 presents the natural resources and the maximum proportion of theoretical renewable resources in the current planting pattern. The calculation detail can be seen in Appendix, showing that, in Tianjin, Hebei Shanxi, Inner Mongolia, Liaoning, Jilin Heilongjiang, and Ningxia, the rate of renewable resources is relatively low, indicating that the amount of renewable resources available for agricultural development is relatively small. The reason for this is that the agricultural water consumption in these provinces is higher than total local water resources, regardless of the transfer of water from other places. On the contrary, the rate of maximum renewable resources in Tibet can reach 97.5%, but that is under ideal conditions, and not the case in reality. Thus, improving the renewable resource input can increase greenness, but there is a physical limit as it only changes the cultivation mode, and developing a circular mode is better for realizing the sustainable development of agriculture.
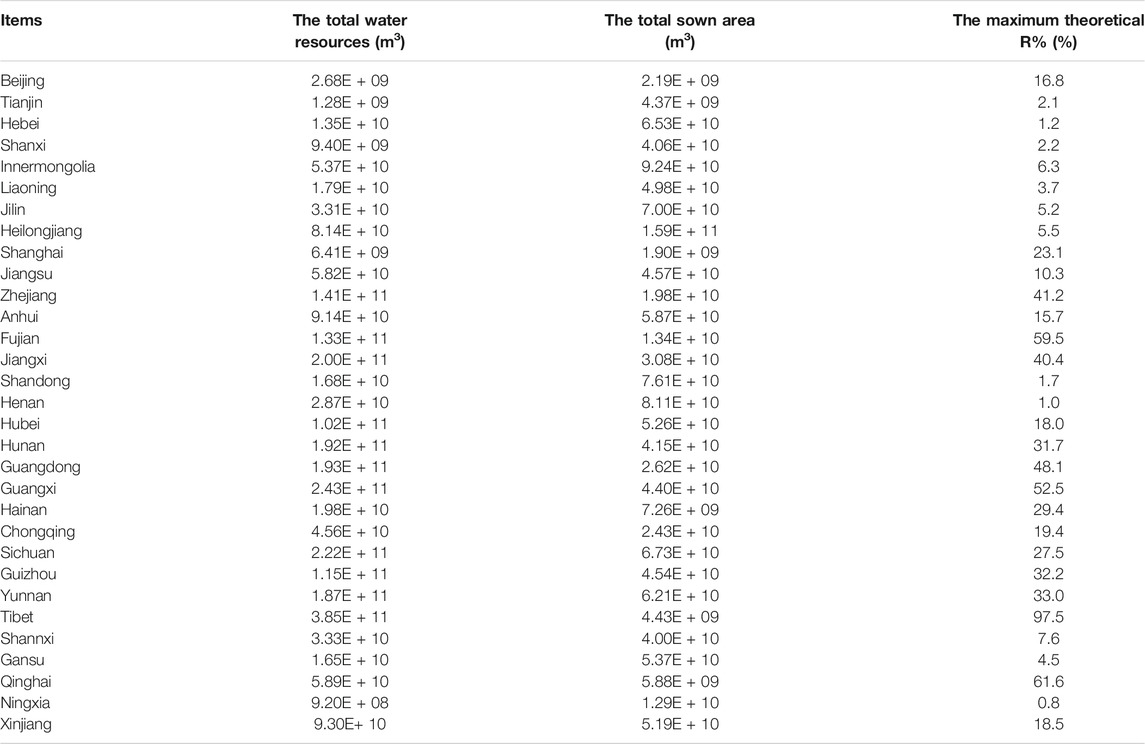
TABLE 6. The natural resources and maximum proportion of theoretical renewable resources.
4.3 Impact of Greenness Enhancement on Ecosystem Services
This study calculates the ecosystem services and dis-services of China’s crop system. The results show that the ecosystem dis-services produced by the agricultural production process in China’s agricultural system are higher than the ecosystem service. The particularity of agriculture needs to further explore whether the accounting of overall ecosystem services should consider agricultural ecosystem services, according to the calculation of other ecosystem ecological services by Qing Yang et al. (2019), Yang et al. (2019), Yang et al. (2020), as seen in Table 7, compared to other ecosystem services, the contribution rate of crop systems is about 25%, with Henan province taking the highest proportion. Thus, we can conclude that the agricultural ecosystem should be considered when calculating overall ecosystem services.
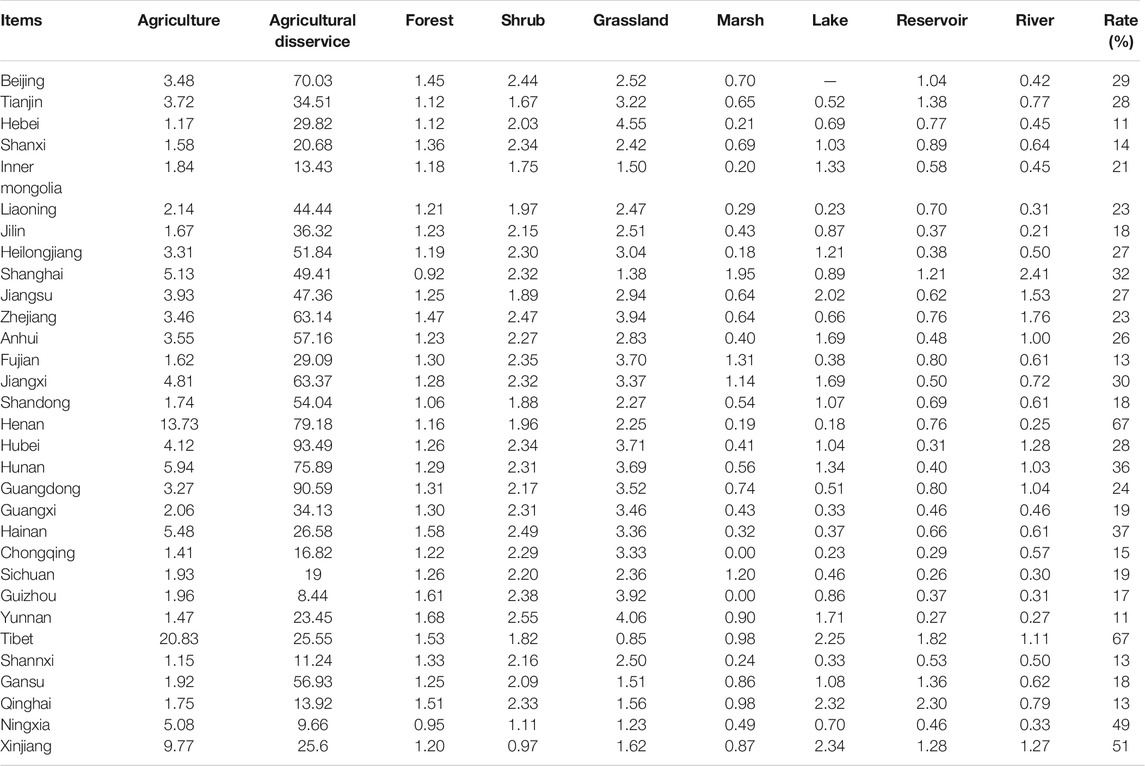
TABLE 7. Ecosystem service value of different ecosystem.
However, the ecosystem services produced by crop systems are higher than that of other ecosystems. It is important to develop solutions for the challenging issue of maintaining ecosystem services while reducing ecosystem dis-services. Improving greenness is an effective way to achieve this goal. According to previous results, the dis-services mainly come from fertilizers and fossil energy. An improvement in greenness means that the use of external resources in the production process will be reduced, and at the same time, the dis-service will be reduced. For ecosystem services, the service provided by the agricultural ecosystem mainly depends on plant photosynthesis and the physical and chemical properties of the soil, so the improvement in greenness does not necessarily lead to an improvement of ecosystem services. Instead, more effective use of cultivated land is needed. Within a reasonable range, maximizing the planting of crops in a certain planting area is one method of improving ecosystem services.
4.3 Impact of Energy Consumption on Ecosystem Services
While the agriculture system achieves the yields that humans demand, it often brings energy consumption, which causes the dis-services generated. Agricultural energy consumption mainly comes from irrigating water and mechanical farming. Thus, improving irrigation and mechanical use efficiency will lead to reductions in energy consumption. Table 8 shows the energy use efficiency of China’s agriculture and that of other developed countries, comparing ecosystem services and dis-services. The results show that ecosystem services and dis-services decrease in all provinces. Reasonable reduction in energy consumption will cause ecosystem dis-services to decrease but ecosystem services will also be reduced at the same time. Although this method is beneficial to the environment and ecology, the yields may not meet human needs, Enhancing energy use efficiency is not a suitable way of achieving sustainable agriculture. Based on this, some scholars have proposed the concept of organic agriculture. Organic agriculture refers to a farming system that enhances soil fertility through maximizing the efficient use of resources while foregoing the use of agrochemicals, as well as that of many synthetic compounds, which are used as food additives (Siegmeier and Moeller, 2013). Organic agriculture relies on a number of farming practices based on ecological cycles, and aims at minimizing the environmental impact of the food industry, preserving the long-term sustainability of soil, and reducing the use of non-renewable resources (Gomiero et al., 2011). Organic agriculture proposes a pathway to realizing sustainable agriculture and reconciling the relationship between nature, society, and the economy.
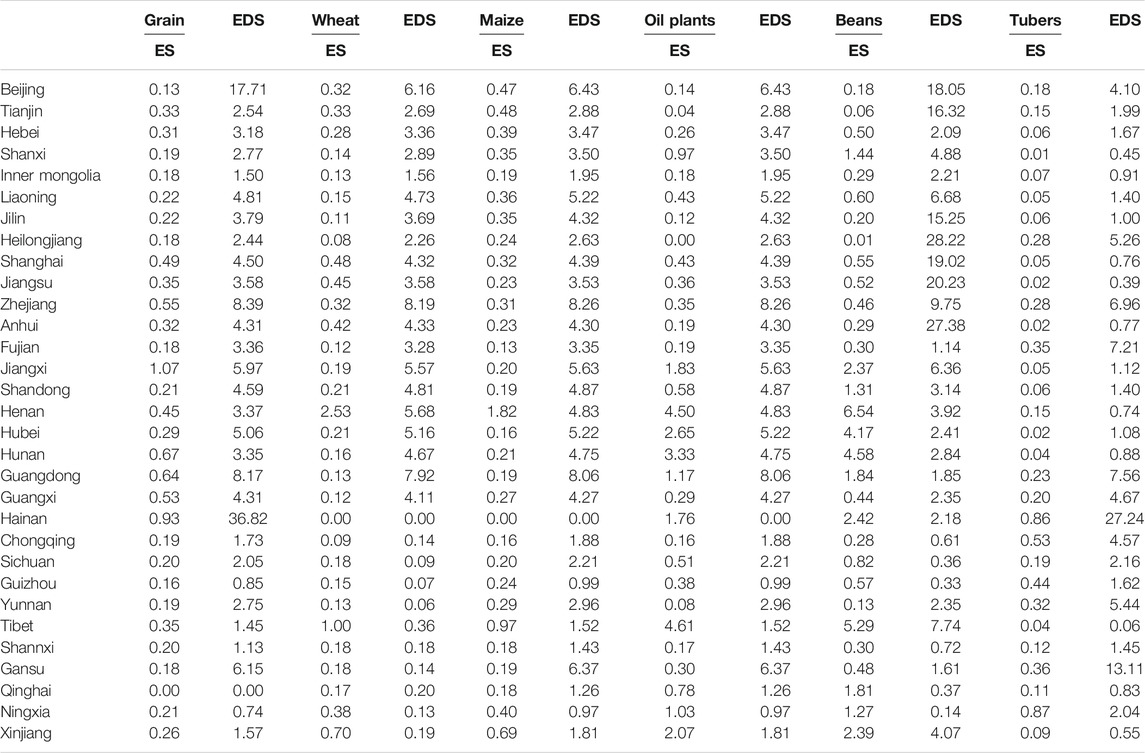
TABLE 8. The ecosystem service value of different ecosystems in energy consumption reduction scenarios.
4.4 Policy Implication
It is necessary to find solutions to develop sustainable agriculture that balance ecology and production. This study presents several suggestions.
1) The production of the agricultural system was mainly dominated by fertilizers and pesticides which are major sources of pollution. Thus, the government should implement a series of policies to strengthen the management of pesticides and fertilizers. First, improving the ability of pesticides and fertilizers to guarantee food security and ensuring the quality and safety of agricultural production through the formulation and implementation of policies (Zheng et al., 2020). Second, promoting rational positioning and coordinated development of the pesticide industry in various regions. Vigorously enhancing industrial agglomeration, accelerating the concentration of pesticide enterprises in professional parks or chemical industry clusters, reducing production dispersion, and reducing point source pollution (Zulfiqar and Thapa, 2017).
2) Improving energy efficiency and the use of local renewable resources. The intensive use of fossil fuels caused an increase in local ecological pressure. Thus, it is crucial to optimize local energy structures by encouraging more renewable and clean energy sources (such as solar power, wind power, and geothermal power) and improving energy efficiency by promoting more energy efficient technologies and equipment (Lou et al., 2015). Meanwhile, farming skills that can reduce energy use should be taught to agricultural workers to make more efficient use of energy.
3) Circular agriculture should be developed. Circulating agriculture is a comprehensive management model that organically links planting, animal husbandry, fishery, and processing industries. Su et al. presented an emergy assessment of three Chinese agricultural farming categories, including traditional cropping systems, integrated ecoagricultural framing systems (i.e., rich-fish and rich-duck), and the currently booming NGP activities (i.e., nursery plantation, pond fish farming, vegetable production, and duck rearing), which demonstrate considerable differences among the seven investigated systems, with the R% of integrated rice-fish (54.66%) being the highest and the R% of pond fish farming (5.53%) being the lowest (Su et al., 2020b). A virtual cycle of the overall ecological chain can be formed to propose feasible schemes to solve agricultural pollution problems and save agricultural resources while improving the output effect of agricultural products and realizing a balanced development of ecology and economy.
4.5 Limitations and Future Research
There are some limitations to this study. The data are mainly from the China Statistical Yearbook, China Rural Statistical Yearbook, and other relevant literature. More results could be considered due to the availability of data, due to biodiversity loss, and accurate data not being available, meaning some calculations were not carried out. Therefore, more data should be obtained in future studies, and the ecosystem services and dis-service between organic agriculture, traditional agriculture, and circular agriculture should be compared.
5 Conclusion
This research proposed an Em-LCA analysis framework to account for the ecosystem services and dis-services of six typical crop systems. Ecosystem services include food supply, local microclimate regulation, carbon sequestration, and groundwater recharge, and ecosystem dis-services include GHG emissions, water and soil pollution, and soil erosion. The results showed that the R% of the six typical crops in China are all less than 5%, and their development relies more on external resources, causing more ecosystem dis-service generation. Although ecosystem services are also produced, they account for only approximately one-tenth of the ecological services. From the perspective of spatial distribution, the provinces with the highest net ecosystem service value are mainly concentrated in places with more cultivated land resources, such as Henan, Shandong, and Hebei. In addition, this study found that the current market price of agricultural leather has a low correlation with the greenness of the product. Agriculture is a semi-artificial ecosystem, and the more external resources are invested, the more yields can meet the needs of human society and provide more benefits. However, greenness cannot be improved indefinitely. At the present stage of social and economic development, secondary and tertiary industries need more resources to promote social progress. Agriculture has fewer renewable resources to use and needs to maintain food security and the risk factors of agricultural waste and by-products (Donner et al., 2021), which represent major challenges for sustainable agriculture. Furthermore, compared to reducing energy consumption without changing farming practices, organic farming is a suitable way to increase ecological value. Nevertheless, part of the income obtained by agricultural products can compensate for the dis-services brought by the production process of products, such as greenhouse gases, etc., and reduce the dis-services by appropriately subsidizing forest and wetland ecosystems, which might be one way to realize the value of eco-products. This study analyzes the current crop system in China from an ecological perspective, and interpreted its impact on the ecological environment, providing a method of accounting for the value of agricultural eco-products.
Data Availability Statement
The original contributions presented in the study are included in the article/Supplementary Material, further inquiries can be directed to the corresponding author.
Author Contributions
GL was responsible for overall project supervision, conceptualization, data curation and project management; YW, GL, YC, and MC contributed to methodology development, conducted validation, and contributed to the writing of early drafts and final draft review and editing; BG, FA, and CA were instrumental in formal analysis of data.
Funding
This study is supported by the National Natural Science Foundation (No. 52070021) and the 111 Project (No. B17005).
Conflict of Interest
The authors declare that the research was conducted in the absence of any commercial or financial relationships that could be construed as a potential conflict of interest.
Publisher’s Note
All claims expressed in this article are solely those of the authors and do not necessarily represent those of their affiliated organizations, or those of the publisher, the editors and the reviewers. Any product that may be evaluated in this article, or claim that may be made by its manufacturer, is not guaranteed or endorsed by the publisher.
Supplementary Material
The Supplementary Material for this article can be found online at: https://www.frontiersin.org/articles/10.3389/fenvs.2022.824275/full#supplementary-material
Abbreviations
CS, carbon sequestration; Em-LCA, emergy-based life-cycle assessment; ES, ecosystem services; EDS, ecosystem dis-services; FP, food provision; GE, greenhouse gas Emission; GWS, groundwater supply; MR, microclimate regulation; NESV, net ecosystem service value; SE, soil erosion; SWP, soil and water pollution.
References
Arcidiacono, A., Ronchi, S., and Salata, S. (2016). Managing Multiple Ecosystem Services for Landscape Conservation: A Green Infrastructure in Lombardy Region. Proced. Eng. 161, 2297–2303. doi:10.1016/j.proeng.2016.08.831
Ashley, R., Gersonius, B., Digman, C., Horton, B., Smith, B., and Shaffer, P. (2018). Including Uncertainty in Valuing Blue and green Infrastructure for Stormwater Management. Ecosystem Serv. 33, 237–246. doi:10.1016/j.ecoser.2018.08.011
Barral, M. P., Villarino, S., Levers, C., Baumann, M., Kuemmerle, T., and Mastrangelo, M. (2020). Widespread and Major Losses in Multiple Ecosystem Services as a Result of Agricultural Expansion in the Argentine Chaco. J. Appl. Ecol. 57 (12), 2485–2498. doi:10.1111/1365-2664.13740
Bekkers, E., Brockmeier, M., Francois, J., and Yang, F. (2017). Local Food Prices and International Price Transmission. World Dev. 96, 216–230. doi:10.1111/1365-2664.13740
Blair, J., Roldan, C., Ghosh, S., and Yung, S.-H. (2017). Greening Rail Infrastructure for Carbon Benefits. Proced. Eng. 180, 1716–1724. doi:10.1016/j.proeng.2017.04.334
Brown, M. T., and Ulgiati, S. (2004a). Energy Quality, Emergy, and Transformity: H.T. Odum’s Contributions to Quantifying and Understanding Systems. Ecol. Model. 178 (1), 201–213. doi:10.1016/j.ecolmodel.2004.03.002
Brown, M. T., and Ulgiati, S. (2004b). Energy Quality, Emergy, and Transformity: H.T. Odum’s Contributions to Quantifying and Understanding Systems. Ecol. Model. 178 (1-2), 201–213. doi:10.1016/j.ecolmodel.2004.03.002
Brown, M. T., Raugei, M., and Ulgiati, S. (2012). On Boundaries and 'investments' in Emergy Synthesis and LCA: A Case Study on thermal vs. Photovoltaic Electricity. Ecol. Indicators 15 (1), 227–235. doi:10.1016/j.ecolind.2011.09.021
Brown, M. T., and Ulgiati, S. (2016). Assessing the Global Environmental Sources Driving the Geobiosphere: A Revised Emergy Baseline. Ecol. Model. 339, 126–132. doi:10.1016/j.ecolmodel.2016.03.017
Campbell, E. T., and Tilley, D. R. (2014). Valuing Ecosystem Services from Maryland Forests Using Environmental Accounting. Ecosystem Serv. 7, 141–151. doi:10.1016/j.ecoser.2013.10.003
Costanza, R., D'arge, R., De Groot, R., Farber, S., Grasso, M., Hannon, B., et al. (1998). The Value of the World's Ecosystem Services and Natural Capital. Ecol. Econ. 25 (1), 3–15. doi:10.1016/s0921-8009(98)00020-2
Costanza, R., De Groot, R., Sutton, P., Van Der Ploeg, S., Anderson, S. J., Kubiszewski, I., et al. (2014). Changes in the Global Value of Ecosystem Services. Glob. Environ. Change 26, 152–158. doi:10.1016/j.gloenvcha.2014.04.002
De Groot, R. S., Wilson, M. A., and Boumans, R. M. J. (2002). A Typology for the Classification, Description and Valuation of Ecosystem Functions, Goods and Services. Ecol. Econ. 41 (3), 393–408. doi:10.1016/s0921-8009(02)00089-7
De Valck, J., Beames, A., Liekens, I., Bettens, M., Seuntjens, P., and Broekx, S. (2019). Valuing Urban Ecosystem Services in Sustainable brownfield Redevelopment. Ecosystem Serv. 35, 139–149. doi:10.1016/j.ecoser.2018.12.006
Donner, M., Verniquet, A., Broeze, J., Kayser, K., and De Vries, H. (2021). Critical success and Risk Factors for Circular Business Models Valorising Agricultural Waste and By-Products. Resour. Conservation Recycling 165, 105236. doi:10.1016/j.resconrec.2020.105236
Duan, N., Liu, X. D., Dai, J., Lin, C., Xia, X. H., Gao, R. Y., et al. (2011). Evaluating the Environmental Impacts of an Urban Wetland Park Based on Emergy Accounting and Life Cycle Assessment: A Case Study in Beijing. Ecol. Model. 222 (2), 351–359. doi:10.1016/j.ecolmodel.2010.08.028
Engle, R. F. (1982). Autoregressive Conditional Heteroscedasticity with Estimates of the Variance of United Kingdom Inflation. Econometrica 50 (4), 987–1007. doi:10.2307/1912773
Faramarzi, M., Yang, H., Schulin, R., and Abbaspour, K. C. (2010). Modeling Wheat Yield and Crop Water Productivity in Iran: Implications of Agricultural Water Management for Wheat Production. Agric. Water Manag. 97 (11), 1861–1875. doi:10.1016/j.agwat.2010.07.002
Finnveden, G., Hauschild, M. Z., Ekvall, T., Guinée, J., Heijungs, R., Hellweg, S., et al. (2009). Recent Developments in Life Cycle Assessment. J. Environ. Manage. 91 (1), 1–21. doi:10.1016/j.jenvman.2009.06.018
Foley, J. A., Ramankutty, N., Brauman, K. A., Cassidy, E. S., Gerber, J. S., Johnston, M., et al. (2011). Solutions for a Cultivated Planet. Nature 478 (7369), 337–342. doi:10.1038/nature10452
Fox, K. A. (1953). A Spatial Equilibrium Model of the Livestock-Feed Economy in the United States. Econometrica 21 (4), 547–566. doi:10.2307/1907922
Franzese, P. P., Buonocore, E., Donnarumma, L., and Russo, G. F. (2017). Natural Capital Accounting in marine Protected Areas: The Case of the Islands of Ventotene and S. Stefano (Central Italy). Ecol. Model. 360, 290–299. doi:10.1016/j.ecolmodel.2017.07.015
Gala, A. B., Raugei, M., Ripa, M., and Ulgiati, S. (2015). Dealing with Waste Products and Flows in Life Cycle Assessment and Emergy Accounting: Methodological Overview and Synergies. Ecol. Model. 315, 69–76. doi:10.1016/j.ecolmodel.2015.03.004
Gao, Q., Yu, M., and Xu, H. (2020). Directional Climate Trend, Intensified Intraannual Variability, and Changes in Land Cover Drive the Dynamics of Vegetation Greenness in Peri-Urban China during 2001-2015. J. Geophys. Research-Biogeosciences 125 (2). doi:10.1029/2019jg005336
Gardner, B. L. (1975). The Farm‐Retail Price Spread in a Competitive Food Industry. Am. J. Agric. Econ. 57 (3), 399–409. doi:10.2307/1238402
Geng, Y., Sarkis, J., Ulgiati, S., and Zhang, P. (2013). Measuring China's Circular Economy. Science 339 (6127), 1526–1527. doi:10.1126/science.1227059
Gerbens-Leenes, P. W., and Nonhebel, S. (2002). Consumption Patterns and Their Effects on Land Required for Food. Ecol. Econ. 42 (1-2), 185–199. doi:10.1016/s0921-8009(02)00049-6
Ghisellini, P., Zucaro, A., Viglia, S., and Ulgiati, S. (2014). Monitoring and Evaluating the Sustainability of Italian Agricultural System. An Emergy Decomposition Analysis. Ecol. Model. 271, 132–148. doi:10.1016/j.ecolmodel.2013.02.014
Gomiero, T., Pimentel, D., and Paoletti, M. G. (2011). Environmental Impact of Different Agricultural Management Practices: Conventional vs. Organic Agriculture. Crit. Rev. Plant Sci. 30 (1-2), 95–124. doi:10.1080/07352689.2011.554355
Gordon, L. J., Finlayson, C. M., and Falkenmark, M. (2010). Managing Water in Agriculture for Food Production and Other Ecosystem Services. Agric. Water Manag. 97 (4), 512–519. doi:10.1016/j.agwat.2009.03.017
Granier, C., and Tardieu, F. (1999). Leaf Expansion and Cell Division Are Affected by Reducing Absorbed Light before but Not after the Decline in Cell Division Rate in the sunflower Leaf. Plant Cel Environ. 22 (11), 1365–1376. doi:10.1046/j.1365-3040.1999.00497.x
Grizzetti, B., Lanzanova, D., Liquete, C., Reynaud, A., and Cardoso, A. C. (2016). Assessing Water Ecosystem Services for Water Resource Management. Environ. Sci. Pol. 61, 194–203. doi:10.1016/j.envsci.2016.04.008
Guinée, J. B., Heijungs, R., Huppes, G., Zamagni, A., Masoni, P., Buonamici, R., et al. (2011). Life Cycle Assessment: Past, Present, and Future. Environ. Sci. Technol. 45 (1), 90–96. doi:10.1021/es101316v
Hukkinen, J. (2003). From Groundless Universalism to Grounded Generalism: Improving Ecological Economic Indicators of Human-Environmental Interaction. Ecol. Econ. 44 (1), 11–27. doi:10.1016/s0921-8009(02)00283-5
Jänicke, M. (2008). Ecological Modernisation: New Perspectives. J. Clean. Prod. 16 (5), 557–565. doi:10.1016/j.jclepro.2007.02.011
Jiang, T., Huo, S., Xi, B., Su, J., Hou, H., Yu, H., et al. (2014). The Influences of Land-Use Changes on the Absorbed Nitrogen and Phosphorus Loadings in the Drainage basin of Lake Chaohu, China. Environ. Earth Sci. 71 (9), 4165–4176. doi:10.1007/s12665-013-2807-z
Korhonen, J., and Snäkin, J.-P. (2015). Quantifying the Relationship of Resilience and Eco-Efficiency in Complex Adaptive Energy Systems. Ecol. Econ. 120, 83–92. doi:10.1016/j.ecolecon.2015.09.006
Liu, Z., Wang, S., Xue, B., Li, R., Geng, Y., Yang, T., et al. (2021). Emergy-based Indicators of the Environmental Impacts and Driving Forces of Non-point Source Pollution from Crop Production in China. Ecol. Indicators 121. doi:10.1016/j.ecolind.2020.107023
Liu, Z., Wang, Y., Geng, Y., Li, R., Dong, H., Xue, B., et al. (2019). Toward Sustainable Crop Production in China: An Emergy-Based Evaluation. J. Clean. Prod. 206, 11–26. doi:10.1016/j.jclepro.2018.09.183
Lou, B., Qiu, Y., and Ulgiati, S. (2015). Emergy-based Indicators of Regional Environmental Sustainability: A Case Study in Shanwei, Guangdong, China. Ecol. Indicators 57, 514–524. doi:10.1016/j.ecolind.2015.03.017
Lu, H., and Campbell, D. E. (2009). Ecological and Economic Dynamics of the Shunde Agricultural System under China's Small City Development Strategy. J. Environ. Manage. 90 (8), 2589–2600. doi:10.1016/j.jenvman.2009.01.019
Ma, W., Meng, L., Wei, F., Opp, C., and Yang, D. (2021). Spatiotemporal Variations of Agricultural Water Footprint and Socioeconomic Matching Evaluation from the Perspective of Ecological Function Zone. Agric. Water Manag. 249, 106803. doi:10.1016/j.agwat.2021.106803
Macfadyen, S., Cunningham, S. A., Costamagna, A. C., and Schellhorn, N. A. (2012). Managing Ecosystem Services and Biodiversity Conservation in Agricultural Landscapes: Are the Solutions the Same? J. Appl. Ecol. 49 (3), 690–694. doi:10.1111/j.1365-2664.2012.02132.x
Manjula, M., Venkatachalam, L., Mukhopadhyay, P., and Kumar, L. (2019). Ecosystem Services Approach for Revitalizing Agriculture in India. Curr. Sci. 116 (5), 723–727. doi:10.18520/cs/v116/i5/723-727
Marrero, H. J., Medan, D., Zarlavsky, G. E., and Torretta, J. P. (2016). Agricultural Land Management Negatively Affects Pollination Service in Pampean Agro-Ecosystems. Agric. Ecosyst. Environ. 218, 28–32. doi:10.1016/j.agee.2015.10.024
Martino, S., and Muenzel, D. (2018). The economic value of high nature value farming and the importance of the Common Agricultural Policy in sustaining income: The case study of the Natura 2000 Zarandul de Est (Romania). J. Rural Stud. 60, 176–187. doi:10.1016/j.jrurstud.2018.04.002
Mattila, T. J., Pakarinen, S., and Sokka, L. (2010). Quantifying the Total Environmental Impacts of an Industrial Symbiosis - a Comparison of Process-, Hybrid and Input−Output Life Cycle Assessment. Environ. Sci. Technol. 44 (11), 4309–4314. doi:10.1021/es902673m
Myers, R. J. (2006). On the Costs of Food price Fluctuations in Low-Income Countries. Food Policy 31 (4), 288–301. doi:10.1016/j.foodpol.2006.03.005
Naseem, A., Mhlanga, S., Diagne, A., Adegbola, P. Y., and Midingoyi, G. S.-k. (2013). Economic Analysis of Consumer Choices Based on rice Attributes in the Food Markets of West Africa-The Case of Benin. Food Sec. 5 (4), 575–589. doi:10.1007/s12571-013-0276-6
Odum, H. T. (2000). Emergy of Global Processes. Handbook of Emergy Evaluation. Gainesville, FL, USA: University of Florida.
Odum, H. T. (1984). “Energy Analysis of the Environmental Role in Agriculture,” in Energy and Agriculture. Editor S. Gerald (Berlin, Heidelberg: Springer-Verlag), 24–51. doi:10.1007/978-3-642-69784-5_3
Porter, M. E., and Linde, C. (1999). Green and Competitive: Ending the Stalemate. Harv. Business Rev. 28 (6), 128–129.
Qing Yang, G. L., Casazza, Marco., Yan, Hao., and Biagio, F. (2019). Giannetti Emergy-Based Accounting Method for Aquatic Ecosystem Services Valuation: A Case of China. J. Clean. Prod. 230, 55–68. doi:10.1016/j.jclepro.2019.05.080
Richmond, A., Kaufmann, R. K., and Myneni, R. B. (2007). Valuing Ecosystem Services: A Shadow price for Net Primary Production. Ecol. Econ. 64 (2), 454–462. doi:10.1016/j.ecolecon.2007.03.009
Shah, S. M., Liu, G., Yang, Q., Wang, X., Casazza, M., Agostinho, F., et al. (2019). Emergy-based Valuation of Agriculture Ecosystem Services and Dis-Services. J. Clean. Prod. 239. doi:10.1016/j.jclepro.2019.118019
Siegmeier, T., and Möller, D. (2013). Mapping Research at the Intersection of Organic Farming and Bioenergy - A Scientometric Review. Renew. Sust. Energ. Rev. 25, 197–204. doi:10.1016/j.rser.2013.04.025
Su, Y., He, S., Wang, K., Shahtahmassebi, A. R., Zhang, L. P., Zhang, J., et al. (2020a). Quantifying the Sustainability of Three Types of Agricultural Production in China: An Emergy Analysis with the Integration of Environmental Pollution. J. Clean. Prod. 252, 14. doi:10.1016/j.jclepro.2019.119650
Su, Y., He, S., Wang, K., Shahtahmassebi, A. R., Zhang, L. P., Zhang, J., et al. (2020b). Quantifying the Sustainability of Three Types of Agricultural Production in China: An Emergy Analysis with the Integration of Environmental Pollution. J. Clean. Prod., 252. doi:10.1016/j.jclepro.2019.119650
Tang, L. L., Hayashi, K., Kohyama, K., and Leon, A. (2018). Reconciling Life Cycle Environmental Impacts with Ecosystem Services: A Management Perspective on Agricultural Land Use. Sustainability 10 (3), 16. doi:10.3390/su10030630
Tilman, D., Fargione, J., Wolff, B., D'antonio, C., Dobson, A., Howarth, R., et al. (2001). Forecasting Agriculturally Driven Global Environmental Change. Science 292 (5515), 281–284. doi:10.1126/science.1057544
Valdivia, R. O., Antle, J. M., and Stoorvogel, J. J. (2012). Coupling the Tradeoff Analysis Model with a Market Equilibrium Model to Analyze Economic and Environmental Outcomes of Agricultural Production Systems. Agric. Syst. 110, 17–29. doi:10.1016/j.agsy.2012.03.003
Van Der Werf, H. M. G., Knudsen, M. T., and Cederberg, C. (2020). Towards Better Representation of Organic Agriculture in Life Cycle Assessment. Nat. Sustain. 3 (6), 419–425. doi:10.1038/s41893-020-0489-6
Van Oijstaeijen, W., Van Passel, S., and Cools, J. (2020). Urban green Infrastructure: A Review on Valuation Toolkits from an Urban Planning Perspective. J. Environ. Manage. 267, 110603. doi:10.1016/j.jenvman.2020.110603
Vieira Da Silva, L., Everard, M., and Shore, R. G. (2014). Ecosystem Services Assessment at Steart Peninsula, Somerset, UK. Ecosystem Serv. 10, 19–34. doi:10.1016/j.ecoser.2014.07.008
Wang, X., Dadouma, A., Chen, Y., Sui, P., Gao, W., and Jia, L. (2015). Sustainability Evaluation of the Large-Scale Pig Farming System in North China: an Emergy Analysis Based on Life Cycle Assessment. J. Clean. Prod. 102, 144–164. doi:10.1016/j.jclepro.2015.04.071
Wang, X., Tan, K., Chen, Y., Chen, Y., Shen, X., Zhang, L., et al. (2018). Emergy-based Analysis of Grain Production and Trade in china during 2000-2015. J. Clean. Prod. 193, 59–71. doi:10.1016/j.jclepro.2018.05.072
Xie, G., Zhang, C., Zhen, L., and Zhang, L. (2017). Dynamic Changes in the Value of China's Ecosystem Services. Ecosystem Serv. 26, 146–154. doi:10.1016/j.ecoser.2017.06.010
Yang, Q., Liu, G., Giannetti, B. F., Agostinho, F., Almeida C, M. V. B., and Casazza, M. (2020). Emergy-based Ecosystem Services Valuation and Classification Management Applied to China’s Grasslands. Ecosystem Services, 42. doi:10.1016/j.ecoser.2020.101073
Yang, Q., Liu, G., Casazza, M., Campbell, E. T., Giannetti, B. F., and Brown, M. T. (2018). Development of a New Framework for Non-monetary Accounting on Ecosystem Services Valuation. Ecosystem Serv. 34, 37–54. doi:10.1016/j.ecoser.2018.09.006
Yang, Q., Liu, G., Hao, Y., Zhang, L., Giannetti, B. F., Wang, J., et al. (2019). Donor-side Evaluation of Coastal and marine Ecosystem Services. Water Res. 166, 115028. doi:10.1016/j.watres.2019.115028
Yang, Q., Yu, S., and Jiang, D. (2014). A Modular Method of Developing an Eco-Product Family Considering the Reusability and Recyclability of Customer Products. J. Clean. Prod. 64, 254–265. doi:10.1016/j.jclepro.2013.07.030
Yin, S., Wu, L., Du, L., and Chen, M. (2010). Consumers' purchase Intention of Organic Food in China. J. Sci. Food Agric. 90 (8), 1361–1367. doi:10.1002/jsfa.3936
Zeng, F., Ali, S., Zhang, H., Ouyang, Y., Qiu, B., Wu, F., et al. (2011). The Influence of pH and Organic Matter Content in Paddy Soil on Heavy Metal Availability and Their Uptake by rice Plants. Environ. Pollut. 159 (1), 84–91. doi:10.1016/j.envpol.2010.09.019
Zhang, C., Meng, C., and Getz, L. (2014). Food Prices and Inflation Dynamics in China. China Agric. Econ. Rev. 6 (3), 395–412. doi:10.1108/caer-12-2012-0140
Zhang, X., Tang, Q., Zheng, J., and Ge, Q. (2013). Warming/cooling Effects of Cropland Greenness Changes during 1982-2006 in the North China Plain. Environ. Res. Lett. 8 (2), 024038. doi:10.1088/1748-9326/8/2/024038
Zheng, W. L., Luo, B. L., and Hu, X. Y. (2020). The Determinants of Farmers' Fertilizers and Pesticides Use Behavior in China: An Explanation Based on Label Effect. J. Clean. Prod., 272. doi:10.1016/j.jclepro.2020.123054
Zhong, S. H., and Chen, J. (2019). How Environmental Beliefs Affect Consumer Willingness to Pay for the Greenness Premium of Low-Carbon Agricultural Products in China: Theoretical Model and Survey-Based Evidence. Sustainability 11 (3), 20. doi:10.3390/su11030592
Zilberman, D., Hochman, G., Rajagopal, D., Sexton, S., and Timilsina, G. (2013). The Impact of Biofuels on Commodity Food Prices: Assessment of Findings. Am. J. Agric. Econ. 95 (2), 275–281. doi:10.1093/ajae/aas037
Keywords: agriculture ecosystem, ecosystem services, ecosystem dis-services, emergy-based life-cycle assessment, ecological value, value realization
Citation: Wang Y, Liu G, Cai Y, Giannetti BF, Agostinho F, Almeida CMVB and Casazza M (2022) The Ecological Value of Typical Agricultural Products: An Emergy-Based Life-Cycle Assessment Framework. Front. Environ. Sci. 10:824275. doi: 10.3389/fenvs.2022.824275
Received: 29 November 2021; Accepted: 11 January 2022;
Published: 18 February 2022.
Edited by:
Faik Bilgili, Erciyes University, TurkeyReviewed by:
Junting Pan, Institute of Agricultural Resources and Regional Planning (CAAS), ChinaIbrahim Dogan, Bozok University, Turkey
Copyright © 2022 Wang, Liu, Cai, Giannetti, Agostinho, Almeida and Casazza. This is an open-access article distributed under the terms of the Creative Commons Attribution License (CC BY). The use, distribution or reproduction in other forums is permitted, provided the original author(s) and the copyright owner(s) are credited and that the original publication in this journal is cited, in accordance with accepted academic practice. No use, distribution or reproduction is permitted which does not comply with these terms.
*Correspondence: Gengyuan Liu, bGl1Z2VuZ3l1YW5AYm51LmVkdS5jbg==