 Xiao Zheng
 Hong Yu
94% of researchers rate our articles as excellent or good
Learn more about the work of our research integrity team to safeguard the quality of each article we publish.
Find out more
ORIGINAL RESEARCH article
Front. Environ. Sci., 03 February 2022
Sec. Environmental Economics and Management
Volume 10 - 2022 | https://doi.org/10.3389/fenvs.2022.822811
This article is part of the Research TopicGreen Innovation and Industrial Ecosystem Reconstruction in Achieving Environmental SustainabilityView all 34 articles
This paper proposes a dynamic industrial transfer index for the first time to characterize the spatial matchability of factor mobility and industrial transfer, and then explores the correlation between factor mobility, industrial transfer and industrial carbon emission intensity by using panel data from 30 provinces in China during 2004–2019. The results show that China’s ability to reduce carbon emissions is improving, and the intensity of industrial carbon emission has dropped by 44.84%. In addition, there is an obvious spatial mismatch between factor mobility and industrial transfer. Specifically, production factors generally flow from high-carbon emission intensity areas to low-carbon emission intensity areas, while the direction of industrial transfer is generally opposite to that of factor mobility. And the empirical analysis finds that the interaction between factor mobility and industrial transfer will affect the carbon reduction. If the direction of capital mobility is the same as that of capital-intensive industries, it is unfavorable to the carbon emission reduction. While the carbon reduction effect will be enhanced if the directions of labor and technology mobility are consistent with those of labor-intensive and technology-intensive industrial transfer, respectively. Finally, based on the findings, some recommendations are provided for governments to formulate policies.
The greenhouse effect is a common challenge for human society (Anwar et al., 2020), and CO2 accounts for the largest proportion among the six greenhouse gas (GHG) emissions. In 2010, global CO2 emissions accounted for 76% of global GHG emissions (IPCC, 2014). Since then, global GHG emissions have increased by an average of 1.4% per year, and the total GHG emissions (including those from land-use activities) reached a record 59.1 billion tons of CO2 equivalent (GtCO2e) in 2019 (UNEP, 2020). Therefore, reducing CO2 emissions has become an important goal of global environmental policy. As the second largest economy and the largest emitter of CO2 in the world (Ma et al., 2019), China is taking active measures to reduce CO2 emissions by adjusting its energy structure and upgrading its industrial structure, and proposing a series of carbon emission reduction goals. In 2015, China put forward the “China’s 2030 Emission Reduction Plan to Address Climate Change,” and planned to decrease CO2 emissions per unit of GDP by 60–65% compared to 2005. On 29 October 2020, the “Recommendations of the Central Committee of the Communist Party of China on Formulating the 14th Five-Year Plan for National Economic and Social Development and Long-term Goals for 2030” proposed that it is necessary to formulate an action plan to reach the peak of carbon emissions by 2030 and become carbon neutral by 2060. Then on 12 December 2020, at the Climate Ambition Summit, Chinese President Xi Jinping proposed a new goal of reducing CO2 emissions per unit of GDP by more than 65% by 2030 compared to 2005, which will further increase the autonomous contribution of China.
With the introduction of China’s carbon emission reduction goal, carbon emission reduction has become one of the key issues facing China’s economic and social development and industrial restructuring in the future. As an important economic pillar, rapid industrialization has led to an increase in energy consumption and CO2 emissions in the industrial sector, which contributes 85% of CO2 emissions in China (Li et al., 2019). Therefore, reducing industrial carbon emissions has become an important task for the sustainable development of industrial economy. In addition, compared with the post-industrialization of developed countries, China is still in the stage of rapid industrialization (Jia et al., 2020). There are obvious differences in industrial structures and development stages between areas in China, which will lead to uneven distribution of carbon emissions and carbon reduction capabilities. Therefore, industrial transfer will inevitably cause changes in the spatial structure of carbon emissions.
Besides, the spatial allocation of production factors is closely related to the spatial layout of industrial structure. Production factors are important basis for economic and social development, and their utilization and distribution are crucial to the realization of carbon emission reduction goals. Generally speaking, if production factors flow freely, they will tend to flow to areas with high returns under the guidance of regional resource endowment differences and market laws (Chen et al., 2021), which is also the basic feature of the factor mobility in China. For a long time, the major production factors in China, such as labor and capital, have been concentrated in the eastern coastal areas, however, the manufacturing industry has shown a trend of transferring from the southeastern coast areas to the inland areas (Sun et al., 2018), which is contrary to the direction of the factor mobility. Generally, industrial transfer may lead to changes in regional industrial structure and factor demand structure, while the changes in factor supply structure lag behind the changes in the demand structure. Therefore, the mismatch between factor mobility and industrial transfer will act on the spatial pattern of carbon emissions. As China is simultaneously promoting factor market allocation reform, industrial restructuring and carbon emission reduction, the interaction between factor mobility, industrial transfer and carbon emission reduction is related to the realization of policy goals. Therefore, exploring the impact of the interaction of factor mobility and industrial transfer on carbon emission reduction from the perspective of spatial matchability is crucial to the policy coordination of factor allocation, industrial transformation and low-carbon development. In addition, the case study of China can also provide a reference for other developing countries to solve the problem of reducing emissions from industrial restructuring.
The main contributions of this paper are as follows: First, we improve the industrial transfer index (Sun et al., 2018) into a dynamic industrial transfer index, and measures the dynamic transfer trends of labor-intensive, capital-intensive, and technology-intensive industries in China from 2004 to 2019 by using sub-sectors data. Second, some articles point out that the factor mobility does not match the industrial transfer in China (Wang, 2021), on this basis, we further use regional data to carve out and visualize the distribution characteristics of the spatial mismatch. Third, we explore the heterogeneous impact of different types of factor mobility and industrial transfer on industrial carbon emission intensity from the spatial matchability of factor mobility and industrial transfer, and analyze the heterogeneous impact of spatial matchability on carbon emissions under different carbon emission intensities. Finally, we put forward some recommendations to promote carbon emission reduction from the perspective of factor mobility and industrial transfer.
This paper is organized as follows: Literature Review and Research Hypothesis introduces the relevant literatures and research hypotheses. Method and Data describes the data and main methods. Description of Objective Facts describes the characteristic facts of factor mobility, industrial transfer and industrial carbon emissions. Results and Discussions is the empirical results, and Conclusion and Policy Recommendations is conclusions and policy recommendations.
Recent years, factor mobility, industrial transfer and carbon emission intensity have been the research hotspots in academia. The studies on the relationship between factor mobility and economic activities can generally be divided into two categories. On the one hand, some studies discuss the relationship of factor mobility on economic activities from a single factor, such as the impact of capital mobility on energy consumption (Qamruzzaman and Wei, 2020), the impact of technology mobility on innovation efficiency (Yu et al., 2019), and the relationship between labor mobility and economic growth (Alonso-Carrera and Raurich, 2018). On the other hand, there are also some studies focusing on the effects of factor mobility on the economic growth and regional coordination. Zhang and Wu (2019) point out that factor mobility not only promotes factor gains in inflowing areas, but also increases factor gains in outflowing areas. However, Li et al. (2020) take the opposite view and argue that there is heterogeneity in the role of factor mobility on regional equilibrium development, that is, capital and technology mobility can promote regional equilibrium development while labor mobility will lead to the expansion of the gap in regional economic development.
Over the years, scholars have never stopped paying attention to industrial transfer. The measurement of industrial transfer (Wang et al., 2021), industrial transfer efficiency (Luo and Dai, 2019), economic effects and environmental effects of industrial transfer (Liu et al., 2020) have received extensive attention. At the same time, the relationship between factor mobility and industrial transfer is also frequently discussed, which mainly includes the following views: First, the combined effect of mobile labor, capital and technology is the main driving force to promote industrial transfer (Zhai, 2016). Second, industrial transfer can play the “reservoir effect” to promote factor mobility (Chen and Chen, 2007). In summary, the existing studies show that there is a close connection between factor mobility and industrial transfer, so it is necessary to discuss them within the same framework.
Under the goal of global carbon reduction, carbon emissions have gradually become one of the focal topics in academia. The accounting for carbon emissions (Kabir et al., 2021; Zhao et al., 2021), spatial layout of carbon emissions (Chen et al., 2021), carbon emission forecast (Gao et al., 2021), the carbon reduction effect of carbon tax (Liu et al., 2021), economic impact (Peng et al., 2021) and policy effects of carbon emissions (Xu, 2021; Wakiyama and Zusman, 2021) have received extensive attention. In addition, there are also some studies exploring the relationship between industrial transfer and carbon emissions. Li et al. (2021) analyze the relationship between industrial transfer and carbon emissions from the perspective of industrial chains, and identify the industrial paths that affects carbon emissions in China. Since energy consumption is the main source of carbon emissions (Rauf et al., 2020), and industrial transfer can change the spatial distribution of energy intensity by influencing the regional industrial structure (Zhao and Lu, 2019), industrial transfer not only promotes economic development, but also has a certain negative impact on the environment. In addition, Chinese industries, especially industrial industries, are gradually transferring from the coast to the mainland, which is also accompanied by carbon transfer (Wang et al., 2021). Due to industrial transfer or the movement of intermediate goods and services between industries, carbon emissions in some areas will be transferred to other areas, which will lead to hidden carbon emissions (Zheng, 2021). From the above studies, we can see that industrial transfer is closely related to carbon emissions.
In summary, scholars have conducted extensive research on the impact of factor flow, industrial transfer and carbon emission intensity on economic development. Although these studies basically argue that carbon emission transfer will be accompanied by industrial transfer, and the spatial matchability of factor mobility and industrial transfer will hinder the process of industrial transfer, but the relationship between factor mobility, industrial transfer and carbon emission has not been fully explained. Therefore, we think that there are still several aspects need to be made up, so we carried out the following main works. First, we propose an improved dynamic industrial transfer index and characterize the spatial layouts and dynamic characteristics of interregional industrial transfer in China from 2004 to 2019 by using industrial data. Second, we compare the spatial matchability of factor mobility and industrial transfer, discuss the impact of factor mobility and industrial transfer on industrial carbon emission intensity from the perspective of spatial matchability, and then analyze the heterogeneity of this impact under different carbon emission intensities using quantile regression. Third, some policy recommendations are put forward to provide decision-making reference for improving the carbon emission reduction effect of industrial transfer and achieving the goal of “Carbon Peak and Carbon Neutrality”.
Industrial activities are one of the main sources of CO2 emissions (Li et al., 2019). There is significant heterogeneity in the carbon emission intensity of different industrial sectors due to differences in energy consumption structures. Among them, the industrial sectors using fossil energy such as coal, coke or oil and other energy-intensive sectors have higher carbon emission intensity. In addition, due to regional differences in technology endowment, scale effect, and environmental regulation intensity, the emission reduction capacity of different areas is not consistent, so the adjustments of industrial layout and changes in industrial structure may lead to adjustments and changes in carbon emissions (Yan and Yang, 2010). In general, the transfer of capital-intensive industries implies an increase in energy consumption, and a corresponding potential increase in carbon emission intensity (Zhao et al., 2020). While the transfer of technology-intensive industries may lead to an increase of regional technology level and a decrease of carbon emission intensity (Chen et al., 2020). In addition, technology-intensive and labor-intensive industries have lower carbon emission intensity compared to capital-intensive industries (Fu et al., 2021a). In other words, the impacts of different types of industrial transfer on carbon emissions may be heterogeneous. Accordingly, we propose the first research hypothesis of this paper.
H1: There is heterogeneity in the impact of different types of industrial transfers on industrial carbon emission intensity.
Production factors are the important basis of industrial activities, so the mobility and allocation of factors play a crucial role in industrial activities and will also have an impact on industrial carbon emissions accordingly. With the acceleration of economic system reform and marketization, the administrative barriers to resource allocation have gradually been broken. Based on the factor endowment theory, the quantitative and qualitative differences in production factors between different areas constitute an objective basis for factor mobility (Zhang, 2016). Due to the differences in economic development levels and industrial returns, the profit-seeking nature of production factors tends to make them cluster in areas or industries with higher marginal rewards (Zhao and Xu, 2020). However, the total amounts of production factors in economic activities, such as labor and capital, are limited. And factor mobility inevitably leads to the redistribution of production factors among areas and industries, which ultimately affects the layout and structure of industrial production. In addition, China’s factor markets have serious institutional barriers and low levels of factor market allocation (Lu and Wang, 2021), and industrial transfer is not always dominated by the market behavior of spontaneous factor mobility, government regulation is also one of the important factors leading to industrial transfer (Zhang et al., 2019). Therefore, the dual role of government and market may lead to serious misalignment problems between factor mobility and industrial transfer, which in turn will affect factor productivity and industrial carbon emissions. Besides, according to the theory of industrial gradient transfer, developed areas with high factor abundance have stronger incentives to transform and upgrade their industries, thereby prompting industries that have lost comparative advantages or with high energy consumption and high pollution to transfer to developing areas, where they may still have comparative advantages. So industrial transfer can be used to achieve industrial progress in developed areas and industrial upgrading in developing areas (Sun and Hou, 2021). From this perspective, the process of industrial transfer will be accompanied by the spatial transfer of demand for production factors. Due to the imperfect market mechanism or information asymmetry, the flow direction of labor, capital and other production factors often cannot change in time with the direction of industrial transfer, which will lead to the problem of mismatch between factor mobility and industrial transfer and the imbalance between the supply and demand of factors. In turn, the imbalance between supply and demand of production factors will affect the process of industrial transfer. When the direction of factor mobility does not match that of industrial transfer, the contradiction between factor mobility, industrial transfer and carbon emission reduction will be strengthened. Therefore, we propose the second research hypothesis of this paper. Figure 1 shows the theoretical analysis framework of this paper.
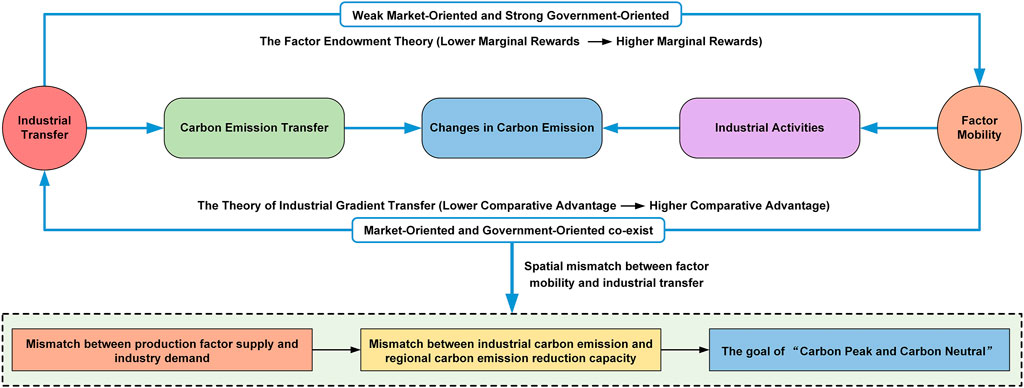
FIGURE 1. Theoretical analysis framework.
H2: The matchability of factor mobility and industrial transfer will affect the carbon emission reduction effect of industrial transfer.
According to the Cobb-Douglas production function, technology, labor, and capital are the main factors that determine the level of industrial development. Therefore, in this paper, we mainly focus on the impact of labor, capital, and technology mobility on carbon emissions.
China conducts a population census as well as migrants statistics every 10 years, and conducts a migrant population dynamic survey (CMDS) every year, but the coverage of the dynamic survey is small, with a sample size of about 200,000 households, which only accounts for about 0.04% of China’s total population. In other words, there is no continuous official data on labor mobility that covers the whole country in China. Considering the lack of official statistics, we learn from the common practice of scholars and use net population change after excluding natural growth factors (Lin and Wang, 2006) to measure the macro-level population mobility. From the 2010 census in China, the proportion of labor force in the mobile population is about 90%. Therefore, this paper uses the net population change after excluding the natural growth factor multiplied by the proportion of labor force in the mobile population to measure inter-provincial labor mobility, which is defined as follows:
where Li,t represents the total population of province i at the end of year t, and ni,t is the natural growth rate of province i in year t.
Since there are no official public data on inter-provincial capital mobility in China, we follow the common practice of Chinese scholars to approximate the inter-provincial capital mobility by using the expenditure approach principles of national economic accounting (Hu and Wu., 2012). According to the formula of national economic accounting, GDP can be decomposed into final consumption (C), capital formation (I) and net outflow of goods and services (X), where X can be assumed to be the consumption of goods and services in the province by residents outside the province (including other domestic provinces and abroad). Therefore, based on the principle that the direction of goods and services mobility is opposite to that of capital mobility, the size of inter-provincial capital mobility is approximated by the net outflow of goods and services minus the net export of foreign trade. In this paper, the ratio of the size of inter-provincial capital mobility to GDP is used as a proxy variable for capital mobility, which can also be used to capture domestic market trade.
Technology market transaction is a suitable indicator to measure inter-regional technology mobility (Yu et al., 2019). However, it is worth noting that, unlike labor and capital mobility, technology outflow does not lead to a decline in the technology level of the outflowing area, so technology market transactions in inflowing areas can be used as a proxy variable for inter-provincial technology mobility, specifically measured by the ratio of technology market transactions to GDP.
Manufacturing transfer is the main form of industrial transfer. Developed countries have well-developed information on the location of enterprises and can directly judge the scale and direction of industrial transfer based on changes in the location of enterprises (Arauzo-Carod et al., 2010), while such information is difficult to obtain in China, so industrial transfer in China is usually measured in an indirect way. Zhao and Yin (2011) propose a method to measure industrial transfer based on the idea of share transfer. Sun et al. (2018) point out that the change in the number of enterprises cannot accurately reflect the transfer of manufacturing industries, so they make some improvements based on Zhao’s study by using the change in production scale after excluding the natural growth of industries to reflect industrial transfer, which is defined as follows:
where IRci,t denotes the industry transfer index of industry i of area c in year t, Pci,t and Pci,t0 denote the total production scale of industry i in year t and year t0 (base period), respectively. m presents the number of industries, qci,t denotes the production scale of industry i in area c in year t, and
When IRdci,t = 0, the industry is not transferred. If IRdci,t > 0, it means that industry i of area c in year t undergoes transfers in relative to the previous year. Otherwise, the industry is relatively transferred out.
Carbon intensity is usually defined as CO2 emissions per unit of GDP (Zhou et al., 2019). Accordingly, industrial carbon intensity (ci) can be defined as CO2 emissions per unit of industrial outputs, and the combustion of fossil energy is the main source of CO2 emissions (Zhao and Luo, 2018). Based on the general approach of existing studies, the consumption of fossil energy is used to estimate CO2 emissions according to the 2006 IPCC Guidelines for National Greenhouse Gas Inventories, as shown in Eq. 4.
where C denotes CO2 emission and i denotes energy type. In this paper, the fossil energy mainly includes raw coal, washed coal, other washed coal, coal, coke, coke oven gas, blast furnace gas, other gas, crude oil, gasoline, kerosene, diesel, fuel oil, naphtha, lubricating oil, paraffin, solvent oil, petroleum asphalt, petroleum coke, liquefied petroleum gas, refinery dry gas, natural gas, other petroleum products and other coking products, etc., ADi, NCVi, EFi and Oi represent energy consumption, average low level heat content, carbon content per unit calorific value and carbon oxidation rate, respectively.
Refer to existing researches, we choose economic externality (eo), technological innovation (inv), industrial structure (ind), urbanization rate (urban), fiscal self-sufficiency rate (fss), and environmental regulation (mier) as control variables. eo, ind, and mier are all relative indicators, which are measured by the proportion of total exports and imports in GDP (Waugh and Ravikumar, 2016), the proportion of secondary industry output in GDP, and the proportion of resource tax, vehicle use tax, and environmental tax (sewage charge) related to environmental protection in GDP (Jorgenson and Wilcoxen, 1990), respectively. inv, urban, and fss are expressed as the number of invention patent applications per 10,000 people, the proportion of urban population, and the proportion of budget revenue to budget expenditure (Zou et al., 2019), respectively.
After combing through the sustainable development and low-carbon emission reduction policies of China, we found that the Scientific Outlook on Development, introduced in July 2003, is of great significance to China’s energy conservation and to the sustainable development. Therefore, 2004 is chosen as the starting point of this paper. The energy consumption data used to calculate CO2 emissions are from the China Energy Statistical Yearbook (2005–2020). The year-end population and natural growth rates required for labor mobility and the data required for capital mobility are from the China Statistical Yearbook (2004–2020), where data on “net outflows of goods and services” for 2019 are missing for some provinces, and we use the average growth rates of the last 5 years for estimation. The technology market transactions in the inflowing areas required for technology mobility are obtained from the China Statistical Yearbook on Science and Technology (2005–2020). The manufacturing industries are divided into labor-intensive, capital-intensive and technology-intensive according to the intensity of production factors. The data on industrial output value required for industrial transfer come from the China Industry Statistical Yearbook (2004–2020), wind database and statistical yearbooks of relevant provinces. The data required for the control variables are from the China Statistical Yearbook (2005–2020) and the Finance Yearbook of China (2005–2020). The VIF test shows that the variance inflation coefficients of all variable are less than 10, which can prove that there is basically no multicollinearity in these variables (Hair et al., 1995).
In this paper, the panel fixed effects model is used to examine the relationship between factor mobility, industrial transfer and industrial carbon emissions. Combined with the theoretical analysis, the impact of the interaction between factor mobility and industrial transfer on carbon emissions is the focus of our attention. Therefore, in addition to factor mobility and industrial transfer, the interaction term of these two indicators is added to the model to examine the effect of their interaction on industrial carbon emissions, and the model is shown in Eq. 5.
where ci represents industrial carbon emission intensity, ff denotes factor mobility, which include labor mobility (lf), capital mobility (cf), and technology mobility (tf), respectively. int is industrial transfer, including labor-intensive industry transfer (lit), capital-intensive industry transfer (cit), and technology-intensive industry transfer (tit). X denotes a set of potential control variables, ui denotes individual fixed effects, λt denotes time fixed effects, and εit denotes a random error term.
Considering that the industrial carbon emission intensity may represent the ability to reduce emissions, the impacts of factor mobility and industrial transfer on industrial carbon emission intensity may be heterogeneous at different industrial carbon emission intensities. Quantile regression is one of the effective methods to examine the heterogeneous impacts of explanatory variables on the explained variables at different quantile levels, and it uses the conditional expectation of the explained variable to obtain a regression equation in any quantile level of the explained variable by adding the absolute value of the minimum residual weights (Koenker, 2004). The formula for the quantile regression is as follows:
Following Alvarado et al. (2021), we use the panel quantile regression approach to estimate the heterogeneous impacts of the factor mobility and industrial transfer on industrial carbon emission intensity at different quantile levels. We specify the quantile τth (0 < τ < 100) of the dependent variable’s conditional distribution as a function of a set of explanatory factors Xit. The equation is shown in Eq. 7.
The matrix Xit is the set of all the explanatory and control variables, and εit is the error term. In this paper, the model of quantile regression can be specifically expressed as Eq. 8.
From the spatial matchability of factor mobility and industrial transfer, production factors generally flow from the central and western areas to the eastern areas, while the direction of industrial transfer is opposite. Especially labor-intensive industries and technology-intensive industries generally transfer from the eastern areas to the central and western areas, and there is a relatively obvious spatial mismatch between the direction of factor mobility and the trend of industrial transfer.
Figures 2A, B reflect the spatial layout of labor mobility and labor-intensive industrial transfer, respectively. As can be seen from the China Census in 2010, employment is the main factor of labor mobility across provinces, accounting for 77.2%. More than 55.4% of the mobile labor force is employed in manufacturing industries, and the labor force with a college degree or above is less than 11.6%. Overall, labor-intensive industries are the main industries absorbing low-skilled labor. Comparing Figures 2A, B, we can find that, during 2004–2019, labor-intensive industries basically show a trend of transferring from the eastern areas to the central, western, and northeastern areas, while labor force shows a trend of moving from the central and western areas to the eastern areas. Although the trend of labor inflow in eastern provinces such as Beijing, Shanghai and Shandong slows down after 2016, and there is even a net outflow, the labor force in some central and western areas begin to return at the same time, the contradiction between labor supply and demand in the central and western areas remains prominent with the transfer of labor-intensive industries to central and western areas.
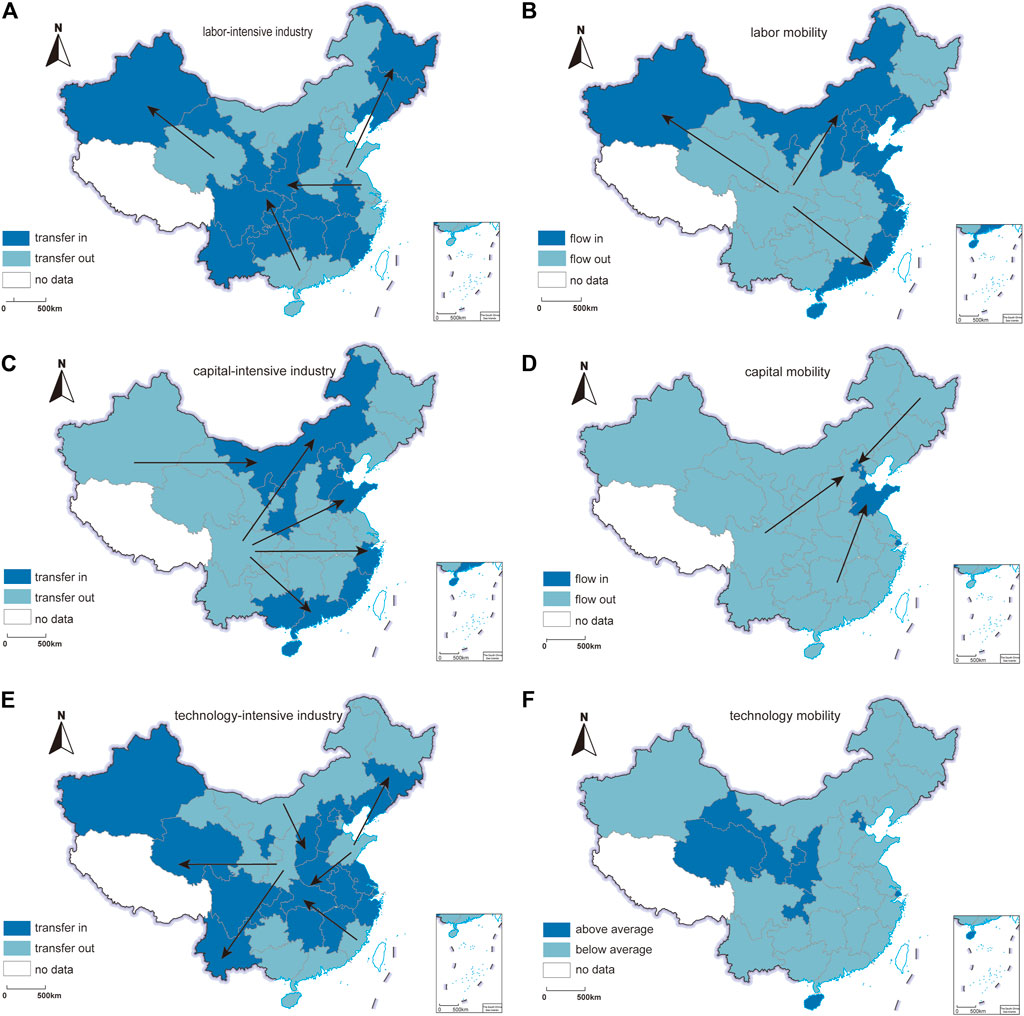
FIGURE 2. The spatial layout of factor mobility and industrial transfer.
Figures 2C, D reflect the basic situation of capital mobility and capital-intensive industry transfer. And we can see that, from 2004 to 2019, capital flows from the central and western areas to the eastern areas, while capital-intensive industries do not show a clear trend of transferring from the eastern to the central and western areas, just like the findings of (Fu et al., 2021b). In general, capital-intensive industries in the eastern provinces such as Tianjin, Hebei, Shandong, Zhejiang, Fujian, Guangdong and Hainan remain net inflows. Comparing the regional input-output tables of China, we find that Beijing, Tianjin, Shanghai, Jiangsu, Shandong and Fujian generally show net outflows of domestic and provincial capital-intensive products, while the central and western areas mostly show net inflows of domestic and provincial capital-intensive products, indicating that the eastern areas are still the main production base for capital-intensive products. It also indicates that although capital mobility and capital-intensive industry transfer are more consistent in some provinces, the matchability between them still needs to be improved.
It can be seen from Figures 2E, F that technology-intensive industries transfer from the eastern areas to the central and western areas, which is like the findings of Cao and Zhang. (2021). However, there is still a mismatch between technology mobility and technology-intensive industry transfer in terms of technology market transactions. The main manifestation is that technology-intensive industries mainly transfer to areas where technology inflows are lower than the national average. Next, we examine the independent innovation capacity of areas that absorb technology-intensive industries. Among them, the number of invention patent applications per 10,000 people in eastern coastal areas such as Beijing, Shanghai, Jiangsu, and Zhejiang exceeded 2, however, it is less than 0.5 in the central and western areas. The above information shows that there is also an imbalance in the spatial layout and innovation level of technology-intensive industrial transfer. Although some technology-intensive industries have transferred into the central and western areas where the level of independent innovation is relatively weak due to industrial layout adjustment, the direction of technology mobility represented by technology market transactions and the transfer direction of technology-intensive industries cannot be matched in time.
According to the national average industrial carbon emission intensity from 2004 to 2019 (the average value is 8.1382), the 30 provinces are divided into low carbon emission intensity areas (low-carbon areas) and high carbon emission intensity areas (high-carbon areas). From Table 1, we can see that the industrial carbon emission intensity of China shows obvious regional distribution characteristics, with a spatial pattern that the east is lower than the west, and the south is lower than the north. Among them, the southeast coastal area has the lowest carbon emission intensity. From the perspective of industrial carbon emission intensity trends, the carbon emission intensity of all provinces decreases significantly from 2004 to 2019. The overall industrial carbon emission intensity of China decreases from 11.5210 to 6.3521, with a decrease of about 44.87%. The average industrial carbon emission intensity of low-carbon areas decreases from 7.3773 to 3.2648 with a decrease of about 55.75%. The average industrial carbon emission intensity in high-carbon areas decreases from 19.1107 to 12.8883, with a decrease of 32.56%. Thus, we can see that the central and western areas with high carbon emission intensity are still the key areas for carbon emission reduction in China.
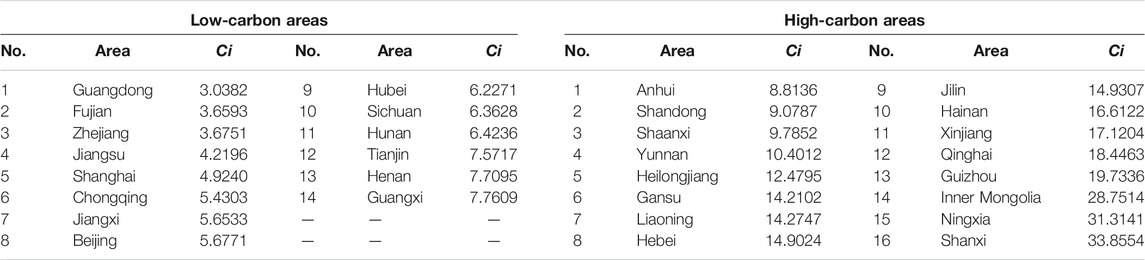
TABLE 1. Average industrial carbon emission intensity in various provinces in China from 2004 to 2019 (tons/million).
Before performing empirical analysis, we conduct a panel unit root test using the LLC test and the ADF-Fisher test. The results in Table 2 show that the original hypothesis of the existence of a unit root for each variable is strongly rejected, so the panel series is stationary.
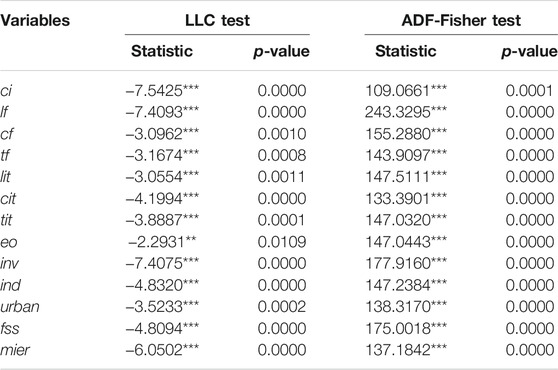
TABLE 2. Results of the panel unit root test.
Table 3 is the analysis results of full samples. Col. (1) indicates that labor force inflow can exacerbate industrial carbon intensity, which is similar to the findings of Liu et al. (2021). One possible reason is that the cross-regional labor mobility is accompanied by the adjustment of labor structure, which is mainly manifested in the transfer of rural labor and the transfer of labor from the primary industry to the secondary and tertiary industries. Especially, the increase in employment in the secondary industry implies the expansion of the industrial scale and the increase in energy consumption and carbon emission intensity. Col. (2) and Col. (3) show that labor-intensive industrial transfer contributes to the reduction of industrial carbon emission intensity. The negative estimated value of the interaction term between labor mobility and labor-intensive industrial transfer indicates that the emission reduction effect of labor-intensive industrial transfer can be strengthened with the inflow of labor. The reason may be that labor-intensive industries such as food processing, furniture manufacturing, and textiles have lower carbon emission intensity compared with capital-intensive industries such as metal products and chemical raw material processing (Fu et al., 2021a). While the spatial mismatch between labor-intensive industry transfer and labor mobility will lead to a structural shortage of labor, forcing labor-intensive industries to undergo automation and intelligent transformation and upgrading. In addition, due to the natural labor-dependent attributes of labor-intensive industries, the return of labor will alleviate the contradiction between labor supply and demand in areas where labor-intensive industries are transferred in. Therefore, with the increase of labor inflow, the carbon emission reduction effect of labor-intensive industry transfer areas is strengthened.
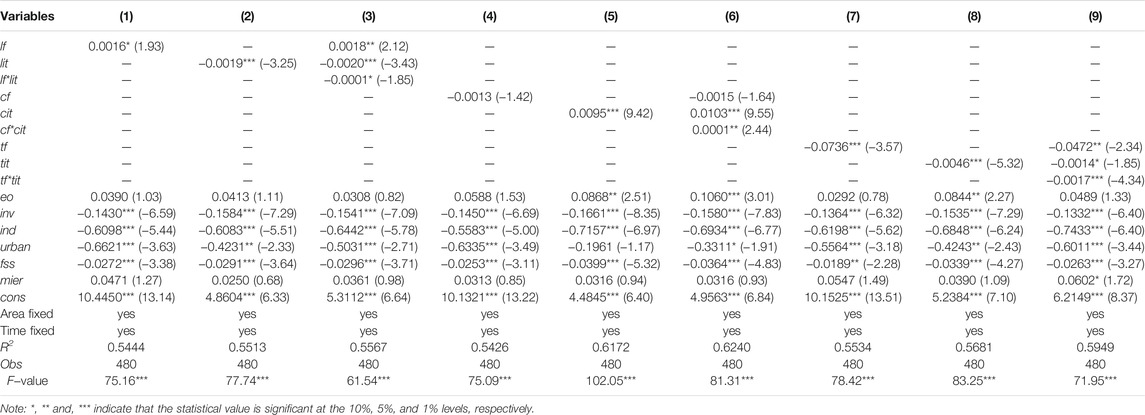
TABLE 3. Results of baseline regression.
In Table 3, col. (4)–(6) show that the estimated value of capital mobility is negative but not significant, the capital-intensive industries transfer aggravates the industrial carbon emission intensity, and the interaction term between the two indicators indicates that the negative impact of capital-intensive industrial transfer on carbon emission reduction is enhanced by the capital inflow. Generally speaking, capital inflows are conducive to promoting the adjustment of the industrial structure, and promoting the transformation of industries that have lost their comparative advantages and high energy-consuming industries, thus promoting carbon emission reduction. However, capital inflows represent a net outflow of trade in goods and services, it means that the areas with goods outflows bear the carbon emissions from the production of goodes for other areas (Seo et al., 2015). The more the capital inflows, the higher the implied carbon emissions, which in turn may weaken the emission reduction effect of capital inflow. From the industrial perspective, since capital-intensive industries often have the characteristics of high energy consumption and high pollution (Hu et al., 2021), the transfer of capital-intensive industries is actually accompanied by the transfer of carbon emissions, so industrial carbon emissions intensity will increase with the transfer of capital-intensive industries, which is consistent with the theoretical analysis. In addition, since the capital mobility examined in this paper reflects the trade of goods and services in the domestic market, combined with the direction of capital mobility and capital-intensive industry transfer in Figure 2, it can be seen that the areas of capital inflow are mainly those with low carbon emission intensity. Although capital inflow can provide the basic conditions for industrial transformation and upgrading, however, capital inflow makes the area bear the carbon emissions generated in the production of goods exported to other areas. Capital inflow areas such as Shandong and Tianjin are also areas where capital-intensive industrial are transferred in. The directions of capital mobility in these areas are relatively matched with that of capital-intensive industry transfer, which also exacerbates the negative impact of capital-intensive industry transfer on carbon emission reduction.
In Table 3, col. (7)–(9) show that both technology mobility and technology-intensive industrial transfer are conducive to reducing industrial carbon emission intensity, and the interaction of the two indicators further enhances the effect of carbon emission reduction, indicating that technology mobility and technology-intensive industrial transfer are effective ways to promote carbon emission reduction and achieve “Carbon Peak and Carbon Neutrality”. The result of the control variables show that independent innovation also significantly reduces industrial carbon emission intensity, which can further demonstrate that technological progress is an important way to achieve carbon emission reduction goals (Sun et al., 2021).
The above analysis shows that the matching of labor mobility and labor-intensive industrial transfer, and the matching of technology mobility and technology-intensive industrial transfer are both conducive to carbon emission reduction. While the matching of capital mobility and capital-intensive industrial transfer is unfavorable to carbon emission reduction in areas where capital-intensive industries are transferred in. Combining with the spatial matchability of factor mobility and industrial transfer in Figure 2, it can be found that, during the 2004–2019, the matchability of labor mobility and labor-intensive industrial transfer, and that of technology mobility and technology-intensive industrial transfer is poor, while the matchability of capital mobility and capital-intensive industrial transfer is better. This result indicates that there is a fragmentation between factor mobility and industrial transfer, which makes factor allocation ineffective in serving the needs of industrial layout adjustment and cannot effectively play the positive role of carbon emission reduction mechanism of industrial transfer.
Although some control variables and fixed effects are added in the model to reduce the estimation bias caused by omitted variables, the potential endogeneity caused by reverse causality still needs to be considered. In this paper, we mainly explore that, under the pressure of carbon emission reduction in China, local governments may adjust their industrial transfer strategies according to carbon emissions, thus affecting the spatial layout of industries transfer.
The average listing price of industrial land can be used as an instrumental variable for industrial transfer (Hou and Liang, 2021). The cost of industrial land is an important factor in the process of industrial transfer, and in order to maximize corporate profits, enterprises tend to move to regions with low industrial land costs, so industrial transfer is closely related to the listing price of industrial land. Besides, the average listing price of industrial land is generally not affected by carbon emission intensity, so it can be used as an instrumental variable for industrial transfer. We crawled 381,161 industrial land transaction data from 2004 to 2019 from the China Land Market website using crawler technology. After that, based on the industrial classification criteria in this paper and the “industry type” in the land transaction information, we divide the listing price of industrial land into listing price of labor-intensive industrial land, listing price of capital-intensive industrial land and listing price of technology-intensive industrial land, which were then used as instrumental variables for labor-intensive industrial transfer, capital-intensive industrial transfer and technology-intensive industrial transfer, respectively. And then we use the 2sls method to estimate them. The higher the listing price of industrial land, the less conducive to industrial transfer. Therefore, we use the opposite value of the listing price of industrial land in the endogeneity discussion to compare with the baseline regression results. As shown in Col. (1)–(3) of Table 4, although the regression results of the 2sls model are slightly different from the baseline regression results in the estimates of some explanatory variables, the signs and significance of the coefficients are basically consistent, which can indicate that the regression results are still robust after considering the interference of endogeneity problems.
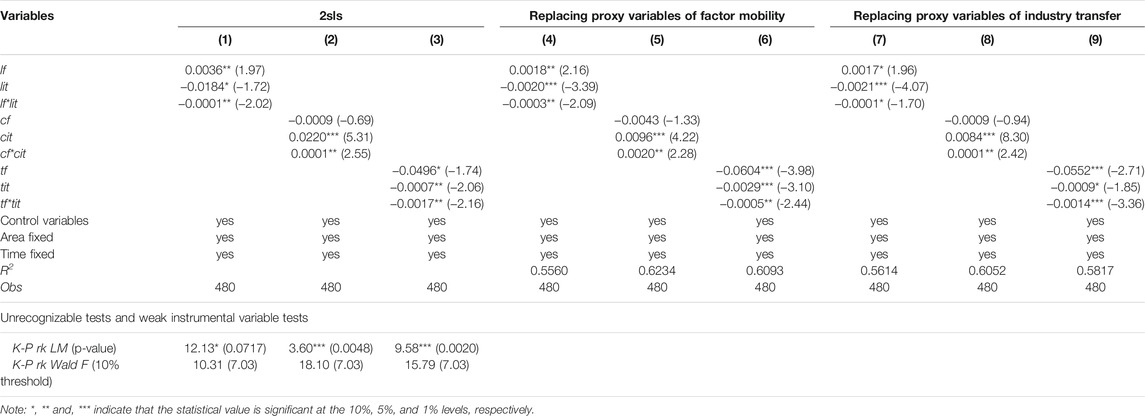
TABLE 4. Results of endogeneity discussion and robustness tests.
In addition, we adopt the method of replacing key variables for robustness tests to test the reliability of the experimental results. Since factor mobility and industry transfer are the key explanatory variables in this paper, the choice of their proxy variables is crucial to the empirical results. We replace the proxy variables for factor mobility and industrial transfer, respectively, and the results are shown in Table 4. Col. (4)–(6) are the results after replacing proxy variables of factor mobility. We replace labor mobility, capital mobility, and technology mobility with the changes in the proportion of the labor force in each province to the total national labor force (Chen and Bai, 2019), the changes in the proportion of fixed asset investment in each province to the total national investment (Qiang and Hu, 2022), and relative share of technology market transactions to GDP, respectively. Col. (7)–(9) are the results after replacing proxy variables of industrial transfer, we recalculate the industrial transfer index by replacing the total industrial output value with the industrial sales value. As can be seen from Table 4, the relationship between factor mobility, industrial transfer and industrial carbon emission intensity does not change substantially after replacing the explanatory variable, and the signs of other estimated variables are consistent with that of baseline regression and remain significant. Therefore, we believe that the results of this paper are basically robust.
Yu et al. (2018) shows that industrial carbon emission intensity can reflect the carbon reduction capacity of the industrial sector in an area. A lower carbon intensity may represent a greater ability to reduce emissions, and then reducing the negative impact of transferring high carbon industries to the area. Conversely, areas with high industrial carbon emission intensity and weak emission reduction capacity may be more negatively affected by the transfer of high-carbon industries. In other words, the influence of the interaction of factor mobility and industrial transfer on industrial carbon emission intensity may be heterogeneous at different industrial carbon emission levels, and the panel quantile regression is one of the effective methods to verify the above point (Opoku and Aluko, 2021). The results reported at different quantiles of industrial carbon emission intensity are shown in Table 5.
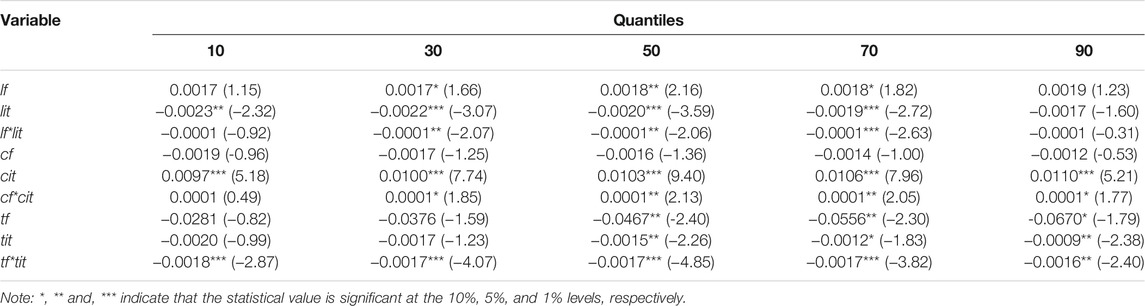
TABLE 5. Results of quantile regression.
As shown in Table 5, the estimated value of labor mobility is always positive but significant only at the 30th to 70th quartiles. The process of labor mobility across areas is also accompanied by labor transfers between rural and urban areas, and between agricultural and non-agricultural sectors. The higher the ratio of the labor force working in the non-agricultural sector, the higher the carbon emissions (Hao et al., 2021). Therefore, in general, labor mobility exacerbates the intensity of industrial carbon emission. In contrast, the estimated value of labor-intensive industry transfer is negative and its absolute value decreases as the quantile increases, indicating that the labor-intensive industry transfer can reduce industrial carbon emission intensity (Fu et al., 2021b). And the lower the industrial carbon emission intensity, the stronger the emission reduction capacity, the more obvious the emission reduction effect of labor-intensive industries transfer. While at the 90th quartile level, the emission reduction effect of labor-intensive industries is no longer significant. Looking at the interaction term of labor mobility and labor-intensive industry transfer, the magnitude of the estimated value does not change significantly at each quartile level, but the significance of the estimated value is the same as that of labor mobility, which indicates that the carbon reduction effect of labor-intensive industries can be strengthened with labor inflow.
The estimated value of capital mobility is negative but insignificant, while the estimated value of capital-intensive industry transfer is significantly positive at all quartile levels, and gradually become larger as the quartile increases. This result indicates that the negative effect of capital-intensive industry transfer on carbon emission reduction gradually increases with the increase of industrial carbon intensity. The interaction term between capital mobility and capital-intensive industrial transfer is significantly positive at the 30th to 90th quartiles, but the estimated value does not change significantly, which is similar to the baseline regression results, indicating that capital mobility exacerbates the negative impact of capital-intensive industrial transfer on carbon emission reduction again.
When the industrial carbon emission intensity is at the 50th to 90th quartiles, technology mobility has a significant positive effect on industrial carbon reduction, and the absolute value of the coefficient increases as the quartile level increases. Technology-intensive industrial transfer also has a positive effect on industrial carbon reduction, but it is only significant at the 50th to 90th quantiles, and the emission reduction effect of technology-intensive industrial transfer gradually decreases with the increase of carbon emission intensity. One possible reason is that, compared with low carbon emission areas, high carbon emission intensity areas have relatively weaker emission reduction capacity and a relatively lower overall technology level. Therefore, although the transfer of technology-intensive industries can reduce industrial carbon emission intensity, the technology level in these areas may not be able to meet the needs of technology-intensive industry development in a short time. Besides, since the supporting facilities required for technology-intensive industry development are inadequate, the emission reduction effect of technology-intensive industry transfer continues to weaken as industrial carbon emission intensity increases.
Reducing industrial carbon emission intensity is an important way to promote carbon emission reduction and achieve the goal of “Carbon Peak and Carbon Neutrality”. This paper proposes a dynamic industrial transfer index and discusses the impact of the spatial matchability of factor mobility and industrial transfer on industrial carbon emission intensity by using Chinese provincial panel data from 2004 to 2019. There are several findings as follows.
First, there is an obvious spatial mismatch between the direction of factor mobility and the trend of industrial transfer in China. Taking the national average industrial carbon emission intensity as the basis for division, production factors generally flow from high-carbon to low-carbon areas, labor-intensive and technology-intensive industries generally transfer from low-carbon to high-carbon areas. However, the transfer of capital-intensive industries is relatively lagging behind, and low-carbon areas are still the main production bases for capital-intensive products. Second, China’s carbon emission reduction capacity has been improving, and the industrial carbon emission intensity has decreased significantly, with the national average industrial carbon emission intensity decreasing from 11.5210 to 6.3521 (a decrease of about 44.87%). Third, the interaction between factor mobility and industrial transfer can affect the industrial carbon emission intensity. When the directions of labor mobility and technology mobility are consistent with that of labor-intensive and technology-intensive industrial transfer, respectively, the carbon emission reduction effect of industrial transfer will be strengthened. When the direction of capital mobility is consistent with capital-intensive industrial transfer, the capital inflow will aggravate the negative impact of capital-intensive industry transfer on carbon emission. Finally, the impacts of factor mobility, industrial transfer, and the matchability of the two on industrial carbon emission intensity are heterogeneous, the carbon reduction effects of labor-intensive and technology-intensive industries are more obvious in low-carbon areas, while the negative effects of capital-intensive industrial transfer on emission reduction are more obvious in high-carbon areas.
In response to the above findings, we propose the following recommendations. First, it is necessary to make reasonable use of the “invisible hand” of the market and the “visible hand” of the government. On the one hand, it is necessary to play the decisive role of the market in factor allocation, speed up the reform of factor market prices, and promote the optimal allocation of factors according to market rules and market prices. On the other hand, in the process of promoting the government’s role to change from “setting prices” to “setting rules,” it is necessary to promote the coordination of the market-oriented reform of factor allocation and regional coordinated development policies to alleviate the problem of regional factor mismatch.
Second, the strategic arrangement of industrial transfer should focus on the “trinity” of industrial structure upgrading, spatial layout adjustment and carbon emission reduction targets to achieve technological and structural emission reduction of industrial transfer. The central and western areas should raise the environmental access threshold and implement stricter environmental supervision policies to force the transformation and upgrading of the “high-pollution and high-consumption industries” and avoid becoming a “pollution refuge” for domestic industrial transfer. At the same time, it is necessary to strengthen the planning of industrial transfer to weaken the negative impact of the transfer of the “high-pollution and high-consumption industries” on carbon emission reduction in terms of the location of transferred industries, supporting facilities, and the construction of industrial parks. The eastern areas should give full play to its advantages of strong independent innovation capability, high energy efficiency and industrial concentration, take the lead in promoting green transformation, and promote industrial emission reduction through industrial upgrading.
Third, a green and low-carbon modern industrial pattern should be actively built. On the one hand, it is necessary to accelerate the adjustment of energy structure and increase the proportion of renewable energy in the final energy consumption. At the same time, pay more attention to green independent technology innovation, and take the energy saving and clean technology as the focus of research, so as to promote the process of clean production. On the other hand, it is necessary to speed up the adjustment of industrial structure, curb the “high-pollution and high-consumption industries,” and focus on the development of strategic emerging industries and high-tech industries. In addition, it is necessary to give full play to the role of the carbon trading market and carbon tax in reducing carbon emissions. The coverage of the carbon emissions trading market needs to be gradually expanded, more attention should be paid to the role of fiscal policy in carbon emission reduction, and the introduction of the “carbon tax” should be actively explored.
The datasets can be obtained from the National Bureau of Statistics of China. http://www.stats.gov.cn.
XZ: Conceptualization, Methodology, Software, Data Curation, Validation, Writing—Original Draft, Visualization. HY: Formal analysis, Resources, Writing—Review and Editing. LY: Writing—Review and Editing, Supervision, Project administration.
The authors declare that the research was conducted in the absence of any commercial or financial relationships that could be construed as a potential conflict of interest.
All claims expressed in this article are solely those of the authors and do not necessarily represent those of their affiliated organizations, or those of the publisher, the editors and the reviewers. Any product that may be evaluated in this article, or claim that may be made by its manufacturer, is not guaranteed or endorsed by the publisher.
Alonso-Carrera, J., and Raurich, X. (2018). Labor Mobility, Structural Change and Economic Growth. J. Macroeconomics 56, 292–310. doi:10.1016/j.jmacro.2018.03.002
Alvarado, R., Tillaguango, B., Dagar, V., Ahmad, M., Işık, C., Méndez, P., et al. (2021). Ecological Footprint, Economic Complexity and Natural Resources Rents in Latin America: Empirical Evidence Using Quantile Regressions. J. Clean. Prod. 318, 128585. doi:10.1016/j.jclepro.2021.128585
Arauzo-Carod, J.-M., Liviano-Solis, D., and Manjón-Antolín, M. (2010). Empirical Studies in Industrial Location: an Assessment of Their Methods and Results*. J. Reg. Sci. 50, 685–711. doi:10.1111/j.1467-9787.2009.00625.x
Cao, W. D., and Zhang, Y. Z. (2021). Research on China’s Inter-regional Manufacturing Transfer and its Structural Evolution. Resour. Environ. Yangtze Basin. 30, 591–601. doi:10.11870/cjlyzyyhj202103007
Chen, J., Gao, M., Mangla, S. K., Song, M., and Wen, J. (2020). Effects of Technological Changes on China's Carbon Emissions. Technol. Forecast. Soc. Change 153, 119938. doi:10.1016/j.techfore.2020.119938
Chen, L., Xu, L., Cai, Y., and Yang, Z. (2021). Spatiotemporal Patterns of Industrial Carbon Emissions at the City Level. Resour. Conservation Recycling 169, 105499. doi:10.1016/j.resconrec.2021.105499
Chen, Y. E., and Bai, J. H. (2019). Factor Flow and Regional Economic Disparities. Mod. Econ. Res. 6, 6–13. doi:10.13891/j.cnki.mer.2019.06.003
Chen, Y. J., and Chen, A. Z. (2007). From Labor Force Transfer to Industrial Regional Transfer. Econ. Theor. Business Manag. 2, 42–46.
Fu, H., Li, G. P., and Zhu, T. (2021a). Carbon Emission of China’s Manufacturing Industry: Industry Differences and Decomposition of Driving Factors. Reform 5, 38
Fu, S., Ma, Z., Ni, B., Peng, J., Zhang, L., and Fu, Q. (2021b). Research on the Spatial Differences of Pollution-Intensive Industry Transfer under the Environmental Regulation in China. Ecol. Indicators 129, 107921. doi:10.1016/j.ecolind.2021.107921
Gao, M., Yang, H., Xiao, Q., and Goh, M. (2022). A Novel Method for Carbon Emission Forecasting Based on Gompertz's Law and Fractional Grey Model: Evidence from American Industrial Sector. Renew. Energ. 181, 803–819. doi:10.1016/j.renene.2021.09.072
Hair, J. F., Anderson, R. E., Tatham, R. L., and Black, W. C. (1995). Multivariate Data Analysis. 3rd ed. New York: Macmillan.
Hao, Y., Zhang, Z.-Y., Yang, C., and Wu, H. (2021). Does Structural Labor Change Affect CO2 Emissions? Theoretical and Empirical Evidence from China. Technol. Forecast. Soc. Change 171, 120936. doi:10.1016/j.techfore.2021.120936
Hou, Z. H., and Liang, S. L. (2021). The Belt and Road. Industrial Transfer Regional Coordination Development. J. Shanxi Univ. Finance Econ. 43, 43–57. doi:10.13781/j.cnki.1007-9556.2021.07.004
Hu, K., and Wu, Q. (2012). An Institutional Economics Analysis on Provincial Capital Mobility. J. Quant. Tech. Econ. 29, 20–36+51. doi:10.13653/j.cnki.jqte.2012.10.002
Hu, Y., Yu, Y., and Mardani, A. (2021). Selection of Carbon Emissions Control Industries in China: An Approach Based on Complex Networks Control Perspective. Technol. Forecast. Soc. Change 172, 121030. doi:10.1016/j.techfore.2021.121030
Intergovernmental Panel on Climate Change (IPCC) (2014). Climate Change 2014. Available at: https://www.ipcc.ch/report/ar5/syr/(Accessed July 18, 2021).
Jia, J., Ma, G., Qin, C., and Wang, L. (2020). Place-based Policies, State-Led Industrialisation, and Regional Development: Evidence from China's Great Western Development Programme. Eur. Econ. Rev. 123, 103398. doi:10.1016/j.euroecorev.2020.103398
Jorgenson, D. W., and Wilcoxen, P. J. (1990). Environmental Regulation and U.S. Economic Growth. RAND J. Econ. 21, 314–340. doi:10.2307/2555426
Kabir, M. N., Rahman, S., Rahman, M. A., and Anwar, M. (2021). Carbon Emissions and Default Risk: International Evidence from Firm-Level Data. Econ. Model. 103, 105617. doi:10.1016/j.econmod.2021.105617
Khan, A., Chenggang, Y., Hussain, J., Bano, S., and Nawaz, A. (2020). Natural Resources, Tourism Development, and energy-growth-CO2 Emission Nexus: A Simultaneity Modeling Analysis of BRI Countries. Resour. Pol. 68, 101751. doi:10.1016/j.resourpol.2020.101751
Koenker, R. (2004). Quantile Regression for Longitudinal Data. J. Multivariate Anal. 91, 74–89. doi:10.1016/j.jmva.2004.05.006
Li, Q., Wu, S., Lei, Y., Li, S., and Li, L. (2021). Evolutionary Path and Driving Forces of Inter-industry Transfer of CO2 Emissions in China: Evidence from Structural Path and Decomposition Analysis. Sci. Total Environ. 765, 142773. doi:10.1016/j.scitotenv.2020.142773
Li, S.-a., Gong, L., Pan, S., and Luo, F. (2020). Wage and price Differences, Technology gap and Labor Flow Dynamics. Econ. Model. 88, 211–222. doi:10.1016/j.econmod.2019.09.031
Li, Z., Shao, S., Shi, X., Sun, Y., and Zhang, X. (2019). Structural Transformation of Manufacturing, Natural Resource Dependence, and Carbon Emissions Reduction: Evidence of a Threshold Effect from China. J. Clean. Prod. 206, 920–927. doi:10.1016/j.jclepro.2018.09.241
Lin, L. S., and Wang, Y. Q. (2006). Transport Cost, Labor Mobility and the Spatial Distribution of Manufacturing Industrial. Econ. Res. J. 3, 115–125.
Liu, J., Bai, J., Deng, Y., Chen, X., and Liu, X. (2021). Impact of Energy Structure on Carbon Emission and Economy of China in the Scenario of Carbon Taxation. Sci. Total Environ. 762, 143093. doi:10.1016/j.scitotenv.2020.143093
Liu, T., Pan, S., Hou, H., and Xu, H. (2020). Analyzing the Environmental and Economic Impact of Industrial Transfer Based on an Improved CGE Model: Taking the Beijing-Tianjin-Hebei Region as an Example. Environ. Impact Assess. Rev. 83, 106386. doi:10.1016/j.eiar.2020.106386
Lu, X. X., and Wang, S. S. (2021). The north-south Differences and Formation Mechanisms of China’s Factor Market Allocation Level. J. Quant. Tech. Econ. 38, 21–42. doi:10.13653/j.cnki.jqte.2021.11.002
Luo, H., and Dai, Z. M. (2019). Study on Industrial Transfer Efficiency in Yangtze River Basin Based on Entropy Weight from the Perspective of Coordination Degree. Sci. Technol. Prog. Pol. 36, 58–64. doi:10.6049/kjjbydc.2018070091
Ma, X., Wang, C., Dong, B., Gu, G., Chen, R., Li, Y., et al. (2019). Carbon Emissions from Energy Consumption in China: Its Measurement and Driving Factors. Sci. Total Environ. 648, 1411–1420. doi:10.1016/j.scitotenv.2018.08.183
Opoku, E. E. O., and Aluko, O. A. (2021). Heterogeneous Effects of Industrialization on the Environment: Evidence from Panel Quantile Regression. Struct. Change Econ. Dyn. 59, 174–184. doi:10.1016/j.strueco.2021.08.015
Peng, H., Qi, S., and Cui, J. (2021). The Environmental and Economic Effects of the Carbon Emissions Trading Scheme in China: The Role of Alternative Allowance Allocation. Sustainable Prod. Consumption 28, 105–115. doi:10.1016/j.spc.2021.03.031
Qamruzzaman, M., and Jianguo, W. (2020). The Asymmetric Relationship between Financial Development, Trade Openness, Foreign Capital Flows, and Renewable Energy Consumption: Fresh Evidence from Panel NARDL Investigation. Renew. Energ. 159, 827–842. doi:10.1016/j.renene.2020.06.069
Qiang, H., and Hu, L. (2022). Population and Capital Flows in Metropolitan Beijing, China: Empirical Evidence from the Past 30 Years. Cities 120, 103464. doi:10.1016/j.cities.2021.103464
Rauf, A., Liu, X., Amin, W., Rehman, O. U., Li, J., Ahmad, F., et al. (2020). Does Sustainable Growth, Energy Consumption and Environment Challenges Matter for Belt and Road Initiative Feat? A Novel Empirical Investigation. J. Clean. Prod. 262, 121344. doi:10.1016/j.jclepro.2020.121344
Seo, S., Kim, J., Yum, K.-K., and McGregor, J. (2015). Embodied Carbon of Building Products during Their Supply Chains: Case Study of Aluminium Window in Australia. Resour. Conservation Recycling 105, 160–166. doi:10.1016/j.resconrec.2015.10.024
Sun, H. P., Edziah, B. K., Kporsu, A. K., Sarkodie, S. A., and Taghizadeh-Hesary, F. (2021). Energy Efficiency: The Role of Technological Innovation and Knowledge Spillover. Technol. Forecast. Soc. 167, 120659. doi:10.1016/j.techfore.2021.120659
Sun, X. H., Guo, X., and Wang, Y. (2018). Industrial Relocation, Elements Agglomeration and Regional Economic Development. Manag. World 34, 47–62+179180. doi:10.19744/j.cnki.11-1235/f.2018.05.004
Sun, Z., and Hou, Y. L. (2021). Industrial Intelligence and Industrial Gradient Transfer: Re-examination of the “Flying Geese Theory”. J. World Econ. 44, 29–54.
UNEP (2020). Emissions gap Report 2020. Available at: https://wedocs.unep.org/handle/20.500.11822/34467 (Accessed July 3, 2021).
Wakiyama, T., and Zusman, E. (2021). The Impact of Electricity Market Reform and Subnational Climate Policy on Carbon Dioxide Emissions across the United States: A Path Analysis. Renew. Sustain. Energ. Rev. 149, 111337. doi:10.1016/j.rser.2021.111337
Wang, C. K. (2021). Industrial Transfer, Labor Mobility and Gradient Traps: Study on the Difficulty in Recruitment in central and Western Regions. Reform Econ. Syst. 2, 109–115.
Wang, Y., Wang, X., Chen, W., Qiu, L., Wang, B., and Niu, W. (2021). Exploring the Path of Inter-provincial Industrial Transfer and Carbon Transfer in China via Combination of Multi-Regional Input-Output and Geographically Weighted Regression Model. Ecol. Indicators 125, 107547. doi:10.1016/j.ecolind.2021.107547
Waugh, M. E., and Ravikumar, B. (2016). Measuring Openness to Trade. J. Econ. Dyn. Control. 72, 29–41. doi:10.1016/j.jedc.2016.03.009
Xu, W. (2021). The Impact and Influencing Path of the Pilot Carbon Emission Trading Market--Evidence from China. Front. Environ. Sci. 9, 787655. doi:10.3389/fenvs.2021.787655
Yan, Y. F., and Yang, L. K. (2010). China's Foreign Trade and Climate Change: A Case Study of CO2 Emissions. Energy Policy 38, 350–356. doi:10.1016/j.enpol.2009.09.025
Yu, L., Li, H., Wang, Z., and Duan, Y. (2019). Technology Imports and Self-Innovation in the Context of Innovation Quality. Int. J. Prod. Econ. 214, 44–52. doi:10.1016/j.ijpe.2018.11.023
Yu, S., Hu, X., Fan, J.-l., and Cheng, J. (2018). Convergence of Carbon Emissions Intensity across Chinese Industrial Sectors. J. Clean. Prod. 194, 179–192. doi:10.1016/j.jclepro.2018.05.121
Zhai, R. X. (2016). A Review of Research on Factor Mobility and Industrial Transfer. Mod. Manag. Sci. 8, 42–44.
Zhang, G., Zhang, P., Zhang, Z. G., and Li, J. (2019). Impact of Environmental Regulations on Industrial Structure Upgrading: An Empirical Study on Beijing-Tianjin-Hebei Region in China. J. Clean. Prod. 238, 117848. doi:10.1016/j.jclepro.2019.117848
Zhang, L. (2016). Labor Migration, Industrial Transfer and Regional Industrial Agglomeration: An Empirical Study Based on Provincial Panel Data. Collect. Essay Finance Econ. 6, 3–10. doi:10.13762/j.cnki.cjlc.20160104.001
Zhang, Z. D., and Wu, D. (2019). Industrial Spatial Agglomeration, Factor Mobility and Regional Balanced Development: From the Perspective of Urban Economic Development gap in the Yangtze River Economic Zone. Reform. Econ. Syst. 4, 42–48.
Zhao, R. Y., and Xu, J. (2020). Spatial Agglomeration and Unbalanced Development of Elements in Northeast China. Sci. Geogr. Sin. 40, 1104–1113. doi:10.13249/j.cnki.sgs.2020.07.007
Zhao, X. G., and Lu, F. (2019). Spatial Distribution Characteristics and Convergence of China’s Regional Energy Intensity: An Industrial Transfer Perspective. J. Clean. Prod. 233, 903–917. doi:10.1016/j.jclepro.2019.06.073
Zhao, X., Liu, C., Sun, C., and Yang, M. (2020). Does Stringent Environmental Regulation lead to a Carbon haven Effect? Evidence from Carbon-Intensive Industries in China. Energ. Econ. 86, 104631. doi:10.1016/j.eneco.2019.104631
Zhao, X., and Luo, D. (2018). Forecasting Fossil Energy Consumption Structure toward Low-Carbon and Sustainable Economy in China: Evidence and Policy Responses. Energ. Strategy Rev. 22, 303–312. doi:10.1016/j.esr.2018.10.003
Zhao, X., and Yin, H. (2011). Industrial Relocation and Energy Consumption: Evidence from China. Energy Policy 39, 2944–2956. doi:10.1016/j.enpol.2011.03.002
Zhao, Y., Ding, H., Lin, X., Li, L., Liao, W., and Liu, Y. (2021). Carbon Emissions Peak in the Road and marine Transportation Sectors in View of Cost-Benefit Analysis: A Case of Guangdong Province in China. Front. Environ. Sci. 9, 754192. doi:10.3389/fenvs.2021.754192
Zheng, Z. (2021). Re-calculation of Responsibility Distribution and Spatiotemporal Patterns of Global Production Carbon Emissions from the Perspective of Global Value Chain. Sci. Total Environ. 773, 145065. doi:10.1016/j.scitotenv.2021.145065
Zhou, B., Zhang, C., Song, H., and Wang, Q. (2019). How Does Emission Trading Reduce China's Carbon Intensity? an Exploration Using a Decomposition and Difference-In-Differences Approach. Sci. Total Environ. 676, 514–523. doi:10.1016/j.scitotenv.2019.04.303
Keywords: factor mobility, industrial transfer, carbon emission intensity, dynamic industrial transfer index, spatial matchability
Citation: Zheng X, Yu H and Yang L (2022) Factor Mobility, Industrial Transfer and Industrial Carbon Emission: A Spatial Matching Perspective. Front. Environ. Sci. 10:822811. doi: 10.3389/fenvs.2022.822811
Received: 26 November 2021; Accepted: 10 January 2022;
Published: 03 February 2022.
Edited by:
Huaping Sun, Jiangsu University, ChinaReviewed by:
Huiming Zhang, Nanjing University of Information Science and Technology, ChinaCopyright © 2022 Zheng, Yu and Yang. This is an open-access article distributed under the terms of the Creative Commons Attribution License (CC BY). The use, distribution or reproduction in other forums is permitted, provided the original author(s) and the copyright owner(s) are credited and that the original publication in this journal is cited, in accordance with accepted academic practice. No use, distribution or reproduction is permitted which does not comply with these terms.
*Correspondence: Lin Yang, WWFuZ2xpbjIxMjhAMTI2LmNvbQ==
Disclaimer: All claims expressed in this article are solely those of the authors and do not necessarily represent those of their affiliated organizations, or those of the publisher, the editors and the reviewers. Any product that may be evaluated in this article or claim that may be made by its manufacturer is not guaranteed or endorsed by the publisher.
Research integrity at Frontiers
Learn more about the work of our research integrity team to safeguard the quality of each article we publish.