 Pan Rao
 Fangting Xie
 Shubin Zhu4*
 Caiwang Ning
- 1School of Management and Economics, Changbei Economic and Technological Development Zone, Jiangxi Agricultural University, Nanchang, China
- 2College of Economics and Management, Zhejiang A&F University, Hangzhou, China
- 3Research Academy for Rural Revitalization of Zhejiang Province, Zhejiang A&F University, Hangzhou, China
- 4Institute of Rural Development, Changbei Economic and Technological Development Zone, Jiangxi Agricultural University, Hangzhou, China
This paper explores how broadband infrastructure affects rural household carbon dioxide emissions (HCE). Based on the Environmental Kuznets curve hypothesis, a quasi-natural experiment of a “Broadband Village” (B&V) in China is conducted. Panel data from 9,790 rural households were collected as part of the China Family Finance Survey (CHFS). The consumer lifestyle approach was used to calculate HCE and a Difference-in-Differences (DID) model was used to analyze the impact of a B and V pilot project on rural HCE. The results of DID model showed that B and V significantly increases rural HCE, with an influencing coefficient 1.7. Subsequently, Threshold Model was utilized to examine the nonlinear relationship between household broadband penetration and rural HCE. The results revealed the threshold effect between rural household broadband penetration and rural HCE. Namely, the growth effect of B and V to rural HCE would be much weaker, if rural household broadband penetration goes above a threshold level, 31.32%. Our analysis provides important insights for policymakers to formulate digital village and income redistribution policies to support rural carbon dioxide (CO2) emissions reductions.
1 Introduction
Overcoming the challenge of more frequent and extreme weather events has captured much attention from researchers (Howden et al., 2007; Huang et al., 2015; IPCC, 2018). Carbon dioxide (CO2) is the main gas causing climate change and greenhouse effects (World Bank, 2007). Climate change has substantial impacts on water balance, affecting the surrounding industry and agriculture and economic sectors (Zhou et al., 2018; Zhou et al., 2021). Therefore, reducing CO2 emissions and promoting low-carbon development have become global development goals. Currently, most mitigation efforts are focused on the production side, such as emissions trading schemes (Cui et al., 2014; Liu et al., 2015; Wang et al., 2015; Arce et al., 2016; Xiong et al., 2017), and the development of low-carbon energy technology (Chen et al., 2011; Li et al., 2011; Du and Mao, 2015; Xue et al., 2015). However, approximately 72% of global CO2 emissions can be attributed to household consumption (Hertwich and Peters, 2009; Wilson et al., 2013). A reduction of household CO2 emissions (HCE) is essential for achieving the goals of the Paris Agreement (Dubois et al., 2019), which set to keep global temperature rise below 1.5°C below pre-industrial levels. Therefore, the issue of HCE has drawn increasing attention from researchers (Zeng et al., 2021). HCE mainly including CO2 emissions related to heating, air conditioning, cooking, water heating, food consumption, clothing, housing, transportation, and communications (Maraseni et al., 2015; Li J. et al., 2016).
The history of HCE research can be traced back to the 1990s. There were a series of studies on household energy requirements and related CO2 emissions from consumption activities in developed countries, such as Netherland (Vringer and Blok, 1995), Australia (Lenzen, 1998), and Denmark (Munksgaard et al., 2000). Subsequently, relevant studies were also carried out in developing countries, such as India (Pachauri, 2004), Brazil (Cohen et al., 2005). These studies endeavored to find the solutions to mitigating or limiting the CO2 emissions impacts from household consumption patterns and lifestyles.
In China, HCE has also grown rapidly in recent years (Zhou and Gu, 2020; Wu et al., 2019). For a long time, the energy consumed by rural households in China was mainly sourced from non-commercial traditional biomass, such as crop straw, firewood, and biogas (Zhang et al., 2014). Since China’s energy market reformed in 1993, the energy consumed by rural residents has undergone a clear shift towards commercial energy sources. However, in the first decade of the 21st century, the annual growth rate in rural per capita CO2 emissions was almost twice the urban rate (Yao et al., 2012). Figure 1 shows the trends in per capita energy consumption in China’s urban and rural areas from 2011 to 2019, which indicates that rural consumption has gradually increased to a similar level as that of urban consumption. In China, about 500 million people live in rural areas, and their contribution to CO2 emissions cannot be ignored. In addition, the emissions of CO2 and other air pollutants generated by rural energy consumption have also attracted research attention (Tonooka et al., 2003; Zhang et al., 2010). Even though it is necessary to provide modern energy sources to rural residents, avoiding rapid increases in greenhouse gas emissions is a pressing issue (Yao et al., 2012). In response, the Chinese government is actively implementing a carbon peaking and carbon neutral strategy to deal with the challenges posed by global climate change. To achieve this goal, we need to focus on low-carbon consumption.
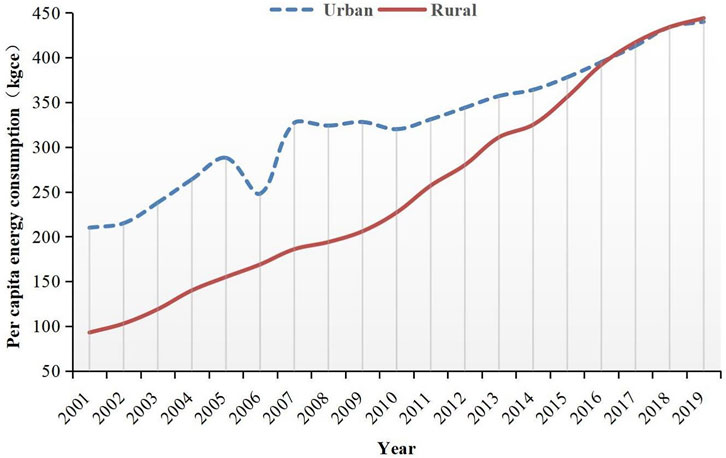
FIGURE 1. Urban and rural living energy consumption from 2001 to 2019 in China.
At the same time, rural areas are vigorously building digital villages. However, during the production of information and communication technology (ICT) equipment, processing, distribution, and installation waste significantly contribute to CO2 emissions (Shahnazi and Shabani, 2020). E-waste production and harmful ICT equipment, such as large data centers and mobile data traffic use, pose a threat to environmental quality (Lennerfors et al., 2015). The use of ICT mainly increases energy consumption and CO2 emissions (Park et al., 2018). However, dematerialization and online distribution, transport and travel substitution, monitoring and management applications, and product stewardship and recycling together reduce energy efficiency and reduce CO2 emissions (Danish B. et al., 2018; Ozcan and Apergis, 2018).
From the earlier literatures, the relationship between ICT and CO2 emissions is ambiguous. So it is particularly important to study the impact of broadband infrastructure on rural HCE. With the help of the policy impact of the B and V pilot, we analyzed the impact of broadband infrastructure on rural HCE. Broadband penetration can be used instead of the effectiveness of broadband infrastructure (Koutroumpis, 2009). Then, we analyzed the nonlinear relationship between rural household broadband penetration and rural HCE. Our results should help determine the implementation effects of rural broadband infrastructure and provide a basis for policymakers to formulate pertinent policies under the constraints of rural income equality. Meanwhile, China can achieve the goal of peaking CO2 emissions by 2030. Accordingly, this study provides several novel contributions. First, unlike most of the previous studies, this study focuses on rural HCE. Second, we analyze the impact of broadband infrastructure on rural HCE using DID model. Third, we discuss the nonlinear relationship between rural broadband penetration and rural HCE.
This paper is organized as follows. After the Introduction, Section 2 reviews the literature. Then we introduce the background to “Broadband Village” (B and V) in China in Section 3; Section 4 describes the analytical framework, data source, and methodology. Section 5 presents our empirical results, which are subjected to a series of robustness tests. Section 6 concludes the paper.
1.1 Literature Review
Some scholars have explored CO2 emission reduction strategies from the perspective of energy use (Chung et al., 2009; Dong et al., 2016). For example, Dong et al. (2019) examined the emission-growth-renewables nexus for a global panel of 120 countries, and found renewable energy consumption had a negative effect on CO2 emissions, but its effect was not significant. Scholars have also investigated other mechanisms that reduce CO2 emissions, such as financial development (Zhao et al., 2021); ICT investments (Wang et al., 2021).
Broadband infrastructure, as high speed internet via broadband, may further facilitate economy-wide growth by accelerating the distribution of information, reduction of transport and transaction costs (Röller and Waverman, 2001; Czernich et al., 2011). Broadband access positively affects the retail sector in rural areas (Aldashev and Batkeyev, 2021). Household broadband penetration within a region is used to represent ICT development level (Akerman et al., 2015; Haller and Lyons, 2015; Fabling and Grimes, 2016). Since the impact of broadband infrastructure on CO2 emissions is less studied, we will further analyze the impact of ICT on CO2 emissions. Many studies have confirmed that ICT has positive impacts on economic growth, particularly in China (Gruber et al., 2014; Han and Zhu, 2014; Kumar et al., 2016; Ghosh, 2017). ICT has brought many positive changes to Chinese residents in terms of income and consumption, with rural areas benefiting more than urban ones (Gao et al., 2018). However, the impact of ICT on household energy consumption is not yet conclusive (Portier, 2005; Bernstein and Madlener, 2010; Ishida, 2015; Salahuddin and Alam, 2016).
At the national and sector levels, studies have suggested that ICT can support technological progress in different economic sectors and improve the operational and energy efficiency of infrastructure (Houghton, 2010; Salahuddin et al., 2015; Lin and Zhou, 2021). However, other studies have taken the opposite view; that the heavy use of Internet-related equipment, such as computers and data centers, can lead to significant increases in energy consumption with negative environmental impacts (David et al., 2018). Danish M. A. et al. (2018) used panel data from emerging economies from 1990 to 2015 to analyze the impact of ICT on environmental pollution. The results showed that the regulatory effect of ICT stimulated the level of CO2 emissions. Higón et al. (2017) studied the impact of ICT on CO2 emissions in 116 developing and 26 developed countries and obtained empirical results suggesting that there is an inverted “U"-shaped relationship between ICT and CO2 emissions.
From a household-level perspective, ICT reduces outdoor activity by overcoming spatial barriers, thereby reducing energy consumption (Danish B. et al., 2018; Ozcan and Apergis, 2018). In addition, ICT can replace physical books with e-books, regular mail with e-mail, and phone conversations instead of face-to-face communication (Park et al., 2018; Ulucak et al., 2020). Bastida et al. (2019) found that ICT can reduce overall electricity consumption by 0.5%. However, some studies have shown that China is in the stage where the development of the Internet is increasing per capita CO2 emissions (Li and Song, 2019). To sum up, the impact of ICT on CO2 emissions is not uniform at the national, regional, or household levels.
Importantly, expanding household consumption and controlling CO2 emissions are long-term policy goals of the Chinese government. However, there may be a degree of incentive incompatibility between them. The Environmental Kuznets Curve (EKC) illustrates that rising income contributes to pollution but after up to a point, after which pollution decreases. However, pollution changes with income due to scale, composition, and technique effects (Grossman and Krueger, 1992, 1995). Therefore, it makes sense to explore the impact of ICT on CO2 emissions as an external technical effect (Zhou et al., 2019).
Although scholars have explored the impact of ICT on CO2 emissions, certain research gaps still exist. 1) In China, the potential for carbon reduction in rural is huge. Few previous studies have focused on the issue of rural HCE under the constraints of rural income equality. Based on the EKC hypothesis, this study analyzes the main influencing factors of rural HCE by using micro-tracking data from the CHFS. 2) Few scholars studied the impact of ICT or broadband infrastructure on HCE. We take the B and V pilot as a quasi-natural experiment and analyze the impact of broadband infrastructure on rural HCE using DID model 3) We also explore the nonlinear relationship between rural household broadband penetration and HCE. We found a significant threshold effect between them. The growth effect of B&V to rural HCE would weaken a lot, if rural household broadband penetration goes above a threshold level.
1.2 Background to B&V in China
B&V is an important part of the Chinese government’s strategy of “Broadband China”1. On 17 August 2013, the “Broadband China” Strategy and Implementation Plan was formally issued by the State Council. Due to China’s urban-rural dual structure, the construction of rural broadband has lagged that of urban areas for a long time. In June 2014, with the overall planning of the goals of the Broadband China strategy, a B&V pilot project was conducted jointly by the National Development and Reform Commission, the Ministry of Finance, and the Ministry of Industry and Information Technology to achieve the rural broadband development goals. The project emphasizes the installation of optical cable in administrative villages and the development of 3G, 4G, and LTE networks to provide faster, cheaper Internet to rural residents2.
Sichuan Province and Yunnan Province were selected for the first phase of the B&V pilot project. Both provinces officially launched B&V construction projects in July 2014. In terms of the specific implementation, Sichuan and Yunnan Provinces were finally selected for the first phase of the B&V pilot project, which was contracted by Sichuan Telecom and Yunnan Mobile. Sichuan invested 659 million yuan, and Yunnan invested 628 million yuan in this project.
Figure 2 shows the number of broadband users in rural areas from 2011 to 2019. The growth in rural broadband users accelerated between 2012 and 2015. According to the Communication Industry Statistical Bulletin, by the end of December 2015, the net increase in rural broadband users was 15.24 million compared with 2012. It increased by 31.3% from the end of 2014 to the end of 2015. Since China provided Internet access to the public in 1994, Internet construction in rural areas has made great progress in terms of the user penetration rate, Internet tariff level, and average downward speed, which have largely benefited from the B&V strategy.
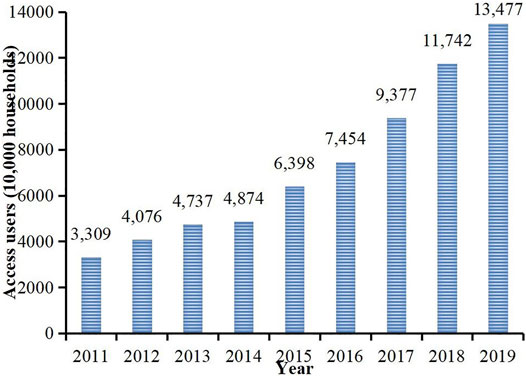
FIGURE 2. Rural broadband access users from 2011 to 2019 in China.
2 Materials and Methodology
2.1 Theoretic Analysis Framework
This study analyzes the EKC hypothesis considering the role of broadband infrastructure. The nexuses between broadband infrastructure and HCE are complicated. But we can use ICT instead of broadband infrastructure to analyze the influences on HCE. The micro mechanism of ICT’s impact on HCE is divided into two strands. In the first strand, ICT mitigates the level of CO2 emissions. ICT provides new alternatives, such as electronic bills instead of paper bills, phone conversations instead of face-to-face communication and reducing outdoor activities (Shabani and Shahnazi, 2019; Ulucak et al., 2020). The sharing economy and mobile payments brought by ICT greatly improve people’s utilization of resources and reduce CO2 emissions. Moreover, residents trust public positive information the most and trust private negative information the least (Xu et al., 2020). The spread of positive information, such as environmental protection, has been accelerated by the popularization of ICT. This has promoted the awareness of low-carbon consumption in daily life. The development of the Internet has allowed people to quickly access information related to environmental pollution causes and hazards (Jiang et al., 2018).
Meanwhile, the second strand of argument dealt with the adverse impacts of that ICT on the environment. With ICT, the prices of goods and services fall, leading to higher consumer demand by residents and increased CO2 emissions (Shabani and Shahnazi, 2019). At the same time, the development of the Internet has reduced transaction costs and promoted trade activities (Ozcan and Nath, 2016). For residents, the use of the Internet has significantly improved their consumption circulation efficiency (Zhang, et al., 2020). Figure 3 shows the theoretical analytical framework of this study.
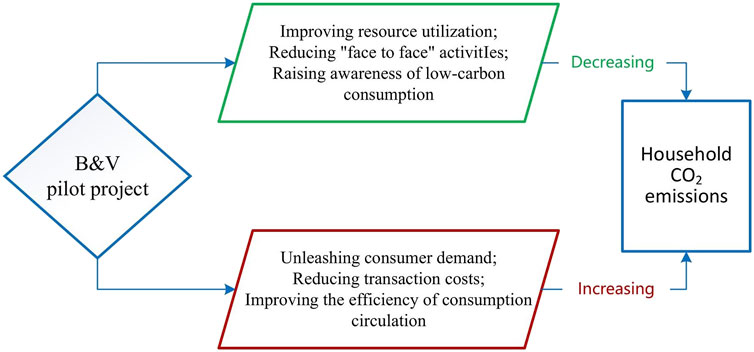
FIGURE 3. Transmission mechanism of B&V pilot project and rural HCE.
2.2 Data
2.2.1 Sources of Data
The dataset used in this study was obtained from four rounds of the CHFS conducted in 2011, 2013, 2015, and 2017. The CHFS is a nationwide survey of households across China, excluding Tibet, Xinjiang, Inner Mongolia, Hong Kong, Macao, and Taiwan. Each round of the investigation was based on respondents’ family activities in the previous year. The CHFS data cover 29 mainland provinces and municipalities, 1,481 communities, and 40,011 households. The survey questionnaire included questions on 20 household consumption and expenditure items, including family clothing, food, housing, transportation, education, medical treatment, family visits, and tourism. The survey provides a comprehensive understanding of household consumption-related HCE. Sichuan and Yunnan Provinces have launched B&V pilot project in July 2014. In each of these years, 9,790 rural households were observed, making a total of 19,580.
2.2.2 Core Variables
The explained variable included household CO2 emissions (HCE). We used Lee and Park’s (2007) methods to calculate HCE from the perspective of household consumption. The specific steps are as follows. First, we referred to the scale of energy consumption in different years published in the China Statistical Yearbook (2010–2018) and the United Nations Intergovernmental Panel on Climate Change’s (IPCC) reports to calculate the CO2 emission scales of different industries across the country. The specific calculation formula is:
In Formula 1,
In Formula 2,
In Formula 3, HCE is each household’s annual CO2 emissions, and
B and V (Policy) was chosen as the core explanatory variable of our study. The value of the province’s implementation of the B and V in 2014 is one; otherwise, it is 0. Our study drew on the research methods of Cheng et al. (2019). If a province implements a policy, all areas of the province would be subject to the policy simultaneously.
The factors affecting HCE are complex, so we also incorporated control variables. Some scholars have focused on changes in family income and consumption patterns, and the heterogeneity of the family members. CO2 emissions vary among households and income levels are the most important influence on this (Weber and Matthews, 2008; Golley and Meng, 2012; Sager, 2019). The higher the monthly income, the higher the energy consumption of travel, and the CO2 emissions of wealthy households can be more than three times those of poor ones (Druckman and Jackson, 2008). So, we chose the annual household income (Total_income) as a control variable (row 5, Table 1). The impact of families on environmental pollution and resource loss is not entirely determined by the number of families, and the heterogeneity of families will also have an important impact on household consumption. Indicators of household heterogeneity include family size, age of the household head, gender, education level, etc. The household head plays a very significant role in the household’s consumption-related decision-making. The age, gender, and education level of the householder have crucial impacts on the scale and structure of household energy consumption (Golley et al., 2008; Liu et al., 2013). So, we chose Family_size (row 4, Table 1) to reflect the family population. Age, Gender, Primary, Junior, Secondary, Higher, Risk_p, and Risk_a (rows 7–14, Table 1) were selected as indicators of household heterogeneity. Some studies believe that the impact of household heterogeneity exceeds those of income and consumption level (Starkey, 2012). Finally, we chose LnGDP (row 15, Table 1) as a provincial macroeconomic control variable. Table 1 defines the variables used in the econometric model of this study.
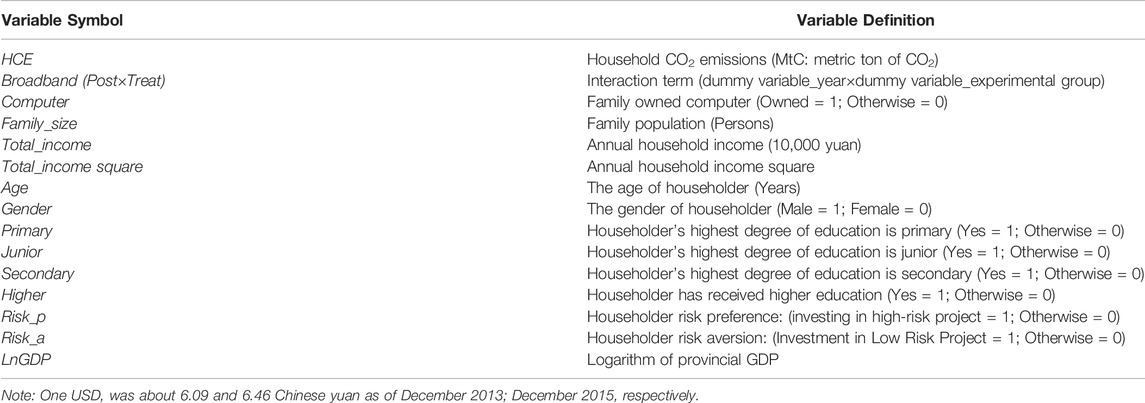
TABLE 1. Variables definition.
3 Methodology
The methods used in this study were divided into two parts. First, to explore the impact of B and V on rural HCE, we used trace survey data from 2013 to 2015 for a Difference-in-Differences (DID) analysis. Second, in order to further verify the non-linear relationship between rural household broadband penetration level and HCE, threshold model were conducted with CHFS data from 2013, 2015, and 2017. The methodological framework of this article is shown in Figure 4.
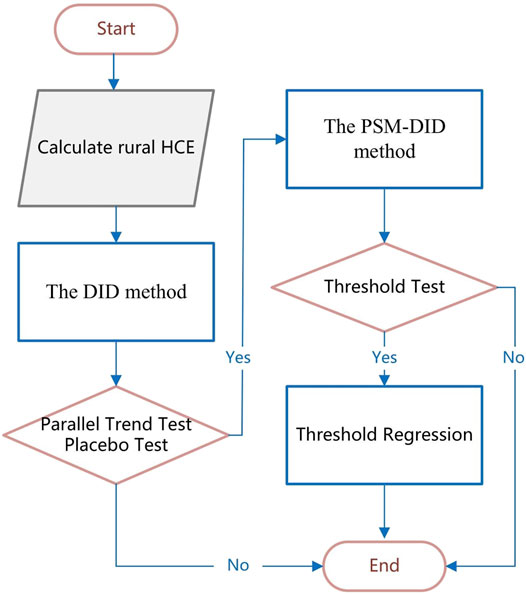
FIGURE 4. The methodological framework.
3.1 DID Model
The data used in this paper are microscopic data, and B&V is a policy implemented by the central government at the provincial level. It is difficult for rural HCE to directly affect the formulation of this policy. Therefore, the B and V pilot program can be approximately considered as a quasi-natural experiment. The DID model is often used in the empirical research of policy evaluation (Wooldridge, 2010). To analyze the impact of B and V on HCE, the following DID model was constructed.
In Formula 4,
3.2 Threshold Model
The threshold effect refers to the phenomenon in which when one parameter reaches a certain value or range, which is the threshold value, its effect on another parameter is reversed. The threshold value can be calculated by the threshold model. Compared with the linear model, the threshold model can explore the relationship between explanatory variables and explained variables more accurately. Before performing the threshold effect analysis, a number of threshold effect tests were conducted. Using the indicative function
In Formula 5,
4 Results
4.1 Descriptive Statistics
Table 2 shows the descriptive statistics of the variables. In the whole sample of 2013 and 2015, the average rural HCE was 7.40 MtC. After the pilot project in 2014, the average rural HCE was 8.77 MtC. The average rural HCE increased by 2.73 MtC before the pilot project, and the per capita CO2 emissions of rural households was 2.03 MtC. Shi et al. (2020) utilized data from China micro surveys conducted in 2012, 2014, and 2016, and calculated an 2.81 MtC of HCE (including cities). It can be seen that in 2015, there was still a certain difference in the HCE of urban and rural households. After the B and V pilot project, household computer ownership increased from 19 to 23%. The rural household population did not differ significantly between the two surveys, both of which were about four persons. In 2015, the average household income after the pilot project increased by about 7,000 yuan compared to 2013. The mean age of rural householders was 54.7 years and 88% were male. In terms of the highest degree of education, 39% of householders had primary education. The risk-preference of householders accounted for 9% in 2013 and 6% in 2015, and there was no significant difference between the control and experimental groups. The proportion of risk-avoidant families decreased from around 72% in 2013 to around 65% in 2015, and the number of risk-neutral households increased.
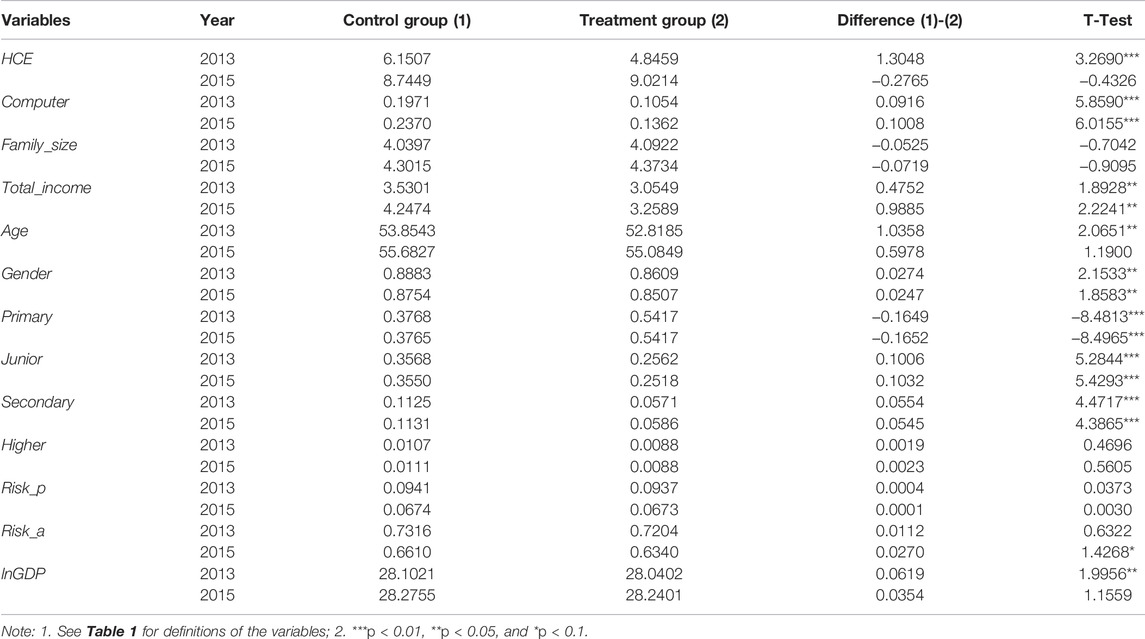
TABLE 2. Describes statistical analyses.
4.2 Estimated Results
Our study was designed to explore the impact of B and V on rural HCE. Table 3 shows the estimates of the impact of B&V on rural HCE. Model 1 (column 2, Table 3) controls the year and experimental virtual variables. The coefficient of the interaction term (Broadband) is 1.5812 and is significant at 5%. The results show that without adding the control variables, the B&V pilot project significantly improved the rural HCE. Model 2 (column 3, Table 3) adds control variables such as household, household head, and provincial macroeconomic characteristics. The coefficient of the interaction term (Broadband) is 1.7217 and is significant at 5%. The interaction term coefficients of Model one and two varied little but showed an upward trend. In the household characteristic variables, Total_income has a significant positive impact on rural HCE, while Total_income square has a significant negative effect. That means there is an inverted “U"-shaped relationship between family income and HCE, again confirming the EKC hypothesis. Family_size positively affects HCE and is significant at 1%. Age significantly negatively affects HCE, while Junior and Secondary and Higher all significantly positively affect HCE. The largest influence coefficient is Higher. Householders with risk preference have a greater probability of increasing HCE. Householders with risk aversion are more likely to have lower HCE. LnGDP did not pass the significance test. The empirical results show that the B and V pilot project has a role in improving rural HCE.
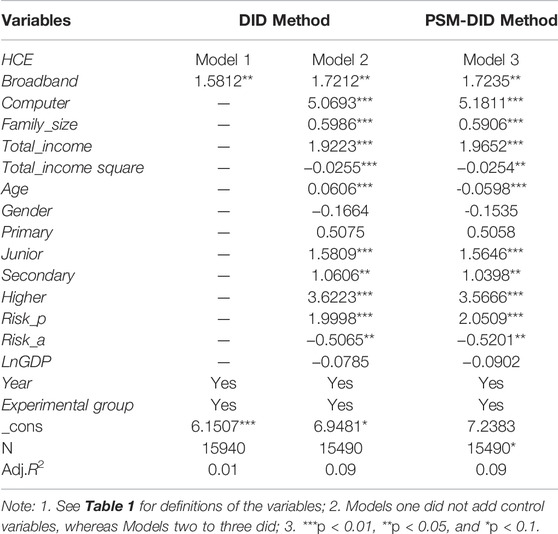
TABLE 3. Results of model estimation.
The ideal situation is that the individual characteristics of the treatment and control groups were the same before the pilot project. However, these groups did not fully meet this condition; therefore, there may be a selective bias. To alleviate this problem, we revisited the estimation analysis using the propensity score matching method (PSM) and the PSM-DID method of Heckman et al. (1997). Model 3 (column 4, Table 3) is the result of the PSM-DID model estimate. The interaction term (Broadband) is significant at 5%, and the coefficient size is very close to that of Model 2. In eliminating the impact of the characteristics of the householder and family, we once again confirm that the B and V pilot project has a role in increasing rural HCE. Although the research approach is different from those of previous studies, the conclusions that ICT contributes to CO2 emissions are consistent with them (Danish M. A. et al., 2018; Shabani and Shahnazi, 2019).
Overall, the estimated results indicate that China is in the stage where the development of ICT is increasing rural HCE. Income is an important driver of CO2 emissions over time (Dong et al., 2019). We found that different income levels of rural households have different contribution to CO2 emissions. That is, when income reaches a certain level, it reduces CO2 emissions.
4.3 Parallel Trend Test
Parallel trend is assumed to be a prerequisite for DID. If the parallel trend assumption is not satisfied, then the estimated policy effect is not a completely true policy effect. Time-series plots for both the treatment and control groups are used. We use data from 4 years (2011, 2013, 2015, 2017) to map the average HCE on the y-axis and years on the x-axis. According to Figure 5, we can judge the temporal trend between the treatment and control groups after the B and V pilot project year. There is no significant difference in the temporal trends before the B and V pilot project year, so the parallel trend test is passed.
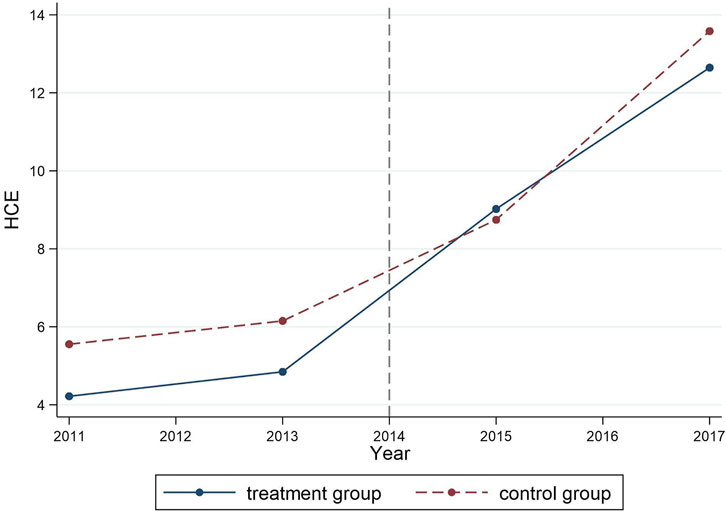
FIGURE 5. Dynamic effects of the B and V on rural HCE.
4.4 Placebo Test
A placebo test is the use of a false policy occurrence time or experimental group to test whether a policy effect could be obtained. If the policy effect is still obtained, it shows that the estimated policy effect is not reliable. Guizhou and Chongqing are geographically adjacent to Yunnan and Sichuan, and the levels of economic development are similar. Therefore, this paper conducted a placebo test by changing the experimental groups, Guizhou and Chongqing, and two provincial administrative samples. The test results in Table 4 show that the interaction terms do not pass the significance test, which indicates that estimated policy effect is reliable.
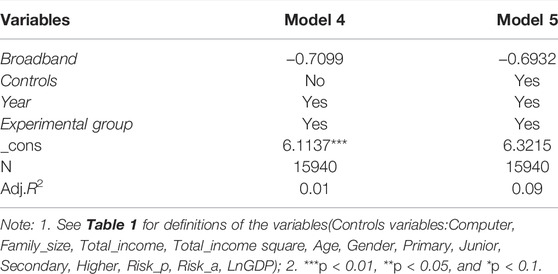
TABLE 4. Results of placebo test.
4.5 Further Studies
The EKC hypothesis suggests that the impact of income level on the environment is nonlinear. So, is there a non-linear relationship between the rural household broadband penetration and CO2 emissions in China? The empirical findings suggest that there is an inverted “U"-shaped relationship between ICT development and CO2 emissions (Higón et al., 2017). Some scholars revealed that threre was a threshold of external policies for economic resilience (Li Q. et al., 2016). We believe that the B and V pilot project period was the initial stage of rural household broadband penetration. Therefore, the impact of household broadband penetration on rural HCE does not have a simple linear relationship. In order to further verify the non-linear relationship between rural household broadband penetration level and HCE, we obtained two indicators from the China Statistical Yearbook: the total broadband access users (abu) and rural broadband access users (rbu) of provincial administrative units. Broadband penetration is generally measured by the number of broadband connections available (Koutroumpis, 2009), and this paper adopts the same approach. So, the rural household broadband penetration (rbp) is calculated as:
Then, the relationship between rbp and HCE is determined by drawing from the panel threshold model proposed by Hansen (1999). The threshold variable is the rural household broadband penetration (rbp), and the control variables include total_income, family_size, and LnGDP. Table 5 is the number of threshold test results, which show that the number of thresholds is two.
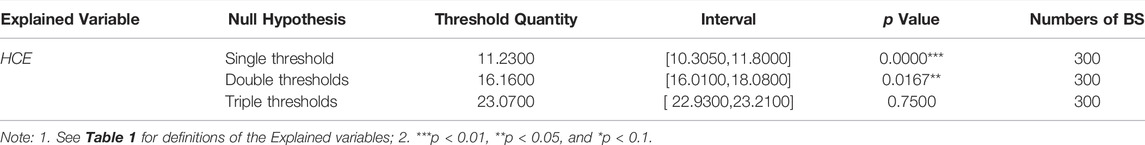
TABLE 5. Results of threshold test.
Based on the above analysis, considering the double threshold effect and combining the microscopic data of the CHFS surveys from 2013, 2015, and 2017, the threshold model is established as follows:
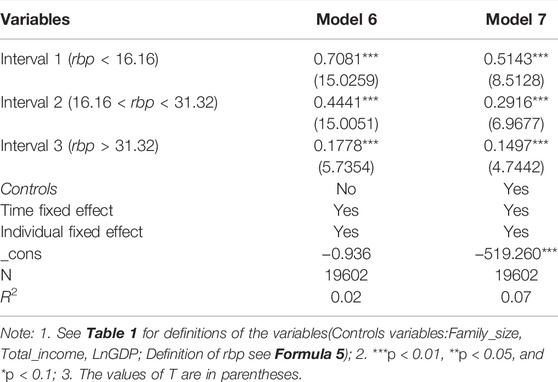
TABLE 6. Results of threshold regression.
5 Conclussion and Discussion
5.1 Conclusion
Whether ICT or broadband infrastructure can achieve a “win-win” between environmental conservation and economic development has captured much research attention. However, very few scholars have studied the impact of broadband infrastructure on rural HCE. We explore how broadband infrastructure affects rural HCE and examine the nonlinear relationship between household broadband penetration and rural HCE. We came to the following conclusions. 1) During the study period, B and V pilot project has a role in increasing rural HCE. We estimated an effect corresponding to an increase of approximately 1.7 MtC by the implementation of B and V in rural HCE. 2) Technology and income are both key drivers of HCE. Further, there was an inverted “U"-shaped relationship between family income and HCE, again confirming the EKC hypothesis. Different income levels of rural households have different contribution to CO2 emissions. That is, when income reaches a certain level, it reduces CO2 emissions. 3) In further verifying the nonlinear relationship between the rural household broadband penetration and HCE, we found a significant threshold effect between them. When the rural household broadband penetration is below 31.32%, it significantly increases HCE. The growth effect of rural household broadband penetration to HCE would be much weaker, if rural household broadband penetration goes above 31.32%.
Actually, the conclusions are helpful to clarify the implementation direction of the CO2 mitigation strategies and digital villages strategy. First, improve rural household broadband penetration level, and cross the 31.32% threshold as soon as possible. Second, raising the income level of rural households can help achieve a “win-win” between environmental conservation and economic development. Third, improve the level of ICT application and develop rural industries.
5.2 Discussion
First, the B and V pilot project was taken as an external policy impact and the DID method was adopted for analysis. We found that different income levels of rural households have different contribution to CO2 emissions. That is, when income reaches a certain level, it reduces CO2 emissions. These results were consistent with those by Lutz (2019). However, expanding consumption and controlling greenhouse gas emissions are both long-term policy goals of the government, yet there may be some degree of incentive incompatibility between the two. Excessive pursuit of equity in household income distribution may increase CO2 emissions generated by household consumption (Heerink et al., 2001). Thus, when the government formulates income redistribution policies, it also needs to consider the environmental externalities.
Second, the growth effect of B and V to rural HCE would be much weaker, if rural household broadband penetration goes above a threshold level. Earlier studies have also found a nonlinear relationship between household broadband penetration and CO2 emissions (Higón et al., 2017; Li and Song, 2019). Considering China’s situation, Internet technology is changing all aspects of rural life, such as its consumption model, consumption structure, and family income. In view of the situation that rural broadband construction has lagged that of urban areas for a long time (Liu and Wang, 2021), we should emphasize that promoting household broadband penetration in under-developed areas can raise them above the threshold. Developed areas can make good use of the Internet to reduce CO2 emissions. Improving energy utilization efficiency and reducing the use of straw and coal in rural areas can also reduce CO2 emissions.
Third, during the study period, B and V pilot project has a role in increasing rural HCE. Previous contributions tested for this association at a macro level (Li and Song, 2019). But what is important now is to take full advantage of the benefits brought by broadband infrastructure. Rural residents were more vulnerable to external shocks, such as climate change, because of their lack of nature and financial capital (Peng et al., 2018). To solve these problems, China has adopted a low-carbon economy to balance the relationship between CO2 emissions and economic development (Zhang et al., 2011). With the help of the advantages of ICT, we will advocate for the dissemination of information related to low-carbon lifestyles to rural consumers via the Internet, improve their ability to judge the energy efficiency of electrical appliances, encourage them to buy low-carbon products, and improve the efficiency of resource utilization. ICT has also played a significant role in rural production and has helped reduce farming household cropland abandonment by 43.20% (Deng et al., 2019). Therefore, China is vigorously implementing the digital village strategy and expanding the application of ICT in rural areas.
Of course, the results of this paper only demonstrated a non-linear relationship between rural household broadband penetration and rural HCE. During the study period, there is no evidence that there is an inverted “U"-shaped relationship between the ICT and HCE. Therefore, the next step will be to add the latest data by expanding the time span of the study sample. We hope to demonstrate that when the rural household broadband penetration is at a higher level, the corresponding changes in rural HCE.
Data Availability Statement
The raw data supporting the conclusion of this article will be made available by the authors, without undue reservation.
Author Contributions
PR proposed the research idea, developed the model and wrote the first manuscript draft. CN and XL collected data and performed the computations. FX and SZ revised them critically. All authors have made a substantial and intellectual contribution to this article and approved it for publication.
Funding
This research was funded by the National Natural Science Foundation of China (Grant Nos. 42161053, 71840013, and 41701622), the Graduate Innovation Special Fund project of Jiangxi Province (Grant No. YC2021-B086) and Jiangxi Province Selenium-rich Agriculture Special Project 2021 (JXFXZD-2021-02).
Conflict of Interest
The authors declare that the research was conducted in the absence of any commercial or financial relationships that could be construed as a potential conflict of interest.
Publisher’s Note
All claims expressed in this article are solely those of the authors and do not necessarily represent those of their affiliated organizations, or those of the publisher, the editors and the reviewers. Any product that may be evaluated in this article, or claim that may be made by its manufacturer, is not guaranteed or endorsed by the publisher.
Supplementary Material
The Supplementary Material for this article can be found online at: https://www.frontiersin.org/articles/10.3389/fenvs.2022.818134/full#supplementary-material
Footnotes
1Broadband refers to Internet with a downlink speed of at least four Mbps (Federal Communications Commission 2011 standard). See http://www.gov.cn/zwgk/2013-08/17/content_2468348.htm for “Broadband China” strategy.
2The basic objectives of the Broadband China strategy are divided into two steps. In the first step (2013–2015), the national fixed broadband household penetration rate reached 50%, the administrative village broadband rate reached 95%, the 3G/LTE user penetration rate reached 32.5%, and the urban and rural household broadband access capacities reached 20 Mbps and four Mbps, respectively. In the second step (2016–2020), the national household fixed broadband penetration rate will reach 70%, the administrative village broadband rate will exceed 98%, the penetration rate of 3G/LTE users will reach 85%, and the broadband access capacity of urban and rural households will reach 50 Mbps and 12 Mbps, respectively.
References
Akerman, A., Gaarder, I., and Mogstad, M. (2015). The Skill Complementarity of Broadband Internet *. Q. J. Econ. 130 (4), 1781–1824. doi:10.1093/qje/qjv028
Aldashev, A., and Batkeyev, B. (2021). Broadband Infrastructure and Economic Growth in Rural Areas. Inf. Econ. Pol. 57 (4), 100936. doi:10.1016/j.infoecopol.2021.100936
Añón Higón, D., Gholami, R., and Shirazi, F. (2017). ICT and Environmental Sustainability: A Global Perspective. Telematics Inform. 34 (4), 85–95. doi:10.1016/j.tele.2017.01.001
Arce, G., López, L. A., and Guan, D. (2016). Carbon Emissions Embodied in International Trade: The post-China Era. Appl. Energ. 184, 1063–1072. doi:10.1016/j.apenergy.2016.05.084
Bastida, L., Cohen, J. J., Kollmann, A., Moya, A., and Reichl, J. (2019). Exploring the Role of ICT on Household Behavioural Energy Efficiency to Mitigate Global Warming. Renew. Sustain. Energ. Rev. 103, 455–462. doi:10.1016/j.rser.2019.01.004
Bernstein, R., and Madlener, R. (2010). Impact of Disaggregated ICT Capital on Electricity Intensity in European Manufacturing. Appl. Econ. Lett. 17 (17), 1691–1695. doi:10.1080/13504850903120717
Chen, G. Q., Yang, Q., and Zhao, Y. H. (2011). Renewability of Wind Power in China: A Case Study of Nonrenewable Energy Cost and Greenhouse Gas Emission by a Plant in Guangxi. Renew. Sustain. Energ. Rev. 15 (5), 2322–2329. doi:10.1016/j.rser.2011.02.007
Cheng, J., Yi, J., Dai, S., and Xiong, Y. (2019). Can Low-Carbon City Construction Facilitate green Growth? Evidence from China's Pilot Low-Carbon City Initiative. J. Clean. Prod. 231, 1158–1170. doi:10.1016/j.jclepro.2019.05.327
Chung, W.-S., Tohno, S., and Shim, S. Y. (2009). An Estimation of Energy and GHG Emission Intensity Caused by Energy Consumption in Korea: An Energy IO Approach. Appl. Energ. 86 (10), 1902–1914. doi:10.1016/j.apenergy.2009.02.001
Cohen, C., Lenzen, M., and Schaeffer, R. (2005). Energy Requirements of Households in Brazil. Energy Policy 33, 555–562. doi:10.1016/j.enpol.2003.08.021
Collard, F., Fève, P., and Portier, F. (2005). Electricity Consumption and ICT in the French Service Sector. Energ. Econ. 27 (3), 541–550. doi:10.1016/j.eneco.2004.12.002
Cui, L.-B., Fan, Y., Zhu, L., and Bi, Q.-H. (2014). How Will the Emissions Trading Scheme Save Cost for Achieving China's 2020 Carbon Intensity Reduction Target? Appl. Energ. 136, 1043–1052. doi:10.1016/j.apenergy.2014.05.021
Czernich, N., Falck, O., Kretschmer, T., and Woessmann, L. (2011). Broadband Infrastructure and Economic Growth. Econ. J. 121 (552), 505–532. doi:10.1111/j.1468-0297.2011.02420.x
Danish, K., Baloch, M. A., and Suad, S. (2018b). Modeling the Impact of Transport Energy Consumption on CO2 Emission in Pakistan: Evidence from ARDL Approach. Environ. Sci. Pollut. Res. 25, 9461–9473. doi:10.1007/s11356-018-1230-0
Danish, K., Zhang, B., Wang, Z., and Wang, B. (2018a). Energy Production, Economic Growth and CO2 Emission: Evidence from Pakistan. Nat. Hazards 90, 27–50. doi:10.1007/s11069-017-3031-z
David, M., Aubry, A., and Derigent, W. (2018). Towards Energy Efficient Buildings: How ICTs Can Convert Advances? IFAC-PapersOnLine. 51 (11), 758–763. doi:10.1016/j.ifacol.2018.08.410
Dehghan Shabani, Z., and Shahnazi, R. (2019). Energy Consumption, Carbon Dioxide Emissions, Information and Communications Technology, and Gross Domestic Product in Iranian Economic Sectors: A Panel Causality Analysis. Energy 169, 1064–1078. doi:10.1016/j.energy.2018.11.062
Deng, X., Xu, D., Zeng, M., and Qi, Y. (2019). Does Internet Use Help Reduce Rural Cropland Abandonment? Evidence from China. Land Use Policy 89, 104243. doi:10.1016/j.landusepol.2019.104243
Dong, F., Long, R., Li, Z., and Dai, Y. (2016). Analysis of Carbon Emission Intensity, Urbanization and Energy Mix: Evidence from China. Nat. Hazards 82 (2), 1375–1391. doi:10.1007/s11069-016-2248-6
Dong, K., Dong, X., and Jiang, Q. (2019). How Renewable Energy Consumption Lower Global CO 2 Emissions? Evidence from Countries with Different Income Levels. World Econ. 43 (6), 1665–1698. doi:10.1111/twec.12898
Druckman, A., and Jackson, T. (2008). Household Energy Consumption in the UK: A Highly Geographically and Socio-Economically Disaggregated Model. Energy Policy 36 (8), 3177–3192. doi:10.1016/j.enpol.2008.03.021
Du, L., and Mao, J. (2015). Estimating the Environmental Efficiency and Marginal CO 2 Abatement Cost of Coal-Fired Power Plants in China. Energy Policy 85, 347–356. doi:10.1016/j.enpol.2015.06.022
Dubois, G., Sovacool, B., Aall, C., Nilsson, M., Barbier, C., Herrmann, A., et al. (2019). It Starts at home? Climate Policies Targeting Household Consumption and Behavioral Decisions Are Key to Low-Carbon Futures. Energ. Res. Soc. Sci. 52, 144–158. doi:10.1016/j.erss.2019.02.001
Fabling, R., and Grimes, A. (2016). Picking up Speed: Does Ultrafast Broadband Increase Firm Productivity? SSRN J., 1–45. Motu Working Paper No. 16-22. doi:10.2139/ssrn.2884330
Gao, Y., Zang, L., and Sun, J. (2018). Does Computer Penetration Increase Farmers' Income? an Empirical Study from China. Telecommunications Policy 42 (5), 345–360. doi:10.1016/j.telpol.2018.03.002
Ghosh, S. (2017). Broadband Penetration and Economic Growth: Do Policies Matter? Telematics Inform. 34, 676–693. doi:10.1016/j.tele.2016.12.007
Golley, J., Meagher, D., and Meng, X. (2008). “Chinese Urban Household Energy Requirements and CO2 Emissions,” in China’s Dilemma: Economic Growth, the Environment and Climate Change. Editor L. Song (Canberra: ANU Press). Available at: https://search.crossref.org/?from_ui=&q=Chinese+urban+household+energy+requirements+and+CO2+emissions.
Golley, J., and Meng, X. (2012). Income Inequality and Carbon Dioxide Emissions: The Case of Chinese Urban Households. Energ. Econ. 34 (6), 1864–1872. doi:10.1016/j.eneco.2012.07.025
Grossman, G., and Krueger, A. (1992). Environmental Impacts of a North American Free Trade Agreement. CEPR Discussion Pap. 8 (2), 223–250. doi:10.3386/w3914
Grossman, G. M., and Krueger, A. B. (1995). Economic Growth and the Environment. Q. J. Econ. 110, 353–377. doi:10.1016/B0-12-226865-2/00084-510.2307/2118443
Gruber, H., Hätönen, J., and Koutroumpis, P. (2014). Broadband Access in the EU: An Assessment of Future Economic Benefits. Telecommunications Policy 38 (11), 1046–1058. doi:10.1016/j.telpol.2014.06.007
Haller, S. A., and Lyons, S. (2015). Broadband Adoption and Firm Productivity: Evidence from Irish Manufacturing Firms. Telecommunications Policy 39 (1), 1–13. doi:10.1016/j.telpol.2014.10.003
Han, B., and Zhu, P. (2014). Empirical Analysis on Effect of Broadband on Economic Growth in China. Stat. Res. 31 (10), 49–54. (in Chinese). doi:10.19343/j.cnki.11-1302/c.2014.10.008
Hansen, B. E. (1999). Threshold Effects in Non-dynamic Panels: Estimation, Testing, and Inference. J. Econom. 93 (2), 345–368. doi:10.1016/S0304-4076(99)00025-1
Heckman, J. J., Ichimura, H., and Todd, P. E. (1997). Matching as an Econometric Evaluation Estimator: Evidence from Evaluating a Job Training Programme. Rev. Econ. Stud. 64 (4), 605–654. doi:10.2307/2971733
Heerink, N., Mulatu, A., and Bulte, E. (2001). Income Inequality and the Environment: Aggregation Bias in Environmental Kuznets Curves. Ecol. Econ. 38, 359–367. doi:10.1016/s0921-8009(01)00171-9
Hertwich, E. G., and Peters, G. P. (2009). Carbon Footprint of Nations: A Global, Trade-Linked Analysis. Environ. Sci. Technol. 43 (16), 6414–6420. doi:10.1021/es803496a
Houghton, J. W. (2009). ICT and the Environment in Developing Countries : A Review of Opportunities and Developments. Berlin Heidelberg: Springer, 236–247. doi:10.29171/azu_acku_pamphlet_ge149_e695_2009
Howden, S. M., Soussana, J.-F., Tubiello, F. N., Chhetri, N., Dunlop, M., and Meinke, H. (2007). Adapting Agriculture to Climate Change. Proc. Natl. Acad. Sci. U.S.A. 104 (50), 19691–19696. doi:10.1073/pnas.0701890104
Huang, J., Wang, Y., and Wang, J. (2015). Farmers' Adaptation to Extreme Weather Events through Farm Management and its Impacts on the Mean and Risk of Rice Yield in China. Am. J. Agric. Econ. 97 (2), 602–617. doi:10.1093/ajae/aav005
Intergovernmental Panel on Climate Change (2018). Global Warming of 1.5 C. An IPCC Special Report on the Impacts of Global Warming of 1.5°C above Pre-industrial Levels and Related Global Greenhouse Gas Emission Pathways. Available at: https://www.ipcc.ch/sr15/(Accessed April 27, 2020).
Ishida, H. (2015). The Effect of ICT Development on Economic Growth and Energy Consumption in Japan. Telematics Inform. 32, 79–88. doi:10.1016/j.tele.2014.04.003
Koutroumpis, P. (2009). The Economic Impact of Broadband on Growth: A Simultaneous Approach. Telecommunications Policy 33 (9), 471–485. doi:10.1016/j.telpol.2009.07.004
Kumar, R. R., Stauvermann, P. J., and Samitas, A. (2016). The Effects of ICT on Output Per Worker: A Study of the Chinese Economy. Telecommunications Policy 40 (2-3), 102–115. doi:10.1016/j.telpol.2015.06.004
Lee, J. W., and Park, S. B. (2007). Impact of Consumption Pattern Changes on Environmental Pollution in Korea. Korea World Econ. 8, 53–77. doi:10.1007/978-0-387-71313-7_3
Lennerfors, T. T., Fors, P., and van Rooijen, J. (2015). ICT and Environmental Sustainability in a Changing Society. Inf. Technol. People 28, 758–774. doi:10.1108/ITP-09-2014-0219
Lenzen, M. (1998). Primary Energy and Greenhouse Gases Embodied in Australian Final Consumption: An Input-Output Analysis. Energy Policy 26 (6), 495–506. doi:10.1016/S0301-4215(98)00012-3
Li, J., Huang, X., Yang, H., Chuai, X., Li, Y., Qu, J., et al. (2016a). Situation and Determinants of Household Carbon Emissions in Northwest China. Habitat Int. 51, 178–187. doi:10.1016/j.habitatint.2015.10.024
Li, L., Tan, Z., Wang, J., Xu, J., Cai, C., and Hou, Y. (2011). Energy Conservation and Emission Reduction Policies for the Electric Power Industry in China. Energy Policy 39 (6), 3669–3679. doi:10.1016/j.enpol.2011.03.073
Li, Q., Amjath-Babu, T. S., and Zander, P. (2016b). Role of Capitals and Capabilities in Ensuring Economic Resilience of Land Conservation Efforts: A Case Study of the Grain for green Project in China's Loess Hills. Ecol. Indicators 71, 636–644. doi:10.1016/j.ecolind.2016.07.027
Li, S. G., and Song, B. D. (2019). Effects Internet Development on Carbon Emissions: An Empirical Study Based on Panel Threshold Model. Ecol. Econ. 35 (11), 37–40+74. (in Chinese).
Lin, B., and Zhou, Y. (2021). Does the Internet Development Affect Energy and Carbon Emission Performance? Sustainable Prod. Consumption 28 (28), 1–10. doi:10.1016/j.spc.2021.03.016
Liu, C., and Wang, L. (2021). Who Is Left behind? Exploring the Characteristics of China's Broadband Non-adopting Families. Telecommunications Policy 45 (9), 102187. doi:10.1016/j.telpol.2021.102187
Liu, L., Chen, C., Zhao, Y., and Zhao, E. (2015). China׳s Carbon-Emissions Trading: Overview, Challenges and Future. Renew. Sustain. Energ. Rev. 49 (sep), 254–266. doi:10.1016/j.rser.2015.04.076
Liu, W., Spaargaren, G., Heerink, N., Mol, A. P. J., and Wang, C. (2013). Energy Consumption Practices of Rural Households in North China: Basic Characteristics and Potential for Low Carbon Development. Energy Policy 55 (4), 128–138. doi:10.1016/j.enpol.2012.11.031
Maraseni, T. N., Qu, J., and Zeng, J. (2015). A Comparison of Trends and Magnitudes of Household Carbon Emissions between China, Canada and UK. Environ. Develop. 15, 103–119. doi:10.1016/j.envdev.2015.04.001
Munksgaard, J., Pedersen, K. A., and Wien, M. (2000). Impact of Household Consumption on CO2 Emissions. Energ. Econ. 22, 423–440. doi:10.1016/S0140-9883(99)00033-X
Ozcan, B., and Apergis, N. (2018). The Impact of Internet Use on Air Pollution: Evidence from Emerging Countries. Environ. Sci. Pollut. Res. 25, 4174–4189. doi:10.1007/s11356-017-0825-1
Ozcan, B., and Nath, H. (2018). Information and Communications Technology (ICT) and International Trade: Evidence from Turkey. Eurasian Econ. Rev. 8 (1), 93–113. doi:10.1007/s40822-017-0077-x
Pachauri, S. (2004). An Analysis of Cross-Sectional Variations in Total Household Energy Requirements in India Using Micro Survey Data. Energy Policy 32, 1723–1735. doi:10.1016/S0301-4215(03)00162-9
Park, Y., Meng, F., and Baloch, M. A. (2018). The Effect of ICT, Financial Development, Growth, and Trade Openness on CO2 Emissions: an Empirical Analysis. Environ. Sci. Pollut. Res. 25, 30708–30719. doi:10.1007/s11356-018-3108-6
Peng, L., Xu, D., and Wang, X. (2018). Vulnerability of Rural Household Livelihood to Climate Variability and Adaptive Strategies in Landslide-Threatened Western Mountainous Regions of the Three Gorges Reservoir Area, China. Clim. Develop. 11, 469–484. doi:10.1080/17565529.2018.1445613
Röller, L.-H., and Waverman, L. (2001). Telecommunications Infrastructure and Economic Development: A Simultaneous Approach. Am. Econ. Rev. 91 (4), 909–923. doi:10.1257/aer.91.4.909
Sager, L. (2019). Income Inequality and Carbon Consumption: Evidence from Environmental Engel Curves. Energ. Econ. 84 (5), 104507. doi:10.1016/j.eneco.2019.104507
Sager, L. (2019). Income Inequality and Carbon Consumption: Evidence from Environmental Engel Curves. Energ. Econ. 84, 104507. doi:10.1016/j.eneco.2019.104507
Salahuddin, M., and Alam, K. (2016). Information and Communication Technology, Electricity Consumption and Economic Growth in OECD Countries: A Panel Data Analysis. Int. J. Electr. Power Energ. Syst. 76 (Mar.), 185–193. doi:10.1016/j.ijepes.2015.11.005
Salahuddin, M., Gow, J., and Ozturk, I. (2015). Is the Long-Run Relationship between Economic Growth, Electricity Consumption, Carbon Dioxide Emissions and Financial Development in Gulf Cooperation Council Countries Robust? Renew. Sustain. Energ. Rev. 51, 317–326. doi:10.1016/j.rser.2015.06.005
Shahnazi, R., and Dehghan Shabani, Z. (2019). The Effects of Spatial Spillover Information and Communications Technology on Carbon Dioxide Emissions in Iran. Environ. Sci. Pollut. Res. 26 (23), 24198–24212. doi:10.1007/s11356-019-05636-7
Shi, X., Wang, K., Cheong, T. S., and Zhang, H. (2020). Prioritizing Driving Factors of Household Carbon Emissions: An Application of the LASSO Model with Survey Data. Energ. Econ. 92, 104942. doi:10.1016/j.eneco.2020.104942
Starkey, R. (2012). Personal Carbon Trading: A Critical Survey Part 2: Efficiency and Effectiveness. Ecol. Econ. 73, 19–28. doi:10.1016/j.ecolecon.2011.09.018
Tonooka, Y., Mu, H., Ning, Y., and Kondo, Y. (2003). Energy Consumption in Residential House and Emissions Inventory of GHGs, Air Pollutants in China. J. Asian Architecture Building Eng. 2 (1), 93–100. doi:10.3130/jaabe.2.93
Ulucak, R., Danish, K., and Li, N. (2020). The Nexus between Economic Globalization and Human Development in Asian Countries: An Empirical Investigation. Environ. Sci. Pollut. Res. 27 (3), 2622–2629. doi:10.1007/s11356-019-07224-1
Vringer, K., and Blok, K. (1995). The Direct and Indirect Energy Requirements of Households in the Netherlands. Energy Policy 23 (10), 893–910. doi:10.1016/0301-4215(95)00072-Q
Wang, J., Jiang, Q., Dong, X., and Dong, K. (2021). Decoupling and Decomposition Analysis of Investments and CO2 Emissions in Information and Communication Technology Sector. Appl. Energ. 302, 117618. doi:10.1016/j.apenergy.2021.117618
Wang, P., Dai, H.-c., Ren, S.-y., Zhao, D.-q., and Masui, T. (2015). Achieving Copenhagen Target through Carbon Emission Trading: Economic Impacts Assessment in Guangdong Province of China. Energy 79 (Jan.1), 212–227. doi:10.1016/j.energy.2014.11.009
Weber, C. L., and Matthews, H. S. (2008). Quantifying the Global and Distributional Aspects of American Household Carbon Footprint. Ecol. Econ. 66 (2), 379–391. doi:10.1016/j.ecolecon.2007.09.021
Wei, Z., Hulin, L., and Xuebing, A. (2011). Ecological Civilization Construction Is the Fundamental Way to Develop Low-Carbon Economy. Energ. Proced. 5 (1), 839–843. doi:10.1016/j.egypro.2011.03.148
Wilson, J., Tyedmers, P., and Spinney, J. E. L. (2013). An Exploration of the Relationship between Socioeconomic and Well-Being Variables and Household Greenhouse Gas Emissions. J. Ind. Ecol. 17 (6), 880–891. doi:10.1111/jiec.12057
Wooldridge, J. M. (2010). Econometric Analysis of Cross Section and Panel Data. Cambridge, Massachusetts, United States: MIT Press.
World Bank (2007). Growth and CO2 Emissions: How Do Different Countries Fare? Washington, DC: Environment Department. Available at: https://www.uncclearn.org/wp-content/uploads/library/wb05.pdf (Accessed October, 2007).
Wu, S., Lei, Y., and Li, S. (2019). CO2 Emissions from Household Consumption at the Provincial Level and Interprovincial Transfer in China. J. Clean. Prod. 210, 93–104. doi:10.1016/j.jclepro.2018.10.356
Xiong, L., Shen, B., Qi, S., Price, L., and Ye, B. (2017). The Allowance Mechanism of China's Carbon Trading Pilots: A Comparative Analysis with Schemes in EU and California. Appl. Energ. 185 (2), 1849–1859. doi:10.1016/j.apenergy.2016.01.064
Xu, D., Zhou, W., Deng, X., Ma, Z., Yong, Z., and Qin, C. (2020). Information Credibility, Disaster Risk Perception and Evacuation Willingness of Rural Households in China. Nat. Hazards 103 (3), 2865–2882. doi:10.1007/s11069-020-04106-5
Xue, B., Ma, Z., Geng, Y., Heck, P., Ren, W., Tobias, M., et al. (2015). A Life Cycle Co-benefits Assessment of Wind Power in China. Renew. Sustain. Energ. Rev. 41, 338–346. doi:10.1016/j.rser.2014.08.056
Yao, C., Chen, C., and Li, M. (2012). Analysis of Rural Residential Energy Consumption and Corresponding Carbon Emissions in China. Energy Policy 41 (4), 445–450. doi:10.1016/j.enpol.2011.11.005
Zeng, J., Qu, J., Ma, H., and Gou, X. (2021). Characteristics and Trends of Household Carbon Emissions Research from 1993 to 2019: A Bibliometric Analysis and its Implications. J. Clean. Prod. 295 (6), 126468. doi:10.1016/j.jclepro.2021.126468
Zhang, L. X., Wang, C. B., and Bahaj, A. S. (2014). Carbon Emissions by Rural Energy in China. Renew. Energ. 66 (3), 641–649. doi:10.1016/j.renene.2014.01.005
Zhang, L. X., Wang, C. B., Yang, Z. F., and Chen, B. (2010). Carbon Emissions from Energy Combustion in Rural China. Proced. Environ. Sci. 2, 980–989. doi:10.1016/j.proenv.2010.10.110
Zhang, X., Yang, T., Wang, C., and Wan, G. H. (2020). Digital Finance and Household Consumption: Theory and Evidence from China. Manage. World 36 (11), 48–62. (in Chinese). doi:10.19744/j.cnki.11-1235/f.2020.0168
Zhao, J., Shahbaz, M., Dong, X., and Dong, K. (2021). How Does Financial Risk Affect Global CO2 Emissions? the Role of Technological Innovation. Technol. Forecast. Soc. Change 168, 120751. doi:10.1016/j.techfore.2021.120751
Zhihong, J., Jian, H., Wenzhou, L., Zhe, C., Ning, L., Siyuan, W., et al. (2018). Energy Internet - A New Driving Force for Sustainable Urban Development. Energ. Proced. 152, 1206–1211. doi:10.1016/j.egypro.2018.09.170
Zhou, X.-Y., and Gu, A.-L. (2020). Impacts of Household Living Consumption on Energy Use and Carbon Emissions in China Based on the Input-Output Model. Adv. Clim. Change Res. 11 (2), 118–130. doi:10.1016/j.accre.2020.06.004
Zhou, X., Huang, G., Li, Y., Lin, Q., Yan, D., and He, X. (2021). Dynamical Downscaling of Temperature Variations over the Canadian Prairie Provinces under Climate Change. Remote Sensing 13 (21), 4350. doi:10.3390/rs13214350
Zhou, X., Huang, G., Piwowar, J., Fan, Y., Wang, X., Li, Z., et al. (2018). Hydrologic Impacts of Ensemble-RCM-Projected Climate Changes in the Athabasca River Basin, Canada. J. Hydrometeorol. 19 (12), 1953–1971. doi:10.1175/JHM-D-17-0232.1
Keywords: CO2 emissions, rural household, broadband village, difference-in-differences, China
Citation: Rao P, Xie F, Zhu S, Ning C and Liu X (2022) Effect of Broadband Infrastructure on Rural Household CO2 Emissions in China: A Quasi-Natural Experiment of a “Broadband Village”. Front. Environ. Sci. 10:818134. doi: 10.3389/fenvs.2022.818134
Received: 19 November 2021; Accepted: 21 March 2022;
Published: 06 April 2022.
Edited by:
Li Peng, Sichuan Normal University, ChinaReviewed by:
Xin Deng, Sichuan Agricultural University, ChinaXiong Zhou, Beijing Normal University, China
Kangyin Dong, University of International Business and Economics, China
Copyright © 2022 Rao, Xie, Zhu, Ning and Liu. This is an open-access article distributed under the terms of the Creative Commons Attribution License (CC BY). The use, distribution or reproduction in other forums is permitted, provided the original author(s) and the copyright owner(s) are credited and that the original publication in this journal is cited, in accordance with accepted academic practice. No use, distribution or reproduction is permitted which does not comply with these terms.
*Correspondence: Fangting Xie, Zm91bnRhaW5feGllQDE2My5jb20=; Shubin Zhu, c2h1Ymluemh1QDE2My5jb20=