 Jiaxin Li
 Wei Huang
- Ningxia Research Center for Territorial Spatial Planning, Yinchuan, China
Sustainable development is particularly important for ecologically fragile areas. The relationship between population and economy is a key factor affecting the sustainable development of ecologically fragile areas. This study uses the population and regional GDP data of 22 districts (cities, counties, etc.) under the jurisdiction of Ningxia from 2010 to 2019 to analyze regional gravity center, geographic concentration, inconsistency index, and spatial autocorrelation, therefore uncovers the population and economy spatial distribution pattern evolution of Ningxia. The results show that: 1) The population and economy in Ningxia is in an unbalanced spatial distribution pattern of “high in North and low in Middle and South,” and their geographical connection is relatively close. 2) The imbalance of economic development in Ningxia exceeds that of population development, but their relationship is becoming increasingly coordinated. 3) Ningxia’s economically advanced zones and coordinately developing zones are mainly concentrated in the north, and most of the central and southern areas have always been economically lagging. 4) There is a strong trend of agglomeration in Ningxia’s population and economic distribution. The districts with similar inconsistencies between population and economy tend to be spatially agglomerated, and the overall LL-type and HH-type agglomeration trend is significant. This research provides an important basis for the formulation of population and economic policies in ecologically fragile areas.
1 Introduction
Sustainable development is a developing approach based on the coordinated and all-around development of society, economy, population, resources, and the environment. The relationship between population and economy is a key factor affecting regional sustainable development. It is conducive to regional sustainable development when the regional population, its growth rate and spatial distribution match the regional economic development. And in cases where they are unmatched, regional sustainable development will be posed under potential threat.
In terms of empirical research, Coale and Hoover Calculated the impact of rapid population growth on India’s economic development (Coale and Hoover,1958). By introducing demographic variables into empirical models of economic growth, Bloom and Williamson proved that the demographic transition in East Asia, the transition from high to low mortality and fertility rates, contributed significantly to the so-called economic miracle in East Asia (Bloom and Williamson, 1998). Nakibullah studied the development process of Bangladesh and found that population growth does not cause real per capita GDP of Granger, but real per capita GDP will lead to population growth (Nakibullah, 1998). Thornton studied the long-term relationship between population and GDP per capita in seven Latin American countries and found no long-term relationship between population and GDP per capita. Population growth neither causes per capita GDP growth nor is caused by it (Thornton, 2001). Tsen and Furoka studied the relationship between population and economic development in Asian economies. They found that the relationship between population and economic growth is not direct. Population growth may be beneficial or unfavorable to economic growth, which may impact population growth (Tsen and Furuoka, 2005). Huang and Zixiong studied the relationship between population growth and economic growth in 90 countries. They found that population affects economic growth in the short term, but there is no relationship in a long time. However, economic growth does not affect population growth in any period (Huang and Xie, 2013). Yao et al. (2013) used China’s time-series data to predict the determinants of GDP per capita. The results show that population has a significant negative impact on GDP per capita (Yao et al., 2013). Peterson and EWF draw on historical data to map the links between population growth, growth in output per capita, and overall economic growth over the past 200 years. It is found that low population growth in high-income countries may cause social and economic problems, while high population growth in low-income countries may slow down their development (Peterson, 2017). Batunova and Perucca (2020) analyzed the relationship between population decline and economic development in various regions of Russia from 1998–2012, showing how the shrinking areas performed different economic growth patterns. In addition, many scholars have carried out empirical studies on the impact of population structure, population aging, demographic dividend and floating population on economic growth (Chen et al., 2017; Ma and Guo, 2017; Fang, 2018; Pan and Chang, 2021).
However, Western scholars seldom focus on the spatial pattern’s matching relationship between population and economy. In recent years, the gap between different regions has widened due to the uneven distribution of population and economy. Therefore, the relationship between the spatial distribution of population and economy has attracted more and more attention from Chinese scholars. Chinese scholars mainly conduct national, regional, and provincial research by analyzing regional center of gravity, coupling degree, imbalance index, etc., Fanjie et al. (2010), Juwei and Cai (2013), Zi-long et al. (2014), Zhao and Zhan (2014) conducted in-depth studies on the relationship of China’s population and economy in spatial distribution and its evolution. Ye-xi and Yu-qi (2011), Chu (2012), Wang et al. (2013), Zhang et al. (2015), Guoping and Luo (2017), Dongsheng and Jin (2017), Zhou (2019), Luo et al. (2019), Qin-qiang et al. (2020) have conducted qualitative and quantitative researches on the similar topic in specific regions of China such as the Poyang Lake Ecological Economic Zone, the Liaoning Coastal Economic Zone, the Beijing-Tianjin-Hebei Region, the Yangtze River Economy and Influencing Delta, the Central Plain City Cluster, the Beibu Gulf Economic Zone of Guangxi. Other scholars have conducted such studies in cities or provinces such as Chongqing (Zhou et al., 2011), Shanxi (Wang and Qin, 2013), Jiangsu (Qin et al., 2021) domestically. Existing research on the spatial distribution of population and economy is mainly concentrated in eastern developed areas, and less focused on the ecologically fragile areas in the northwest. Besides, the research methods chosen are not diversified enough, which has limitations.
This study selects Ningxia, China, which is in the ecologically fragile northwestern region and of which the socio-economic development is in an industrial transition period, as the research object. Using various research methods and technologies, we systematically analyze the evolution of the spatial distribution pattern of its population and economy in the past 10 years to fully reveal the relationship between population and economy within the region. The research will help fill the gaps in studies of the northwestern ecologically fragile areas, provide references for its policies formulation in the future, and promote the regional socio-economic sustainable development.
2 Research Background on the Region
Ningxia’s administration covers an area of 66,400 km2 and governs five prefecture-level cities and 22 counties (cities, districts). In 2019, the total permanent population of the district was 6.946 million, the permanent urban population was 4.1581 million, the urbanization rate was 59.86%, the regional GDP was 374.848 billion yuan. The landform of Ningxia is complex. The natural geographic spatial pattern features 3 distinctive major subregions: the north Yellow River irrigation area, the middle arid area, and the south mountainous area. The ecological environment is generally sensitive and fragile. Ecological problems such as soil erosion in the south, land desertification and grassland degradation in the middle, and salinization in the north are prominent, and water resources are scarce. Therefore, using the perspective of sustainable development to study the evolution of the spatial distribution pattern of population and economy in this area is in the interest of local development (Figure 1).
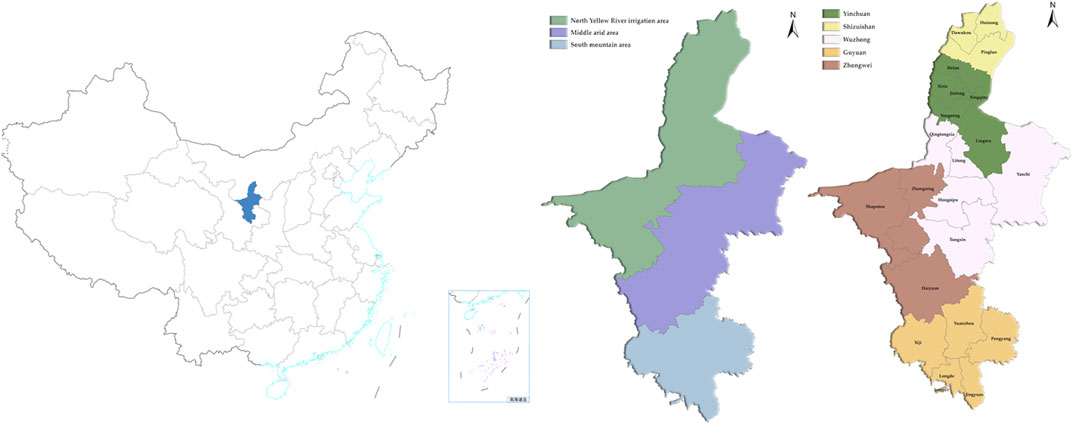
FIGURE 1. The location of Ningxia.
3 Materials and Methods
3.1 Regional Gravity Center
The regional center of gravity is an indicator to measure the overall distribution of a particular attribute in the region. Its distribution trend can reveal the degree of imbalance in the spatial distribution of the attribute. This study follows the gravity center analysis approach to figure out the spatial locations of the population center of gravity and economic center of gravity in Ningxia, as well as the direction and distance of the centers’ spatial movement through years, to determine the degree of imbalance in the spatial distribution of population and economy and its dynamic evolution. The calculation formula of the center of gravity (X, Y) is:
3.2 Geographical Concentration
The regional center of gravity analysis studies the relationship between the regional population and economic development in general, but it doesn’t show the relationship between the districts within the region. Therefore, this study uses the geographical concentration of population and economy analysis to investigate the spatial distribution of population and economy and its evolution. The geographical concentration of population and economy comprehensively measures population scale, economy volume, and land area to effectively reflect the spatial distribution of population and economy and the status and role of a district in the region. The calculation formula:
For the convenience of comparison, this study averages the calculated population geographic concentration and economic geographic concentration. 0.4, 0.8, and 1.6 are chosen as the three cut-off values to divide the population geographic concentration index and economic geographic concentration index of each region into four levels, namely the level-4 agglomeration interval (0.0, 0.4) and the level-3 agglomeration interval (0.4, 0.8), level-2 agglomeration interval (0.8, 1.6), and level-1 agglomeration interval (>1.6) (Ye-xi and Yu-qi, 2011).
3.3 Inconsistency Index
By calculating geographic concentration, the relationship between Ningxia’s population and economic development can be preliminarily revealed. Furthermore, the inconsistency between Ningxia’s population and economy can be analysed in depth through the inconsistency index. The calculation formula is:
The calculated inconsistency index divides the districts into 3 categories: economically advanced zones (0.0, 0.75), co-ordinately developing zones (0.75, 1.25), and economically lagging zones (>1.25). In the economically advanced zones, economic agglomeration is ahead of population agglomeration; in a co-ordinately developing zone, economic agglomeration and population agglomeration develop in harmony; in an economically lagging zone, economic agglomeration lags behind population agglomeration (Ye-xi and Yu-qi, 2011).
3.4 Spatial Autocorrelation
The above methods can lead to the spatial distribution of population and economy characteristics and the spatial distribution relationship in Ningxia. Still, they cannot explain the overall spatial correlation between population and economy, the internal connection and the evolution process of the relationship between population and economy distribution. Therefore, this paper uses Global Moran’s I index and Local Moran’s I to analyse the inconsistency index of population and economy in Ningxia.
Global Moran’s I index calculation formula:
I is the Global Moran’s I index; n is the total number of districts in the region;
The value of I is between −1 and 1. The correlation between spatial units is positive when the value is over 0 and negative when the value is under 0. Therefore, the closer its absolute value is to 1, the closer the relationship between the spatial units is (Griffith, 2003).
Local Moran’s I index calculation formula:
Measured by the value, the regional units can be grouped into four types: High-High, Low-Low, High-Low, and Low-High. For HH Type or LL Type, the adjacent units are both high or low in the value of, indicating local spatial agglomeration. In contrast, HL Type or LH Type shows local spatial differentiation (Anselin, 2010).
3.5 Pearson Correlation Coefficient
Pearson correlation coefficient is commonly used to measure the degree of linear correlation between two variables (with normal or nearly normal characteristics). This paper uses the correlation coefficient in SPSS statistical analysis software to analyze the correlation of factors affecting the relationship between population and economy (Hauke and Kossowski, 2011).
3.6 Multiple Linear Regression
In SPSS statistical analysis software, regression analysis is a widely used method to analyze the linear relationship between dependent and independent variables. In addition, this method is used to analyze the quantitative relationship between various variables. This paper selects linear regression method to discuss the factors affecting the relationship between population and economy in Ningxia, and because there are many factors affecting population and economy in Ningxia, that is, the independent variables are multiple, so this paper selects multiple linear regression model to analyze the influencing factors. The basic equation of this model is:
Y represents the dependent variable,
4 Results of Temporal and Spatial Population-Economy Evolution Analysis
4.1 Population-Economy Growth Changes Analysis
The population of different districts in Ningxia varied greatly. The population of the north Yellow River irrigation area exceeded 50% of the total population of Ningxia, and this trend was still increasing. The population of Ningxia showed an overall upward trend. The total permanent population increased from 6,329,600 in 2010 to 6,946,600 in 2019, and the population increased by 617,000 in 10 years, with an average annual growth rate of 1.04%. The population growth rate varies significantly across Ningxia, showing that the north Yellow River irrigation area was higher than the middle arid area, and the middle arid area was higher than the south mountainous area (Figure 2; Table 1) (Jiaxin and Zhang, 2021).
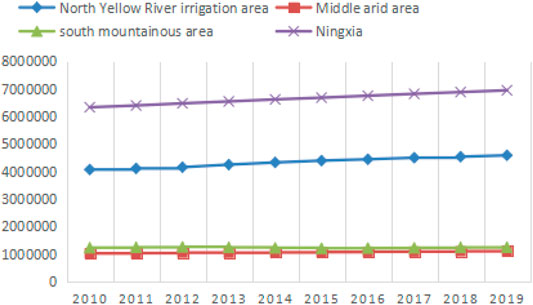
FIGURE 2. The population growth changes of 5 cities from 2010 to 2019.
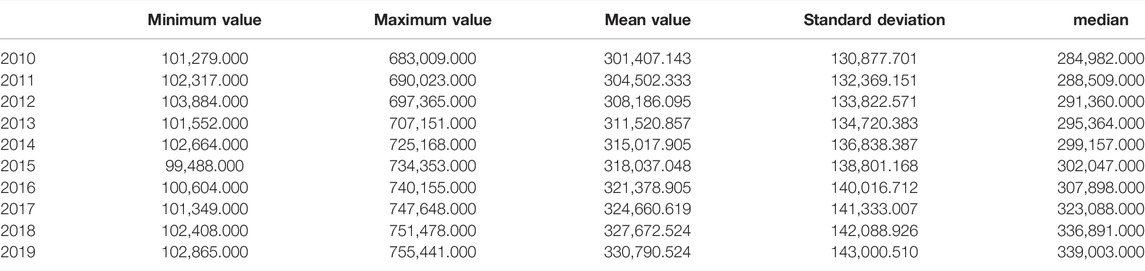
TABLE 1. The descriptive statistics of population (unit: people).
The economic share varied in different districts in Ningxia. The GDP of the north Yellow River irrigation area accounted for more than 80%, and Yinchuan accounted for about 50%. Ningxia’s GDP increased by about 205.887 billion yuan from 2010 to 2019, with an average annual growth rate of 9.26%. There were also significant differences in the growth of GDP in various districts of Ningxia. From 2010 to 2019, the net increase of the north Yellow River irrigation area exceeded 70% of that of Ningxia. And the net increase of Yinchuan, 110.417 billion yuan, was 3–5 times that of other cities. However, the growth rate has slowed down in the north Yellow River irrigation area, the fastest in the middle arid area and the second in the south mountainous area (Figure 3; Table 2).
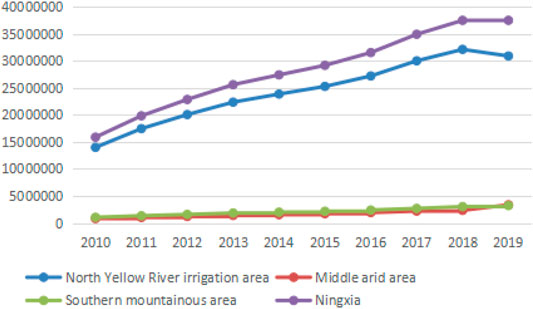
FIGURE 3. The economic growth changes of 3 major subregions from 2010 to 2019 (yuan).
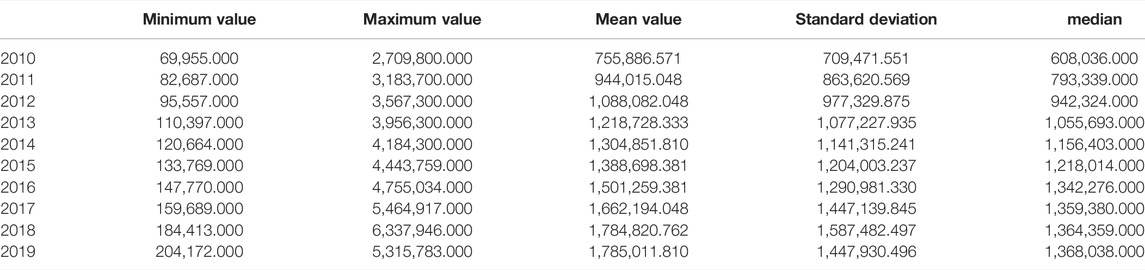
TABLE 2. The descriptive statistics of GDP (unit: 10,000 yuan).
The population and economy in Ningxia showed an uneven spatial distribution pattern of “high in North and low in Middle and South,” and their connection in geography was considerably close. The population and economic proportions of districts in Ningxia varied greatly. The total population of the north Yellow River irrigation area exceeded 50% of that of Ningxia, with its GDP exceeding 80% of the total regional GDP. The overall population growth rate appeared to be highest in the north Yellow River irrigation area and lowest in the south mountainous area. However, the economic growth rate in the north has slowed down and stayed lower than that of the central and southern areas, but the net increase exceeded 70% of the region’s net growth.
4.2 Gravity Center Evolution
The population gravity center of Ningxia was between 106.1535°E–106.1585°E, 37.5850°N–37.6350°N, which was located in Hongsipu from 2010 to 2014 and in Litong from 2015 to 2019. The population gravity center of Ningxia has always been north of the geometric center with an average deviation of 38 km from 2010 to 2019. This showed the imbalanced population distribution in Ningxia, and the population density in the north was higher than that in the south. From 2010 to 2019, the population gravity center of Ningxia has not moved much, mainly in the north-south direction, which changed 0.045°N in the north-south direction and 0.0038°E in the east-west direction. From 2010 to 2012, it continued to move southward. After 2012, it began to move northward. After 2018, it moved slightly to the south and then turned to move northward (Jiaxin and Zhang, 2021).
The center of gravity of Ningxia’s economy was between 106.2365°E–106.2469°E and 37.9902°N–38.1322°N, which was located in Lingwu. The center of gravity of Ningxia’s economy has been east of the geometric center with an average deviation of 88 km from 2010 to 2019. indicating the uneven economic development in Ningxia with the north and east most developed. From 2010 to 2019, the economic center of gravity in Ningxia has not moved much, mainly in the north-south direction, which changed 0.14°N from north to south and 0.01°E from east to west. From 2010 to 2017, it continued to move to the south. In 2018, it moved slightly to the north and then turned to move south.
The position changes of the economy and population gravity centers showed that the economic development imbalance in Ningxia exceeded the population development imbalance, but their relationship was increasingly coordinated. Ningxia’s economic center of gravity was always in the north of the population center, and its distance from the geometric center is greater than the distance between the population gravity center and the geometric center. However, from 2010 to 2019, the population center of gravity continued to move south, and the economic center of gravity continued to move north. 40.69 km separated the population center of gravity from the economic center of gravity in 2019, compared to 60.87 km separating them in 2010, indicating that the relationship between the two is becoming more harmonious (Figure 4).
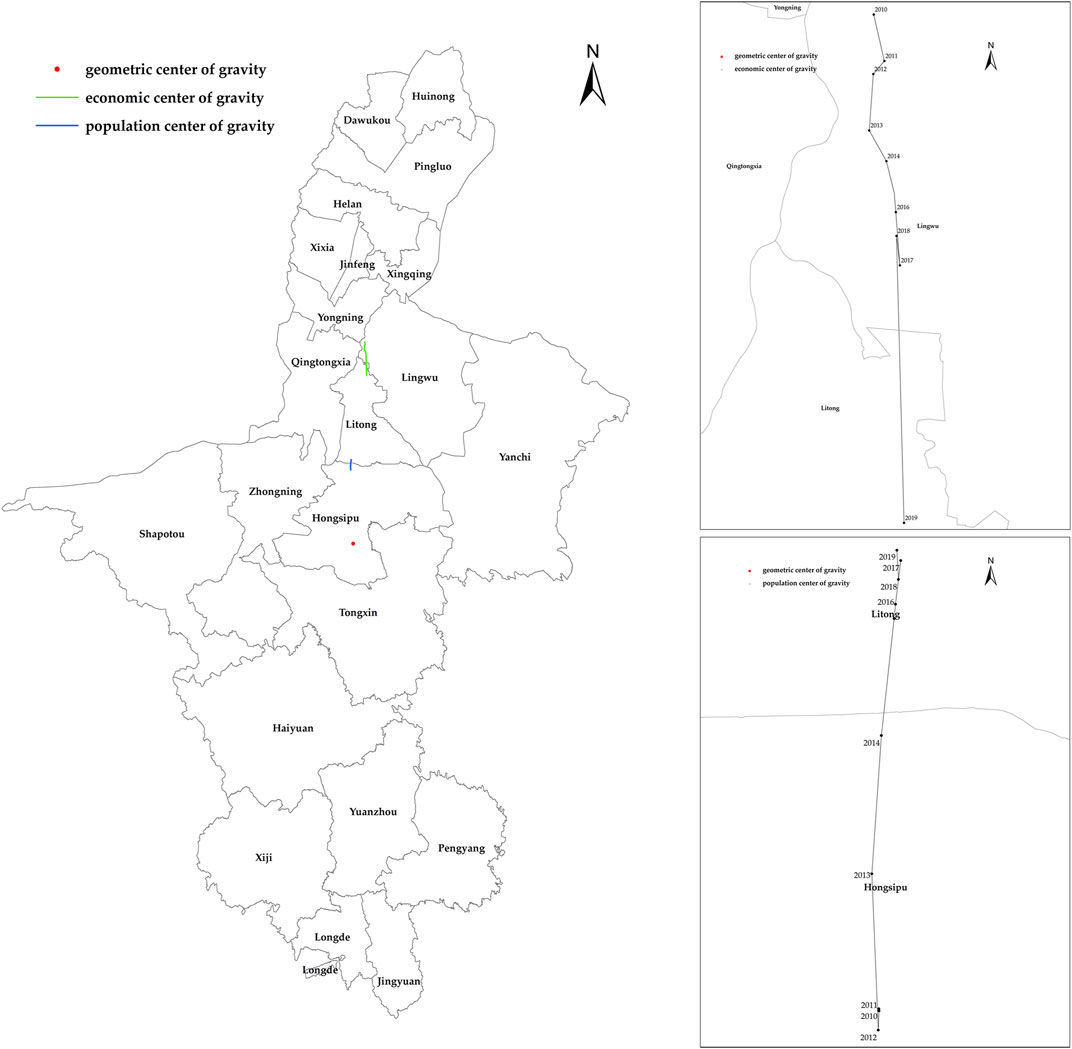
FIGURE 4. The gravity center evolution of Ningxia’s population and economy from 2010 to 2019.
4.3 Geographic Concentration
In general, the geographical concentration of Ningxia’s population has not changed much from 2010 to 2019, with only Xixia downgraded from level-1 to level-2. Numerically, the geographical concentration of population was decreasing in most districts, and increasing only in Jinfeng, Helan, Pingluo, and Hongsipu, with the most significant increase in Jinfeng. The geographic concentration of population in Jinfeng was always the highest significantly higher than other districts. The geographic concentration of population in Yanchi was always the lowest, substantially lower than other districts. The ratio of extreme values has increased from 47.08 in 2010 to 56.28 in 2019, indicating that Ningxia’s population development was polarizing. As the population agglomeration effect in the north Yellow River irrigation area continued to increase, the gap kept expanding, further strengthening the polarization effect. The diffusion effect has not yet appeared (Figure 5) (Jiaxin and Zhang, 2021).
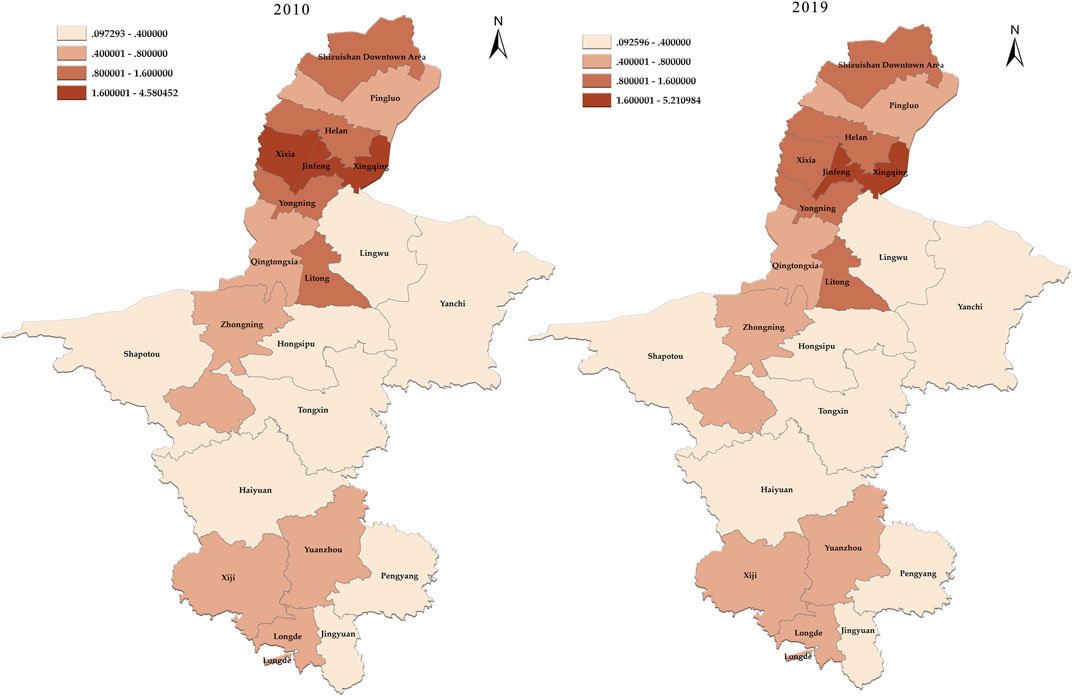
FIGURE 5. The geographical concentration of Ningxia’s population in 2010 and 2019.
In terms of economic geographic concentration, the number differentiated in different levels. The economic geographic concentration has not changed much from 2010 to 2019, and no district has their level changed. Numerically, the economic geographic concentration increased in most districts but decreased in Xingqing, Xixia, Yongning, Shizuishan, Pingluo, Qingtongxia, and Shapotou. The district with the highest economic geographic concentration changed from Xingqing to Jinfeng, which were significantly higher than other districts. The district with the lowest economic geographic concentration changed from Yanchi to Haiyuan, considerably lower than other districts. The ratio of extreme values decreased from 158.15 in 2010 to 70.38 in 2019, indicating that the gap in economic development in Ningxia has gradually reduced, the polarization effect has been weakening, and the diffusion effect has begun to appear (Figure 6).
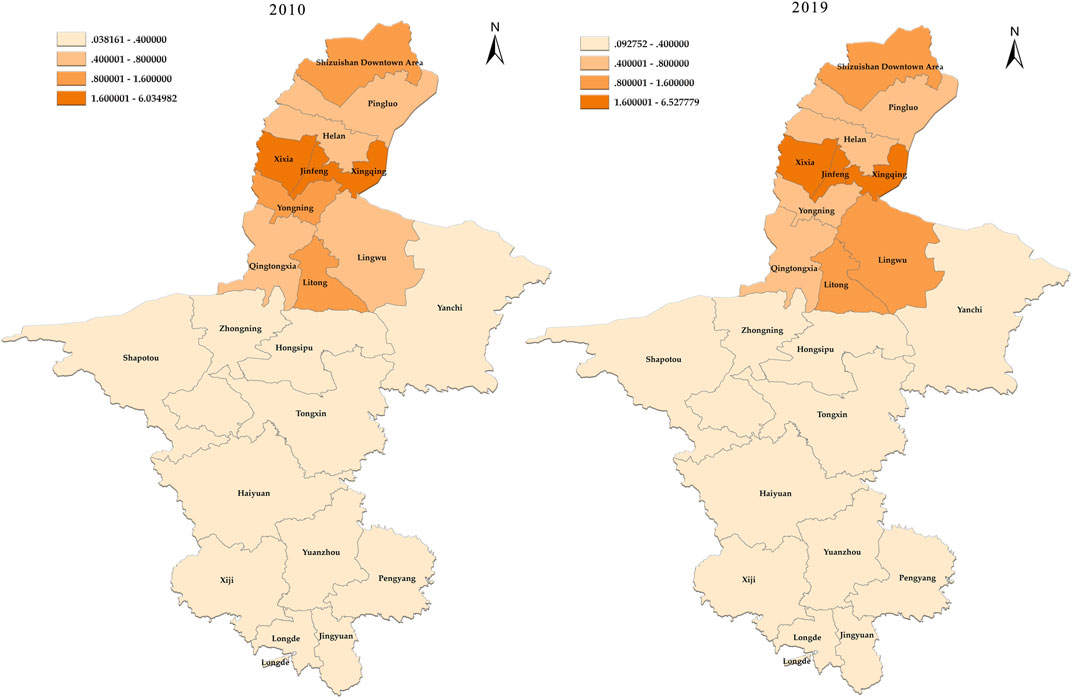
FIGURE 6. The geographical concentration of Ningxia’s economy in 2010 and 2019.
The geographic concentration of population and that of the economy in Ningxia were highly correlated and also characterized by “high in the north, low in the middle and south.” However, there were also certain deviations between the two, with a one-to-one correspondence between areas with higher (lower) population concentration and those with higher (lower) economic concentration not being achieved. The Yinchuan downtown area’s population and economic concentration index were the highest, and it gradually decreased outward, forming a contiguous area of high and medium values with the Yinchuan downtown area as the core. This showed that Yinchuan has a significant effect on the surrounding districts but minimal on the central and southern districts concerning population and economic development. The ratio of extreme values pointed at a more considerable polarization effect on geographic concentration of economy than that of population, indicating that the imbalance of Ningxia’s economic distribution was greater than that of population. However, judging from the geographic concentration evolution in various districts, the polarization effect was constantly strengthening in population geographic concentration and weakening in economic geographic concentration, resulting in an increasingly coordinated relationship between the two.
4.4 Inconsistency Index
Ningxia’s economically advanced zones and coordinately developing zones were mainly concentrated in the north. In 2010, there were three economically advanced zones, namely Xixia, Lingwu, and Shizuishan. In 2019, the number of economically advanced zones was reduced to two, and Shizuishan changed from an economically advanced zone to a coordinately developing zone. Numerically, the inconsistency index of the economically advanced zone was showing an upward trend, indicating that its population development and economic development were increasingly coordinated. In 2010, there were 6 coordinately developing zones, namely Jinfeng, Xingqing, Helan, Yongning, Pingluo, and Qingtongxia. In 2019, the number of coordinately developing zones remained unchanged, with Yanchi levelling from an economically lagging zone to a coordinately developing zone. Yongning and Qingtongxia were transformed from coordinately developing zones to economically lagging zones. The number of economically lagging zones has increased from 12 in 2010 to 13 in 2019, indicating that most regional economic development lags behind population concentration. The lagging zones were mainly concentrated in central and southern Ningxia. On the whole, the standard deviation of the regional Inconsistency Index has decreased from 1.8 in 2010 to 0.88 in 2019, and the average has dropped from 2.32 in 2010 to 1.67 in 2019, certifying to a certain extent that the relationship between population and economy in Ningxia has become more coordinated (Figure 7).
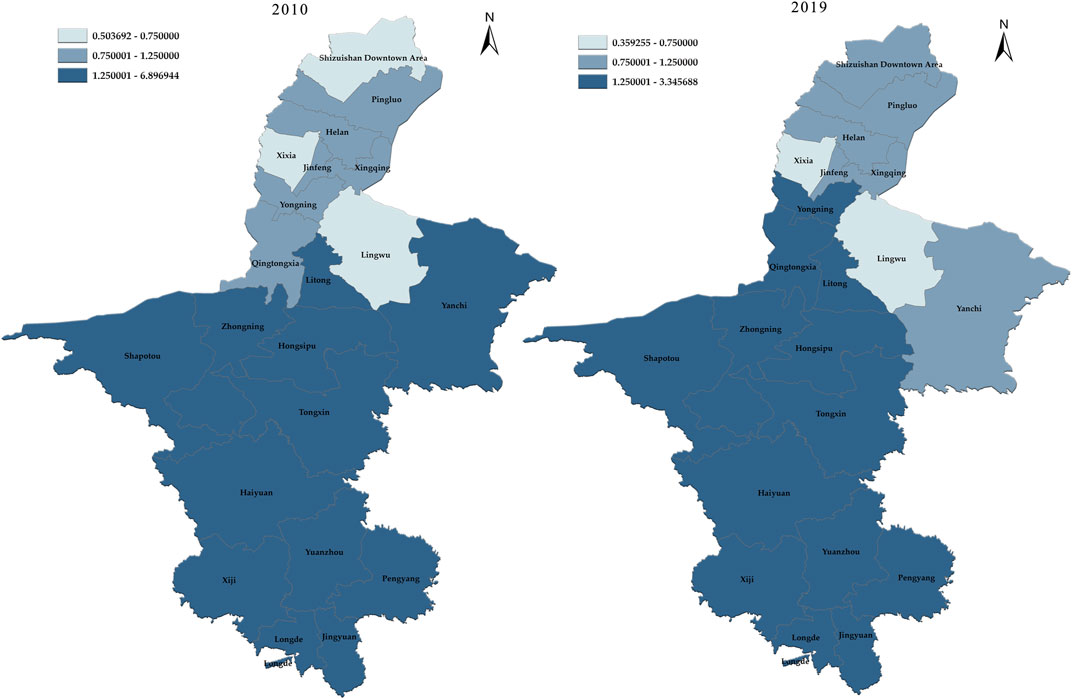
FIGURE 7. The inconsistency index of Ningxia in 2010 and 2019.
4.5 Spatial Autocorrelation
4.5.1 Global Moran’s I
It was calculated that the region-wide autocorrelation coefficient Moran’s I of the Ningxia population and economy inconsistency index in 2010 and 2019 were 0.58 and 0.71 (the results passed the Z test, p ≤ 0.01), which were significantly greater than 0. This situation indicated that the inconsistency index between the population and the economy in Ningxia was characterized by evident positive spatial autocorrelation. Thus, areas with similar inconsistencies between population and economy tended to be spatially agglomerated, and this situation was intensifying.
4.5.2 Local Global Moran’s I
This study used ArcGIS to analyze the Local Global Moran’s I of the inconsistency index between population and economy in Ningxia. In 2000, only Xingqing, Jinfeng, and Xixia were of LL type, Xiji was of HH type, and HL and LH types did not appear, while most districts had no significant characteristics. In 2019, Xixia changed from LL type to insignificant type, Lingwu changed from insignificant type to LL type, Longde, Jingyuan, and Haiyuan changed from insignificant type to HH type, and HL and LH types still did not appear, other districts’ characteristics were still insignificant. This showed that the districts where economic agglomeration was ahead of the population agglomeration were clustered in north Ningxia. In contrast, the sparsely populated and economically lagging areas were clustered in the south, and such effects were intensifying. However, the population and economic linkages in most districts were still weak (Figure 8).
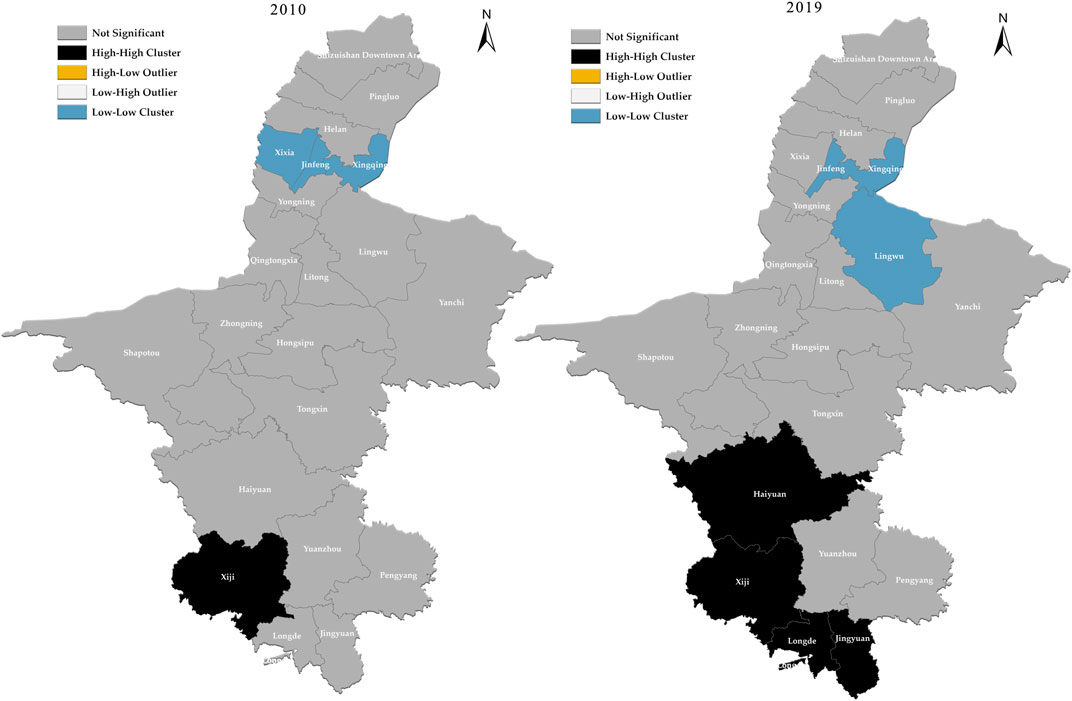
FIGURE 8. The Local Global Moran’s I of Ningxia’s inconsistency index in 2010 and 2019.
4.6 Influence Factors
Based on the correlation analysis between the importance of ecological protection, industrial structure, urbanization level, per capita local general public budget expenditure and the spatial inconsistency index of population and economy in 2019, it is found that the importance of ecological protection, industrial structure, urbanization level are the important factors affecting the spatial distribution of population and economy in Ningxia (Table 3).
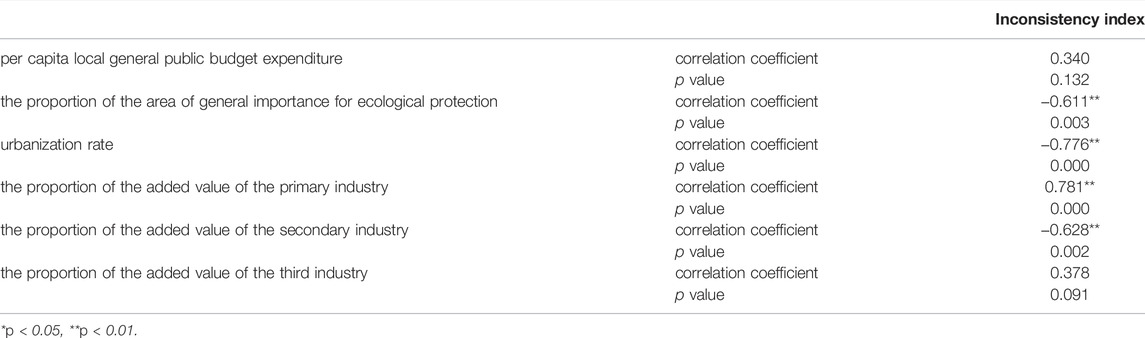
TABLE 3. Pearson correlation coefficient analysis results.
The proportion of the area of general importance for ecological protection, urbanization rate, the proportion of the added value of the primary industry, the proportion of the added value of the secondary industry was used as an independent variable, and the inconsistency index was used as a dependent variable for linear regression analysis.
The R2 value of the model is 0.881. The proportion of the area of general importance for ecological protection, urbanization rate, the proportion of the added value of The primary industry, and the proportion of the secondary industry’s added value can explain the reasons for the inconsistency index of 88.1%. The model passed the F-test (F = 29.638, p = 0.000 < 0.05). The proportion of the area of general importance for ecological protection, urbanization rate, the Proportion of added value of the secondary industry will have a significant negative impact on the inconsistency index. However, the proportion of the added value of the primary industry will not affect the inconsistency index. In addition, The test of the model’s multicollinearity shows that all VIF values in the model are less than 5, which means there is no collinearity problem. In addition, the D-w value is near the number 2, which indicates that the model does not have autocorrelation and there is no correlation between sample data (Table 4).
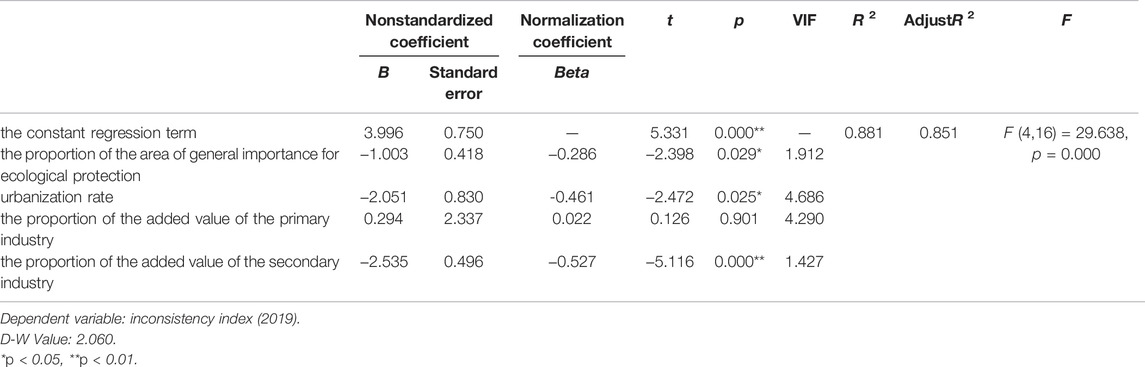
TABLE 4. Multiple Linear Regression analysis results.
5 Discussion and Conclusion
First, the population and economy of Ningxia present an uneven spatial distribution pattern of “high in North and low in Middle and South.” Natural conditions have laid a foundation for the formation of this pattern, and the uneven development strategies and policies have accelerated the formation of this pattern. Natural conditions determine the spatial variability and vulnerability of the ecological environment, thus affecting the spatial distribution of population and economy. There are significant differences in natural conditions in Ningxia. The north Yellow River irrigation area is blessed by the Helan Mountains and the Yellow River to form a plain area rich in resources and suitable for agricultural production and urban construction. Therefore, it is an area with better conditions for population and economic agglomeration. The central area is a low hill and arid sandy area, while the southern area is loess hilly and gully area and mountainous area. The natural environment of the central and south is harsh, the ecological environment is fragile, and the resources are scarce, which are not suitable for agricultural production and urban construction. As a result, the agricultural and economic activities are less, leading to a low degree of population and economic agglomeration. Due to the implementation of the regional development strategy, the government’s support for each area shows regional differences. As the strategic center of Ningxia’s development, the northern area along the Yellow Belt has received the external driving force of regional policy support. The north area has developed rapidly and become a high-value area for economic development and population agglomeration. As the core of the Urban belt along the Yellow River, Yinchuan has become the core of the high-value area of economic development and population agglomeration.
Second, urbanization level and industrial structure are the essential factors affecting the spatial distribution of population and economy in Ningxia. A high level of urbanization means a larger scale of cities and towns, a higher level of economic development, more employment opportunities and more significant attraction to capital, population and other factors of production. It is calculated that the Person correlation coefficient between the urbanization rate of Ningxia and the spatial inconsistency index of population and economy in 2019 is −0.776, which is significantly negative at the level of 0.01. This indicates that the higher the level of urbanization of areas, the economic development is ahead of the population agglomeration, while the lower the level of urbanization of areas, the economic development is behind the population agglomeration. Reasonable industrial structure helps maximize economic and social benefits. The optimization of industrial structure will promote regional economic development and affect regional population flow, thus affecting the relationship between population and economic spatial distribution. The Person correlation coefficient between the proportion of added value of three industries in GDP of Ningxia and the spatial inconsistency index of population and economy in 2019 is calculated. The change of primary and secondary sectors has the most significant impact on the population and economic distribution, with correlation coefficients of 0.781 and −0.628 (showing a significance level of 0.01), respectively. This indicates that where the higher the added value of the secondary industry is, the more the regional economic development is ahead of the population agglomeration, while where the higher the added value of primary sector of areas is, the more the economic development lags behind the population agglomeration.
Third, the imbalance of economic development in Ningxia exceeds the imbalance of population development, but the relationship between the two is becoming increasingly coordinated. The population changes always accompany the economic changes with a certain lag. The spatial imbalance of economic development is the fundamental driving force of population agglomeration. Areas with higher economic level have better production and living conditions, which constantly attract people to gather here. Recently, the industries in the urban agglomerations along the Yellow River have developed rapidly, and the economic agglomeration capacity of the north has improved fast. The agglomeration capacity improvement of the economy precedes that of population, so the uneven economic development outweighs the uneven population development. The Person correlation coefficient of the geographical concentration of population and the geographical concentration of economy in Ningxia 2019 is calculated to be 0.985, which is significantly at the 0.01 level positive correlation, confirming that the spatial imbalance of economic development is the fundamental driver of population concentration. However, as the regional economic differences between northern and south-central Ningxia continue to expand, coupled with the implementation of various talent introduction policies in the north area and the ecological migration project policies, a large number of people have moved from the south and central area to the north area to obtain ideal living conditions, which accelerates the population concentration in the north and reduces the population pressure in the south and central areas. As a result, the population in each area of Ningxia is more matched with the level of economic development, and the relationship between population and economy tends to be constantly coordinated.
Fourth, the polarization effect of Ningxia’s economic development is constantly weakening, the diffusion effect has begun to appear, and the polarization effect of the population has continued to increase. The emergence of this trend is mainly due to changes in the development stage of the urban agglomeration along the Yellow River. Ningxia’s urban agglomeration along the Yellow River has a small population base, a small number of towns and weak connections, and low economic aggregates. As China implements policies such as Western Development, the urban agglomeration along the Yellow River have gradually matured. As a result, its radiating effect has progressively changed from the single radiating spread of the core city of Yinchuan within the urban agglomeration to the radiating spread of the urban agglomeration as a whole to the surrounding non-urban agglomeration areas, and even the central and southern areas are radiated. Driven by the urban agglomeration along the Yellow River in the north, the economic development level of the central and southern areas has continued to improve, so the polarization effect of Ningxia’s economic development has weakened over time. However, the economic scale of central and southern areas is still far smaller than that of the north and not attractive enough for population agglomeration. Therefore, the population agglomeration in the northern area is increasingly polarized.
Fifth, ecological environment, industrial structure, urbanization level and other factors are important factors that affect the harmonious relationship between population and economy in Ningxia. We should continue to improve the environmental quality and ecosystem quality in the central and southern regions of Ningxia. According to the types and characteristics of ecologically fragile areas, ecological restoration and management projects should be carried out according to local conditions, and ecological compensation funds and project support should be given to the areas in the middle and south of Ningxia. The industrial structure should be optimized and industrial distribution adjusted in Ningxia. According to each region’s resource endowment, industrial foundation and environmental capacity, the leading industries shall be identified, and the industrial division and cooperation within the area shall be strengthened. We should accelerate industrial upgrading and transformation, replace high-emission and high-pollution models with high-efficiency, energy-saving and advanced manufacturing methods, and form a new industrial pattern in which the three industries develop harmoniously. We should speed up the construction of new-type urbanization in Ningxia, build a scientific and reasonable urban pattern, closely connect with regional economic development and industrial layout, and adapt to the carrying capacity of resources and environment. The central cities along the Yellow River should continue to speed up the construction of new urbanization and promote the development of surrounding cities. For the economic lagging areas in the central and southern regions with relatively low urbanization level, we should scientifically plan the urban development ideas and framework, construct a new urban and rural system, pay attention to infrastructure construction, improve public service capacity, promote urban-rural integration development, and improve the total population carrying capacity of the central and southern regions. It is necessary to enable the high-quality integrated development of Ningxia Urban agglomeration along the Yellow River, accelerate industrial aggregation and economic development, strengthen the policy of talent introduction, form its population attraction, intercept the outflow of population, enhance the core competitiveness of the Urban agglomeration along the Yellow River, and improve the radiating and driving ability of the urban agglomeration along the Yellow River to the central and southern regions. Guyuan will be built into the central city of population gathering in south Ningxia and the regional public service supply center. The radiation and driving role of Guyuan in southern Ningxia will be strengthened.
Finally, research limitations and prospects: first, the depth of the study needs to be further strengthened. This study only analyzes the relationship between the permanent population and the spatial distribution of the economy from the perspective of the total quantity, without considering the spatial matching status of other indicators of population, such as population age structure, population quality, labor force employed population, and other indicators of the economy, such as industrial structure. Second, in discussing the factors influencing the relationship between population and economy, we could not collect the data related to location conditions, traffic conditions, history and culture and failed to carry out quantitative analysis on their correlation. Third, the possible social effects caused by the mismatch between population and economic distribution need to be further studied. These problems still need further discussion in future studies and research.
Data Availability Statement
Publicly available datasets were analyzed in this study. This data can be found here: http://nxdata.com.cn/publish.htm?cn=G01.
Author Contributions
JL and WH contributed conception of the study. JL analysed the data. JL and WH interpreted the results. JL wrote the manuscript. JL and WH contributed to manuscript revision and the final version of the manuscript.
Conflict of Interest
The authors declare that the research was conducted in the absence of any commercial or financial relationships that could be construed as a potential conflict of interest.
Publisher’s Note
All claims expressed in this article are solely those of the authors and do not necessarily represent those of their affiliated organizations, or those of the publisher, the editors and the reviewers. Any product that may be evaluated in this article, or claim that may be made by its manufacturer, is not guaranteed or endorsed by the publisher.
Acknowledgments
I would like to thank my friends Dr. Zilong Jiang, Mr. Xiaowen Li and Ms. Hongjie Yu for their guidance in this study.
References
Anselin, L. (2010). Local Indicators of Spatial Association-LISA. Geographical Anal. 27 (2), 93–115. doi:10.1111/j.1538-4632.1995.tb00338.x
Batunova, E., and Perucca, G. (2020). Population Shrinkage and Economic Growth in Russian Regions 1998-2012. Reg. Sci. Pol. Pract 12 (4), 595–609.
Bloom, D. E., and Williamson., J. G. (1998). Demographic Transitions and Economic Miracles in Emerging Asia. World Bank Econ. Rev. 12 (3), 419–455. doi:10.1093/wber/12.3.419
Chen, S. W., Zhao, J. F., and Han, Z. A. (2017). “Study on the Influence of Floating Population on Urban Economic Growth,” in 7th International Conference on Education and Management (ICEM), Shenyang, PEOPLES R CHINA, Dec 29-31 2017.
Chu, M. C. (2012).“Research on Coordination Evaluation of Population and Economy in Liaoning Coastal Economic Zone,” in International Conference on Education Reform and Management Innovation (ERMI 2012), Shenzhen, PEOPLES R CHINA, Dec 04-05 2012.
Coale, A., and Hoover, E. M. (1958). Population Growth and Economic Development in Low-Income Countries: A Case Study of Indias Prospects, 55. Princeton New Jersey: Princeton University Press, 39–40.1
Dongsheng, Y., and Jin, Y. (2017). Change in Spatial Distribution of Population and Factors in the Yangtze River Economy and Influencing Delta. Prog. Geogr. 036, 820–831.
Fang, C. (2018). Population Dividend and Economic Growth in China, 1978-2018. China Econ. J. 11 (3), 243–258. doi:10.1080/17538963.2018.1509529
Fanjie, J., Tao, A., and Chenl, L. V. (2010). The Coupling Mechanism of the Centroids of Economic Gravity and Population Gravity and its Effect on the Regional Gap in China. Prog. Geogr. 29 (1), 87–95. doi:10.11820/dlkxjz.2010.01.012
Griffith, D. A. (2003). Spatial Autocorrelation and Spatial Filtering: Gaining Understanding through Theory and Scientific Visualization. J. Regionalence 44 (3), 633–635. doi:10.1007/978-3-540-24806-4
Guoping, L. I., and Luo, X. (2017). Coordinated Development between Population and Economy in the Beijing-Tianjin-Hebei Region. Prog. Geogr. 36, 25–33.
Hauke, J., and Kossowski, T. (2011). Comparison of Values of Pearson's and Spearman's Correlation Coefficients on the Same Sets of Data. Quaestiones Geographicae 30 (2), 87–93. doi:10.2478/v10117-011-0021-1
Huang, T.-H., and Xie, Z. (2013). Population and Economic Growth: A Simultaneous Equation Perspective. Appl. Econ. 45, 3820–3826. doi:10.1080/00036846.2012.734596
Jiaxin, L., and Zhang, Q. (2021). Study on the Evolution Characteristics of Population Spatial Distribution in Ningxia from 2010 to 2019. Scientific Tech. Inf. Gansu 50 (10), 5. doi:10.3969/j.issn.1672-6375.2021.10.018
Juwei, Z., and Cai, Y. (2013). Balanced Regional Development in China:Demographic and Economic Distribution Mismatch. Popul. Res. 06, 3–16.
Luo, Y., Yu, H., Liu, S., Liang, Y., and Liu, S. (2019). Spatial Heterogeneity and Coupling of Economy and Population Gravity Centres in the Hengduan Mountains. Sustainability 11 (6), 1508. doi:10.3390/su11061508
Ma, H., and Guo, P. (2017). “The Dynamic Econometric Analysis of Population Structure on Economic Growth in China,” in 7th International Conference on Education, Management, Information and Mechanical Engineering (EMIM 2017), April 28, 2017.
Nakibullah, A. (1998). Population Growth and Development: The Case of Bangladesh. Appl. Econ. Lett. 5 (4), 231–234. doi:10.1080/135048598354870
Pan, J.-N., and Chang, M.-L. (2021). Population Aging, Middle-Income Trap, and Economic Growth: An Empirical Study of Asian Economies. Singapore Econ. Rev. 66 (1594), 1577–1594. doi:10.1142/S0217590818420092
Peterson, E. W. F. (2017). The Role of Population in Economic Growth, 7. Los Angeles, United States: Sage Open, 2158244017736094.
Qin, X. H., Guan, Y. J., and Li, Y. Q. (2021). Evaluation on Coordination Degree of Population, Economy and Environment in Yangtze River Conservation Strategy: A Case Study of Jiangsu Province. J. Environ. Prot. Ecol. 22 (4), 1801–1811.
Qin-qiang, Y., Yin-yin, F., and Zhi-qiang, Y. (2020). Spatial and Temporal Evolution Characteristics of Economy and Population Center in the Beibu Gulf Economic Zone of Guangxi. J. Nanning Normal University(Natural Sci. Edition) 37 (1), 97–103. doi:10.16601/j.cnki.issn2096-7330.2020.01.016
Sun, D. D. (2000). Selection of the Linear Regression Model According to the Parameter Estimation. Wuhan, China: Wuhan University Journal of Natural Sciences, 400–405.
Thornton, J. (2001). Population Growth and Economic Growth: Long-Run Evidence from Latin America. South. Econ. J. 68 (2), 464–468. doi:10.2307/1061606
Tsen, W. H., and Furuoka, F. (2005). The Relationship between Population and Economic Growth in Asian Economies. ASEAN Econ. Bull. 22 (330), 314–330. doi:10.1355/ae22-3e
Wang, G., and Qin, Z.-q. (2013). The Evolution of Spatial Relationship between Population and Economy in Shanxi Province. Econ. Geogr. 33, 29–35. doi:10.3934/cpaa.2004.3.331
Wang, Y., Chen, Y., and Li, Z. (2013). Evolvement Characteristics of Population and Economic Gravity Centers in Tarim River Basin, Uygur Autonomous Region of Xinjiang, China. Chin. Geogr. Sci. 23 (6), 765–772. doi:10.1007/s11769-013-0643-4
Yao, W., Kinugasa, T., and Hamori, S. (2013). An Empirical Analysis of the Relationship between Economic Development and Population Growth in China. Appl. Econ. 45 (4661), 4651–4661. doi:10.1080/00036846.2013.795284
Ye-xi, Z., and Yu-qi, L. (2011). The Coupling Relationship between Population and Economic in Poyang Lake Ecological Economic Zone. Econ. Geogr. 31 (2), 195–200. doi:10.15957/j.cnki.jjdl.2011.02.009
Zhang, C., Liu, Y., and Qiao, H. (2015). An Empirical Study on the Spatial Distribution of the Population, Economy and Water Resources in Northeast China. Phys. Chem. Earth, Parts A/B/C 79-82, 93–99. doi:10.1016/j.pce.2015.01.003
Zhao, W., and Zhang, X. (2014). “Research on Spatial Distribution of Population and Economy in China,” in 2014 International Conference on Public Administration (ICPA 10th), Chengdu, China, October 24, 2014.
Zhou, P. C. (2019). Spatial and Temporal Evolution and Coordination Analysis of Population, Space and Economy in Central Plain City Cluster of China. Appl. Ecol. Environ. Res. 17, 5. doi:10.15666/aeer/1705_1068510702
Zhou, Y., Tu, J. - j., Lu, D.-b., Xiao, Y., and Jing - tao, W. (2011). Study on the Relationship between Population and Economic Spatial Distribution and its Dynamic in Chongqing. Econ. Geogr. 11, 23–27. doi:10.15957/j.cnki.jjdl.2011.11.004
Keywords: population, economy, spatial distribution pattern evolution, ecologically fragile area, sustainable development, Ningxia, China
Citation: Li J and Huang W (2022) Research on Evolution of Population and Economy Spatial Distribution Pattern in Ecologically Fragile Areas: A Case Study of Ningxia, China. Front. Environ. Sci. 10:814569. doi: 10.3389/fenvs.2022.814569
Received: 15 November 2021; Accepted: 15 March 2022;
Published: 05 April 2022.
Edited by:
Edyta Laszkiewicz, University of Łódź, PolandReviewed by:
Anlu Zhang, Huazhong Agricultural University, ChinaLuigi Aldieri, University of Salerno, Italy
Copyright © 2022 Li and Huang. This is an open-access article distributed under the terms of the Creative Commons Attribution License (CC BY). The use, distribution or reproduction in other forums is permitted, provided the original author(s) and the copyright owner(s) are credited and that the original publication in this journal is cited, in accordance with accepted academic practice. No use, distribution or reproduction is permitted which does not comply with these terms.
*Correspondence: Jiaxin Li, bGlqaWF4aW43NkAxMjYuY29t