 Anam Azam1*
 Muhammad Rafiq
 Muhammad Shafique
- 1School of Economics and Management, North China Electric Power University, Beijing, China
- 2Department of Electrical Engineering, University of Engineering and Technology, Taxila, Pakistan
- 3Department of Civil and Environmental Engineering, Brunel University London, Uxbridge, United Kingdom
The global warming phenomena arise from the subject of climate change, which draws intellectuals’ attention toward replacing polluting energy sources with clean energy sources by continued deployment of innovations. Also, global warming problems put large pressure on governments, individuals, and policymakers. Therefore, for reliable energy supply and economic development, the target of achieving a low-carbon and sustainable environment is needed. In this light, we explore the role of clean energy and technological innovation in carbon emission reduction in China from 1995 to 2018. The key outcomes from the fully modified least-squares and robust least-squares indicate an elasticity of −0.065 and −0.075, respectively, for the nexus of renewable energy and CO2 emissions. Similarly, nuclear energy, technology innovation, and political-institutional quality have a negative influence on CO2 emissions. Furthermore, the granger causality demonstrates feedback between renewable energy and CO2 emissions, as well as between technological innovation and CO2 emissions. To achieve a cleaner environment, the implementation of the existing policy pathways is potentially geared toward applying technological innovations to produce renewable energy at lower costs.
Introduction
With the rapid economic development, modernity, and energy consumption growth, China has surpassed the United States as the world’s greatest energy consumer and CO2 emitter (Sebri and Ben-Salha, 2014). China’s primary energy use climbed from 397.1 million tonnes oil equivalent to 3.1 billion tonnes oil equivalent between 1978 and 2017, accounting annual growth rate of 5.4%. The demand for energy will further increase in the coming years because Chinese’s economy is, to a large extent, reliant on energy consumption. This escalating energy consumption is a massive issue because mostly this energy comes from conventional energy, e.g., coal, oil, and natural gases that are burned to generate electricity that discharges GHG, especially CO2 emissions (Yahya and Rafiq, 2019a; Bilgili et al., 2020; Shafique et al., 2021a; Azam et al., 2021b; Azam et al., 2021d; Azam et al., 2021e).
GHG emanations have abruptly amplified subsequent industrialized expansion in developing and developed states (Liu et al., 2013; Shafique et al., 2020; Shafique et al., 2021b; Shafique and Luo, 2021). The main sources of China’s energy production and consumption are coal, which produces the largest emissions, accounting for approximately 80–90% of the total environmental problems, especially CO2 emissions, have increased in China in recent years. CO2 emissions constitute above half of the GHG discharges most possibly linked with climate change (Farhani and Shahbaz, 2014). The IPPC (Parry et al., 2007) fifth assessment reported that GHG discharges were augmented by 1.6% annually, whereas CO2 emissions were largely enlarged by 1.9% from fossil fuel energy consumption over the previous 3 decades. Furthermore, the IPPC projected that GHG emanations would surge by 25–90% in 2030 as associated with the year 2000, and CO2 radiations in 2030 will have been enlarged by 40–110% (Azam et al., 2021e).
To safeguard human health and life from vigorous climate change, the Kyoto Protocol (KP) fixed an objective to decrease GHG radiations in advanced states to 5.2% beneath the 1990 level for the duration of 2008–2012, and has also completed such a settlement since 2005. Besides, the GHG discharges of nations that have contracted KP extension simply make up 15% of yearly universal GHG emanations. In contrast, developing nations also have an obligation to decrease emissions (Dogan, 2015).
However, the main reasons for researching and incorporating clean fuel technologies and new energy sources worldwide are global warming and the greenhouse effect (Hil Baky et al., 2017). These atmosphere concerns and the rapid debilitation of conventional energy poked the economies to develop highly efficient and environmentally friendly power plants (Ellabban et al., 2014). Ensuring ES and inhibiting energy involvement in climate change are two developing challenges for the energy industry on the way to sustainable prospects. Both nuclear and renewable energy sources are self-renewing and cannot dissipate over time. Furthermore, it improves energy security and lowers carbon emissions for countries around the world (Cerdeira Bento and Moutinho, 2016).
Accordingly, many economies have paid great attention to the development of nuclear and renewable energy to decrease reliance on foreign energy sources. Most researchers (Al-Mulali et al., 2013a; Long et al., 2015; Shahbaz et al., 2015b) believe that both types of clean energy are considered carbon-free energy sources that can give significant solutions to the concerns of global warming and energy security. Furthermore, the use of nuclear energy ensures to diversify the excessive energy supply, provide energy security, as well as a low-carbon energy replacement for fossil fuels.
However, according to Zoundi (2017), renewable energy may negatively impact carbon emissions, which is beneficial to the atmosphere, whereas nuclear energy argues that it can mitigate carbon emissions and provide a clean environment. Some studies have found that either one or both forms of energy do not contribute to the carbon emission reductions, such as Apergis et al. (2010), Yildirim et al. (2012), Farhani and Shahbaz (2014), Jebli and Youssef (2015), Bilgili et al. (2016), and Dogan and Seker (2016).
A rising debate has erupted about the significance of technological innovation in mitigating environmental degradation and climate change implications (Jian et al., 2019). Technology innovation plays an important role in improving energy efficiency and controlling pollutant emissions effectively and economically (Azam et al., 2020; Azam et al., 2021c; Azam et al., 2021g). Furthermore, innovation accelerates the adaptation of renewable energy to fulfill the energy demands and also modifies energy usage (Bölük and Mert, 2015; Zeng et al., 2015). Technological progress supports the development of clean sources and utilizing them as a source of new, clean, and sustainable energy to meet the world’s demand (Lin and Wesseh Jr, 2014). Technology innovation is effectively used for the benefit of humanity to meet current and future generational needs for sustainable environmental growth.
In the context of the environment, economists, scientists, and policymakers have currently focused on institutional quality. Among the different aspects of governance, government effectiveness most widely adopted element, suggesting a well-functioning and successful constitutional system. Political, institutional quality as a proxy of government effectiveness with renewable and nuclear energy consumption enhances investment, boosting environmental-friendly related green technologies that would increase the utilization of clean energy in the regions. Government effectiveness implements austere environmental regulations that boost multinational corporations by encouraging them to enhance and shift clean technologies that positively impact the atmosphere in the asylum economies. In the enforcement and execution of policies, strong institutions play a critical role and contribute to the persistence of public preferences (Akhmat and Zaman, 2013; Salman et al., 2019). Institutions are a society’s informal and formal regulations that play an important role in preserving environmental quality while reaping the benefits of clean energy and innovations. As a result, institutions should be considered as input for sound legislation and effective implementation to improve environmental quality. Efficient institutions can have an impact on economic growth and environmental quality by ensuring environmentally-friendly industries, whereas inefficient institutions fail to adopt environmentally beneficial ideas in society (Bayar and Maxim, 2020). However, it can be hypothesized that without political powers, environmental protection cannot be guaranteed.
Furthermore, in 2015 the United Nations (UN) has declared a new action of 17 sustainable Development Goals (SDGs) that endorse global prosperity. Environmental sustainability is thought to be at the heart of these SDG declarations, specifically focused on guaranteeing global environmental improvement. For instance, SDG 8 and SDG 9 call to promote long-lasting, universal economic growth and advance innovations, respectively. SDG 13 urges to take pressing action to skirmish the climate change and encourage the economies to implement appropriate policies of the environment as well as build pliability to its adverse consequences. SDG 16 encourages irenic and comprehensive communities for long-term development, ensures equal access to justice, and establishes effective liable and strong institutions at all stages (Azam et al., 2021a). The most important SDG 7 targets to improve environmental performance by increasing access to affordable, reliable, and modern energy. In this sense, it is thought vital to replace conventionally consumed fossil fuels with cleaner fuel alternatives to meet the global environmental sustainability target.
In light of this and growth of clean energy, it is imperative to examine the role of clean energy in the presence of technological innovation and political-institutional quality for contributing the literature of environmental degradation mitigations and sustainable energy future. Thus, this article aims to address this issue, which is still understudied. More specifically, in achieving the research aims, we fill the gap in the literature with three main ways.
First, there is no study scrutinizing the impact of renewable energy and nuclear energy on CO2 emission reduction in the world-leading CO2 emitter in China from 1995 to 2018. As is explained above, China merits special attention because of its large and rising population, which puts a strain on the environment. Mostly, previous work mainly focused on panel analysis, such as MENA, SSA, BRICS, PIGST, EU, and OECD; however, studies need to focus on the single-country case. Therefore, a study from emerging countries such as China is indispensable for finding the behavior of clean energy, innovation, and political institutions in milieu reduction.
Second, this present study further considers two other new variables (technological innovation and political-institutional quality) to achieve the main research goal and provide consistent results. Most of the existing studies (Al-Mulali et al., 2013b; Begum et al., 2015; Rasoulinezhad and Saboori, 2018; Vo et al., 2019; Hdom and Fuinhas, 2020; Sun et al., 2020) mainly focused on the conventional factors related to CO2 emissions and energy. Our study identifies technological innovation and politician institutional quality that has recently received increased attention from countries in energy policy and environment. In addition, we do comparative analysis of the impact of nuclear energy and renewable energy on carbon emissions.
Finally, this study estimates the log-run elasticity and causal relationship among the key factors. Our study uses the FMOLS estimation method that reduces endogeneity bias and serial correlation and in addition the RLS estimators for robustness. The Toda-Yamamoto test was also used in our research to determine the direction of causation between variables. The long-run estimation and causality association may provide some policy guidance for sustainable energy and the environment.
China: Choice and Trends
China is selected for several reasons. China is the world’s fastest-growing economy and advanced industrial country. China’s financial development has accelerated over the last 4 decades, and it has emerged as a global financial superpower. China is the second largest energy consumer, accounting for a long time; its energy structure based on coal has been increasing for rapid economic development, consequently causing severe environmental issues. FEC accounts for almost 90% of all global CO2 emissions, according to research from the European Commission’s Joint Research Center (JRC) (Shayanmehr et al., 2020). Subject to the stress of restraining climate change, these evolving nations are confronted with the difficulty of growing GR or decreasing EC and GHG discharges.
The accomplishment of the objective of decreasing CO2 emissions generally relies mainly on responsibility, nature, and efficacy of energy usage by major CO2 transmitters. United States, China, United Kingdom, India, Canada, Germany, Russia, Iran, Russia, South Korea, and Japan are top economies and prominent CO2 emitters in the world. The overall average GR of these leading CO2 discharging states accounted for more than 75% of world GR since 1991. These economies are also major energy consumers and their average CO2 emissions are more than 75% of world CO2 emanations from 1990 through 2014. These economies’ annual CO2 emissions are 1.5 times higher than the global average per capita emissions (CCPI, 2016). China has exceeded the US regarding the total CO2 discharges since 2005. India and Russia are the subsequent countries in the index of CO2 radiating nations. Five economies, including China (with 29% portion in universal total), United States (14%), India (7%), Russia (5%), and Japan (3.5%), together made up two-thirds of total world emanations (Solarin et al., 2017). Owing to industrialization and urbanization, growing economies such as China have needed a lot of energy in recent decades (Omri et al., 2015). However, these countries are heavily reliant on fossil fuel-based energy-concentrated activities to meet this massive need for energy. For that reason, enormous EC due to industrialization and urbanization gives rise to serious GHG discharges in these countries (Zhao et al., 2015). The emissions are generally from FEC ignition (electricity-linked discharges) and gypsum manufacture (processing-connected discharges) (Boden et al., 2017). Following the WTO in 2002, China’s manufacturing industry exploded, increasing energy-related emissions (Peng et al., 2019). As a result of this expansion, China has become the world’s greatest energy consumer and CO2 emitter (Chen, 2016; Shan et al., 2018).
As the global leading energy user and CO2 transmitter, China is at the moment confronting multiple energy and ecological challenges (Chandran and Tang, 2013). In reality, China has expended an enormous amount of fossil and nonfossil fuels in recent years. China’s total EC approximated 3053 Mtoe, responsible for almost 23% of total global EC (Dong et al., 2017). This huge EC has resulted in the prompt intensification of CO2 emissions in China. In 1965, CO2 emission in China was recorded at almost 489 Mt, which has mounted to 9123 Mt in 2016, an upsurge of approximately 20 times. As a result, the Chinese government has introduced incompetent coal facilities to discontinue the apparent levels of these emanations (Enerdata, 2017). The energy reform 5-Year Plans is also an attempt to reduce emissions (Figure 1). This amazingly large GR level initiated to decelerate for the period of the worldwide economic adversity in 2008. The progression proportion started to decline in 2011. The growing rate was noted, approximately 8% during 2011–2014 (World Bank, 2017). As a result, China benefitted from this continued period of high GR followed by immense energy ventures and EC in the manufacturing sector, leading to noticeable amounts of GHG discharges (Huo et al., 2014). The extraordinary demand for energy by urbanization and industrial sector which was either fulfilled from imported fuels or domestic produced fuel-based energy, together with a very trivial portion of clean energy.
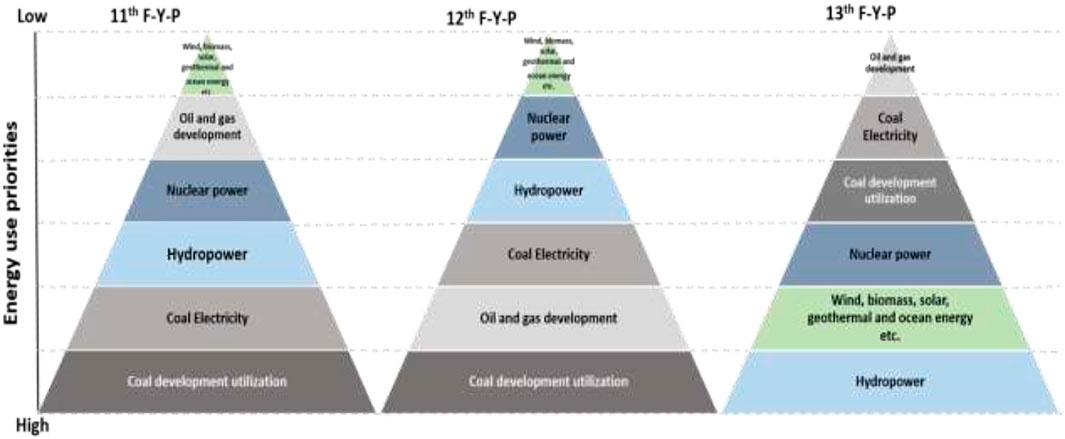
FIGURE 1. Energy usage priorities pyramid diagram of three 5-year policies.
China provides nearly 44% of the entire coal origination and is accountable for a huge fraction of coal demands worldwide (Yuan et al., 2018). Massive investments in the energy segment accompany the huge energy production. Nevertheless, the intention and objective of this investment in the energy sector are extremely critical. In one respect, this investment may magnify the potential ability of the fuel-based energy sector, encouraging industry yield and GR. Accordingly, it may enhance the generation of GHG discharges. Some other way, this investment may perform its role in enhancing standards of fuels burned in the manufacturing division and upgrading energy production machinery. This will cause two related gains, such as restricting the generation of GHG radiations and sustainable elevated GR. China went through an undergoing technical thrive and express metropolitan sprawl that caused high-energy requisite (Zhang and Broadstock, 2016). To cope with this demand, a massive energy supply is needed, therefore causing a high demand for enormous ventures in the energy industry. Such funds shall enhance the generation of energy, leading to increment in EC in industries as well as homes, henceforth augmenting industrial segment production (Lu, 2017).
Porter’s postulate recommends that strategies aiming at energy investment affect industrial yield (Tanaka et al., 2014) and induce a republic’s economic conduct accordingly. Furthermore, as monetary conduct is booming, the state could have the motivation to finance the energy industry to enhance its production. In addition, augmentation in energy generation and EC may cause more emanations in the atmosphere as a spill-over effect. The extraordinary intensities of discharges are dangerous to prosperity regarding miserable communal verdure, resulting in reduced productivity of human resources and obstructing EG. In the light of the EKC theory, economies with worse EG are largely reliant on the inferior attribute of fuels and technology for energy yield.
It has been acknowledged that the increase in atmospheric CO2 accumulation is the direct source of global warming (Clark et al., 2016). It has become a serious concern worldwide for the research community to find out ways how to diminish CO2 emissions to mitigate global warming efficiently. In 2016, China formally joined PCCA and pledged to drop CO2 emissions per unit of GR by 60%–65% by 2030. The low-carbon economy deals with ecological issues, energy threats and provides directions for economic development. Under these circumstances, China is shifting toward raising its REN and nuclear energy consumption, as these fuels contribute less to generate CO2 radiations than conventional energy (Zhao et al., 2017). The generation capacity of nuclear power in China is approximately 40 million kWh and 45.66 million KW is installed; it will reach 18.1% in 2050 (Xiao-ding et al., 2021). At the same time, REN use in China adheres amplified from 5 Mtoe in 1965 to 349.2 Mtoe in 2016, an increment of approximately 70 times (Figure 2) (NDRC, 2016).
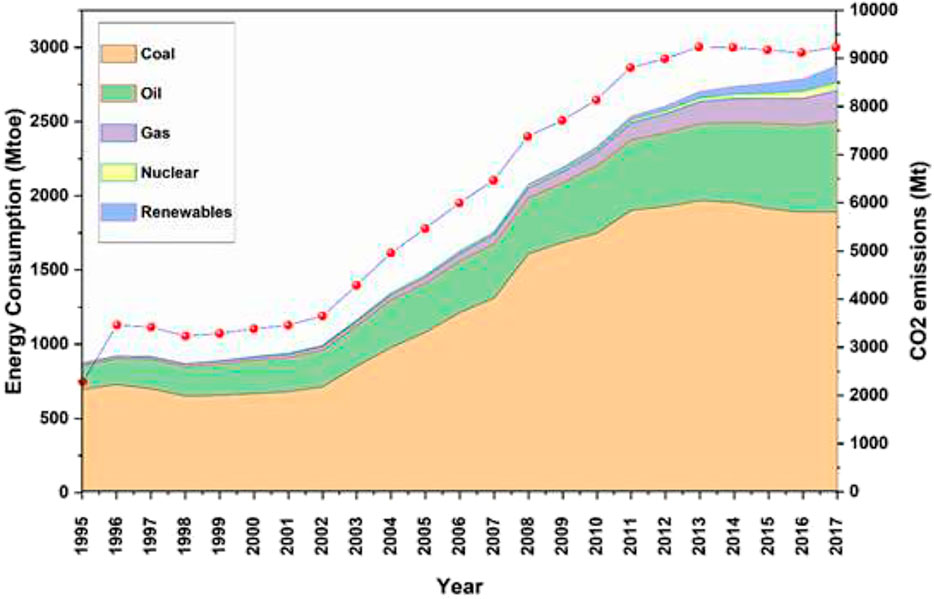
FIGURE 2. Energy use (Mtoe) and CO2 emanation (BP statistical review and World Development Indicators).
The use of REN sources has appeared as a significant candidate in a universal EC mix that has the capacity to emit a smaller amount or no carbon and thus can be supportive of declining GHG emissions. With the development of RE in considerations of a sustainable energy prospect, it is necessary to recognize the active task of clean energy together with effective fossil fuel EC in carbon decrement and climate change alleviation policies. Global primary energy raised up to 2.9% in 2018—the agile progression since 2010. Simultaneously, previous year’s energy-linked CO2 discharges increase by 1.7% to a historic extreme of 33 Gigatonnes (Zhai et al., 2020). Regardless of the evolution of 7% in REN electricity production, emanations from the power segment grew to record levels. This surge was generally caused by China, the US, and India, which collectively caused two-thirds of this intensification. The increase in EC was also revealed through all the fuels, the majority of which rose more intensely than their past averages. This escalation was specifically evident in natural gas demand, which enlarged 5.3%, one of its highest surge proportions for 30 years, regarded as approximately 45% of the total hike in worldwide EC. Coal demand (1.4%) also enhanced for second successive year, subsequent 3 years of decays. Expansion in REN (14.5%) alleviated a little as previous trends even though it persisted as a rapidly emerging global energy source. The shifts in FFs consumption also influenced the fuel mix. The coal and oil demand manifested a growing trend in 2018. This surge was mainly dominated in Asia, mainly in China and India (Wolde-Rufael and Idowu, 2017).
It has been generally recognized that REN is a typical source for generating energy. The anticipated segment of REN in worldwide energy production was beyond 26% by the conclusion of 2018. Net capability extensions for REN were greater than FEC and nuclear together for fourth succeeding years, REN currently resolves more than one-third of universal established power capability (Smith, 2017; Gielen et al., 2019). In China, power generation from REN sources extended 1870 TWh in 2018, an escalation of 170 TWh and accounting for 26.7% of the nation’s aggregate. Hydro backed 1200 TWh (3.2%), wind power—466 TWh (up 20%), PV power—177.5 TWh (up 50%), and biomass account—90.6 TWh (up 14%) (Kohl, 2019). Figure 3 indicates the difference in aggregate generation of FEC and non-FEC in China (88.2%, 11.8%), United States (86%, 14%), and global (85.9%, 14.1%) is not noteworthy.
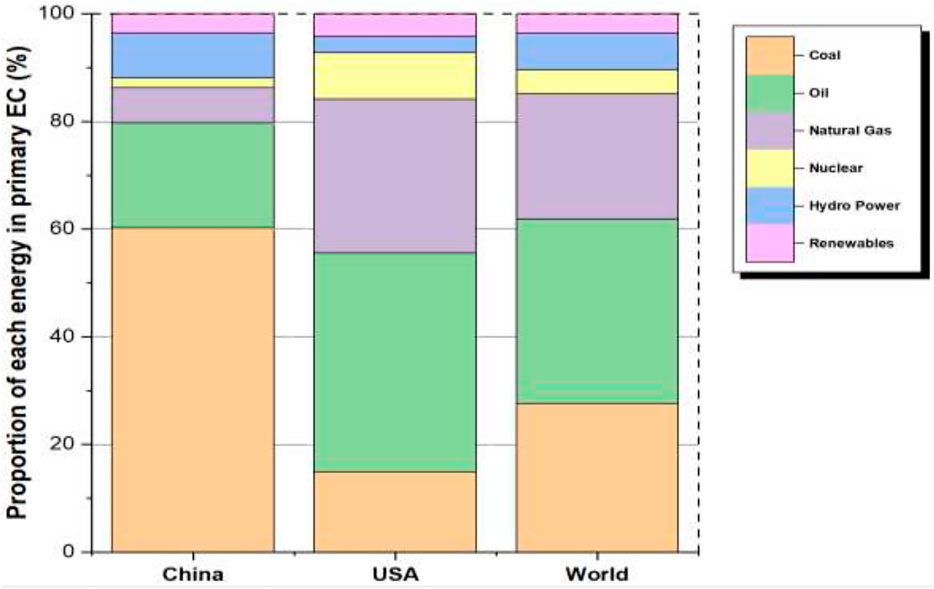
FIGURE 3. Evaluation of primary EC between the world and China in 2017.
In this context, clean and alternative energy sources and innovations are deemed indispensable to reduce reliance on fossil fuels because it will help achieve environmental sustainability globally and aid in achieving sustainable development goals.
Literature Review
This section reviews the relationship between the source of GHG emissions and its recommended relation with the alleviation policies. It is composed of the connection between CO2 with disaggregated energy sources, technological innovation, political-institutional quality, GR and FD in China for a period of 1995–2017. FEC is produced by natural practices, e.g., anaerobic decay of buried deceased organisms. They are hydrocarbons and comprise oil, coal, and natural gas. They are conventional energy resources as they require millions of years to develop, and their supplies are becoming exhausted more rapidly than new ones are being revealed.
Human undertakings, e.g., combustion of FEC, chopping tropical forestry, and submitting more of the additional GHGs into the environment, humans are developing a heat blanket vulnerable to triggering universal warming (Mensah et al., 2019). The Kaya identity states that a state with a large populace or with great per capita GR of energy, or with great energy intensity (energy/GR), particularly FEC, or with high carbon intensity (CO2/energy), will ought to greater CO2 emanations (Bekun et al., 2019). The relationship between GR and pollutant takes the form of an inverted-U or a monotonically decreasing shape (Liu, 2016).
Multiple econometric techniques have been used to analyze the correlation, including the EKC postulate and some studies hold up for this hypothesis (Saboori et al., 2012; Baek, 2015). Various researchers have mostly studied the causality link between GR and environmental quality. Grossman et al. (Apergis and Ozturk, 2015) explored the relationship between environmental indices and GR per capita. CO2 discharges are commonly established as a quadratic, linear, or cubic polynomial function of GR under the EKC curve (Shahbaz et al., 2015a; Al-Mulali et al., 2016; Marsiglio et al., 2016).
FD plays an important role in restraining risks and reservations of underprivileged masses and provides the opportunity for people to utilize economic, health, and learning facilities. FD may consider an increase in the distribution of FDI; developed investment market; banking actions; amended plans and local financial arrangement, which may enhance EG and impact demand for energy (Shoaib et al., 2020; Z. Xu et al., 2018). In this case, FD may be helpful to decrease CO2 radiations. One of the major resolutions to decline GHG discharges is to finance clean energy ventures. As a consequence, stimulating the clean energy of REN technology involves smoothly operating fiscal markets that offer accessible debit and equity funding. Credit markets and stock extensions in conjunction with FDI are classified as the utmost important opportunities for sponsoring clean energy schemes (Zhang and Zhou, 2016). Expansion of credit markets and stock may lead to the promotion of a high level of investment in clean energy. This may consecutively award investors more accessibility to opportunities of capital, equity, and credit funding. On the contrary, one of the prevalent encounters in implementing clean energy is the requirement of huge investment amounts.
REN provides multiple prospects for additional development that may expedite the transformation to universal sustainable ES by the midst of the century. REN furthermore performs a prominent part in the emanation mitigation objective by 50% by 2050 worldwide. For instance, Lin and Moubarak (2014) found bidirectional causation between REN use and GR, which support feedback postulate. Dogan and Öztürk (2017) determined unidirectional causation directing from GR to REN usage in the short run and bidirectional causation, which is in line with feedback theory. The outcomes of studies (Jaforullah and King, 2015; Bilgili et al., 2016) conclude that expanding REN might substantially decrease GHG emissions.
Taking into account the central role that REN performs, it not only fulfills the energy demands of various states but also alleviates discharges. Regardless of all of this, confined research has been carried out to explore the correlation between REN consumption and GHG emissions. Some researchers (Jin and Kim, 2018) concluded that GHG discharges per capita and GR had a favorable influence on REN use in 30 states during 1990–2014. On the other hand, Apergis et al. (2010) and Apergis and Payne (2010a) found that the usage of REN does not aid in the reduction of emissions. This could be owing to a lack of storage capacity to address periodic supply concerns, the inadequate share of REN in overall EC and the energy supplier is mostly reliant on fossil fuels to meet the peak load demand. Azam et al. (2021f) examined the bidirectional causality between these variables for a period of 1990–2017. In addition, Azam et al. (2021a) found REN contributes to eliminating the CO2 emissions in Newly Industrialized Countries. Some other researchers (Riti et al., 2018; Rahman and Velayutham, 2020; Vural, 2020) found that the use of REN aids in the improvement of environmental quality.
In recent years, the relationship between NU consumption, CO2 emissions, and GR has been studied by many researchers using various approaches, but no significant conclusion has been found on this link. In particular, Lee et al. (2017) concluded that nuclear power decreases CO2 emissions in panel countries. Similarly, Ozcan and Ulucak (2021) and Saidi and Omri (2020) also explored almost similar outcomes for India. On the other hand, Ozcan and Ari (2017) explored bidirectional causatives among NU use and GR in the short run and long run. Other researchers [86–88] found that there is a neutrality hypothesis between NU consumption and GR. In terms of the relationship between NU consumption and CO2 emissions, a large number of studies suggest that manufacturing NU might significantly reduce GHG emissions (Baek, 2016; Hassan et al., 2020). Nevertheless, another study (Jin and Kim, 2018; Portugal-Pereira et al., 2018) found an absence of any link between NU consumption and CO2 releases.
Numerous investigations have concentrated on the disintegration of CO2 emissions determinants, which explored the drivers influencing emissions at the country (Karakosta et al., 2013; Brook et al., 2014; Lehtveer and Hedenus, 2015) industry and territorial levels. Some studies (Ma et al., 2014; Dellano-Paz et al., 2015) confirm that nuclear energy might be helpful in carbon emission diminution. Lee et al. (2017) inspect NU association with CO2 emissions and find that NU energy contributes to alleviating CO2 emissions. Similar findings were discovered by other studies as well (Baek and Pride, 2014; Lau et al., 2019). Y. Xu et al. (2018) identified that NU generates less CO2 radiations than coal power.
Dissimilar research techniques, scopes, distinct GR patterns, different environmental strategies, and time frame may cause distinct outcomes. Most of the countries investigated have enormous monetary capitals; skillful labor, innovative technology, and a substantial NU portion in the aggregate energy mixture. Consequently, the results of the investigations are insufficient for emerging states. An additional inadequacy in the literature is that most of the studies used panel data with a minor understanding of country-specific features.
Furthermore, very few studies on technology innovation and political-institutional quality have been conducted. For instance, Salman et al. (2019) investigate the institutional quality impact on growth-emissions nexus in the case of three Asian studies from 1990 to 2016. The results suggest that institutions are very significant in enhancing growth and emission mitigation. Uzar (2020) explore the link between renewable energy and institutional quality in the panel study from 1990 to 2015. The findings support that institutional quality encourages renewable energy in these selected countries. From 1990 to 2014, researchers looked at the impact of innovation on CO2 emissions in OECD countries (Mensah et al., 2018). The study argued that innovation mitigates the CO2 emission, but its effect varies over the countries.
Table 1 indicates the summary of findings from the existing literature considering the role of clean energy, technological innovation, and political-institutional quality as the determinants of CO2 emanations. This literature indicates that there is no empirical study in the context of the world’s leading CO2 emitting country, like China, with new dimensions of technological innovation and political-institutional quality.
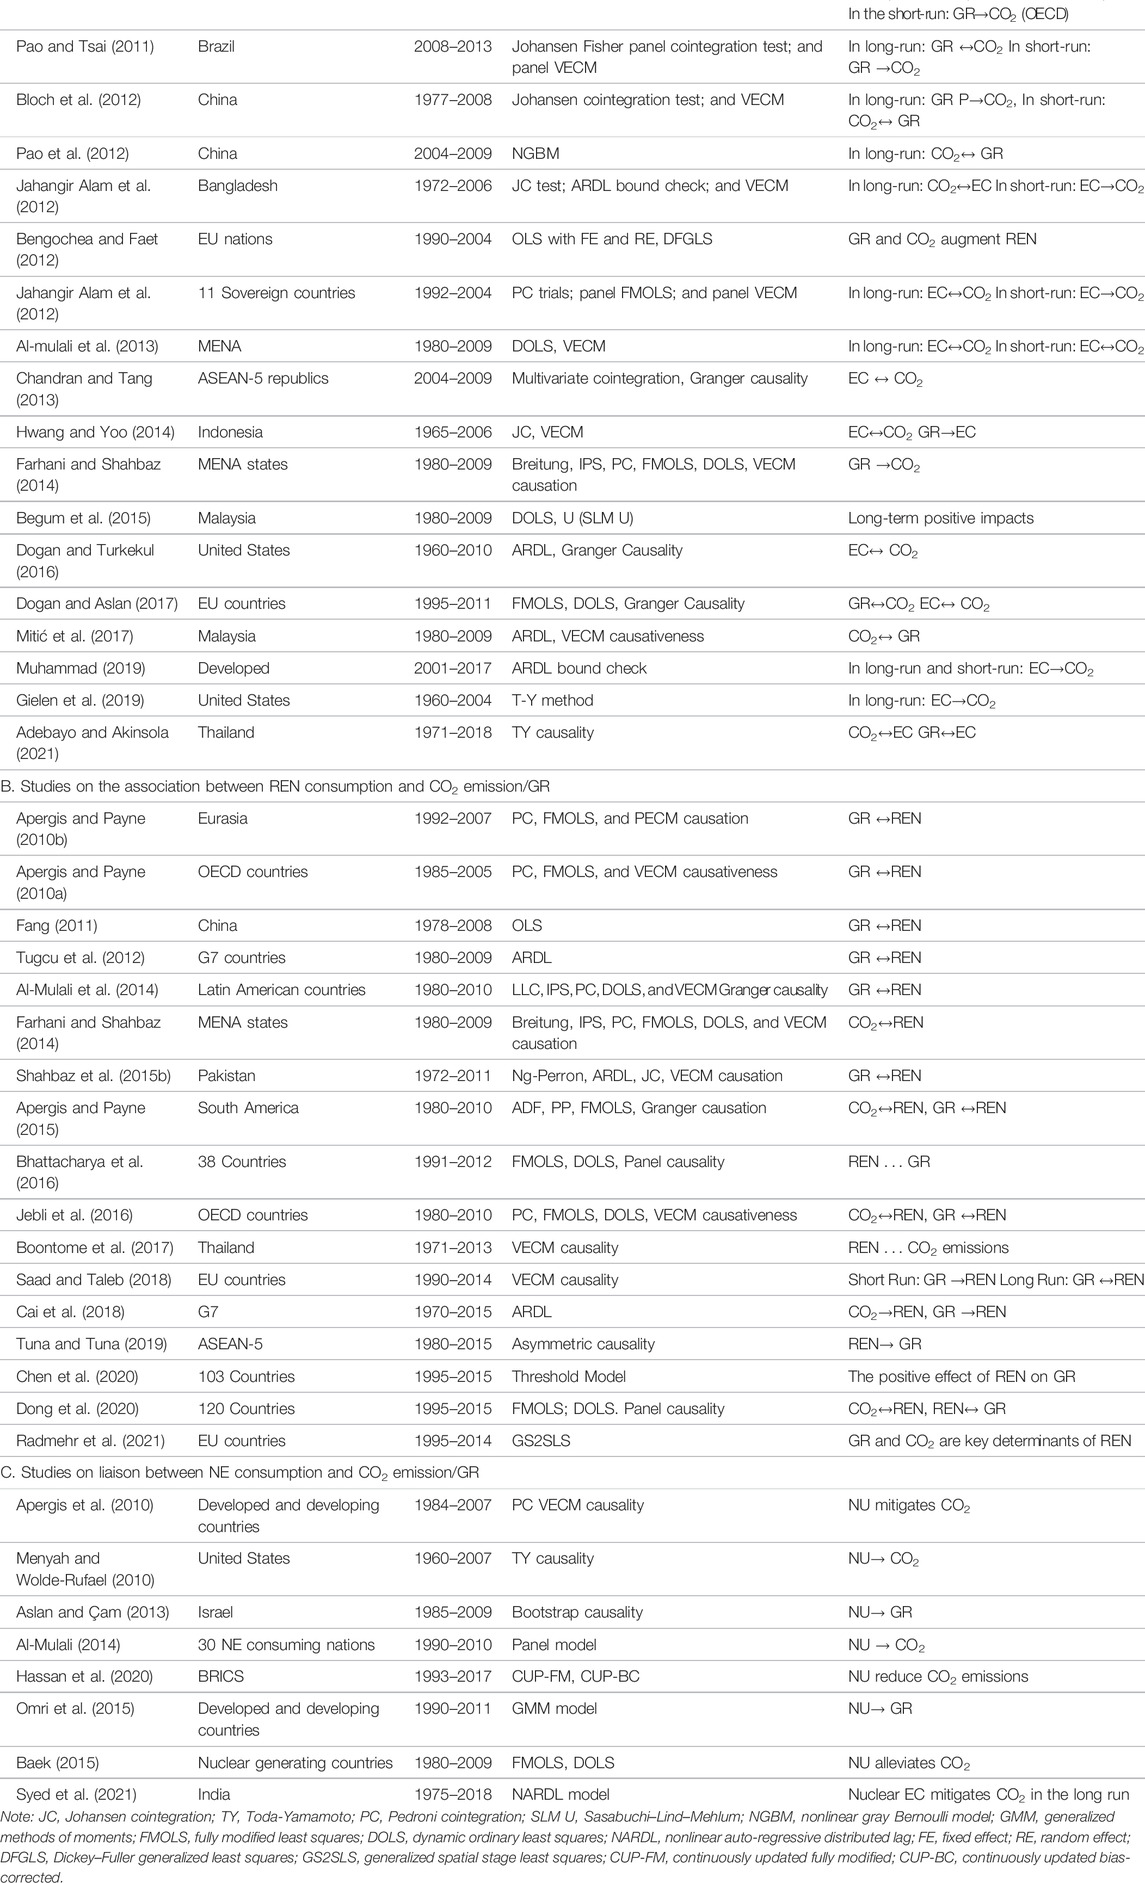
TABLE 1. Description of research of different investigators in research.
Data and Methodology
Data Depiction
Annual data covered the period 1995–2018 for China, the global prevalent CO2 radiator used in this study. The variables consist of environmental indicator CO2 emissions, renewable energy, nonrenewable energy, GR, financial development, nuclear energy consumption, political intuitional quality, and technology innovations. The framework for multivariate analysis includes CO2 taken as the dependent variable and GDP is the independent variable. Moreover, our research uses additional explanatory variables REN, FEC, NU, FD, political-institutional quality, and technology innovation to evade the omitted variable bias. CO2 emissions, renewable energy, nonrenewable energy, nuclear energy, GR, TI, and FD data are acquired from the World Bank Development source (Bank, 2017). The political, institutional quality data drawn from World Governance Indicators (WGI) datasets include the methodology of Kaufmann et al. (2010).
Table 2 shows all the information about the data series under consideration. Prior to estimating the econometric analysis, understanding the features of the data series is essential. This study explained a detailed statistical analysis of all variables as shown in Table 3. Based on the statistical results, the average of the Co2 emissions, 5.154750; renewable energy, 18.97958; fossil fuel energy, 1304.096; financial development, 120.8928; GR, 6487.062; nuclear energy, 15.83917; institutional quality, 9.927569; technology innovation, 359875.3, respectively. CO2 emissions are less volatile than economic growth, and nuclear energy is less volatile than renewable energy and FEC. The political-institutional quality among all the core indicators is less volatile.
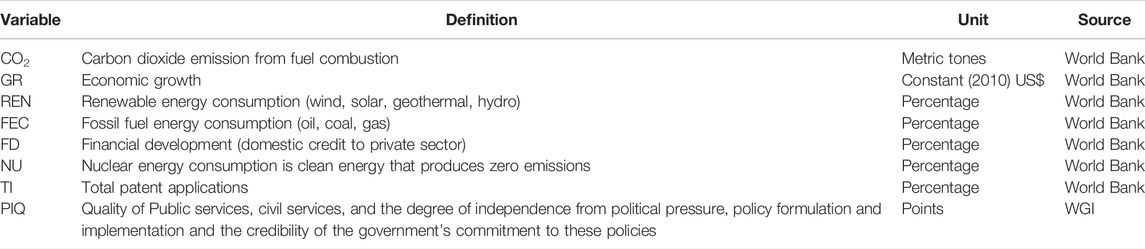
TABLE 2. Variables and data source.
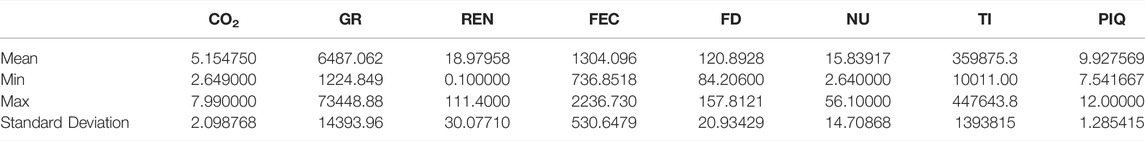
TABLE 3. Descriptive statistics.
Correlation analysis represents the strength of the association of understudied variables. According to correlation analysis (Table 4), we found that some variables have a positive relationship, and some have adverse relationships. For example, for the CO2 emissions, all variables have a positive relationship except political, institutional quality; conventional energy and technology innovation are highly correlated with CO2 emissions. while coefficients of other explanatory variables are not as high.
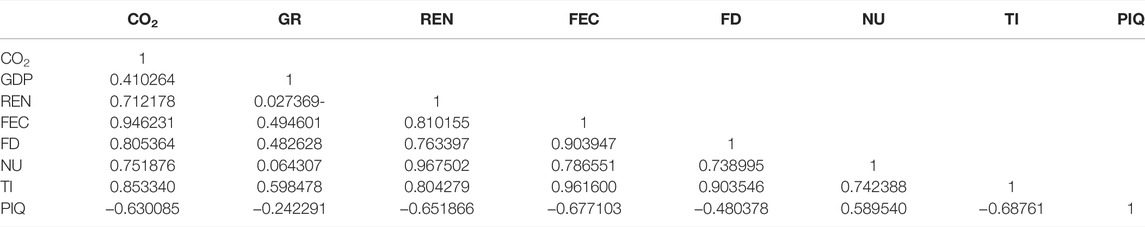
TABLE 4. Correlation analysis.
Model Specifications
To achieve the objective of the present study and following different other studies, for instance Yildirim et al. (2012), Pao and Fu (2013), and Omri et al. (2015), the effect of explanatory variables on CO2 emissions is investigated using an econometric model. The following functional form and econometric model are considered:
Eq. 1 is rewritten by adding the following error term:
Eq. 2 can be converted into a log form as seen below:
Here, in Eq. 3 LnCO2t specifies the log of carbon dioxide emission at time period t, LNRENt represents the log of renewable energy consumption, LnFECt denotes the log of fossil fuel energy consumption, LnFDt is the log of financial development, LnGRt is the log of economic growth, NUt is nuclear energy consumption, LnPIQ is the log of political, institutional quality, TI is the log of technology innovation, and
Testing the Stationary of the Variables
We employ the stationarity of the time-series data that is vital for avoiding the spurious regression analysis. The unit root test determines if the underlying data-producing process of a series is stationary or nonstationary. To confirm the stationarity of the variables at the level and first difference, we use two unit root tests, namely, Dickey and Fuller (1979) and Phillips and Perron (1988). These methods are most often used to verify whether a unit root test occurs or not. The null hypothesis of these two methods is the unit root’s presence, whereas in the alternative hypothesis the unit root does not exist. The estimation of the ADF and PP model can be expressed in Eqs 4, 5, respectively:
Here,
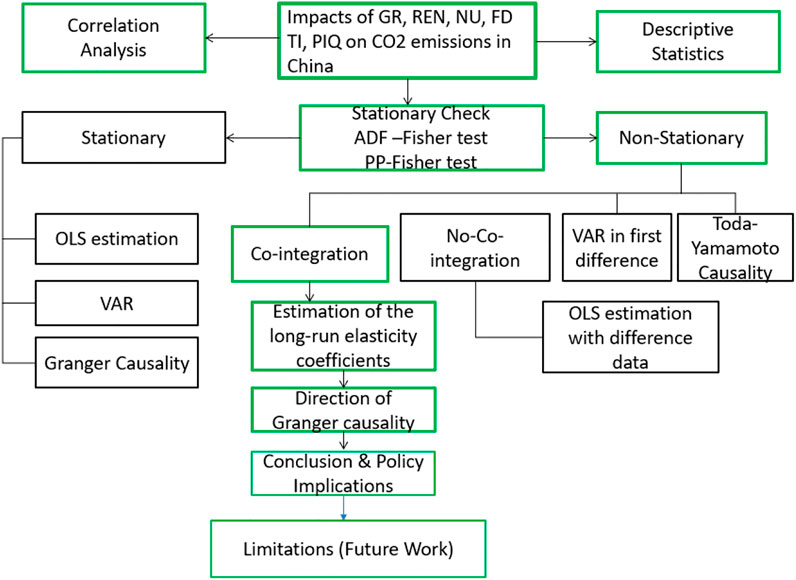
FIGURE 4. Theoretical framework of empirical strategy.
Johansen Cointegration Test
The cointegration test is very crucial because it permits the researcher to scrutinize the link between the studied variables. This method is employed to determine whether or not a connection exists between series in time series data. This method shows that there is an equilibrium long-run connexion between series and variables. Moreover, according to reference (Fan and Hao, 2020), when employing the ordinary least-squares (OLS) method for coefficients estimation, this test may serve as a guarantee of reliable results. In the economics literature, there are several tests for testing cointegration.
Therefore, this study uses Johansen’s cointegration test because it requires estimating an autoregressive vector model, known as VAR, that includes values at the level and first difference of nonstationary of the series (Khan et al., 2018). A VAR test is designed at this point to conclude the optimal lag length; the Schwarz Information Criterion (SIC) is applied to optimal the lag lengths for time-series datasets. This model’s equation is as follows:
where
Long-Run Estimates
To obtain the effects of independent variables on the target variable, we apply the partial least-squares model and fully modified ordinary least squares. The partial least-squares model, also known as ordinary least squares (OLS), is the simplest method. This model assumes that there is no difference in the values of intercepts and slopes in the estimated regression results. In short, all coefficients are homogenous, both time and individuals. This method is a traditional estimations model and is most widely used in most applications due to its ability to produce the best linear unbiased estimators (BLUEs).
This study also prefers the fully modified ordinary least-squares (FMOLS) technique because it checks estimates’ robustness and retains more fussy results for a smaller sample size. This test eliminates the serial correlation issue and the spurious regression depicted by OLS (Bashier and Siam, 2014; Mensah et al., 2018). In addition, this study used the robust least-squares (RLS) method because it substantially enhances power and provides more accurate results. According to Wilcox and Keselman (2003) and Pitselis (2013), the RLS M-estimation technique required additional benefits over the other least-squares models.
Testing for Wald’s Granger Causality
The Granger causality method is primarily employed to determine whether or not two different variables have mutual links: one-way causality, bidirectional causality, or no causality. The Toda and Yamamoto (1995) method based on the asymptotic theory used in this study to check the causality presence between the variables can be used without prior knowledge of cointegration. However, the existence of cointegration is not required in such a case. It can be used if economic time series are either I (0) or I (1); integrated of different orders, but not more than two, cointegrated or not, or in both cases. We evaluate the vector autoregressive model (VAR), which examines the hypothesis, calculates with K degrees of freedom, and ensures Wald’s test asymptotic X2 distribution.
However, the first step in this method is to determine the order of the time series integration and assign their maximum orders in the VAR model to determine the additional lags. In this context, we use the ADF and PP unit root test findings to verify the utmost order of integration of the series. This model, in particular, consists of two steps: 1) to determine the variables’ maximum integration order(d) as well as lags length ideal (k), 2) to investigate the Granger causality Wald test findings of the VAR(k) causality test (Toda and Yamamoto, 1995). The method is used for bivariate association (Y, X). This model can be stated as in Eqs 6, 7:
where Y and X are the variables, and
Empirical Outcomes
To check the order of integration of the variables, the unit root test was utilized. In short, it refers to the stationary of the time series. The findings designed from the ADF and PP unit root trial at the level and first difference are represented in Table 5. The result shows that all the variables are not stationary at levels which means the null hypothesis of unit root cannot be rejected. While subsequently taking the first difference, all variables discard the null hypothesis at 1%, 5%, and 10% significance level which means that all the series are significant at the first difference. This suggests that series are integrated of order one (I (1) which amuse data are prerequisites for cointegration model to study the occurrence of long-run equilibrium liaison.
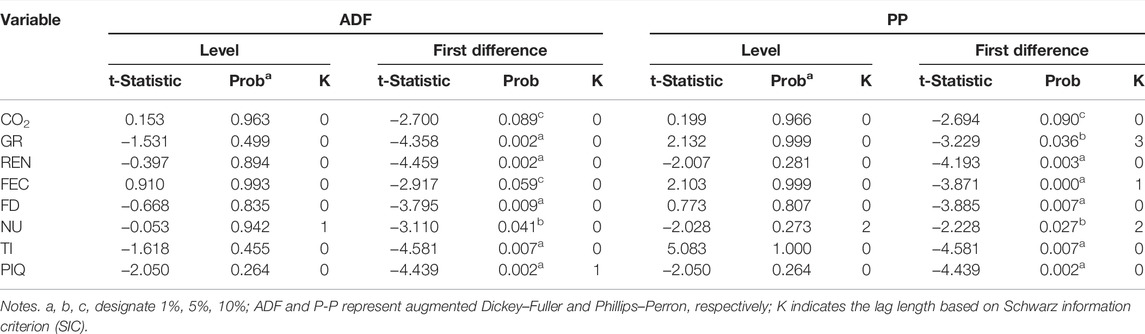
TABLE 5. Unit root test outcomes.
Given that the series has a unit root test, then the next step is to investigate the cointegration method to determine long-run equilibrium connexion between the variables. But before cointegration and causality test, the lag length determination is necessary. The appropriate lag length is 1 based on Schwarz information criterion (SIC). The Johansen cointegration method is used after determining the lag length. The findings of Johnsen’s cointegration check with trace trial and Max-Eigen test statistics are given in Table 6. The result designates that the rejection of the null hypothesis is none for both tests, 1, 2, 3, 4, 5, 6, and 7 cointegration equation does not reject the null. In conclusion, the results manifest that there exists a long-run equilibrium liaison between the studied variables.
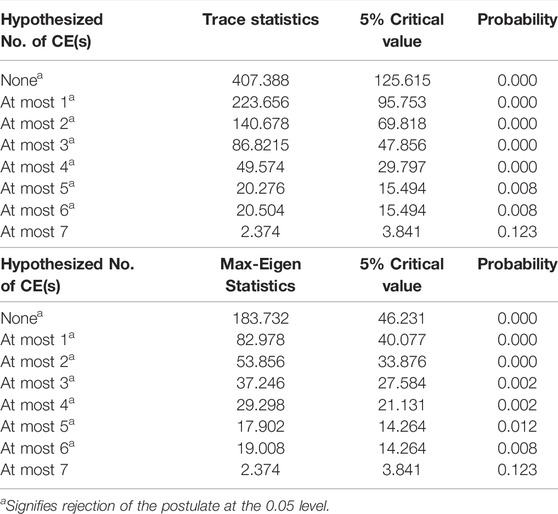
TABLE 6. Cointegration results.
Since the variables have a long-run cointegration relationship, this allowed determining the long-term coefficients between the series by using regression analysis. Thus Eq. 1 was estimated to perform the regression model. First, the results of OLS regression analysis are presented in Table. 7. The results show that fossil fuel energy consumption and nuclear energy are positive and significant in CO2 emissions. The remaining series are insignificant. The OLS method is not powerful; however, the study uses the FMOLS latest method to check the long-run estimation.
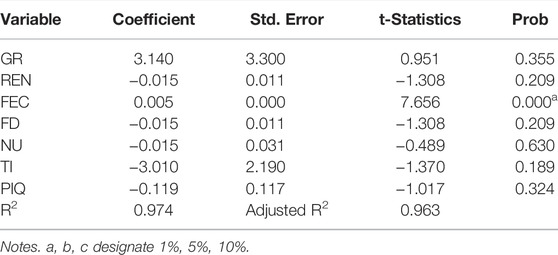
TABLE 7. Results of ordinary least square (CO2).
The FMOLS is a competent technique to eliminate serial connexion and endogeneity complications. The results of the FMOLS estimated method are represented in Table 8. The FMOLS results specify that the parameters are statistically noteworthy at 1% and 5% significance levels except for FD and political, an institutional quality that is statistically irrelevant. The coefficient of FFs energy and GDP is positive by 0.659 and 0.203, respectively. This suggests that a 1% surge in fuel energy could prompt an increase in Co2 emission by 0.659%, and a 1% increase in GDP would result in a 0.203% growth in CO2 emission. Moreover, the negative coefficients of REN, FD, PIQ, and TI are −0.065, −0.203, −0.118 and −3.320 which confirms that these variables would benefit carbon emission reductions in China; a 1% increase in REN and financial development would lead to lower CO2 emission by −0.065% and 0.203%. In addition, the negative coefficient of PIQ and TI approves that a 1% escalation in PIQ would reduce CO2 emission at −0.118% and a 1% increase in TI mitigates the emission, −3.320% improves the environmental performance in China. Furthermore, the adj. R2 is 0.98, which shows that all independent series explain 98% variation in the target variable CO2 emissions.
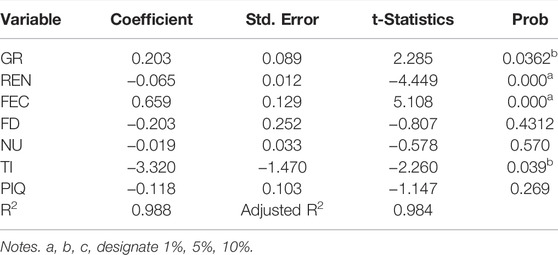
TABLE 8. Results of fully modified ordinary least square (FMOLS) (CO2).
In addition, for robustness checks, the study uses the RLS (M-estimation) method because this estimation model is more robust than FMOLS. The outcomes of this regression analysis are presented in Table 9. The results show that all variables are statistically significant with expected signs. The variables PIQ and TI are also found statistically significant at 1% and 10% significance levels, respectively, on the response variable. So, this model confirms that renewable energy, financial development, institutional quality, and technology innovation adversely affect CO2 emissions in China, while FEC, GDP, and nuclear energy consumption positively affect CO2 emissions.
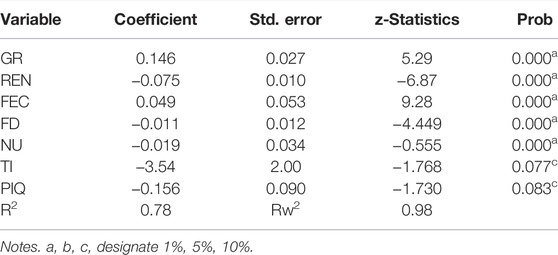
TABLE 9. Results of robust least square (RLS) (CO2).
Our results are in line with Ref. (Li and Su, 2017; Mensah et al., 2018; Shi et al., 2019; Hasnisah et al., 2019) regarding the negative influence of REN, NU, and other factors on CO2 emission. We concluded that NU and REN consumption is imperative to reduce greenhouse gas (GHGs) and improve China’s environmental performance. A motivating outcome from our conclusions is that the coefficients of FF and GDP are positive and numerically substantial. The positive coefficient of GDP and FF is in accordance with Alam et al. (2016) and Zhang et al. (2019).
Furthermore, we apply the Toda-Yamamoto model to determine the causality directions between the understudied variables. The results are reported in Table 10. The findings indicate that a unidirectional causality is flowing from financial development, GDP, nuclear energy, and political-institutional quality to CO2 emissions. The feedback hypothesis is confirmed between technology innovation, CO2 emissions; GDP, enewable energy, nuclear energy and renewable energy. We also find bidirectional causality between FEC and CO2 emissions and renewable energy to CO2 emissions. Thus, unidirectional causality is running from financial development and technology innovation to renewable energy. Furthermore, bidirectional causality is found between nuclear energy and GDP supports the feedback hypothesis in China. In short, there is long-run causality between nuclear energy and carbon emission, but we found no causality with regard to renewable energy consumption and CO2 emission. The results of the long-run and Granger causality movements are displayed.
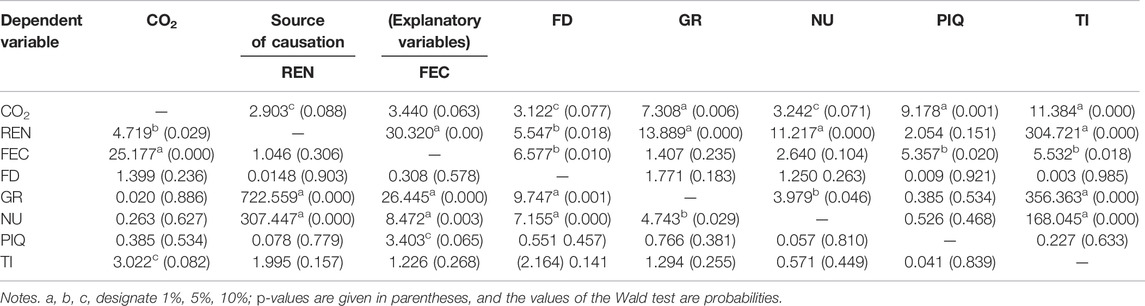
TABLE 10. Results of the Toda-Yamamoto test.
Discussion of the Results
The outcomes show that traditional energy and GR are the main contributors to CO2 emissions in China. An increase in FEC will increase environmental pollution as CO2 emissions cause it. China was having 489 million tonnes of emissions in 1965 and 9123 million tonnes in 2016, which is accounting for 27.23% of global emissions (British Petroleum, 2018). Conventional energy increases the level of economic growth, but, on the other hand, it also enhances the country’s environmental footprint. China’s energy portfolio, FEC, takes center stage with coal and lignite dominating. However, reducing fossil fuels in energy production should be a top priority for high-emitter countries, e.g., China as shown in Figure 5.
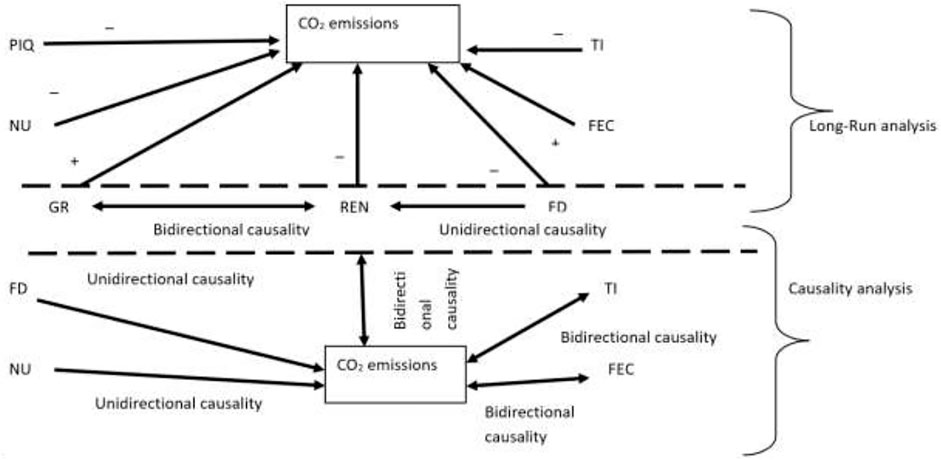
FIGURE 5. Summary of the results.
China is a wealthy country with enormous potential for financial development; thus, it needs more investment in clean energy sources for a sustainable environment. Thus, renewable energy is an alternative solution to combat the environment, for finite and scarce fossil fuel energy. In addition, it also ensures environmental performance but also leads to energy-dependent unrestraint. As REN is limited in scope and cannot be traded globally compared with FEC, alternative energy sources lessen the reliance on imported FEC; consequently, energy security and economic productivity increased. Yahya and Rafiq (2019b) revealed that REN has a strong link with sustainable economic development, as it is a prominent solution for climate change, global warming, energy security and provides several benefits such as creating employment opportunities, reducing poverty and health impacts, and social and economic development. Furthermore, compared with FEC, renewable energy is more environmentally friendly, with lower CO2 emissions (Wang et al., 2021). However, the utilization of renewable energy is an indispensable source, particularly in carbon-intensive countries such as China.
Moreover, financial development may, in general, increase R&D activities and, as a result, improve economic activity, influencing environmental quality (Altıntaş and Kassouri, 2020; Bilgili et al., 2021; Kassouri et al., 2021). Clean energies such as renewable and nuclear energies are long-term endeavors that necessitate funding. Strong financial development structures and institutions are beneficial for CO2 emission reduction and economic growth development. According to our econometric investigation, there is an inverse liaison between financial development and CO2 emissions in the long run. This finding is not consistent with one study finding that financial development increases CO2 emissions in the long term for 1982–2017 using the VECM model (Jian et al., 2019).
Another indispensable clean energy source is nuclear power in CO2 emission reduction. The apparently adverse effect represents that nuclear energy mitigates CO2 emissions. Therefore, nuclear energy is significant in China due to its huge potential in energy generation and well developed in resources. In short, the findings imply that the estimation of the coefficients of renewable energy is much stronger than nuclear energy at the 1% significance level. This may arise because nuclear power’s share is quite stumpy, which consequently lacks support in China’s total energy supply, which failed to have a beneficial effect on environmental quality.
Accordingly, to ensure nuclear power’s share in the whole usage of energy, the Chinese government should enhance the utilization of nuclear energy in the long term. However, based on the state of nuclear power plants (NPP) and nuclear power technology R&D, several technical obstacles in China such as low energy efficiency, late start, a small fraction, unstable county’s progress, discrete resource capacity of the nuclear power industry, the out-of-date technology standard system, the nuclear legislative mode for the nuclear power industry, and a lack of infrastructure development make slower development of nuclear power (Zeng et al., 2016).
The effect of technology innovation on CO2 emission is negative, revealing that innovation is the main indicator of CO2 emission reductions. The technology innovations could enhance energy efficiency and consume clean energy at a lower cost. Furthermore, innovations play a significant role in terms of controlling pollutant emission effectively. Thus, the Chinese government should increase investment in R&D sectors for better opportunities and the latest technologies intended to reduce CO2 emissions from fossil fuel energy consumption.
Strong institutions significantly affect CO2 emissions because good political leadership with the aptitude to plan and manage policies and investments in climate-smart development are critical components of low-carbon and climate-resilient societies. The establishment of stable institutions has a vital effect on the social, governance, and economic preparedness to diminish the effects of the atmosphere and ensure energy security by increasing the confidence in the use of clean energy. In developing countries, institutions are focal points for ensuring an adequate environment, sustaining and improving energy consumption (Azam et al., 2021). However, political, institutional quality ensures long-term benefits for the country by strategic action plans considering environmental concerns.
Moreover, there is bidirectional causality between FEC, renewable energy, technology innovation, and CO2 emanation. Based on these findings, we conclude that the Chinese government should expand clean energy development and increase investment in the clean energy sector. As a result, policymakers are advised to develop policies that increase renewable energy and nuclear energy share in the energy consumption portfolio to improve environmental quality and energy security.
Furthermore, they should develop public policies to encourage the establishment of official public banks with low-interest rates to finance clean energy projects, as well as policies to encourage private financial institutions to provide special loan discounts to firms interested in investing in sustainable energy technologies or purchasing technologies that augment the efficiency of renewable energy and nuclear energy. The former policies must be implemented to reduce fossil fuel energy consumption reliance to ensure environmental sustainability and green development.
Conclusion and Policy Implications
The importance of clean energy is highly strategic for environmental performance and sustainable economic development. Although most research on renewable energy focuses on socioeconomic and environmental variables, political and institutional factors and technological innovations are often overlooked. However, to fill this gap, our study mainly investigated the role of clean energy (renewable and nuclear) in the presence of technological innovation and political-institutional quality in the environmental degradation mitigations in the world-leading CO2 transmitter in China from 1995 to 2018. More importantly, this paper also compares the impacts of renewable energy and nuclear energy on CO2 emissions. Methodologically, the unit root test is used to determine the integration of the variables. Johnsen’s cointegration test and FMOLS method are employed to analyze the long-run elasticity between CO2 emissions and its influencing factors. Finally, the Toda-Yamamoto technique is used to find the direction of causality between the studied variables.
The results of the study indicate that variables are not stationary and integrated in the same order (I (1). Johnsen’s cointegration test reveals long-run equilibrium connexion between CO2 and renewable energy, financial development, nuclear energy, technology innovation, GR, and political-institutional quality. The regression FMOLS test’s consequences show that a raise in REN, TI, PIQ, FD, and NU leads to environmental quality, while a boost in FEC leads to environmental degradation. Moreover, the existence of causality is found between variables by employing a granger causation check. The outcome of the analysis indicates the contribution of renewable energy, nuclear energy and technology innovation, and institutional quality in curbing carbon emissions.
Some specific policy implications can be drawn on the preceding empirical test results and pertinent conclusions for the deployment of clean energy and environmental quality. China’s economy is growing fast, but this growing economy depends on a lot of conventional energy consumption. An increase in energy is required to meet more demands for economic activities, but this incensement will increase CO2 emissions if the current energy mix remains unchanged in China. Therefore, China should examine the country’s energy mix at a granular level to achieve the desired growth rate and preserve environmental performance. To ensure the country’s long-term development and environmental goals, policies toward replacing traditional energy with clean energy such as renewable energy consumption and nuclear energy are necessary. Thus, this must lead to augmentation in share of renewable and nuclear energy in whole energy configuration for managing CO2 emissions in China. Although the effect of renewable and nuclear power is negative and significant it contributes to eliminate China’s CO2 emissions in the long run. As a result, the Chinese government should retain a clear understanding of this challenge and adopt various effective long-, medium-, and short-term energy policies to better control CO2 emissions by regulating the share of renewable and nuclear power in total energy consumption. Nuclear energy offers enormous development potential not only in China, but also in other emerging countries. Thus, raising the share of nuclear energy in developing nations is a possible way to meet the CO2 emission reduction target. In addition, according to a comparison of CO2 emission mitigation effects between renewable energy use and nuclear power confirm that, increasing the amount of clean energy in the primary energy mix can manage China’s CO2 emissions. Furthermore, renewable energy has a significantly greater long-term potential for reducing CO2 emissions than nuclear energy use. As a result, the Chinese government should also raise renewable energy consumption in the long term. Nevertheless, various technical obstacles, such as low energy efficiency and a lack of infrastructure, make rapid renewable energy development challenging. However, the Chinese government should not only maintain renewable energy subsidies, but also increase investments in renewable energy infrastructure development that will benefit energy efficiency because investment in renewable energy must be supported by incentives such as tax breaks and credit lines. Subsidies and tax credits for renewable energy generation and use, as well as the implementation of renewable energy portfolio principles, are all potential policy measures. Furthermore, increasing the usage of renewable energy would reduce the use of fossil fuels and, as a result, reduce carbon emissions.
The key to promoting long-term sustainable environment is innovation. An increase in technological innovation and financial development will help to espouse and use new environmental-friendly technologies; however, the investment in R&D programs improves the environmental quality. So, there should be R&D programs at government and private levels to mitigate pollution through innovations. Consequently, an increase in innovations could consume clean energy sources at lower costs and enhance energy efficiency. However, Chinese governments should intensify the R&D-related strategies that are conducive for the sustainable environment. Furthermore, policies that encourage more research activity will not only help contain pollution directly by facilitating more innovation in production techniques that emit fewer pollutants, but also enable China to more effectively absorb technology developed elsewhere and thus catch up to the frontier’s green technology to the extent that research intensity and its interaction with distance to the frontier technology have a positive effect in reducing CO2 emissions. The modern R&D-based endogenous development can be used to better comprehend environmental contamination challenges, especially in emerging nations such as China.
Moreover, the political-institutional factor can also contribute to the betterment of the environment quality because strong institutions may lead to slower growth of CO2 emissions. Without any doubt strong institutions and political leadership with the ability to create and manage policies and investments that promote climate-smart development are fundamental components of low-carbon, climate-resilient societies. The social, governance, and economic readiness to ameliorate climate change and its effects are all influenced by the quality of political institutions. Thus, political institutions’ quality must enact strict social, governance, and economic reforms and policies before adaptation choices may be implemented.
The period of the COVID-19 outbreak has a positive influence on the renewable energy and nuclear energy sector because due to this, the industry is suffering issues such as Kurfuffle in the supply chain, tax stock market issues, delays in nuclear reactor construction, and not being able to get benefit from government incentives as well as a significant decrease in electricity demand. In addition, investors remain wobbly during the industry’s vagueness in the clean energy sectors. However, some suggestions are offered to overcome the mentioned issues:
• In the clean energy sector, the use of artificial intelligence (AI) is suggested for infrastructure and equipment management as well as for load forecasting and production forecasting.
• The government needs to make short-term policy goals to support the recovery effort and sustainable energy development in response to the pandemic.
• For the time of the epidemics, global cooperation must be established to hasten the management of the issues.
Though our study contributes discreetly to the literature to draw a preliminary conclusion about the restrained role of clean energy, technology innovation, and political institutions in carbon emission mitigation in China, it still has certain limitations that require further investigations. First, authors can make future studies for emerging countries for both time series and panel data to conclude more clear policy implications. Second, future studies can increase control variables such as other institutional and innovative factors interacting with clean energy to abate CO2 emissions. Finally, it would also be interesting to explore the effect of human capital and ICT factors to eliminate CO2 emanations. In addition, this study uses CO2 emissions as an indicator of environmental deterioration. Still, other polluting indicators such as the ecological footprint and other new econometric techniques would expand the research works.
Data Availability Statement
The original contributions presented in the study are included in the article/Supplementary Material; further inquiries can be directed to the corresponding author.
Author Contributions
AA: conceptualization, methodology, software, data curation, writing original draft, visualization, validation, and writing—reviewing and editing. MR: conceptualization, methodology, software, writing original draft, and writing—reviewing and editing. MS: conceptualization, methodology, and writing—reviewing and editing. JY: conceptualization, methodology, and supervision.
Conflict of Interest
The authors declare that the research was conducted in the absence of any commercial or financial relationships that could be construed as a potential conflict of interest.
Publisher’s Note
All claims expressed in this article are solely those of the authors and do not necessarily represent those of their affiliated organizations, or those of the publisher, the editors, and the reviewers. Any product that may be evaluated in this article, or claim that may be made by its manufacturer, is not guaranteed or endorsed by the publisher.
Abbreviations
ADF, augmented Dickey–Fuller unit root test; ASEAN, association of south east nations; BRICS, Brazil, Russia, India, China, and South Africa; BP, British petroleum; CO2, carbon dioxide; DOLS, dynamic ordinary least squares; EC, energy consumption; EKC, environmental kuznets curve; EU, European Union; ES, energy supply; FEC, fossil fuel energy consumption; FD, financial development; FMOLS, fully modified ordinary least squares; RLS, robust least squares; GR, economic growth; GHG, greenhouse gases; IPPC, Intergovernmental Panel on Climate Change; KP, Kyoto Protocol; NU, nuclear energy; OECD, Organization for Economic Cooperation and Development; PIGST, Portugal, Italy, Greece, Spain, and Turkey; REN, renewable energy; R&D, research and development; SDG, sustainable development goals; SSA, sub-Saharan African; UN, United Nations; WB, World Bank.
References
Adebayo, T. S., and Akinsola, G. D. (2021). Investigating the Causal Linkage Among Economic Growth, Energy Consumption and CO 2 Emissions in Thailand: An Application of the Wavelet Coherence Approach. Int. J. Renew. Energy Dev. 10, 17–26. doi:10.14710/ijred.2021.32233
Adebola Solarin, S., Al-Mulali, U., and Ozturk, I. (2017). Validating the Environmental Kuznets Curve Hypothesis in India and China: The Role of Hydroelectricity Consumption. Renew. Sust. Energ. Rev. 80, 1578–1587. doi:10.1016/j.rser.2017.07.028
Akhmat, G., and Zaman, K. (2013). Nuclear Energy Consumption, Commercial Energy Consumption and Economic Growth in South Asia: Bootstrap Panel Causality Test. Renew. Sust. Energ. Rev. 25, 552–559. doi:10.1016/j.rser.2013.05.019
Al-Mulali, U. (2014). Investigating the Impact of Nuclear Energy Consumption on GDP Growth and CO2 Emission: A Panel Data Analysis. Prog. Nucl. Energy 73, 172–178. doi:10.1016/j.pnucene.2014.02.002
Al-Mulali, U., Fereidouni, H. G., and Lee, J. Y. M. (2014). Electricity Consumption from Renewable and Non-renewable Sources and Economic Growth: Evidence from Latin American Countries. Renew. Sustain. Energy Rev. 30, 290–298. doi:10.1016/j.rser.2013.10.006
Al-mulali, U., Fereidouni, H. G., Lee, J. Y. M., and Sab, C. N. B. C. (2013). Exploring the Relationship between Urbanization, Energy Consumption, and CO2 Emission in MENA Countries. Renew. Sust. Energ. Rev. 23, 107–112. doi:10.1016/j.rser.2013.02.041
Al-Mulali, U., Fereidouni, H. G., Lee, J. Y., and Sab, C. N. B. C. (2013a). Examining the Bi-directional Long Run Relationship between Renewable Energy Consumption and GDP Growth. Renew. Sustain. Energ. Rev. 22, 209–222. doi:10.1016/j.rser.2013.02.005
Al-Mulali, U., Lee, J. Y., Hakim Mohammed, A., and Sheau-Ting, L. (2013b). Examining the Link between Energy Consumption, Carbon Dioxide Emission, and Economic Growth in Latin America and the Caribbean. Renew. Sustain. Energy Rev. 220 (26), 42–48. doi:10.1016/j.rser.2013.05.041
Al-Mulali, U., Solarin, S. A., and Ozturk, I. (2016). Investigating the Presence of the Environmental Kuznets Curve (EKC) Hypothesis in Kenya: an Autoregressive Distributed Lag (ARDL) Approach. Nat. Hazards 80, 1729–1747. doi:10.1007/s11069-015-2050-x
Alam, M. J., Begum, I. A., Buysse, J., Rahman, S., and Van Huylenbroeck, G. (2011). Dynamic Modeling of Causal Relationship between Energy Consumption, CO2 Emissions and Economic Growth in India. Renew. Sustain. Energy Rev. 15 (6), 3243–3251. doi:10.1016/j.rser.2011.04.029
Alam, M. M., Murad, M. W., Noman, A. H. M., and Ozturk, I. (2016). Relationships Among Carbon Emissions, Economic Growth, Energy Consumption and Population Growth: Testing Environmental Kuznets Curve Hypothesis for Brazil, China, India and Indonesia. Ecol. Indicators 70, 466–479. doi:10.1016/j.ecolind.2016.06.043
Altıntaş, H., and Kassouri, Y. (2020). The Impact of Energy Technology Innovations on Cleaner Energy Supply and Carbon Footprints in Europe: A Linear versus Nonlinear Approach. J. Clean. Prod. 276, 124140.
Apergis, N., and Ozturk, I. (2015). Testing Environmental Kuznets Curve Hypothesis in Asian Countries. Ecol. Indicators 52, 16–22. doi:10.1016/j.ecolind.2014.11.026
Apergis, N., and Payne, J. E. (2010a). Renewable Energy Consumption and Economic Growth: Evidence from a Panel of OECD Countries. Energy Policy 38 (1), 656–660. doi:10.1016/j.enpol.2009.09.002
Apergis, N., and Payne, J. E. (2010b). Renewable Energy Consumption and Growth in Eurasia. Energy Econ. 32 (6), 1392–1397. doi:10.1016/j.eneco.2010.06.001
Apergis, N., and Payne, J. E. (2015). Renewable Energy, Output, Carbon Dioxide Emissions, and Oil Prices: Evidence from South America. Energy Sources B: Econ. Plan. Policy 10 (3), 281–287. doi:10.1080/15567249.2013.853713
Apergis, N., Payne, J. E., Menyah, K., and Wolde-Rufael, Y. (2010). On the Causal Dynamics between Emissions, Nuclear Energy, Renewable Energy, and Economic Growth. Ecol. Econ. 69, 2255–2260. doi:10.1016/j.ecolecon.2010.06.014
Aslan, A., and Çam, S. (2013). Alternative and Nuclear Energy Consumption-Economic Growth Nexus for Israel: Evidence Based on Bootstrap-Corrected Causality Tests. Prog. Nucl. Energ. 62, 50–53. doi:10.1016/j.pnucene.2012.09.002
Azam, A., Rafiq, M., Shafique, M., Ateeq, M., and Yuan, J. (2021a). Investigating the Impact of Renewable Electricity Consumption on Sustainable Economic Development: A Panel ARDL Approach. Int. J. Green Energy 18 (11), 1185–1192. doi:10.1080/15435075.2021.1897825
Azam, A., Rafiq, M., Shafique, M., Ateeq, M., and Yuan, J. (2020). Causality Relationship between Electricity Supply and Economic Growth: Evidence from Pakistan. Energies 13, 837. doi:10.3390/en13040837
Azam, A., Rafiq, M., Shafique, M., and Yuan, J. (2021b). An Empirical Analysis of the Non-linear Effects of Natural Gas, Nuclear Energy, Renewable Energy and ICT-Trade in Leading CO2 Emitter Countries: Policy towards CO2 Mitigation and Economic Sustainability. J. Environ. Manage. 286, 112232. doi:10.1016/j.jenvman.2021.112232
Azam, A., Rafiq, M., Shafique, M., and Yuan, J. (2021f). Renewable Electricity Generation and Economic Growth Nexus in Developing Countries: An ARDL Approach. Econ. Res.-Ekon. Istraz. 34 (1), 2423–2446. doi:10.1080/1331677X.2020.1865180
Azam, A., Rafiq, M., Shafique, M., and Yuan, J. (2021c). Does Nuclear or Renewable Energy Consumption Help to Control Environmental Pollution? New Evidence from China. Renew. Energ. Focus 39, 139–147. doi:10.1016/j.ref.2021.08.002
Azam, A., Rafiq, M., Shafique, M., Yuan, J., and Salem, S. (2021g). Human Development Index, ICT and Renewable Energy-Growth Nexus for Sustainable Development: A Novel PVAR Analysis. Front. Energy Res. 9, 760758. doi:10.3389/fenrg.2021.760758
Azam, A., Rafiq, M., Shafique, M., Zhang, H., Ateeq, M., and Yuan, J. (2021d). Analyzing the Relationship between Economic Growth and Electricity Consumption from Renewable and Non-renewable Sources: Fresh Evidence from Newly Industrialized Countries. Sustain. Energy Technol. Assess. 44, 100991. doi:10.1016/j.seta.2021.100991
Azam, A., Rafiq, M., Shafique, M., Zhang, H., and Yuan, J. (2021e). Analyzing the Effect of Natural Gas, Nuclear Energy and Renewable Energy on GDP and Carbon Emissions: A Multi-Variate Panel Data Analysis. Energy 220, 119592. doi:10.1016/j.energy.2020.119592
Azam, M., Liu, L., and Ahmad, N. (2021). Impact of Institutional Quality on Environment and Energy Consumption: Evidence from Developing World. Environ. Dev. Sustain. 23, 1646–1667. doi:10.1007/s10668-020-00644-x
Baek, J. (2015). A Panel Cointegration Analysis of CO2 Emissions, Nuclear Energy and Income in Major Nuclear Generating Countries. Appl. Energ. 145, 133–138. doi:10.1016/j.apenergy.2015.01.074
Baek, J. (2016). Do nuclear and Renewable Energy Improve the Environment? Empirical Evidence from the United States. Ecol. Indicators 66, 352–356. doi:10.1016/j.ecolind.2016.01.059
Baek, J., and Pride, D. (2014). On the Income-Nuclear energy-CO2 Emissions Nexus Revisited. Energy Econ. 43, 6–10. doi:10.1016/j.eneco.2014.01.015
Bank, W. (2017). World Development Report 2017: Governance and the Law. Washingto, United States: The World Bank.
Bashier, A., and Siam, A. J. (2014). Immigration and Economic Growth in Jordan: FMOLS Approach. Int. J. Humanities Soc. Sci. Edu. (Ijhsse) 1, 85–92.
Bayar, Y., Diaconu, L., and Maxim, A. (2020). Financial Development and CO2 Emissions in post-transition European Union Countries. Sustainability 12, 2640. doi:10.3390/su12072640
Begum, R. A., Sohag, K., Abdullah, S. M. S., and Jaafar, M. (2015). CO2 Emissions, Energy Consumption, Economic and Population Growth in Malaysia. Renew. Sustain. Energy Rev. 41, 594–601. doi:10.1016/j.rser.2014.07.205
Bekun, F. V., Alola, A. A., and Sarkodie, S. A. (2019). Toward a Sustainable Environment: Nexus between CO2 Emissions, Resource Rent, Renewable and Nonrenewable Energy in 16-EU Countries. Sci. Total Environ. 657, 1023–1029. doi:10.1016/j.scitotenv.2018.12.104
Bengochea, A., and Faet, O. (2012). Renewable Energies and CO2 Emissions in the European Union. Energ. Sourc. B: Econ. Plann. Pol. 7, 121–130. doi:10.1080/15567240902744635
Bhattacharya, M., Paramati, S. R., Ozturk, I., and Bhattacharya, S. (2016). The Effect of Renewable Energy Consumption on Economic Growth: Evidence from Top 38 Countries. Appl. Energy 162, 733–741. doi:10.1016/j.apenergy.2015.10.104
Bilgili, F., Koçak, E., and Bulut, Ü. (2016). The Dynamic Impact of Renewable Energy Consumption on CO2 Emissions: A Revisited Environmental Kuznets Curve Approach. Renew. Sust. Energ. Rev. 54, 838–845. doi:10.1016/j.rser.2015.10.080
Bilgili, F., Kuşkaya, S., Gençoğlu, P., Kassouri, Y., and Garang, A. P. M. (2020). The Co-movements between Geothermal Energy Usage and CO2 Emissions through High and Low Frequency Cycles. Environ. Sci. Pollut. Res. Int. 28 (45), 63723–63738. doi:10.1007/s11356-020-11000-x
Bilgili, F., Nathaniel, S. P., Kuşkaya, S., and Kassouri, Y. (2021). Environmental Pollution and Energy Research and Development: An Environmental Kuznets Curve Model through Quantile Simulation Approach. Environ. Sci. Pollut. Res. Int. 28 (38), 53712–53727. doi:10.1007/s11356-021-14506-0
Bloch, H., Rafiq, S., and Salim, R. (2012). Coal Consumption, CO2 Emission and Economic Growth in China: Empirical Evidence and Policy Responses. Energy Econ. 34 (2), 518–528. doi:10.1016/j.eneco.2011.07.014
Boden, T. A., Andres, R. J., and Marland, G. (2017). Global, Regional, and National Fossil-Fuel Co2 Emissions (1751-2014) (V. 2017). CA, United States: Environmental System Science Data Infrastructure for a Virtual Ecosystem. doi:10.3334/CDIAC/00001_V2017
Bölük, G., and Mert, M. (2015). The Renewable Energy, Growth and Environmental Kuznets Curve in Turkey: An ARDL Approach. Renew. Sustain. Energy Rev. 52, 587–595. doi:10.1016/j.rser.2015.07.138
Boontome, P., Therdyothin, A., and Chontanawat, J. (2017). Investigating the Causal Relationship between Non-renewable and Renewable Energy Consumption, CO2 Emissions and Economic Growth in Thailand 1 1This Is a Preliminary Work. Please Do Not Quote or Cite without Permission of the Authors. Energ. Proced. 138, 925–930. doi:10.1016/j.egypro.2017.10.141
British Petroleum (2018). BP Statistical Review of World Energy 2018. London, UK: Statistical Review of World Energy.
Brook, B. W., Alonso, A., Meneley, D. A., Misak, J., Blees, T., and van Erp, J. B. (2014). Why Nuclear Energy Is Sustainable and Has to Be Part of the Energy Mix. Sust. Mater. Tech. 1-2, 8–16. doi:10.1016/j.susmat.2014.11.001
Cai, Y., Sam, C. Y., and Chang, T. (2018). Nexus between Clean Energy Consumption, Economic Growth and CO2 Emissions. J. Clean. Prod. 182, 1001–1011. doi:10.1016/j.jclepro.2018.02.035
Cerdeira Bento, J. P., and Moutinho, V. (2016). CO2 Emissions, Non-renewable and Renewable Electricity Production, Economic Growth, and International Trade in Italy. Renew. Sustain. Energy Rev. 55, 142–155. doi:10.1016/j.rser.2015.10.151
Chandran, V. G. R., and Tang, C. F. (2013). The Impacts of Transport Energy Consumption, Foreign Direct Investment and Income on CO2 Emissions in ASEAN-5 Economies. Renew. Sustain. Energy Rev. 24, 445–453. doi:10.1016/j.rser.2013.03.054
Chen, C., Pinar, M., and Stengos, T. (2020). Renewable Energy Consumption and Economic Growth Nexus: Evidence from a Threshold Model. Energy Policy 139, 111295. doi:10.1016/j.enpol.2020.111295
Chen, J. N. (2016). Report of the State council on the Environmental Situation and the Completion Environmental protection Objectives of the Year 2015. Springer.
Clark, P. U., Shakun, J. D., Marcott, S. A., Mix, A. C., Eby, M., Kulp, S., et al. (2016). Consequences of Twenty-First-century Policy for Multi-Millennial Climate and Sea-Level Change. Nat. Clim Change 6, 360–369. doi:10.1038/nclimate2923
Dellano-Paz, F., Calvo-Silvosa, A., Iglesias Antelo, S., and Soares, I. (2015). The European Low-Carbon Mix for 2030: The Role of Renewable Energy Sources in an Environmentally and Socially Efficient Approach. Renew. Sustain. Energy Rev. 48, 49–61. doi:10.1016/j.rser.2015.03.032
Dickey, D. A., and Fuller, W. A. (1979). Distribution of the Estimators for Autoregressive Time Series with a Unit Root. J. Am. Stat. Assoc. 74, 427–431. doi:10.1080/01621459.1979.10482531
Dogan, E. (2015). The Relationship between Economic Growth and Electricity Consumption from Renewable and Non-renewable Sources: A Study of Turkey. Renew. Sustain. Energy Rev. 52, 534–546. doi:10.1016/j.rser.2015.07.130
Dogan, E., and Aslan, A. (2017). Exploring the Relationship Among CO2 Emissions, Real GDP, Energy Consumption and Tourism in the EU and Candidate Countries: Evidence from Panel Models Robust to Heterogeneity and Cross-Sectional Dependence. Renew. Sust. Energ. Rev. 77, 239–245. doi:10.1016/j.rser.2017.03.111
Dogan, E., and Öztürk, İ. (2017). The Influence of Renewable and Non-Renewable Energy Consumption and Real Income on CO2 Emissions in the USA: Evidence From Structural Break Tests. Environ. Sci. Pollut. Res. Int. 24 (11), 10846–10854. doi:10.1007/s11356-017-8786-y
Dogan, E., and Seker, F. (2016). The Influence of Real Output, Renewable and Non-renewable Energy, Trade and Financial Development on Carbon Emissions in the Top Renewable Energy Countries. Renew. Sustain. Energy Rev. 60, 1074–1085. doi:10.1016/j.rser.2016.02.006
Dogan, E., and Turkekul, B. (2016). CO2 Emissions, Real Output, Energy Consumption, Trade, Urbanization and Financial Development: Testing the EKC Hypothesis for the USA. Environ. Sci. Pollut. Res. 23, 1203–1213. doi:10.1007/s11356-015-5323-8
Dong, K., Dong, X., and Jiang, Q. (2020). How Renewable Energy Consumption Lower Global CO2 Emissions? Evidence from Countries with Different Income Levels. World Econ. 43, 1665–1698. doi:10.1111/twec.12898
Dong, K., Sun, R., Hochman, G., Zeng, X., Li, H., and Jiang, H. (2017). Impact of Natural Gas Consumption on CO2 Emissions: Panel Data Evidence from China's Provinces. J. Clean. Prod. 162, 400–410. doi:10.1016/j.jclepro.2017.06.100
Ellabban, O., Abu-Rub, H., and Blaabjerg, F. (2014). Renewable Energy Resources: Current Status, Future Prospects and Their Enabling Technology. Renew. Sust. Energ. Rev. 39, 748–764. doi:10.1016/j.rser.2014.07.113
Fan, W., and Hao, Y. (2020). An Empirical Research on the Relationship Amongst Renewable Energy Consumption, Economic Growth and Foreign Direct Investment in China. Renew. Energ. 146, 598–609. doi:10.1016/j.renene.2019.06.170
Fang, Y. (2011). Economic Welfare Impacts from Renewable Energy Consumption: The China Experience. Renew. Sustain. Energy Rev. 15 (9), 5120–5128. doi:10.1016/j.rser.2011.07.044
Farhani, S., and Shahbaz, M. (2014). What Role of Renewable and Non-renewable Electricity Consumption and Output Is Needed to Initially Mitigate CO2 Emissions in MENA Region?. Renew. Sustain. Energy Rev. 40, 80–90. doi:10.1016/j.rser.2014.07.170
Gielen, D., Boshell, F., Saygin, D., Bazilian, M. D., Wagner, N., and Gorini, R. (2019). The Role of Renewable Energy in the Global Energy Transformation. Energy Strat. Rev. 24, 38–50. doi:10.1016/j.esr.2019.01.006
Hasnisah, A., Azlina, A. A., and Taib, C. M. I. C. (2019). The Impact of Renewable Energy Consumption on Carbon Dioxide Emissions: Empirical Evidence from Developing Countries in Asia. Int. J. Energy Econ. Policy 9 (3), 135–143. doi:10.32479/ijeep.7535
Hassan, S. T., Danish, M. A., Salah-Ud-Din khan, Z. H., Awais Baloch, M., and Tarar, Z. H. (2020). Is Nuclear Energy a Better Alternative for Mitigating CO2 Emissions in BRICS Countries? an Empirical Analysis. Nucl. Eng. Tech. 52, 2969–2974. doi:10.1016/j.net.2020.05.016
Hdom, H. A. D., and Fuinhas, J. A. (2020). Energy Production and Trade Openness: Assessing Economic Growth, CO2 Emissions and the Applicability of the Cointegration Analysis. Energy Strat. Rev. 30, 100488. doi:10.1016/j.esr.2020.100488
Hil Baky, M. A., Rahman, M. M., and Islam, A. K. M. S. (2017). Development of Renewable Energy Sector in Bangladesh: Current Status and Future Potentials. Renew. Sustain. Energy Rev. 73, 1184–1197. doi:10.1016/j.rser.2017.02.047
Huo, H., Zhang, Q., Guan, D., Su, X., Zhao, H., and He, K. (2014). Examining Air Pollution in China Using Production- and Consumption-Based Emissions Accounting Approaches. Environ. Sci. Technol. 48, 14139–14147. doi:10.1021/es503959t
Hwang, J.-H., and Yoo, S.-H. (2014). Energy Consumption, CO2 Emissions, and Economic Growth: Evidence from Indonesia. Qual. Quant 48, 63–73. doi:10.1007/s11135-012-9749-5
Iwata, H., Okada, K., and Samreth, S. (2011). A Note on the Environmental Kuznets Curve for CO2: A Pooled Mean Group Approach. Appl. Energy 88 (5), 1986–1996. doi:10.1016/j.apenergy.2010.11.005
Jaforullah, M., and King, A. (2015). Does the Use of Renewable Energy Sources Mitigate CO2 Emissions? A Reassessment of the US Evidence. Energ. Econ. 49, 711–717. doi:10.1016/j.eneco.2015.04.006
Jahangir Alam, M., Ara Begum, I., Buysse, J., and Van Huylenbroeck, G. (2012). Energy Consumption, Carbon Emissions and Economic Growth Nexus in Bangladesh: Cointegration and Dynamic Causality Analysis. Energy Policy 45, 217–225. doi:10.1016/j.enpol.2012.02.022
Jebli, M., Ben Youssef, S., and Ben Ozturk, I. (2016). Testing Environmental Kuznets Curve Hypothesis: The Role of Renewable and Non-renewable Energy Consumption and Trade in OECD Countries. Ecol. Indic. 60, 824–831. doi:10.1016/j.ecolind.2015.08.031
Jebli, M., and Youssef, S. (2015). The Environmental Kuznets Curve, Economic Growth, Renewable and Non-renewable Energy, and Trade in Tunisia. Renew. Sust. Energ. Rev. 47, 173–185. doi:10.1016/j.rser.2015.02.049
Jian, J., Fan, X., He, P., Xiong, H., and Shen, H. (2019). The Effects of Energy Consumption, Economic Growth and Financial Development on CO2 Emissions in China: A VECM Approach. Switzerland: Sustainability. doi:10.3390/su11184850
Jin, T., and Kim, J. (2018). What Is Better for Mitigating Carbon Emissions – Renewable Energy or Nuclear Energy? A Panel Data Analysis. Renew. Sustain. Energy Rev. 91, 464–471. doi:10.1016/j.rser.2018.04.022
Karakosta, C., Pappas, C., Marinakis, V., and Psarras, J. (2013). Renewable Energy and Nuclear Power towards Sustainable Development: Characteristics and Prospects. Renew. Sustain. Energy Rev. 22, 187–197. doi:10.1016/j.rser.2013.01.035
Kassouri, Y., Bilgili, F., and Peter Majok Garang, A. (2021). Are Government Energy Technology Research, Development, and Demonstration Budgets Converging or Diverging? Insights from OECD Countries. Technol. Anal. Strateg. Manag. doi:10.1080/09537325.2021.1914330
Kaufmann, D., Kraay, A., and Mastruzzi, M. (2010). The Worldwide Governance Indicators: Methodology and Analytical Issues. Policy Research Working Paper. United Kingdom: World Bank.
Khan, M. T. I., Ali, Q., and Ashfaq, M. (2018). The Nexus between Greenhouse Gas Emission, Electricity Production, Renewable Energy and Agriculture in Pakistan. Renew. Energ. 118, 437–451. doi:10.1016/j.renene.2017.11.043
Kohl, W. L. (2019). “The International Energy Agency: The Political Context,” in Oil, the Arab-Israel Dispute, and the Industrial World (Netherlands: Routledge), 246–257. doi:10.4324/9780429050688-17
Lau, L.-S., Choong, C.-K., Ng, C.-F., Liew, F.-M., and Ching, S.-L. (2019). Is Nuclear Energy Clean? Revisit of Environmental Kuznets Curve Hypothesis in OECD Countries. Econ. Model. 77, 12–20. doi:10.1016/j.econmod.2018.09.015
Lean, H. H., and Smyth, R. (2010). CO2 Emissions, Electricity Consumption and Output in ASEAN. Appl. Energy 87 (6), 1858–1864. doi:10.1016/j.apenergy.2010.02.003
Lee, S., Kim, M., and Lee, J. (2017). Analyzing the Impact of Nuclear Power on CO2 Emissions. Switzerland: Sustainability. doi:10.3390/su9081428
Lehtveer, M., and Hedenus, F. (2015). How Much Can Nuclear Power Reduce Climate Mitigation Cost? - Critical Parameters and Sensitivity. Energ. Strategy Rev. 6, 12–19. doi:10.1016/j.esr.2014.11.003
Li, R., and Su, M. (2017). The Role of Natural Gas and Renewable Energy in Curbing Carbon Emission: Case Study of the United States. Switzerland: Sustainability. doi:10.3390/su9040600
Lin, B., and Moubarak, M. (2014). Renewable Energy Consumption - Economic Growth Nexus for China. Renew. Sustain. Energy Rev. 40, 111–117. doi:10.1016/j.rser.2014.07.128
Lin, B., and Wesseh Jr., P. K. (2014). Energy Consumption and Economic Growth in South Africa Reexamined: A Nonparametric Testing Apporach. Renew. Sustain. Energ. Rev. 40, 840–850. doi:10.1016/j.rser.2014.08.005
Liu, W. (2016). Is Renewable Energy Effective in Promoting Local Economic Development? the Case of China. J. Renew. Sustain. Energy 8 (2), 025903. doi:10.1063/1.4945006
Liu, Z., Guan, D., Crawford-Brown, D., Zhang, Q., He, K., and Liu, J. (2013). Energy Policy: A Low-Carbon Road Map for China. Nature 500, 143–145. doi:10.1038/500143a
Long, X., Naminse, E. Y., Du, J., and Zhuang, J. (2015). Nonrenewable Energy, Renewable Energy, Carbon Dioxide Emissions and Economic Growth in China from 1952 to 2012. Renew. Sustain. Energy Rev. 52, 680–688. doi:10.1016/j.rser.2015.07.176
Lu, W.-C. (2017). Greenhouse Gas Emissions, Energy Consumption and Economic Growth: a Panel Cointegration Analysis for 16 Asian Countries. Ijerph 14, 1436. doi:10.3390/ijerph14111436
Ma, T., Ostergaard, P. A., Lund, H., Yang, H., and Lu, L. (2014). An Energy System Model for Hong Kong in 2020. Energy 68, 301–310. doi:10.1016/j.energy.2014.02.096
Marsiglio, S., Ansuategi, A., and Gallastegui, M. C. (2016). The Environmental Kuznets Curve and the Structural Change Hypothesis. Environ. Resource Econ. 63, 265–288. doi:10.1007/s10640-015-9942-9
Mensah, C. N., Long, X., Boamah, K. B., Bediako, I. A., Dauda, L., and Salman, M. (2018). The Effect of Innovation on CO2 Emissions of OCED Countries from 1990 to 2014. Environ. Sci. Pollut. Res. Int. 25 (29), 29678–29698. doi:10.1007/s11356-018-2968-0
Mensah, I. A., Sun, M., Gao, C., Omari-Sasu, A. Y., Zhu, D., Ampimah, B. C., et al. (2019). Analysis on the Nexus of Economic Growth, Fossil Fuel Energy Consumption, CO2 Emissions and Oil price in Africa Based on a PMG Panel ARDL Approach. J. Clean. Prod. 228, 161–174. doi:10.1016/j.jclepro.2019.04.281
Menyah, K., and Wolde-Rufael, Y. (2010). CO2 Emissions, Nuclear Energy, Renewable Energy and Economic Growth in the US. Energy Policy 38 (6), 2911–2915. doi:10.1016/j.enpol.2010.01.024
Mitić, P., Munitlak Ivanović, O., and Zdravković, A. (2017). A Cointegration Analysis of Real GDP and CO2 Emissions in Transitional Countries. Sustainability 9, 568.
Muhammad, B. (2019). Energy Consumption, CO2 Emissions and Economic Growth in Developed, Emerging and Middle East and North Africa Countries. Energy 179, 232–245. doi:10.1016/j.energy.2019.03.126
Omri, A., Ben Mabrouk, N., and Sassi-Tmar, A. (2015). Modeling the Causal Linkages between Nuclear Energy, Renewable Energy and Economic Growth in Developed and Developing Countries. Renew. Sust. Energ. Rev. 42, 1012–1022. doi:10.1016/j.rser.2014.10.046
Ozcan, B., and Ari, A. (2017). Nuclear Energy-Economic Growth Nexus in OECD Countries: a Panel Data Analysis. J. Econ. Manag. Perspect. 11, 138–154.
Ozcan, B., and Ulucak, R. (2021). An Empirical Investigation of Nuclear Energy Consumption and Carbon Dioxide (CO2) Emission in India: Bridging IPAT and EKC Hypotheses. Nucl. Eng. Tech. 53, 2056–2065.
Ozturk, I., and Acaravci, A. (2010). CO2 Emissions, Energy Consumption and Economic Growth in Turkey. Renew. Sust. Energ. Rev. 14, 3220–3225. doi:10.1016/j.rser.2010.07.005
Pao, H.-T., and Fu, H.-C. (2013). Renewable Energy, Non-renewable Energy and Economic Growth in Brazil. Renew. Sust. Energ. Rev. 25, 381–392. doi:10.1016/j.rser.2013.05.004
Pao, H. T., Fu, H. C., and Tseng, C. L. (2012). Forecasting of CO2 Emissions, Energy Consumption and Economic Growth in China Using an Improved Grey Model. Energy 40 (1), 400–409. doi:10.1016/j.energy.2012.01.037
Pao, H. T., and Tsai, C. M. (2011). Modeling and Forecasting the CO2 Emissions, Energy Consumption, and Economic Growth in Brazil. Energy 36 (5), 2450–2458. doi:10.1016/j.energy.2011.01.032
Parry, M., Canziani, O., Palutikof, J., Linden, P., and Hanson, C. (2007). “Summary for Policymakers,” in Climate Change 2007: Impacts, Adaptation and Vulnerability (Cambridge University Press). doi:10.1256/004316502320517344
Peng, L., Zhang, Y., Li, F., Wang, Q., Chen, X., and Yu, A. (2019). Policy Implication of Nuclear Energy’s Potential for Energy Optimization and CO2 Mitigation: A Case Study of Fujian, China. Nucl. Eng. Tech. 51, 4. doi:10.1016/j.net.2019.01.016
Phillips, P. C. B., and Perron, P. (1988). Testing for a Unit Root in Time Series Regression. Biometrika 75, 335–346. doi:10.1093/biomet/75.2.335
Pitselis, G. (2013). A Review on Robust Estimators Applied to Regression Credibility. J. Comput. Appl. Math. 239, 231–249. doi:10.1016/j.cam.2012.09.009
Portugal-Pereira, J., Ferreira, P., Cunha, J., Szklo, A., Schaeffer, R., and Araújo, M. (2018). Better Late Than Never, but Never Late Is Better: Risk Assessment of Nuclear Power Construction Projects. Energy Policy 120, 158–166. doi:10.1016/j.enpol.2018.05.041
Radmehr, R., Henneberry, S. R., and Shayanmehr, S. (2021). Renewable Energy Consumption, CO2 Emissions, and Economic Growth Nexus: a Simultaneity Spatial Modeling Analysis of EU Countries. Struct. Change Econ. Dyn. 57, 13–27. doi:10.1016/j.strueco.2021.01.006
Rahman, M. M., and Velayutham, E. (2020). Renewable and Non-renewable Energy Consumption-Economic Growth Nexus: New Evidence from South Asia. Renew. Energy 147, 399–408. doi:10.1016/j.renene.2019.09.007
Rasoulinezhad, E., and Saboori, B. (2018). Panel Estimation for Renewable and Non-renewable Energy Consumption, Economic Growth, CO2 Emissions, the Composite Trade Intensity, and Financial Openness of the Commonwealth of Independent States. Environ. Sci. Pollut. Res. 25 (18), 17354–17370. doi:10.1007/s11356-018-1827-3
Riti, J. S., Song, D., Shu, Y., Kamah, M., and Atabani, A. A. (2018). Does Renewable Energy Ensure Environmental Quality in Favour of Economic Growth? Empirical Evidence from China's Renewable Development. Qual. Quant 52, 2007–2030. doi:10.1007/s11135-017-0577-5
Saad, W., and Taleb, A. (2018). The Causal Relationship between Renewable Energy Consumption and Economic Growth: Evidence from Europe. Clean Technol. Environ. Policy 20, 127–136. doi:10.1007/s10098-017-1463-5
Saboori, B., Sulaiman, J., and Mohd, S. (2012). Economic Growth and CO2 Emissions in Malaysia: A Cointegration Analysis of the Environmental Kuznets Curve. Energy Policy 51, 184–191. doi:10.1016/j.enpol.2012.08.065
Saidi, K., and Omri, A. (2020). Reducing CO2 Emissions in OECD Countries: Do Renewable and Nuclear Energy Matter? Prog. Nucl. Energ. 126, 103425. doi:10.1016/j.pnucene.2020.103425
Salman, M., Long, X., Dauda, L., and Mensah, C. N. (2019). The Impact of Institutional Quality on Economic Growth and Carbon Emissions: Evidence from Indonesia, South Korea and Thailand. J. Clean. Prod. 241, 118331. doi:10.1016/j.jclepro.2019.118331
Sebri, M., and Ben-Salha, O. (2014). On the Causal Dynamics between Economic Growth, Renewable Energy Consumption, CO2 Emissions and Trade Openness: Fresh Evidence from BRICS Countries. Renew. Sustain. Energy Rev. 39, 14–23. doi:10.1016/j.rser.2014.07.033
Shafique, M., and Luo, X. (2022). Environmental Life Cycle Assessment of Battery Electric Vehicles from the Current and Future Energy Mix Perspective. J. Environ. Manage. 303, 114050. doi:10.1016/j.jenvman.2021.114050
Shafique, M., Azam, A., Rafiq, M., and Luo, X. (2020). Evaluating the Relationship between Freight Transport, Economic prosperity, Urbanization, and CO2 Emissions: Evidence from Hong Kong, Singapore, and South Korea. Sustainability 12, 10664. doi:10.3390/su122410664
Shafique, M., Azam, A., Rafiq, M., and Luo, X. (2021b). Investigating the Nexus Among Transport, Economic Growth and Environmental Degradation: Evidence from Panel ARDL Approach. Transport Policy 109, 61–71. doi:10.1016/j.tranpol.2021.04.014
Shafique, M., Azam, A., Rafiq, M., and Luo, X. (2021a). Life Cycle Assessment of Electric Vehicles and Internal Combustion Engine Vehicles: A Case Study of Hong Kong. Res. Transportation Econ. 2021, 101112. doi:10.1016/j.retrec.2021.101112
Shahbaz, M., Dube, S., Öztürk, I., and Jalil, A. (2015a). Testing the Environmental Kuznets Curve Hypothesis in Portugal. Mersin: Cag University.
Shahbaz, M., Loganathan, N., Zeshan, M., and Zaman, K. (2015b). Does Renewable Energy Consumption Add in Economic Growth? an Application of Auto-Regressive Distributed Lag Model in Pakistan. Renew. Sustain. Energy Rev. 44, 576–585. doi:10.1016/j.rser.2015.01.017
Shan, Y., Guan, D., Zheng, H., Ou, J., Li, Y., Meng, J., et al. (2018). China CO2 Emission Accounts 1997-2015. Sci. Data 5, 170201–170214. doi:10.1038/sdata.2017.201
Shayanmehr, S., Rastegari Henneberry, S., Sabouhi Sabouni, M., and Shahnoushi Foroushani, N. (2020). Drought, Climate Change, and Dryland Wheat Yield Response: An Econometric Approach. Ijerph 17, 5264. doi:10.3390/ijerph17145264
Shi, X., Liu, H., and Riti, J. S. (2019). The Role of Energy Mix and Financial Development in Greenhouse Gas (GHG) Emissions' Reduction: Evidence from Ten Leading CO2 Emitting Countries. Econ. Polit. 36, 695–729. doi:10.1007/s40888-019-00159-3
Shoaib, H. M., Rafique, M. Z., Nadeem, A. M., and Huang, S. (2020). Impact of Financial Development on CO2 Emissions: A Comparative Analysis of Developing Countries (D8) and Developed Countries (G8). Environ. Sci. Pollut. Res. 27, 12461–12475. doi:10.1007/s11356-019-06680-z
Smith, J. C. (2017). A Major Player: Renewables Are Now Mainstream [Guest Editorial]. IEEE Power and Energy Magazine. doi:10.1109/MPE.2017.2729080
Sun, H., Mohsin, M., Alharthi, M., and Abbas, Q. (2020). Measuring Environmental Sustainability Performance of South Asia. J. Clean. Prod. 251, 119519. doi:10.1016/j.jclepro.2019.119519
Syed, A. A., Kamal, M. A., and Tripathi, R. (2021). An Empirical Investigation of Nuclear Energy and Environmental Pollution Nexus in India: Fresh Evidence Using NARDL Approach. Environ. Sci. Pollut. Res. 1, 1–12. doi:10.1007/s11356-021-14365-9
Tanaka, S., Yin, W., and Jefferson, G. H. (2014). Environmental Regulation and Industrial Performance: Evidence from China. Medford, MA: Work. Pap., Tufts Univ.
Toda, H. Y., and Yamamoto, T. (1995). Statistical Inference in Vector Autoregressions with Possibly Integrated Processes. J. Econom. 66, 225–250. doi:10.1016/0304-4076(94)01616-8
Tugcu, C. T., Ozturk, I., and Aslan, A. (2012). Renewable and Non-renewable Energy Consumption and Economic Growth Relationship Revisited: Evidence from G7 Countries. Energ. Econ. 34, 1942–1950. doi:10.1016/j.eneco.2012.08.021
Tuna, G., and Tuna, V. E. (2019). The Asymmetric Causal Relationship between Renewable and NON-RENEWABLE Energy Consumption and Economic Growth in the ASEAN-5 Countries. Resour. Pol. 62, 114–124. doi:10.1016/j.resourpol.2019.03.010
Uzar, U. (2020). Political Economy of Renewable Energy: Does Institutional Quality Make a Difference in Renewable Energy Consumption? Renew. Energ. 155, 591–603. doi:10.1016/j.renene.2020.03.172
Vo, A. T., Vo, D. H., and Le, Q. T.-T. (2019). CO2 Emissions, Energy Consumption, and Economic Growth: New Evidence in the ASEAN Countries. J. Risk Financial Manag. 12 (3), 145. doi:10.3390/jrfm12030145
Vural, G. (2020). Renewable and Non-renewable Energy-Growth Nexus: A Panel Data Application for the Selected Sub-saharan African Countries. Res. Policy 65, 101568. doi:10.1016/j.resourpol.2019.101568
Wang, Z., Ben Jebli, M., Madaleno, M., Doğan, B., and Shahzad, U. (2021). Does export Product Quality and Renewable Energy Induce Carbon Dioxide Emissions: Evidence from Leading Complex and Renewable Energy Economies. Renew. Energ. 171, 360–370. doi:10.1016/j.renene.2021.02.066
Wilcox, R. R., and Keselman, H. J. (2003). Modern Robust Data Analysis Methods: Measures of central Tendency. Psychol. Methods 8, 254–274. doi:10.1037/1082-989x.8.3.254
Wolde-Rufael, Y., and Idowu, S. (2017). Income Distribution and CO2 Emission: A Comparative Analysis for China and India. Renew. Sust. Energ. Rev. 74, 1336–1345. doi:10.1016/j.rser.2016.11.149
Xiao-ding, L. I., Yun-huan, Q. U., Li-hui, Z., Yu, G., Yi-man, D., and Guang-hui, L. I. (2021). “Forecast of China’s Future Nuclear Energy Development and Nuclear Safety Management Talents Development,” in IOP Conference Series: Earth and Environmental Science (Surakarta, Indonesia: IOP Publishing), 12022.
Xu Yan, Y., Kang, J., and Yuan, J. (2018). The Prospective of Nuclear Power in China. Switzerland: Sustainability. doi:10.3390/su10062086
Xu Zefeng, Z., Baloch, M. A., Danish, F., Meng, F., Zhang, J., and Mahmood, Z. (2018). Nexus between Financial Development and CO2 Emissions in Saudi Arabia: Analyzing the Role of Globalization. Environ. Sci. Pollut. Res. 25, 28378–28390. doi:10.1007/s11356-018-2876-3
Yahya, F., and Rafiq, M. (2019b). Brownfield, greenfield, and Renewable Energy Consumption: Moderating Role of Effective Governance. Energ. Environ. 25, 2. doi:10.1177/0958305X19872936
Yahya, F., and Rafiq, M. (2019a). Unraveling the Contemporary Drivers of Renewable Energy Consumption: Evidence from Regime Types. Environ. Prog. Sust. Energ. 38, 5. doi:10.1002/ep.13178
Yildirim, E., Saraç, Ş., and Aslan, A. (2012). Energy Consumption and Economic Growth in the USA: Evidence from Renewable Energy. Renew. Sust. Energ. Rev. 16, 6770–6774. doi:10.1016/j.rser.2012.09.004
Yuan, J., Na, C., Lei, Q., Xiong, M., Guo, J., and Hu, Z. (2018). Coal Use for Power Generation in China. Resour. Conservation Recycling 129, 443–453. doi:10.1016/j.resconrec.2016.03.021
Zeng, M., Duan, J., Wang, L., Zhang, Y., and Xue, S. (2015). Orderly Grid Connection of Renewable Energy Generation in China: Management Mode, Existing Problems and Solutions. Renew. Sust. Energ. Rev. 41, 14–28. doi:10.1016/j.rser.2014.08.047
Zeng, M., Wang, S., Duan, J., Sun, J., Zhong, P., and Zhang, Y. (2016). Review of Nuclear Power Development in China: Environment Analysis, Historical Stages, Development Status, Problems and Countermeasures. Renew. Sustain. Energ. Rev. 59, 1369–1383. doi:10.1016/j.rser.2016.01.045
Zhai, M., Huang, G., Liu, L., Zheng, B., and Guan, Y. (2020). Inter-regional Carbon Flows Embodied in Electricity Transmission: Network Simulation for Energy-Carbon Nexus. Renew. Sust. Energ. Rev. 118, 109511. doi:10.1016/j.rser.2019.109511
Zhang, C., and Zhou, X. (2016). Does Foreign Direct Investment lead to Lower CO2 Emissions? Evidence from a Regional Analysis in China. Renew. Sust. Energ. Rev. 58, 943–951. doi:10.1016/j.rser.2015.12.226
Zhang, J., and Broadstock, D. C. (2016). The Causality between Energy Consumption and Economic Growth for China in a Time-Varying Framework. Energ. J. 37, 1. doi:10.5547/01956574.37.SI1.jzha
Zhang, X., Zhang, H., and Yuan, J. (2019). Economic Growth, Energy Consumption, and Carbon Emission Nexus: Fresh Evidence from Developing Countries. Environ. Sci. Pollut. Res. 26, 26367–26380. doi:10.1007/s11356-019-05878-5
Zhao, X., Cai, Q., Zhang, S., and Luo, K. (2017). The Substitution of Wind Power for Coal-Fired Power to Realize China's CO2 Emissions Reduction Targets in 2020 and 2030. Energy 120, 164–178. doi:10.1016/j.energy.2016.12.109
Zhao, Y., Liu, Y., Wang, S., Zhang, Z., and Li, J. (2015). Inter-regional Linkage Analysis of Industrial CO2 Emissions in China: An Application of a Hypothetical Extraction Method. Ecol. Indicators 61, 428–437. doi:10.1016/j.ecolind.2015.09.044
Keywords: renewable energy, nuclear energy, economic growth, financial development, CO2 emission
Citation: Azam A, Rafiq M, Shafique M and Yuan J (2022) Mitigating Carbon Emissions in China: The Role of Clean Energy, Technological Innovation, and Political-Institutional Quality. Front. Environ. Sci. 10:814439. doi: 10.3389/fenvs.2022.814439
Received: 13 November 2021; Accepted: 15 February 2022;
Published: 19 May 2022.
Edited by:
Thai-Ha Le, Fulbright University Vietnam (FUV), VietnamReviewed by:
Yacouba Kassouri, Leipzig University, GermanyMuntasir Murshed, North South University, Bangladesh
Copyright © 2022 Azam, Rafiq, Shafique and Yuan. This is an open-access article distributed under the terms of the Creative Commons Attribution License (CC BY). The use, distribution or reproduction in other forums is permitted, provided the original author(s) and the copyright owner(s) are credited and that the original publication in this journal is cited, in accordance with accepted academic practice. No use, distribution or reproduction is permitted which does not comply with these terms.
*Correspondence: Anam Azam, YW5hbXJhZmlxOTVAZ21haWwuY29t; Muhammad Rafiq, anV0dDk2QGdtYWlsLmNvbQ==; Muhammad Shafique, bXVoYW1tYWQuc2hhZmlxdWVAYnJ1bmVsLmFjLnVr