 Shengqi Jian
 Changyan Yin1
94% of researchers rate our articles as excellent or good
Learn more about the work of our research integrity team to safeguard the quality of each article we publish.
Find out more
ORIGINAL RESEARCH article
Front. Environ. Sci., 01 June 2022
Sec. Environmental Informatics and Remote Sensing
Volume 10 - 2022 | https://doi.org/10.3389/fenvs.2022.812351
This article is part of the Research TopicHydroclimatic Extremes: Human-Natural System Adaptation and ImpactsView all 13 articles
Prediction of runoff is of great significance for the sustainable utilization of water resources and flood control and disaster reduction in the basin. In this study, a method for predicting the runoff caused by extreme sub-rainfall events was constructed based on the identification of extreme rainfall events, Mann–Kendall Test, R/S analysis, and regression analysis. The method was applied to the Jingle sub-basin, and the results showed that the extreme precipitation in this basin will maintain a slight rising trend in the future, assuming that the climate and underlying conditions remain the same as they were in the current scenario. There is a more stable correlational relationship between rainfall characteristic factors and runoff in extreme rainfall events. The extreme precipitation of 1–5 consecutive days under the 100a return period designed by the hydrological frequency method is 38.74, 60.01, 66.00, 71.44, and 73.69 mm, respectively, and the possible runoff predicted by the four empirical formulas is 1295−2495, 2108−4935, 2408−5801, and 3051−7062 × 104 m3, respectively. The rainfall designed by the hydrological frequency combination method is 203.64 mm, and the possible runoff predicted by the four empirical formulas is 2.8−5.3 × 10⁸ m3. This study can provide a new reference for predicting the possible incoming runoff under extreme sub-rainfall events.
Analysis and prediction of runoff characteristics can provide a reasonable basis for rational regulation and optimal allocation of water resources, water resource protection and planning, and effective management of water resources. Under the combined influence of climate change and human activities, the relationship between rainfall and runoff presented uncertainty, multiple time scales, randomness, chaos, weak dependent, highly complex nonlinear, and non-stationary characteristics (Galelli and Castelletti, 2013; Zhang et al., 2018). These change characteristics proposed great challenges for the prediction of runoff. The commonly used methods of runoff prediction include the process-driven model and data-driven model. The process-driven model focuses on the process of flow generation and concentration to simulate the runoff process from the perspective of hydrological principles, such as HEC-HMS (Teng et al., 2017), SWAT (Wu et al., 2019), Xin’anjiang (Hao et al., 2018), and MIKE-SHE (Qi et al., 2021). From the perspective of data analysis and mining, the data-driven model analyzes the flow process and its influencing factors, combines the mathematical–statistical relationship between data input and output, and constructs a model for runoff prediction, such as the regression model (Qamar et al., 2016; Visessri and McIntyre, 2016), artificial neural networks (Seckin et al., 2013; Gökbulak et al., 2015), and support vector machine (SVM) (Li et al., 2013; Wang et al., 2014). Most of the researchers used effective methods and obtained ideal results for runoff prediction and rainfall–runoff process simulation. But, only a few studies focus on runoff prediction on a small time-scale, especially on the scale of the sub-rainfall event.
Global warming caused by climate change has become one of the most serious environmental challenges facing the world (Sun et al., 2015). Climate change will pose a severe threat to the global and regional ecological environment, among which the impact of extreme rainfall on nature and society is far greater than that of others (Manfreda et al., 2018; Barlow et al., 2019). An increasing amount of research has found that extreme precipitation characteristics have changed around the world (Westra et al., 2013; Tan et al., 2021). The relationship between rainfall characteristics and runoff generation varied within different rainfall levels and intensities (de Lima et al., 2009; Ran et al., 2012), so numerous researchers have investigated the characteristics of water and sediment under extreme rainfall separately (Liu et al., 2019; Dang et al., 2020; Zhao et al., 2020). Liu et al. (2019) took Hekou to the Tongguan section in the middle reaches of the Yellow River as the research area and analyzed the possible annual sediment and runoff yield under extreme rainstorm conditions by the SWAT model. Dang et al. (2020), based on historical rainfall sediment records, studied the relationship between precipitation and sediment yield and predicted the annual sediment under the design extreme precipitation scenario. Therefore, from the perspective of the sub-rainfall event, this study predicts the possible runoff under extreme sub-rainfall events.
As mentioned above, the main purpose of this study is to predict the runoff under extreme sub-rainfall events. We used the Jingle sub-basin as the study area, and the following steps were carried out. 1) Based on the definition of the extreme precipitation index, the selection criteria of sub-extreme rainfall event in this study were defined. 2) The trend and consistency of extreme rainfall were analyzed by the MK test and R/S analysis, respectively. 3) Different rainfall factors were selected to establish several rainfall–runoff empirical formulas by regression analysis. 4) Then, the empirical formulas combined with designed extreme rainfall scenarios were used to predict the possible incoming runoff under extreme rainfall events.
Fenhe River is located in the middle reaches of the Yellow River and is the second-largest tributary of the Yellow River, with a total length of 716 km and a drainage area of 39,471 km2 (110°30'–113°32'E; 35°20'–39°00'N). The climate in this basin differs significantly as a result of the complex atmospheric and monsoon circulation in the mid-latitude zone. The annual average evaporation is 1120 mm, and the average annual precipitation is 503 mm. The average annual runoff is 2.28 × 10⁹ m3. The spatial distribution of rainfall is uneven, showing a decreasing trend from south to north. Approximately 60–80% of the annual precipitation falls in the form of heavy rain and is temporally concentrated between June and September. Due to the gentle river course and the influx of sediment carried by many tributaries, flood disasters occur frequently in the Basin. In the past 100 years, there were more than 20 record floods in the Fenhe River, roughly once every 5 years. After 1949, there were five relatively large-scale floods in the middle and lower reaches of the Fenhe River. Among them, the magnitude of the flood that occurred on 21 August 1982 was the largest, with a peak discharge of 1420 m3/s, which caused huge economic losses and casualties. It can be seen that flood disasters have always been a vital and prominent issue in the basin.
The Jingle sub-basin (Figure 1) lies in the upper reaches of Fenhe River, controlling approximately 1/3 of the area of the upper reaches of Fenhe River. The area of the basin is 2799 km2, and the length of the river is about 83.9 km. The Jingle Hydrological Station is a control station for the Jingle sub-basin. The average annual precipitation is 497.85 mm, and the monthly average temperature is 4–13°C. Construction lands substantially expanded after 2000 with the rapid development of the economy and urbanization across the whole basin. Concomitantly, vegetation coverage has increased in the basin due to the implementation of the national level “Soil and Water Conservation” program for 20 years, beginning in 1988, but the mainland use types in this area are still woodland and arable land.
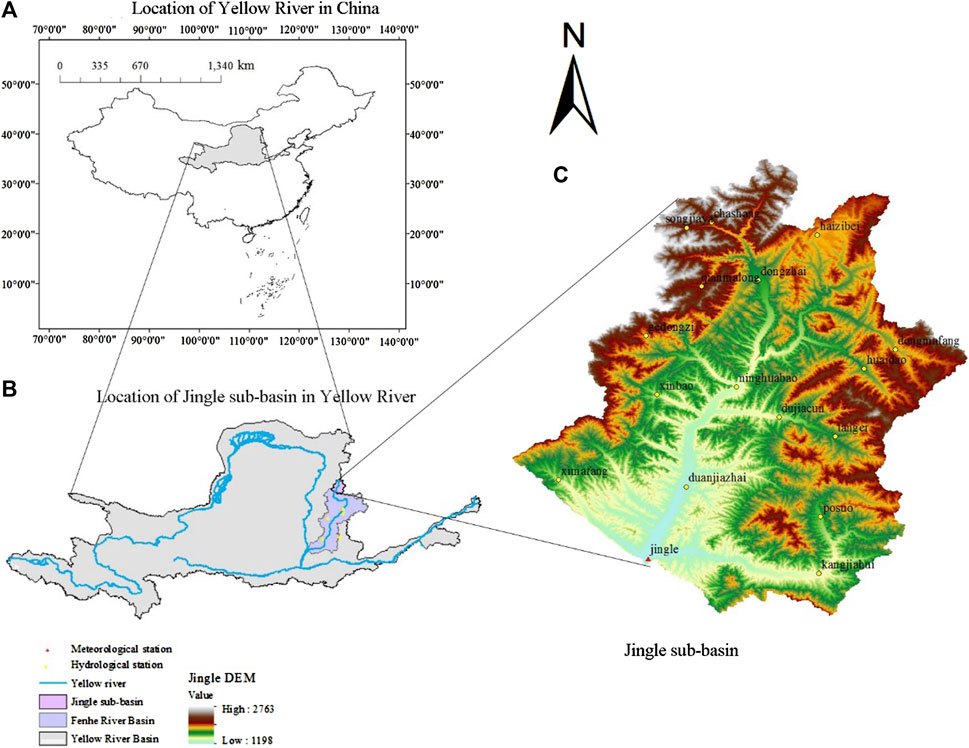
FIGURE 1. Topographic map of the Jingle sub-basin. (A) Description of Yellow River in China; (B) Description of the Jingle sub-basin in the Yellow River Basin; (C) Control catchment of the Jingle station in Fenhe River and distribution of rainfall gage stations.
The measured daily precipitation data of five hydrological stations in the Fenhe River Basin (Figure 1B) from 1960 to 2019 are obtained from the National Meteorological Science Data Center (http://data.cma.cn/), and some missing data were interpolated reasonably by the hydrological analogy method and linear interpolation method. The measured rainfall–runoff process data (1971–2018) of the hydrological station and meteorological station of the Jingle sub-basin were systematically unified into a 1-h time step (Figure 1C). A total of 103 rainfall events were selected according to the principle of no precipitation within 24 h. The area-averaged rainfall of sub-rainfall events was obtained via the Thiessen polygon method, and the rainfall characteristic variables (volume, period intensity, and duration) were counted (Figure 2).
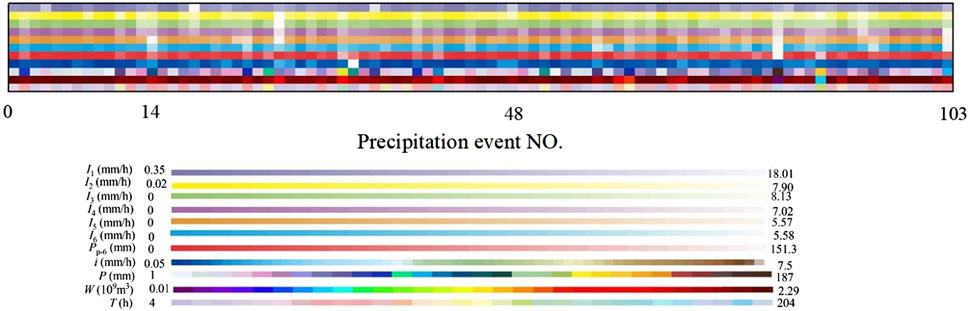
FIGURE 2. Values of sub-rainfall event characteristic factors, 1–103 are the numbers of sub-rainfall events. I1 is the maximum 1 h rain intensity; I2−1 is the second-largest hourly rainfall intensity; Similarly, I3−2, I4−3, I5−4, and I6−5 are the 3rd, 4th, 5th, and 6th largest hourly rainfall intensity, respectively; Pp-6 is the rainfall minus the maximum rainfall of 6 h; P is the rainfall; W is the flood amount yielded by sub-rainfall; T is the sub-rainfall duration.
The IPCC provides little information on the definition of the sub-extreme rainfall event, considering the long duration of rainfall events in the study area, and instead of fixed absolute threshold values, relative threshold values of rainfall corresponding to the 95th percentiles were proposed to represent the extreme rainfall event. For rainfall events with a duration less than 24 h, the criterion to judge whether it is an extreme rainfall event is its total rainfall beyond the 95th percentile threshold of daily precipitation; for rainfall events lasting 24–48 h, the criterion to judge whether it is an extreme rainfall event is its total rainfall beyond the 95th percentile threshold of rainfall during two consecutive days; similarly, for rainfall events lasting 48–72 h, 72–96 h, and more than 96 h, the judgment criteria are that the total rainfall of them beyond the 95th percentile threshold of rainfall during three consecutive days, rainfall during four consecutive days, and rainfall during five consecutive days. The specific implementation steps are as follows: according to the collected daily precipitation data of five stations in the Fenhe River Basin from 1960 to 2019. The kriging interpolation method was adopted to obtain the daily precipitation data of the Jingle sub-basin from 1960 to 2019. When the daily precipitation is greater than 0.1 mm, it is considered to be a rainy day. The series of rainy days in each year is arranged in ascending order of size to get x1, x2, …, xn and then the 95th percentile threshold of daily precipitation (1 day) each year is as follows:
where j is the sequence number of daily rainfall arranged in ascending order,
Similarly, the 95th percentile threshold of rainfall during two consecutive days, rainfall during three consecutive days, rainfall during four consecutive days, and rainfall during five consecutive days of each year can be obtained. In this study, the series comprising 95th percentile threshold of daily precipitation of each year from 1960 to 2019 was called C1 day, the next was called C2 day, and so on until C5 day. The 60 year' average values of C1 day, C2 day, C3 day, C4 day, and C5 day are defined as the thresholds of extreme rainfall events with different durations.
Since the nonparametric MK test does not directly give the amplitude of the upward or downward trend, a simple linear regression method combined with the MK test was used to detect the trend significance and mutation test of the series (C1 day, C2 day, C3 day, C4 day, and C5 day), and their statistical significances were detected at the 0.05 level (Shi et al., 2016b; Shi et al., 2018).
R/S analysis was used to calculate the Hurst values of the series (C1 day, C2 day, C3 day, C4 day, and C5 day) in the Jingle sub-basin during 1960–2019, and the future trend of change can be evaluated according to the value of H (0 < H < 1) as follows: 1) when H = 0.5, the series is independent of each other, that is, future changes are independent of historical changes; 2) when 0 < H < 0.5, the series of each element has anti-persistence, that is, the future changes will be opposite to past changes; 3) when 0.5 < H < 1, future changes are consistent with past changes (Wu et al., 2021). Anti-persistence or persistence can be divided into five grades according to the strength from weak to strong (Table 1).
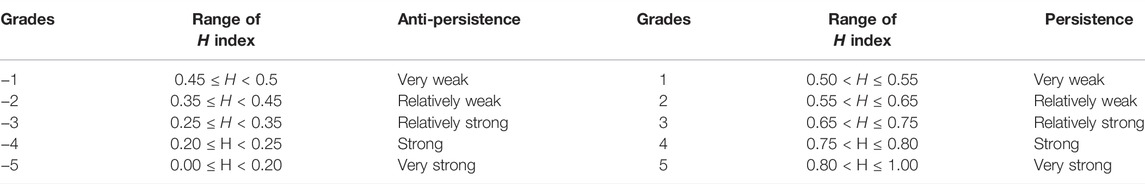
TABLE 1. Classification of the Hurst index.
As the direct source of runoff, rainfall has a close relationship with runoff, which is manifested in the linear or nonlinear relationship between rainfall characteristic factors and runoff. In this study, the rainfall–runoff empirical formula between multiple rainfall characteristic factors and runoff was established by curve regression and multiple stepwise linear regression analysis. The specific steps of curve regression analysis are as follows: 1) the sub-rainfall prediction factor is taken as the abscissa and the sub-runoff as the ordinate and the scatter diagram of two variables is drawn; 2) the regression models between predictive variables and dependent variables were established through linear regression, binomial regression, power function regression, exponential function regression, and logarithmic function. 3) Finally, the decisive coefficient is taken as the criterion to choose the best rainfall–runoff empirical model.
Rainfall is the sum of the amount of rainfall in a certain period of time, which is the direct source of the amount of flood. The sub-rainfall fitting method is to use the total rainfall of an extreme rainfall event as the independent variable and the flood amount as the dependent variable to establish rainfall–runoff empirical formula 1 through curve regression analysis.
The rainfall factors leading to soil erosion include rainfall and rainfall intensity. In order to consider the impact of the two factors on the sub-rainfall–runoff event at the same time, the product (PI1) of rainfall (P) and the maximum 1 h rainfall intensity (I1) of the sub-rainfall event was used as the prediction factor to establish the rainfall–runoff empirical formula 2 by curve regression.
In the process of precipitation, as the amount of rainfall varies, the influence of rainfall on water yield is different in various periods. Therefore, considering the influence of rainfall in different periods on the water yield, the empirical formula 3 which describes the relationship between seven sub-periods (P1, P2−1, P3−2 … Pp−6) and runoff of sub-rainfall events was established by multiple stepwise linear regression analysis.
To consider complex and adverse situations in depth, the point data on the upper edge of the rainfall–runoff figure were selected to plot the rainfall–runoff upper envelop and fit the upper envelop relation through curve regression to get empirical formula 4.
Based on historical extreme precipitation records in the basin, two extreme rainfall scenarios were constructed in this study, and the possible runoff under extreme precipitation scenarios was predicted by the established empirical model. The details of the scenario setting are as follows:
The occurrence of rainfall events in the Jingle sub-basin is random, so it can be analyzed and calculated by the frequency analysis method.
The normal, gamma, gen gamma, log gamma, generalized extreme value, Gumbel max, and Weibull distribution were used to fit the C1 day, C2 day, C3 day, C4 day, and C5 day in the Jingle sub-basin. These functions were fitted using the maximum likelihood estimation method. In our study, Kolmogorov–Smirnov (K-S) analysis was selected to test if the data follow one of the specified distributions well. The hypothesis is evaluated at the 0.05 significance level. The distribution that passes the significance level test and has the smallest statistical value was selected as the optimal distribution. From the historical rainfall event record, the rainfall events with similar duration were taken as typical rainfall events to obtain the design rainfall process under different duration and different return periods by the fragment method.
It is assumed that the rainfall extreme values of seven sub-periods (P1, P2−1, P3−2, P4−3, P5−4, P6−5, and Pp−6) in the historical measured rainfall events are all combined into one rainfall event so that the rainfall intensity and concentration degree of the composite rainfall were larger.
According to the definition, the mean value (1960–2019) of the C1 day, C2 day, C3 day, C4 day, and C5 day series was obtained (Figure 3). That is, for rainfall events with a duration of less than 24 h, the value to judge whether it is an extreme rainfall event is the total rainfall of it beyond 24.66 mm; for rainfall events lasting 24–48 h, 48–72 h, 72–96 h, and more than 96 h, the judgment criteria are the total rainfall of them beyond 33.33, 37.68, 42.84, and 47.00 mm, respectively.
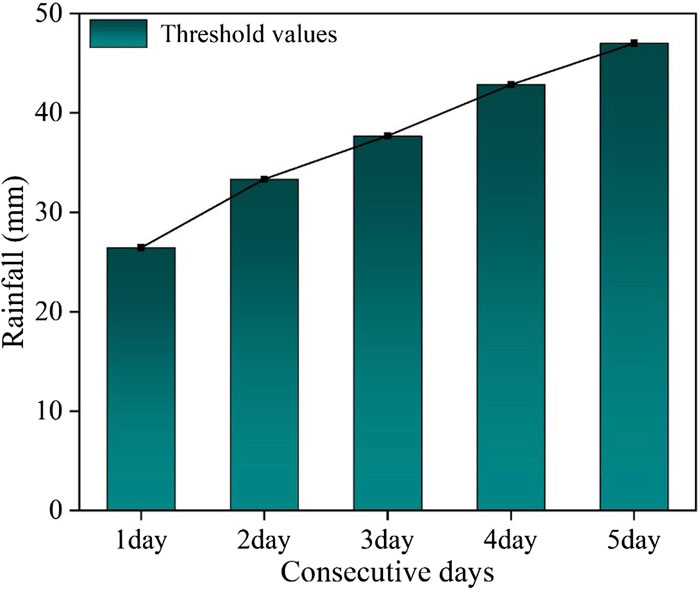
FIGURE 3. 95th percentile threshold of extreme rainfall events with different durations.
Simple linear regression and MK trend analysis show that in the past 55 years, the series of C1 day, C2 day, C3 day, C4 day, and C5 day increased slightly with the rate of 0.5 mm/10a, 0.7 mm/10a, 0.4 mm/10a, 1.1 mm/10a, and 0.6 mm/10a, respectively (Figure 4) (Table 2). The series of C1 day, C2 day, C3 day, C4 day, and C5 day generally had mutation points between 1964 and 2008, but the mutation was not significant (Figure 5).
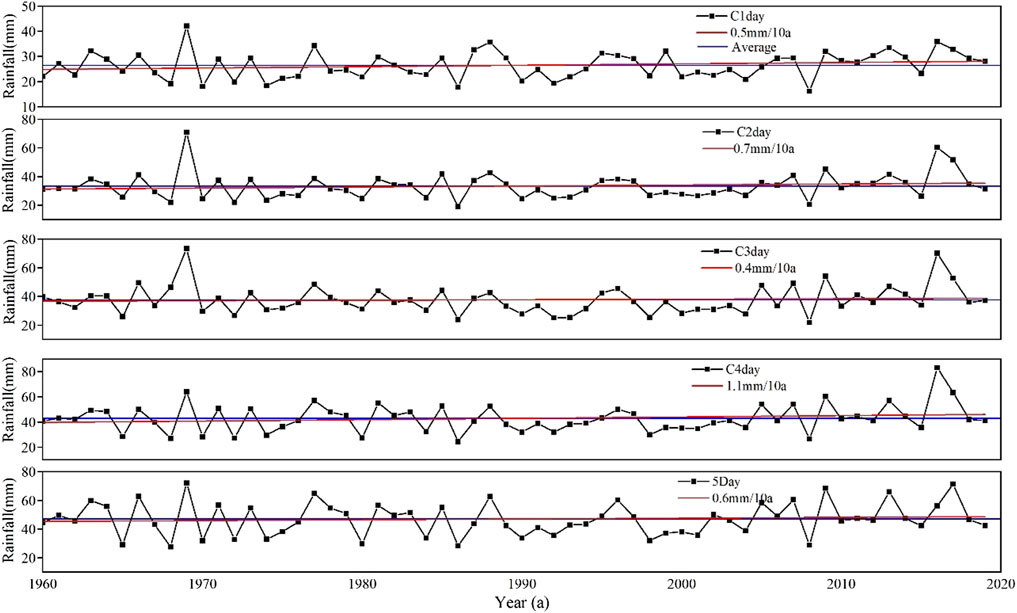
FIGURE 4. Results of simple linear regression analysis.
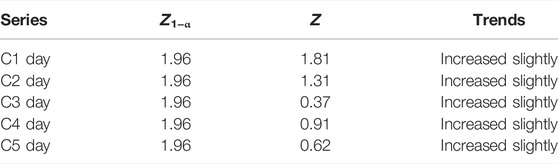
TABLE 2. Result of MK trend analysis.
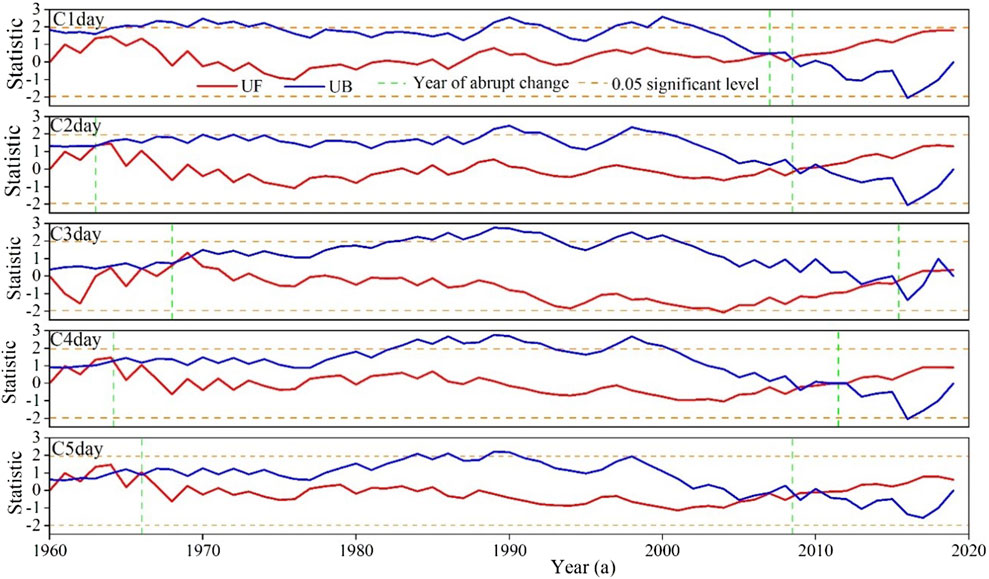
FIGURE 5. Mann–Kendall (MK) mutation test for the series.
To predict future increasing or decreasing trends, we used R/S analysis to calculate the H values of the series of C1 day, C2 day, C3 day, C4 day, and C5 day in the Jingle sub-basin during 1960–2019. The R/S analysis results of the series are shown in Figure 6; it can be seen that the Hurst indices of the series are 0.67, 0.61, 0.71, 0.57, and 0.54, indicating that the persistence of the five series is in the one-to-third intensity grade. The trends of them have a relatively weak persistence.
FIGURE 6. Hurst long-range forecasting for the time series.
Combining the results of the MK trend analysis and R/S analysis, the trend shows slight increments in extreme rainfall of the Jingle sub-basin, with a high likelihood of the trend continuing in the future, assuming the climate and underlying surface conditions remain the same as they were in the current scenario. This indicates that the calculated formula can be fitted using the rainfall–runoff series from 1971 to 2018 to predict the possible incoming flood amount in the future under extreme rainfall events.
For 103 rainfall events and screened extreme rainfall events in the Jingle sub-basin from 1971 to 2018, Pearson’s correlation coefficients between the total rainfall of an event and runoff are 0.77 and 0.83, respectively, indicating that rainfall is more related to runoff in extreme rainfall events. The binomial regression analysis in curve regression can better describe the relationship between rainstorm and runoff. The binomial coefficient in the empirical formula of all rainfall events is smaller than that of extreme rainfall events, indicating that per unit of rainfall yields more runoff in extreme rainfall events (Figure 7).
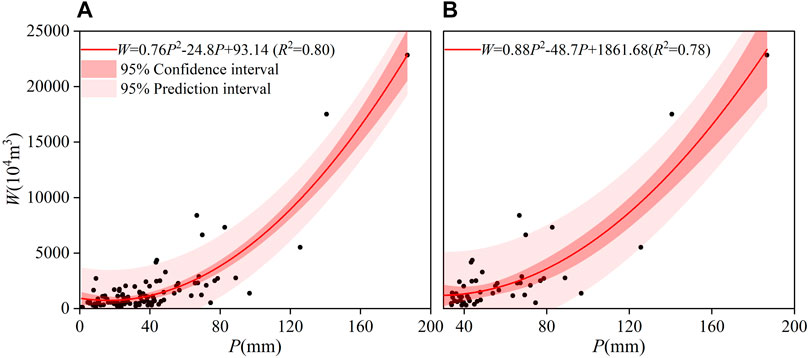
FIGURE 7. Method of sub-rainfall fitting: (A) for all rainfall; (B) for extreme rainfall events.
The rainfall factor combination (PI1) can express the combined effect of rainfall and intensity on water and sediment yield in the watershed. Regression analysis shows that the binomial regression ideally simulates the rainstorm–runoff relationship, the binomial coefficients in the empirical formula of all rainfall events are smaller than those of extreme rainfall events, and it shows that runoff is more sensitive to the change of PI1 in extreme rainfall events (Figure 8). In the study area, under the extreme rainfall event, rainfall factor combination fitting methods are better suited to two types of rainfall: type Ⅰ storms were characterized by a long duration and heavy rainfall amount, whereas type Ⅱ storms had a higher concentration and higher intensities. The rainfall types of the deviation point data on 28 July 1982, 8 July 1985, and 19 August 1973 are intermediate between the first two types, and the rainfall and intensity are lower than both, indicating that the fitting method fits the extreme scenarios better.
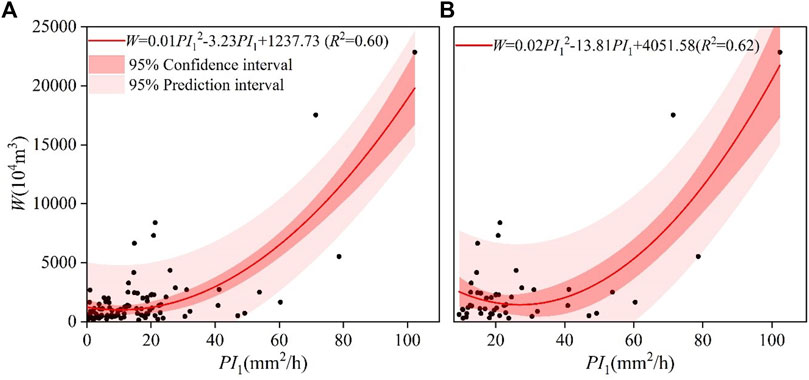
FIGURE 8. Method of rainfall factor combination fitting: (A) for all rainfall; (B) for extreme rainfall events.
When using the rainfall in seven sub-periods (P1, P2−1, P3−2, P4−3, P5−4, P6−5, and Pp−6) as input variables for stepwise regression analysis, these variables are independent of each other. The variance contribution of the seven factors is calculated. Among all rainfall events, only Pp−6 is selected to have a significant impact on the prediction object (Eq. 2). For extreme rainfall events, the most significant factors affecting the prediction object are PP−6 and P2−1 (Eq. 3). Indicating whether it is ordinary rainfall or extreme rainfall, the accumulated rainfall (Pp−6) over a long period contributes significantly to runoff generation. But compared with ordinary precipitation events, the runoff yield in extreme precipitation events is gradually affected by several periods with large rainfall intensity.
The point data on the upper edge of the rainfall–runoff figure were selected to plot the rainfall–runoff upper envelop line. The rainfall of the upper envelop points on 31 August 1995 and 3 August 1996 were 186.71 and 140.65 mm, respectively, and belonged to the type of heavy rainfall with a long duration; on 28 July 1982 and 7 September 1985, they were 82.69 and 69.41 mm, respectively, and were of the concentrated and short duration type. In both types, the upper envelop method performs better (Figure 9).
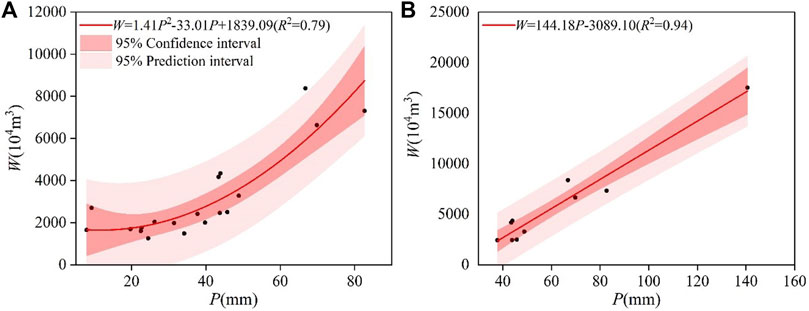
FIGURE 9. Method of upper envelop: (A) for all rainfall; (B) for extreme rainfall events.
To explore the design of extreme rainfall under different durations and different return periods, using normal, gamma, gen gamma, log gamma, generalized extreme value, Gumbel max, and Weibull distribution functions fit the possible distribution of C1 day, C2 day, C3 day, C4 day, and C5 day in the Jingle sub-basin. The optimal distribution and the corresponding parameters estimated by maximum likelihood are shown in Table 3. Table 3 illustrates that the normal, gen gamma (4P), log gamma, gen gamma, and normal distribution were selected as the best fitting distribution of the C1 day, C2 day, C3 day, C4 day, and C5 day, respectively (Figure 10). According to the parameter values of the best fitting distribution provided in Table 3, the value of each design extreme rainfall corresponding to different return periods can be calculated according to needs (Table 3). Figure 11 shows the rainfall process under different duration and different return periods obtained by the fragment method.
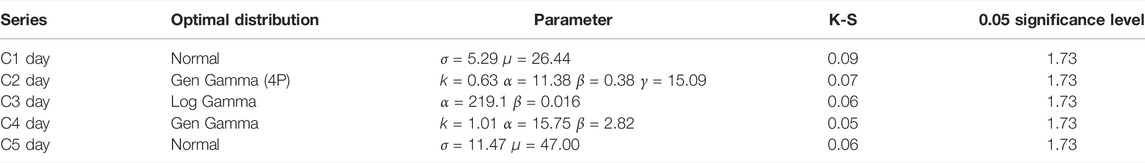
TABLE 3. Optimal distribution of C1 day, C2 day, C3 day, C4 day, and C5 day.
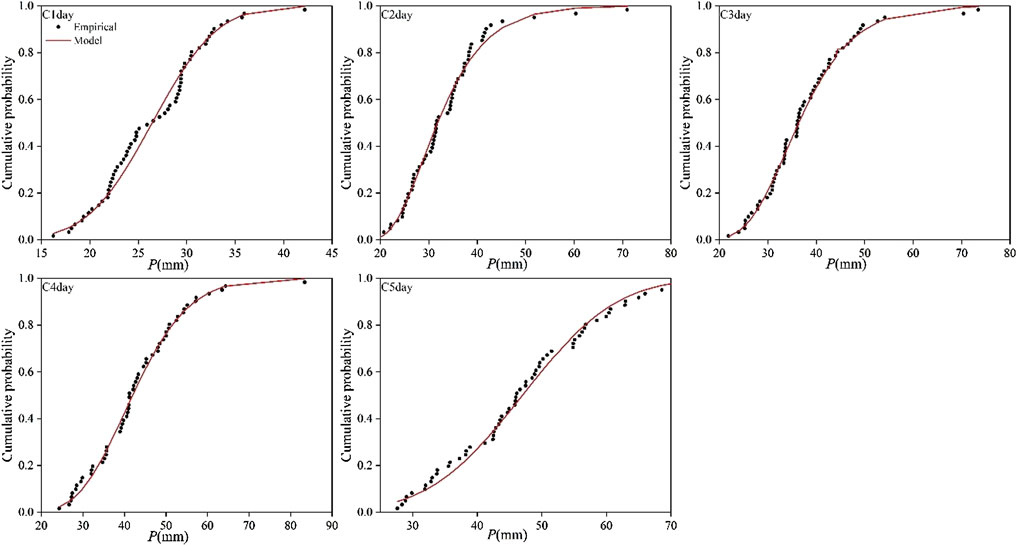
FIGURE 10. Optimal distribution of C1 day, C2 day, C3 day, C4 day, and C5 day.
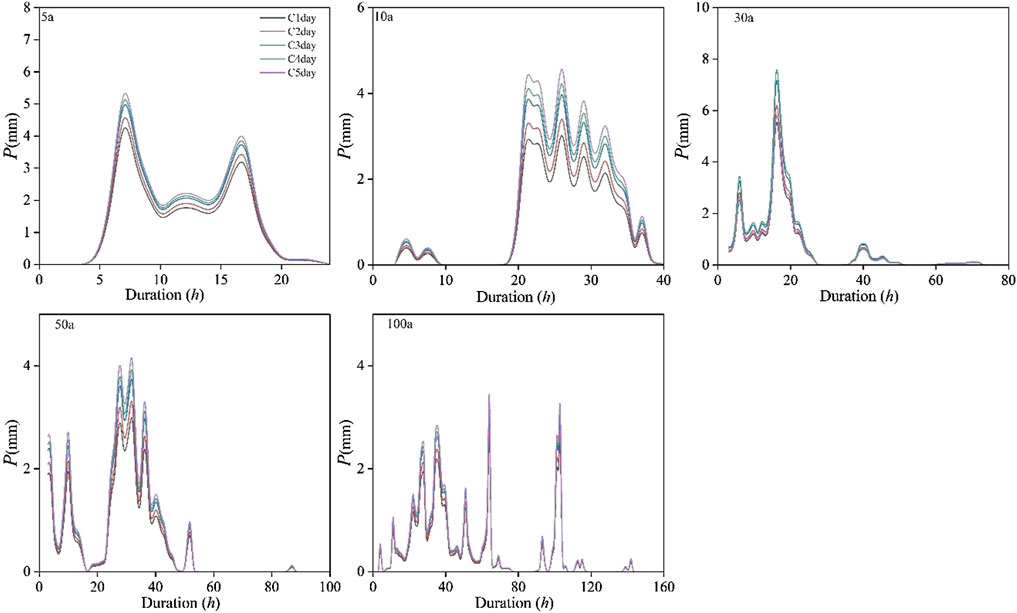
FIGURE 11. Rainfall process under different duration and different return periods.
The extreme values of rainfall in each period corresponding to rainfall events are shown in Table 4. The extreme rainfall in each period was transplanted to the historical maximum rainfall events to obtain the rainfall process under extreme rainfall scenarios.
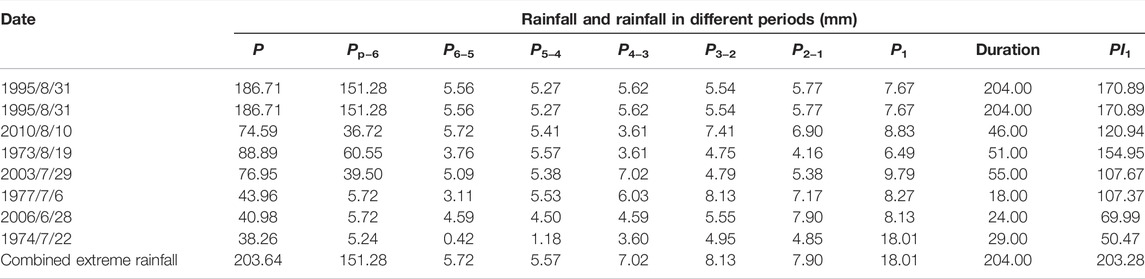
TABLE 4. Extreme rainfall obtained by the method of historical extreme rainfall combination.
The possible incoming flood amount under two extreme rainfall scenarios calculated by established rainfall–runoff empirical formulas is shown in Table 5. Under the same rain pattern, the predicted runoff increased with the increase in the return period. The extreme precipitation of 1–5 consecutive days under the 100a return period designed by the hydrological frequency method is 38.74, 60.01, 66.00, 71.44, and 73.69 mm, respectively, and the possible runoff predicted by the four empirical formulas is 1295−2495, 2108−4935, 2408−5801, and 3051−7062 × 104 m3, respectively. The rainfall designed by the hydrological frequency combination method is 203.64 mm, and the possible runoff predicted by the four runoff prediction calculation formulas is 2.8−5.3 × 10⁸ m3. The runoff predicted by the method of sub-rainfall and rainfall factor combination fitting is close and less than that predicted by the method of sub-rainfall time-segment rainfall fitting and upper envelop. The method of sub-rainfall time-segment rainfall fitting and the upper envelop method are more sensitive to the change of rainfall and increase with the return period.
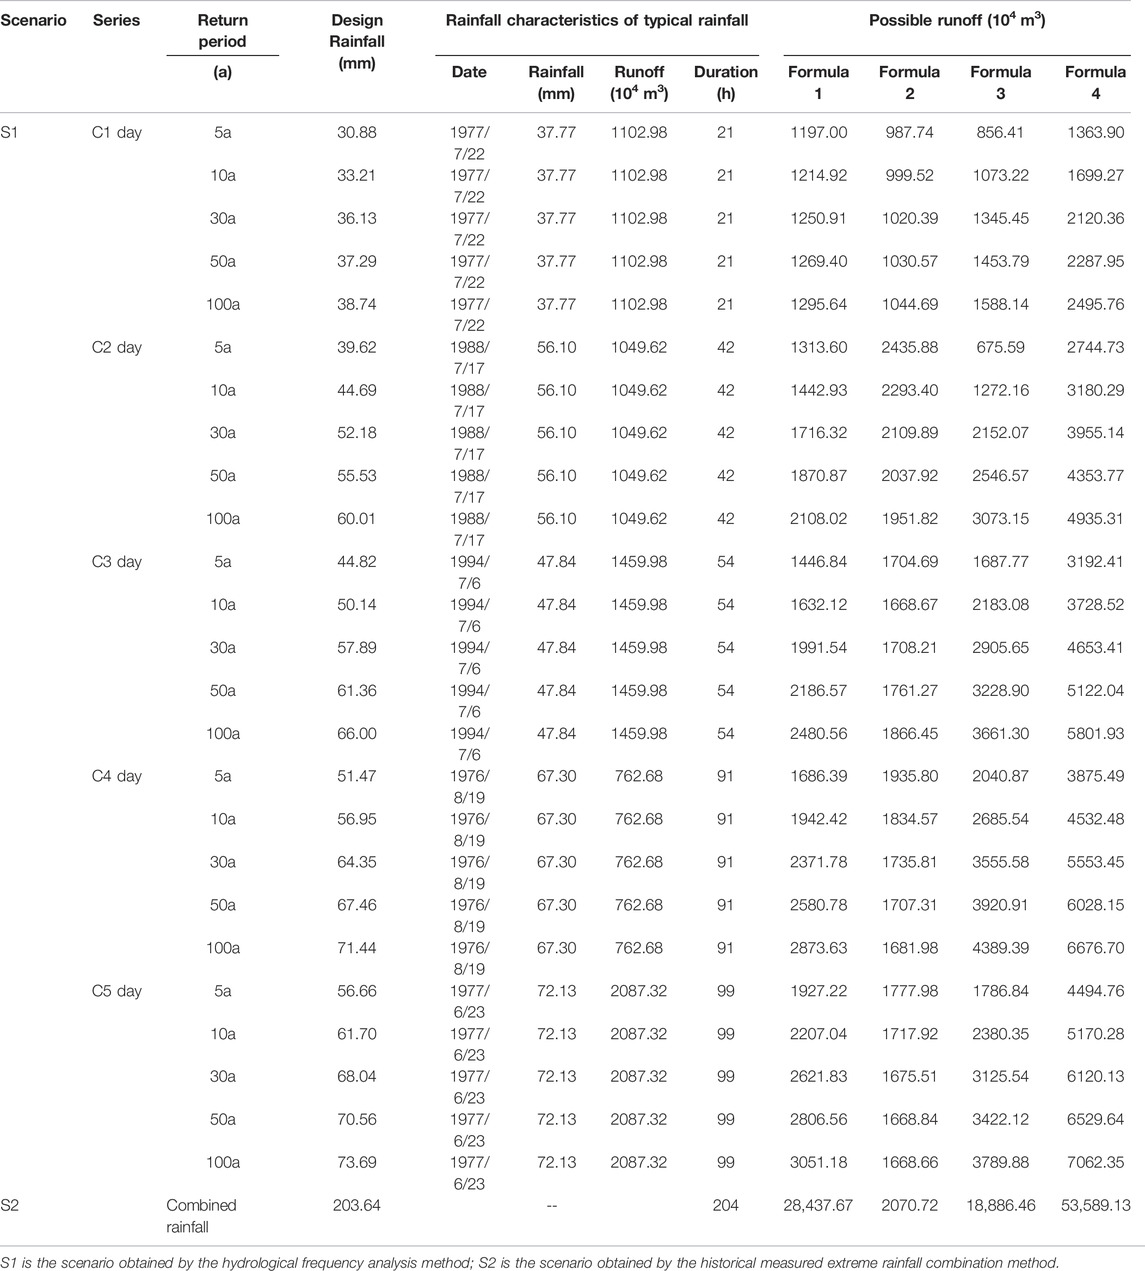
TABLE 5. Possible incoming flood amount under two extreme rainfall scenarios.
In this study, based on the daily precipitation data of the past 6 decades, the study of the 95th percentile threshold of daily to 5 consecutive days of precipitation shows that the trend of extreme precipitation presents a no significant increase. Gao et al., 2015 and Sun et al., 2020 obtained the same result by studying other rainfall indicators. The characteristics of rainfall events such as precipitation, rainfall intensity, and rainfall duration have been demonstrated, which is closely related to the amount of flood (Ran et al., 2012; Adib et al., 2018). For all rainfall events and selected extreme rainfall events, different rainfall factors were selected to establish several runoff prediction formulas, which directly map the relationship between rainfall and runoff and objectively respond to the influence of a variable on water yield. The accuracy of runoff prediction mainly depends on the correlation between selected rainfall factors and runoff (Quilty et al., 2016). Rainfall is the direct source of runoff; it has a high correlation with runoff. There was the closest relationship between rainfall and runoff. Many researchers established empirical hydrological models based on the relationship between rainfall and runoff by using regression analysis, which achieved desirable results (Sharifi et al., 2017; Zeinali et al., 2019). In this study, the correlation coefficient between rainfall and runoff reached 0.85, and the fitting effect was relatively satisfactory (Figure 7). In semi-arid areas, rainfall intensity is particularly important for surface runoff generation (Smith et al., 2010; Yang et al., 2016). The combination of the rainfall factors method integrates the effect of rainfall amount and the maximum 1 h hour intensity on water and sediment yield in the watershed and it has a better fitting effect on the two rainfall types of large amounts, long duration, and high concentration and intensity (Figure 8). This is consistent with the research findings of Huang et al., 2010. The water and sediment yield of most rainstorms in The Loess Plateau Basin is concentrated in a few periods (Zhou and Wang, 1992). In this study, stepwise regression shows whether it is ordinary rainfall or extreme rainfall, and the accumulated rainfall (Pp−6) over a long period contributes greatly to runoff generation. But, compared with ordinary rainfall events, the runoff yield in extreme precipitation events is gradually affected by several periods with large rainfall intensity. This phenomenon is more obvious in a rainstorm (Li et al., 2016). The upper envelop method considers the extreme cases under the rainfall–runoff event. (Figure 9). The four formulas all show that there is a more significant correlation between rainfall factors and runoff under extreme rainfall events. The relationship between rainfall characteristics and runoff generation increases with the increase in rainfall level and intensity (Zhang et al., 2020; Jonathan et al., 2021). Although the characteristics of a rainfall event are closely related to the amount of flood, it seems that this relationship is more obvious in extreme rainfall events. So, it is necessary to study the relationship between extreme rainfall events and runoff alone, and it is of great significance for the sustainable utilization of water resources and flood control and disaster reduction in the basin.
Based on the daily precipitation data of the past 6 decades, the trend characteristics of the 95th percentile extreme precipitation (daily to 5 consecutive days of precipitation) were studied. Moreover, different rainfall factors were selected to establish several runoff prediction formulas for all rainfall events and selected extreme rainfall events and then the empirical formulas were combined with designed extreme rainfall scenarios to predict the possible incoming flood. It can provide a reference for water security and major project deployment in the basin.
The main findings of the present study are summarized as follows: the 95th percentile extreme precipitation (daily to 5 consecutive days of precipitation) of the Jingle sub-basin presents a slight increased trend and has positive consistency. Combining the results of MK and R/S, the extreme precipitation in this basin will maintain a slight rising trend in the future, assuming that the climate and underlying conditions remain the same as they were in the current scenario. There is a more stable correlational relationship between rainfall factors (P, PI, seven sub-periods) and runoff in extreme rainfall events. The extreme precipitation of 1–5 consecutive days under the 100a return period designed by the hydrological frequency method is 38.74, 60.01, 66.00, 71.44, and 73.69 mm, respectively, and the possible runoff predicted by the four empirical formulas is 1295−2495, 2108−4935, 2408−5801, and 3051−7062 × 104 m3, respectively. The rainfall designed by the hydrological frequency combination method is 203.64 mm, and the possible runoff predicted by the four empirical formulas is 2.8−5.3 × 10⁸ m3. Although the characteristics of rainfall events are closely related to the amount of flood, it seems that this relationship is more obvious in extreme rainfall events. So, it is necessary to study the relationship between extreme rainfall events and runoff alone, and it is of great significance for the sustainable utilization of water resources and flood control and disaster reduction in the basin.
The raw data supporting the conclusions of this article will be made available by the authors, without undue reservation.
SJ development or design of methodology and creation of models. CY application of statistical, mathematical, computational, or other formal techniques to analyze or synthesize study data. YW verification. XY and YL acquisition of data.
This project was supported by the Natural Science Foundation of Henan Province (212300410413), the Young Talents Promotion Project of Henan Province (2021HYTP030), and the China Postdoctoral Science Foundation (2020M672247); State Key Laboratory of Soil Erosion and Dryland Farming on the Loess Plateau Foundation (A314021402-2021011).
The authors declare that the research was conducted in the absence of any commercial or financial relationships that could be construed as a potential conflict of interest.
The reviewer HW declared a shared affiliation with the authors JS, YC, and WY to the handling editor at the time of review
All claims expressed in this article are solely those of the authors and do not necessarily represent those of their affiliated organizations, or those of the publisher, the editors, and the reviewers. Any product that may be evaluated in this article, or claim that may be made by its manufacturer, is not guaranteed or endorsed by the publisher.
Adib, A., Lotfirad, M., and Haghighi, A. J. (2018). Using Uncertainty and Sensitivity Analysis for Finding the Best Rainfall-Runoff Model in Mountainous Watersheds (Case Study: the Navrood Watershed in Iran). J. Mt. Sci. 16 (3), 529–543. doi:10.1007/s11629-018-5010-6
Barlow, M., Gutowski, W. J., Gyakum, J. R., Katz, R. W., Lim, Y.-K., Schumacher, R. S., et al. (2019). North American Extreme Precipitation Events and Related Large-Scale Meteorological Patterns: a Review of Statistical Methods, Dynamics, Modeling, and Trends. Clim. Dyn. 53 (11), 6835–6875. doi:10.1007/s00382-019-04958-z
Dang, S., Liu, X., Yin, H., and Guo, X. (2020). Prediction of Sediment Yield in the Middle Reaches of the Yellow River Basin under Extreme Precipitation. Front. Earth Sci. 8, 542686–542699. doi:10.3389/feart.2020.542686
de Lima, J. L. M. P., Tavares, P., Singh, V. P., and de Lima, M. I. P. (2009). Investigating the Nonlinear Response of Soil Loss to Storm Direction Using a Circular Soil Flume. Geoderma 152 (1–2), 9–15. doi:10.1016/j.geoderma.2009.05.004
Galelli, S., and Castelletti, A. (2013). Assessing the Predictive Capability of Randomized Tree-Based Ensembles in Streamflow Modelling. Hydrol. Earth Syst. Sci. 17 (7), 2669–2684. doi:10.5194/hess-17-2669-2013
Gao, Y., Feng, Q., Liu, W., Lu, A. G., Wang, Y., and Yang, J. (2015). Changes of Daily Climate Extremes in Loess Plateau during 1960–2013. Quat. Int. 371, 5–21. doi:10.1016/j.quaint.2014.08.052
Gökbulak, F., Şengönül, K., Serengil, Y., Yurtseven, İ., Özhan, S., Cigizoglu, H. K., et al. (2015). Comparison of Rainfall-Runoff Relationship Modeling Using Different Methods in a Forested Watershed. Water Resour. Manag. 29 (12), 4229–4239. doi:10.1007/s11269-015-1056-1
Hao, G., Li, J., Song, L., Li, H., and Li, Z. (2018). Comparison between the TOPMODEL and the Xin’anjiang Model and Their Application to Rainfall Runoff Simulation in Semi-humid Regions. Environ. Earth Sci. 77 (7), 279. doi:10.1007/s12665-018-7477-4
Huang, Z., OuYang, Z., Li, F., Zheng, H., and Wang, X. (2010). Response of Runoff and Soil Loss to Reforestation and Rainfall Type in Red Soil Region of Southern China. J. Environ. Sci. 22 (11), 1765–1773. doi:10.1016/s1001-0742(09)60317-x
Jonathan, F., Frederik, K., Daniel, K., Martin, G., Guy, S., and Oren, G. (2021). Deep Learning Rainfall-Runoff Predictions of Extreme Events. Hydrology Earth Syst. Sci. 91, 179–199. doi:10.5194/hess-2021-423
Li, F., Tang, G., Wang, C., Cui, L., and Zhu, R. (2016). Slope Spectrum Variation in a Simulated Loess Watershed. Front. Earth Sci. 10 (2), 328–339. doi:10.1007/s11707-015-0519-2
Li, W., Yang, M., Liang, Z., Zhu, Y., Mao, W., Shi, J., et al. (2013). Assessment for Surface Water Quality in Lake Taihu Tiaoxi River Basin China Based on Support Vector Machine. Stoch. Environ. Res. Risk Assess. 27 (8), 1861–1870. doi:10.1007/s00477-013-0720-3
Liu, X. Y., Dang, S. Z., and Gao, Y. F. (2019). Sediment Yield of Current Underlying Surface under Simulated Extreme Rainstorm in Middle Reaches of Yellow River Basin. Trans. Chin. Soc. Agric. Eng. 35 (11), 131–138. doi:10.11975/j.issn.1002-6819.2019.11.015
Manfreda, S., Iacobellis, V., Gioia, A., Fiorentino, M., and Kochanek, K. (2018). The Impact of Climate on Hydrological Extremes. Water 10 (6), 802–805. doi:10.3390/w10060802
Qamar, M. U., Azmat, M., Cheema, M. J. M., Shahid, M. A., Khushnood, R. A., and Ahmad, S. (2016). Model Swapping: A Comparative Performance Signature for the Prediction of Flow Duration Curves in Ungauged Basins. J. Hydrology 541, 1030–1041. doi:10.1016/j.jhydrol.2016.08.012
Qi, L., Wang, D. W., Zhang, Y. L., and Wang, L. (2021). Flood Simulation Analysis of the Biliu River Basin Based on the MIKE Model. Complexity 10. doi:10.1155/2021/8827046
Quilty, J., Adamowski, J., Khalil, B., and Rathinasamy, M. (2016). Bootstrap Rank-Ordered Conditional Mutual Information (broCMI): A Nonlinear Input Variable Selection Method for Water Resources Modeling. Water Resour. Res. 52 (3), 2299–2326. doi:10.1002/2015wr016959
Ran, Q., Su, D., Li, P., and He, Z. (2012). Experimental Study of the Impact of Rainfall Characteristics on Runoff Generation and Soil Erosion. J. Hydrology 424-425 (6), 99–111. doi:10.1016/j.jhydrol.2011.12.035
Seckin, N., Cobaner, M., Yurtal, R., and Haktanir, T. (2013). Comparison of Artificial Neural Network Methods with L-Moments for Estimating Flood Flow at Ungauged Sites: the Case of East Mediterranean River Basin, Turkey. Water Resour. Manage 27, 2103–2124. doi:10.1007/s11269-013-0278-3
Sharifi, A., Dinpashoh, Y., and Mirabbasi, R. (2017). Daily Runoff Prediction Using the Linear and Non-linear Models. Water Sci. Technol. 76 (4), 793–805. doi:10.2166/wst.2017.234
Shi, J., Cui, L., Wen, K., Tian, Z., Wei, P., and Zhang, B. (2018). Trends in the Consecutive Days of Temperature and Precipitation Extremes in China during 1961-2015. Environ. Res. 161, 381–391. doi:10.1016/j.envres.2017.11.037
Shi, J., Wen, K., and Cui, L. (2016b). Patterns and Trends of High-Impact Weather in China during 1959-2014. Nat. Hazards Earth Syst. Sci. 16, 855–869. doi:10.5194/nhess-16-855-2016
Smith, M. W., Bracken, L. J., and Cox, N. J. (2010). Toward a Dynamic Representation of Hydrological Connectivity at the Hillslope Scale in Semiarid Areas. Water Resour. Res. 46 (12), 65–74. doi:10.1029/2009wr008496
Sun, C., Huang, G., and Fan, Y. (2020). Multi-Indicator Evaluation for Extreme Precipitation Events in the Past 60 Years over the Loess Plateau. Water 12 (1), 193. doi:10.3390/w12010193
Sun, Q., Miao, C., Duan, Q., and Wang, Y. (2015). Temperature and Precipitation Changes over the Loess Plateau between 1961 and 2011, Based on High-Density Gauge Observations. Glob. Planet. Change 132, 1–10. doi:10.1016/j.gloplacha.2015.05.011
Tan, X., Wu, X., and Liu, B. (2021). Global Changes in the Spatial Extents of Precipitation Extremes. Environ. Res. Lett. 16 (5), 054017. doi:10.1088/1748-9326/abf462
Teng, F., Huang, W., and Ginis, I. (2017). Hydrological Modeling of Storm Runoff and Snowmelt in Taunton River Basin by Applications of HEC-HMS and PRMS Models. Nat. Hazards 91, 179–199. doi:10.1007/s11069-017-3121-y
Visessri, S., and McIntyre, N. (2016). Regionalisation of Hydrological Responses under Land-Use Change and Variable Data Quality. Hydrological Sci. J. 61 (2), 302–320. doi:10.1080/02626667.2015.1006226
Wang, Y., Guo, S., Chen, H., and Zhou, Y. (2014). Comparative Study of Monthly Inflow Prediction Methods for the Three Gorges Reservoir. Stoch. Environ. Res. Risk Assess. 28 (3), 555–570. doi:10.1007/s00477-013-0772-4
Westra, S., Alexander, L. V., and Zwiers, F. W. (2013). Global Increasing Trends in Annual Maximum Daily Precipitation. J. Clim. 26 (11), 3904–3918. doi:10.1175/jcli-d-12-00502.1
Wu, J., Zheng, H., and Xi, Y. (2019). SWAT-based Runoff Simulation and Runoff Responses to Climate Change in the Headwaters of the Yellow River, China. Atmosphere 10, 509. doi:10.3390/atmos10090509
Wu, S., Hu, Z., Wang, Z., Cao, S., Yang, Y., Qu, X., et al. (2021). Spatiotemporal Variations in Extreme Precipitation on the Middle and Lower Reaches of the Yangtze River Basin (1970-2018). Quat. Int. 592, 80–96. doi:10.1016/j.quaint.2021.04.010
Yang, T., Wang, Q., Su, L., Wu, L., Zhao, G., Liu, Y., et al. (2016). An Approximately Semi-analytical Model for Describing Surface Runoff of Rainwater over Sloped Land. Water Resour. Manage 30 (11), 3935–3948. doi:10.1007/s11269-016-1400-0
Zeinali, V., Vafakhah, M., and Sadeghi, S. H. (2019). ‘Impact of Urbanization on Temporal Distribution Pattern of Storm Runoff Coefficient. Environ. Monit. Assess. 191 (9), 595. doi:10.1007/s10661-019-7734-3
Zhang, J. P., Zhang, H., Xiao, H. L., and Fang, H. Y. (2020). Effects of Rainfall and Runoff-Yield Conditions on Runoff. Ain Shams Eng. J. 12, 2111–2116. doi:10.1016/j.asej.2020.10.010
Zhang, Y., Chiew, F. H. S., Li, M., and Post, D. (2018). Predicting Runoff Signatures Using Regression and Hydrological Modeling Approaches. Water Resour. Res. 54 (10), 7859–7878. doi:10.1029/2018wr023325
Zhao, Y., Liu, B., Zhang, X. M., and Bao, S. Z. (2020). Study on Flood and Sediment Yield under Extreme Precipitation in the Wuding River Basin of the Yellow River. J. Sediment Res. 45 (06), 47–52. doi:10.16239/j.cnki.0468-155x.2020.06.008
Keywords: extreme rainfall event, rainfall event, jingle sub-basin, runoff prediction, regression analysis
Citation: Jian S, Yin C, Wang Y, Yu X and Li Y (2022) The Possible Incoming Runoff Under Extreme Rainfall Event in the Fenhe River Basin. Front. Environ. Sci. 10:812351. doi: 10.3389/fenvs.2022.812351
Received: 15 November 2021; Accepted: 20 April 2022;
Published: 01 June 2022.
Edited by:
Chuanfu Zang, South China Normal University, ChinaReviewed by:
Peng Shouzhang, Northwest A&F University, ChinaCopyright © 2022 Jian, Yin, Wang, Yu and Li. This is an open-access article distributed under the terms of the Creative Commons Attribution License (CC BY). The use, distribution or reproduction in other forums is permitted, provided the original author(s) and the copyright owner(s) are credited and that the original publication in this journal is cited, in accordance with accepted academic practice. No use, distribution or reproduction is permitted which does not comply with these terms.
*Correspondence: Shengqi Jian, amlhbnNxQHp6dS5lZHUuY24=
Disclaimer: All claims expressed in this article are solely those of the authors and do not necessarily represent those of their affiliated organizations, or those of the publisher, the editors and the reviewers. Any product that may be evaluated in this article or claim that may be made by its manufacturer is not guaranteed or endorsed by the publisher.
Research integrity at Frontiers
Learn more about the work of our research integrity team to safeguard the quality of each article we publish.