 Xiaojing Zhao
 Guoqu Deng1
94% of researchers rate our articles as excellent or good
Learn more about the work of our research integrity team to safeguard the quality of each article we publish.
Find out more
ORIGINAL RESEARCH article
Front. Environ. Sci. , 25 February 2022
Sec. Interdisciplinary Climate Studies
Volume 10 - 2022 | https://doi.org/10.3389/fenvs.2022.808565
The current article aimed to characterize the spatial–temporal characteristics and the driving factors of disaster-induced grain yield loss. Taking the world’s largest agricultural country, China, as the research object, this study evaluated China’s disaster-induced grain yield loss from 1978 to 2019 and investigated the contribution of three driving factors, using a logarithmic mean Divisia index (LMDI) approach. The results showed that drought and flood were the main disasters causing grain yield losses in China. China’s grain disaster loss peaked in 2000 and then entered a declining period. In terms of spatial distribution, disaster-induced grain yield loss mainly concentrated in the regions including the Middle-Lower Yangtze region, the Huang-Huai-Hai region, and Northeast China. The gravity center of disaster-induced grain yield loss shifted northward in China. Disaster intensity contributed the most to change in disaster-induced grain yield loss, followed by yield loss density, and the grain planting area. Thus, addressing drought and flood disasters, and enhancing disaster prevention and reduction capacity are critical to reduce disaster-induced grain yield loss, especially in the Middle-Lower Yangtze, the Huang-Huai-Hai region, and Northeast China.
Food security is a cornerstone for global sustainable development (Liu et al., 2021) and is listed as the second of the United Nations’ 17 sustainable development goals (SDGs) for 2030 (United Nations, 2016). However, the accelerating climate change has caused frequent natural disasters in recent decades, resulting in severe grain yield loss and significantly threatening food security on local and global levels (Lesk et al., 2016; Abid et al., 2019; Elahi et al., 2021a; Shi et al., 2021). According to the report from the Food and Agriculture Organization, agriculture experienced 63% of the disasters’ impact, with the least developed countries and low- and middle-income countries experiencing the greatest impact of more than 108 billion US dollars for the period 2008–2018 (Food and Agriculture Organization of the United Nations, 2016).
China is the world’s most populous developing country, the world’s largest food producer and consumer (Cao et al., 2021), and one of the most vulnerable countries to disasters (Abd El-Wahab et al., 2018; Guo et al., 2019; Li et al., 2019; Ma et al., 2020). China has experienced severe risks in grain-producing areas caused by natural disasters (Peng et al., 2021). These disasters, which included floods, drought, storm and hail, low temperatures, and typhoons, impacted greatly on China’s grain production (Chen et al., 2013; Guan et al., 2015; Du, 2020; Xu and Tang, 2021). In 2009, China’s disaster-induced grain yield loss accounted for 10.4% of the total grain yield (Wang and Li, 2012). It was estimated that in July 2021, a typhoon affected 14.5 million people in 150 counties in Henan, a major grain-producing province in China, and led to a grain yield loss of 2.053 million tons (Mei, 2021).
Natural disasters have partially or completely damaged crop production, making it difficult for China to maintain the food self-sufficiency rate of 95% specified in China’s new food security strategy (Ghose, 2014). Thus, it is imperative to understand the adverse impact of disasters on China’s grain yield and the driving forces of grain yield loss.
Grain yield loss is defined as a comprehensive indicator to measure the constraint that natural disasters imposed on grain production (Zhang et al., 2013; Zhang et al., 2014). To assess grain yield loss, two methods were widely applied, namely, process-based crop models and statistical models (De Wit, 1965; Zheng and Huang, 1998; Rosenzweig et al., 2002; Lobell et al., 2006; Pathak, 2006; Wang et al., 2013). Process-based crop models revealed the mechanisms of grain yield loss (Zhang et al., 2012; Glotter and Elliott, 2016; Cao et al., 2020; Leng, 2021), but the accuracy was relatively low. This was because process-based crop models integrated not all crop characteristics and key processes related to disasters (Challinor et al., 2018), and models that simulated the response of single factor were the most common (Lobell and Asseng, 2017).
By contrast, statistical models were not conducive to explain the potential mechanism of grain yield loss. However, they directly expressed the risk of disasters because statistical models included the ultimate impact of all disaster factors, crop characteristics and human intervention, and easy to implement (Lobell and Asseng, 2017). Statistical models mainly included the yield decomposition method and yield reduction apportionment method (Zhao et al., 2017; Kim et al., 2019). The yield decomposition method decomposed the crop pure yield into disaster-induced loss and trending yield. However, the trending yield resulted in a huge difference by using different methods (Zhang, 2004; Li et al., 2008; Hu, 2016; Zhang et al., 2018; Zhu et al., 2020; Li et al., 2021), while the yield reduction apportionment method calculated the disaster-induced grain yield loss according to fixed yield reduction proportions of the areas experiencing different degrees of disasters (Zhang et al., 2009; Gao et al., 2012; Wen et al., 2017; Xiao et al., 2017; Guo et al., 2019; Yu et al., 2019). Based on the harvest yield, this method eliminated differences in crop varieties and disaster resistance of crop at different growth stages (Gong and Zhang, 2010), and it is also used by the Ministry of Agriculture, the Ministry of Civil Affairs, and the National Bureau of Statistics in China.
Investigating the determining factors of disaster-induced grain yield loss is also a major concern. Most of the previous studies investigated the factors of disaster-induced grain yield loss by means of sensitivity analysis, regressive models, and gray relational analysis. Based on sensitivity analysis, Wang et al. (2020) found that severe drought increased the yield loss rates of soybean and maize in Northeast China by more than one and four times, respectively, compared with moderate drought (Wang et al., 2020). Based on multiple linear regression analysis, Zhang et al. (2018) concluded that compared with the covered and no harvest areas, the affected area posed the greatest impact on the disaster-induced grain yield loss in the Middle-Lower Yangtze (Zhang et al., 2018). Based on gray relational analysis, Luan and Zhou (2016) found that the relational degree of the drought-affected area on disaster-induced grain yield loss was the greatest (Luan and Zhou 2016). In addition, the grain planting area was found to be one of the factors influencing disaster-induced grain yield loss (Li et al., 2010). The adverse effect of natural disasters was mitigated by adjusting grain planting area (Qiao et al., 2018). Disaster-bearing bodies have natural and social attributes. The fluctuations in agricultural production were also affected by external and internal environmental factors (Elahi et al., 2018; Elahi et al., 2019; Elahi et al., 2020; Elahi et al., 2021b).
The above studies were undoubtedly meaningful to understand the factors affecting the grain yield loss caused by disasters. However, quantitative analyses decomposing change in disaster-induced grain yield loss into a variety of driving factors are rarely presented. Index decomposition analysis (IDA) is a decomposition approach used to identify the key factors affecting the target variable by measuring the contribution of each factor (Ang, 2005; Chen et al., 2021). The most popular submodel of IDA is the logarithmic mean Divisia index (LMDI) model raised by Ang (Ang et al., 1998; González et al., 2014; Ang, 2015; Nzudie et al., 2021). In recent years, LMDI has been applied extensively in the fields of grain and crop production (Jin and Lu, 2011; Liu et al., 2014; Hua, 2016; Ge and Si, 2020; Lyu and Xu, 2020). By using LMDI, Blomqvist et al. (2020) found that pure yield contributed the most (nearly two-thirds of aggregate yield improvements), compared with the other drivers, including the cropland area, cropping intensity, country share, and crop composition (Blomqvist et al., 2020). In China, the LMDI was employed to decompose the changes in grain output into yield effect, area effect, crop-mix effect, and spatial distribution effect, with the contribution of pure yield showing a decreasing trend over time (Li et al., 2016). However, there was still no research using an LMDI approach to analyze the underlying factors that affected changes in disaster-induced grain yield loss.
The study used the LMDI decomposition method to investigate the factors influencing disaster-induced grain yield loss in China between 1978 and 2019. The main contributions of this study were as follows: 1) The yield reduction apportionment method was applied to estimate disaster-induced grain yield loss. Then the spatial–temporal characteristics of China’s disaster-induced grain yield loss were discussed by using a time-series change curve and standard deviation ellipse (SDE) 2) By constructing an identity equation for disaster-induced grain yield loss, this study incorporated three driving factors into analysis framework, including yield loss density, disaster intensity, and grain planting area 3) Based on the LMDI, the contributions of the driving factors to the changes in disaster-induced grain yield loss were analyzed.
In this study, China’s 31 provinces, autonomous regions, and municipalities were included (Hong Kong, Taiwan, and Macao were excluded due to no availability of data). To investigate the inter-regional differences in the driving factors of disaster-induced grain yield loss, 31 provinces, autonomous regions, and municipalities were divided into nine agricultural regions: Northeast China, Huang-Huai-Hai, Loess Plateau, Gan-Xin, Inner Mongolia, Southwestern China, the Middle-Lower Yangtze, South China, and Qinghai–Tibet. This approach was consistent with other studies (Pan et al., 2020; Li et al., 2021). The disasters included flood, drought, storm and hail, low temperature, and typhoon. In this paper, the data of covered area, affected area, and “no harvest” area were obtained from the China Agriculture Statistical Report; grain planting area, crop planting area, and grain yield per unit area were obtained from the China Statistical Yearbook. Referring to relevant studies (Xiao et al., 2017), the missing and wrong data were complemented by interpolation method.
The covered, affected, and no harvest areas caused by disasters are the most commonly used indicators in the statistical data of China (“covered area”: the area with a reduction of more than 10% of grain output caused by mild disasters; “affected area”: the area with a reduction of more than 30% of grain output caused by moderate disasters; “no harvest” area: the area with a reduction of more than 80% of grain output caused by severe disasters). According to the yield reduction apportionment method (Zhang et al., 2009; Xu and Zhang, 2011; Zhu et al., 2015; Wen et al., 2017), the disaster-induced grain yield loss is calculated as follows:
Among them, subscripts
By using the ratio of covered area to sown area, the changes in disasters in China during 1990–2011 were discussed (Du et al., 2015). However, using certain indicators alone, namely, the covered area, affected area, or “no harvest” area, cannot effectively describe the evolutionary characteristics of natural disasters (Li et al., 2010; Zhao et al., 2017). This paper constructs a disaster intensity index to assess the comprehensive impact of disasters on grain yield.
where
The LMDI model was proposed by Ang based on the Divisia index decomposition method (Ang, 2005). The LMDI decomposition method has the advantages of complete decomposition, factor reversibility, and can produce consistent decomposition results (Ang, 2015). Thus, LMDI was widely used as an important research method in energy and environmental science (Guan et al., 2018; Pei et al., 2021), and was introduced into the field of crop production research in recent years (Xu et al., 2021). According to the principle of LMDI, the disaster-induced grain yield loss is decomposed into the three determinants as follows:
where
Incorporating Eq. 3 with the LMDI method, the change in disaster-induced grain yield loss can be divided into grain yield loss effect (
According to the LMDI addition decomposition principle, the three effects are calculated as follows:
Note that:
Figure 1 shows the disaster-induced grain yield loss from 1978 to 2019 in China. During 1978–2019, China experienced a disaster-induced grain yield loss of 32.35 × 10⁶ tons annually (6.7% of grain output), which can feed approximately 80.88 million people a year. Based on grain yield loss, the disasters were in descending order: drought, flood, storm and hail, low-temperature, other disasters, and typhoons. This further confirmed the fact that drought and flood were the most serious disasters in China (Zhang et al., 2014; Guan et al., 2015; Zhao et al., 2017).

FIGURE 1. China’s disaster-induced grain yield loss from 1978 to 2019.
The year 2000 was an important cutoff point for the change in disaster-induced grain yield loss in China, which further confirmed the previous research (Hu, 2016). Between 1978 and 2000, disaster-induced grain yield loss showed increasing trend, rising from 24.45 × 10⁶ to 50.04 × 10⁶ tons (2.14 times of that in 1978). The floods in 1991 and 1998 caused more than 50% of disaster-induced grain yield loss. After 2000, due to the implementation of effective flood disaster prevention plan (Ali et al., 2020), the flood-induced grain yield loss decreased significantly. In 2000, China experienced the most serious drought during the period (76.98% of the total loss in that year). In contrast, between 2000 and 2019, disaster-induced grain yield loss rapidly decreased to 19.76 × 10⁶ tons. Since 2000, the adjustment of agricultural policies and popularization of agricultural mechanization mitigated the impact of disasters to some extent. Moreover, favorable natural conditions had a positive impact on grain production (Holst et al., 2013; Zhu et al., 2013) (Figure 1).
Considering the variations in China’s grain yield loss, it was divided into eight stages: 1978–1984, 1984–1990, 1990–1995, 1995–2000, 2000–2004, 2004–2012, 2012–2017, and 2017–2019. Before 2000, grain yield loss increased, with the exception of a stage of slight decrease (5.88%) from 1978 to 1984. From 1984 to 1990, grain yield loss increased by 5.62 × 10⁶ tons (25.48%). From 1990 to 1995, grain yield loss increased by 7.97 × 10⁶ tons (28.83%). From 1995 to 2000, the increase of grain yield loss reached 14.41 × 10⁶ tons (40.45%), which was the largest increase in all stages. However, grain yield loss decreased by 22.55 × 10⁶ tons (45.07%) from 2000 to 2004. From 2004 to 2012, grain yield loss decreased by 6.56 × 10⁶ tons (23.87%). From 2012 to 2017, grain yield loss decreased by 3.22 × 10⁶ tons (12.86%). From 2017, grain yield loss increased by 2.20 × 10⁶ tons (12.08%).
Figure 2 shows the spatial distributions of disaster-induced grain yield loss, disaster intensity, yield loss density, and grain planting area in the nine agricultural regions of China. The Middle-Lower Yangtze, Huang-Huai-Hai region, and Northeast China experienced the most of grain yield loss, accounting for 66.55% of total grain yield loss (Figure 2A). Before 2000, grain yield loss occurred mainly in the Middle-Lower Yangtze and the Huang-Huai-Hai region. After 2000, there was a significant decrease in the two regions; however, there was increasing trend of grain yield loss in Northeast China. The gaps of grain yield loss between Northeast China and the above two regions were obviously widened after 2014. Overall, Northeast China became the area with the greatest grain yield loss over time.
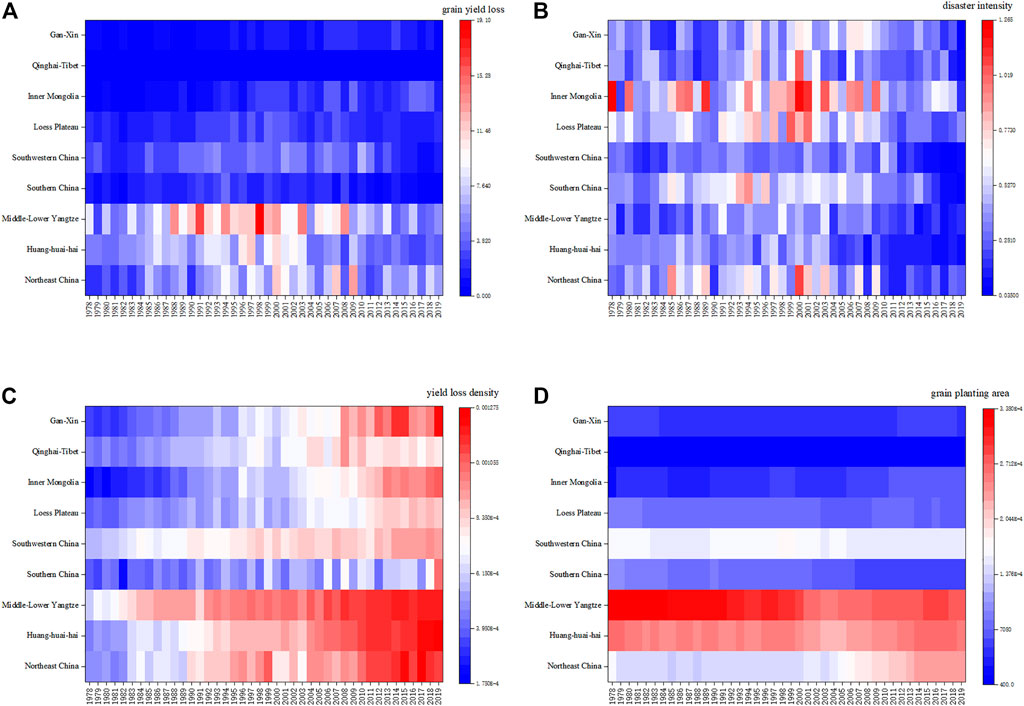
FIGURE 2. Disaster-induced grain yield loss and the driving factors in nine agricultural regions of China from 1978 to 2019. (A) represents the grain yield loss, (B) represents the disaster intensity, (C) represents the yield loss density, and (D) represents the grain planting area.
There were significant differences in disaster intensity among the nine agricultural regions (Figure 2B). Inner Mongolia, Loess Plateau, South China, and Northeast China had the highest disaster intensity levels, followed by the Gan-Xin and Qinghai–Tibet. The disaster intensity was lowest in the Middle-Lower Yangtze, Huang-Huai-Hai, and Southwestern China. Over time, the yield loss density increased in the nine agricultural regions (Figure 2C). The Middle-Lower Yangtze, Huang-Huai-Hai, and Northeast China experienced the highest levels, followed by Southwestern China, Gansu-Xin, and Qinghai–Tibet, while the Loess Plateau region, Inner Mongolia, and South China had the lowest levels of yield loss density. The Middle-Lower Yangtze, Huang-Huai-Hai, Northeast China, and Southwestern China were the major grain planting areas in China, followed by the Loess Plateau and South China, and the Qinghai–Tibet region had the smallest grain planting area (Figure 2D). When considering the variations of the trend, in the Middle-Lower Yangtze, the grain planting area decreased significantly after 2000, while increased obviously in Northeast China, especially after 2000 (the grain planting area in 2019 increased by 8,926,960 ha compared with 2000).
This study applied the standard deviation ellipse (SDE) (Lefever, 1926; Furfey, 1927; Hou et al., 2021), which can effectively and accurately identify overall patterns of the spatial distribution of geographical factors. It was used to analyze the spatial distribution and gravity center of disaster-induced grain yield loss in China (Figure 3).
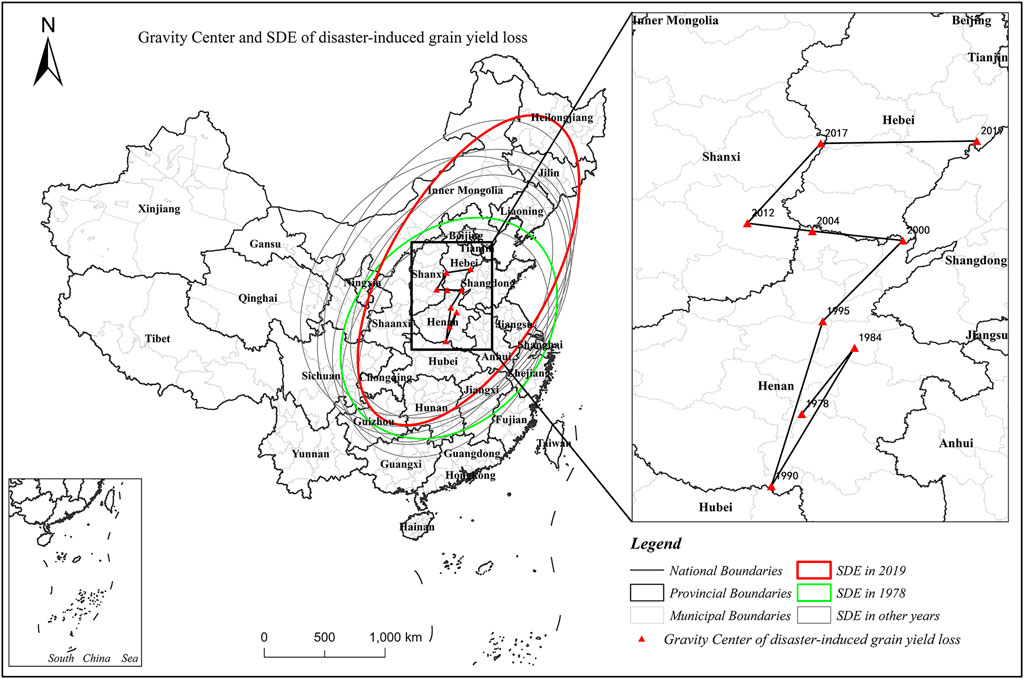
FIGURE 3. Gravity Center and standard deviation ellipse (SDE) of disaster-induced grain yield loss in China from 1978 to 2019.
Most disaster-induced grain yield loss incidents in China concentrated in the southwest-northeast belt, and the belt expanded in the northeast direction, which was consistent with the results in other studies (Guo et al., 2019). This pattern was consistent with the spatial agglomeration pattern of grain production (Li et al., 2016; Wang et al., 2018; Pan et al., 2020). The Gravity Center geographical coordinates of disaster-induced grain yield loss ranged from 113.88°E–116.94°E to 33.58°N–37.89°N, and moved from Henan Province, Shanxi to Hebei. Especially after 2000, the Gravity Center shifted to the northward at a significantly faster speed. The long axis of the SDE extended from 1,028.89 km in 1978 to 1,458.27 km in 2019, while the short axis shrunk from 786.53 km in 1978 to 688.84 km in 2019. Overall, the ratio of the short axis to the long axis decreased.
Figure 4 shows how the three driving factors (disaster intensity, yield loss density, and grain planting area) contributed to changes in disaster-induced grain yield loss during the study period. It was clear that the majority of the changes came from disaster intensity, while yield loss density and the grain planting area contributed relatively little.

FIGURE 4. Contributions of driving factors to changes in disaster-induced grain yield loss between 1978 and 2019.
In 1978–1984, 2000–2004, 2004–2012, and 2012–2017, the contribution of yield loss density was negative, indicating that it played a negative role in the decline of disaster-induced grain yield loss, while grain planting area was helpful to reduce the disaster-induced grain yield loss in 1978–1984, 1990–2004, and 2017–2019.
During the entire study period, the region where yield loss density effect was greatest shifted from Huang-Huai-Hai to Inner Mongolia (Figure 5A). In 1978–1984, yield loss density effect in Huang-Huai-Hai was largest, followed by the Middle-Lower Yangtze and Northeast China, while yield loss density effects in other regions were relatively little. Between 1984 and 1990, the regions with the greatest contribution of yield loss density were Huang-Huai-Hai, Northeast China, and Inner Mongolia, followed by South China and the Middle-Lower Yangtze. From 1990 to 1995, the contributions of yield loss density in both Huang-Huai-Hai and the Middle-Lower Yangtze were higher than those of other regions, while during 1995–2017, the region contributed the most yield loss density effect was Northeast China. After 2017, the region with the greatest yield loss density effect transferred to Inner Mongolia, which was followed by Northeast China.
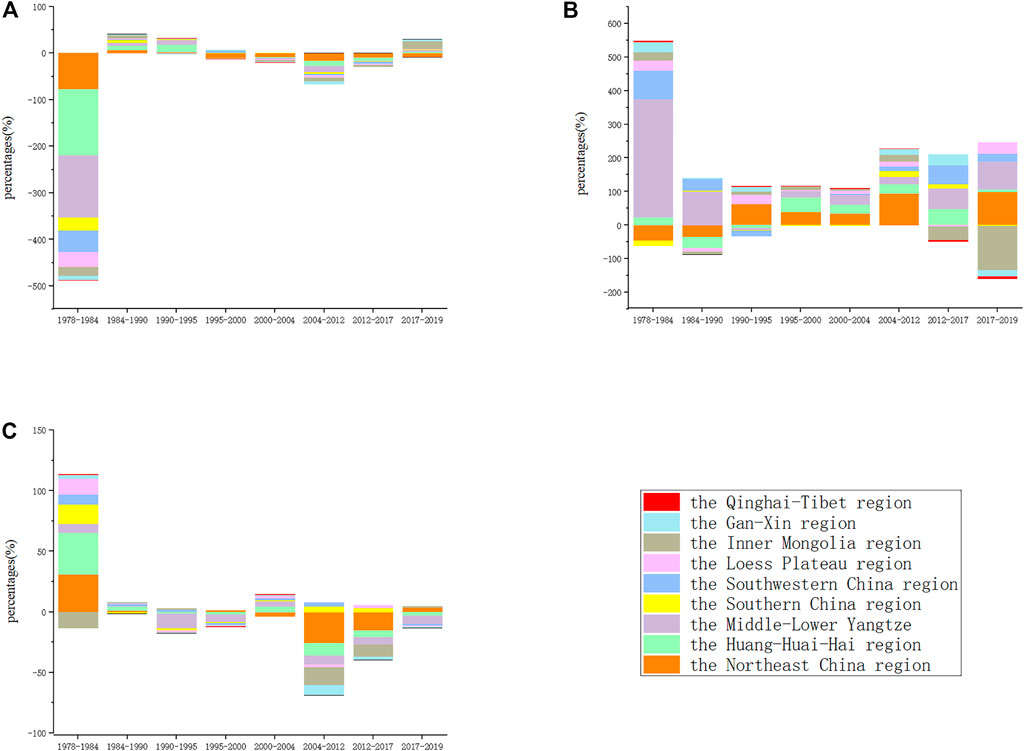
FIGURE 5. Contributions of driving factors in nine agricultural regions of China. (A) represents the yield loss density effect, (B) represents the disaster intensity effect, and (C) is the grain planting area effect.
Figure 5B reveals the disaster intensity effect on changes of disaster-induced grain yield loss in nine agricultural regions of China. Overall, the four regions’ disaster intensity effects were relatively great, namely, Middle-Lower Yangtze, Northeast China, Southwestern China, and Inner Mongolia. Between 1978 and 2019, the region with the greatest disaster intensity effect transferred from Middle-Lower Yangtze to Inner Mongolia. In 1978–1990, disaster intensity effect of Middle-Lower Yangtze was the largest among the nine regions. From 1990 to 1995, Northeast China’s disaster intensity effect was the highest, followed by the Loess Plateau, and other regions. From 1995 to 2000, Huang-Huai-Hai contributed the largest disaster intensity effect, followed by Northeast China and other regions. Middle-Lower Yangtze showed the greatest disaster intensity effect during 2000–2004 and 2012–2017, while Northeast China’s disaster intensity effect contributed the most from the period 2004–2012. Inner Mongolia was the major region with the negative effect of disaster intensity, which offset the increase in disaster-induced grain yield loss in 2017–2019.
Figure 5C shows the contribution of the grain planting area in the nine agricultural regions. From 1978 to 1990, Huang-Huai-Hai was the region with the greatest grain planting area effect. In 1990–2000, grain planting area in Middle-Lower Yangtze offset the increase in disaster-induced grain yield loss mostly. From 2000 to 2004, the region with the grain planting area effect was Huang-Huai-Hai. From 2004 to 2017, the region with the greatest grain planting area effect transferred to Northeast China, followed by Inner Mongolia, the Huang-Huai-Hai, and the Middle-Lower Yangtze, while in 2017–2019, Middle-Lower Yangtze contributed the greatest grain planting area effect, which offset the increase in disaster-induced grain yield loss.
This study applied the LMDI method to analyze three factors contributing to the changes in disaster-induced grain yield loss in China between 1978 and 2019, namely, yield loss density, disaster intensity, and grain planting area. The study yielded the following key results.
1) China’s disaster-induced grain yield loss peaked in 2000 and then entered a declining period, and drought and flood were the main disasters causing grain yield loss. (2) The gravity center of China’s disaster-induced grain yield loss shifted northward. Disaster-induced grain yield loss presented a spatial distribution pattern in a northeast-southwest belt encompassing the Middle-Lower Yangtze, the Huang-Huai-Hai, and Northeast China. (3) Disaster intensity was the principal factor driving the changes in disaster-induced grain yield loss in China, followed by yield loss density and the grain planting area.
1) To reduce China’s disaster-induced grain yield loss caused by drought and flood disasters, flood and drought prevention measures should be reinforced. These measures include the application of water-saving techniques for dry farming, water drainage and moisture dissipation techniques, and other agricultural techniques.
2) The spatial distribution of China’s disaster-induced grain yield loss was consistent with the spatial pattern of the grain production. This highlights the need to enhance the capacity of disaster prevention and reduction in the main grain-producing areas, especially in the Middle-Lower Yangtze, Huang-Huai-Hai, and Northeast China.
3) Based on inter-regional differences, targeted measures to reduce disaster-induced grain yield loss are needed. More specifically, in Northeast China, reducing the disaster intensity and optimizing the grain planting structure are more important than increasing the scale of grain planting area. In the Middle-Lower Yangtze and the Huang-Huai-Hai, the grain planting area and yield loss density mainly offset the decline in disaster-induced grain yield loss since 2004. This indicates that optimizing the grain planting structure and disaster prevention and reduction should be prioritized in these two regions. In Inner Mongolia, disaster intensity was the main factor that hindered the reduction in disaster-induced grain yield loss since 2012. Thus, reducing disaster intensity is more urgent in that region.
The raw data supporting the conclusion of this article will be made available by the authors, without undue reservation.
XZ: conceptualization, methodology, writing-review and editing. GD: conceptualization, data curation, and formal analysis. YX: visualization and validation.
This research was funded by Project of Humanities and Social Science of Henan Province (No. 2022-ZZJH-037), and Basic Research Project of Philosophy and Social Science in Colleges and Universities of Henan Province (Evaluation of Community comprehensive Disaster resistance ability in China, no grant number).
The authors declare that the research was conducted in the absence of any commercial or financial relationships that could be construed as a potential conflict of interest.
All claims expressed in this article are solely those of the authors and do not necessarily represent those of their affiliated organizations, or those of the publisher, the editors, and the reviewers. Any product that may be evaluated in this article, or claim that may be made by its manufacturer, is not guaranteed nor endorsed by the publisher.
Abd El-Wahab, R., Al-Rashed, A., and Al-Dousari, A. (2018). Influences of Physiographic Factors, Vegetation Patterns and Human Impacts on Aeolian Landforms in Arid Environment. Arid Ecosyst. 8, 97–110. doi:10.1134/s2079096118020026
Abid, M., Scheffran, J., Schneider, U. A., and Elahi, E. (2019). Farmer Perceptions of Climate Change, Observed Trends and Adaptation of Agriculture in Pakistan. Environ. Manag. 63 (1), 110–123. doi:10.1007/s00267-018-1113-7
Ali, R., Kuriqi, A., and Kisi, O. (2020). Human‐environment natural disasters interconnection in China: a review. Climate. Ecol. Indicators 8(4), 48. doi:10.3390/cli8040048
Ang, B. W. (2015). LMDI Decomposition Approach: a Guide for Implementation. Energy Policy 86, 233–238. doi:10.1016/j.enpol.2015.07.007
Ang, B. W. (2005). The LMDI Approach to Decomposition Analysis: a Practical Guide. Energy policy 33 (7), 867–871. doi:10.1016/j.enpol.2003.10.010
Ang, B., Zhang, F., and Choi, K. (1998). Factorizing Changes in Energy and Environmental Indicators through Decomposition. Energy 23 (6), 489–495. doi:10.1016/s0360-5442(98)00016-4
Battisti, D. S., and Naylor, R. L. (2009). Historical Warnings of Future Food Insecurity with Unprecedented Seasonal Heat. Science 323 (5911), 240–244. doi:10.1126/science.1164363
Blomqvist, L., Yates, L., and Brook, B. W. (2020). Drivers of Increasing Global Crop Production: A Decomposition Analysis. Environ. Res. Lett. 15 (9), 0940b0946. doi:10.1088/1748-9326/ab9e9c
Cao, B., Tang, L., Hu, B., and Zhao, X. (2021). Global Grain Crisis and China's Grain Security. Int. Econ. Rev. (2), 9–21.
Cao, J., Zhang, Z., Zhang, L., Luo, Y., Li, Z., and Tao, F. (2020). Damage Evaluation on Soybean Chilling Injury Based on Google Earth Engine(GEE) and Crop Growth Model. Acta Geogr. Sin 75 (9), 1879–1892. doi:10.1007/s11442-020-1780-1
Challinor, A. J., Müller, C., Asseng, S., Deva, C., Nicklin, K. J., Wallach, D., et al. (2018). Improving the Use of Crop Models for Risk Assessment and Climate Change Adaptation. Agric. Syst. 159, 296–306. doi:10.1016/j.agsy.2017.07.010
Chen, J., Rong, S., and Song, M. (2021). Poverty Vulnerability and Poverty Causes in Rural China. Soc. Indic Res. 153 (1), 65–91. doi:10.1007/s11205-020-02481-x
Chen, S., Luo, Z., and Pan, X. (2013). Natural Disasters in China: 1900-2011. Nat. Hazards 69 (3), 1597–1605. doi:10.1007/s11069-013-0765-0
Cui, K., and Shoemaker, S. P. (2018). A Look at Food Security in China. NPJ Sci. Food 2 (1), 1–2. doi:10.1038/s41538-018-0012-x
Du, J. (2020). Effects of Drought on Grain Yield of Main Grain Producing Areas in China and Countermeasures for Drought Resistance. Beijing: Chinese Academy of Agricultural Sciences Thesis.
Du, X., Jin, X., Yang, X., Yang, X., Xiang, X., and Zhou, Y. (2015). Spatial-temporal Pattern Changes of Main Agriculture Natural Disasters in China during 1990-2011. J. Geogr. Sci. 25 (4), 387–398. doi:10.1007/s11442-015-1175-x
Elahi, E., Abid, M., Zhang, L., Ul Haq, S., and Sahito, J. G. M. (2018). Agricultural Advisory and Financial Services; Farm Level Access, Outreach and Impact in a Mixed Cropping District of Punjab, Pakistan. Land use policy 71, 249–260. doi:10.1016/j.landusepol.2017.12.006
Elahi, E., Khalid, Z., Tauni, M. Z., Zhang, H., and Lirong, X. (2021a). Extreme Weather Events Risk to Crop-Production and the Adaptation of Innovative Management Strategies to Mitigate the Risk: A Retrospective Survey of Rural Punjab, Pakistan. Technovation, 102255. doi:10.1016/j.technovation.2021.102255
Elahi, E., Khalid, Z., Weijun, C., and Zhang, H. (2020). The Public Policy of Agricultural Land Allotment to Agrarians and its Impact on Crop Productivity in Punjab Province of Pakistan. Land Use Policy 90, 104324. doi:10.1016/j.landusepol.2019.104324
Elahi, E., Weijun, C., Zhang, H., and Abid, M. (2019). Use of Artificial Neural Networks to rescue Agrochemical-Based Health Hazards: A Resource Optimisation Method for Cleaner Crop Production. J. Clean. Prod. 238, 117900. doi:10.1016/j.jclepro.2019.117900
Elahi, E., Zhang, H., Lirong, X., Khalid, Z., and Xu, H. (2021b). Understanding Cognitive and Socio-Psychological Factors Determining Farmers' Intentions to Use Improved Grassland: Implications of Land Use Policy for Sustainable Pasture Production. Land Use Policy 102, 105250. doi:10.1016/j.landusepol.2020.105250
Feukam Nzudie, H. L., Zhao, X., Liu, G., Tillotson, M. R., Hou, S., and Li, Y. (2021). Driving Force Analysis for Food Loss Changes in Cameroon. J. Clean. Prod. 278, 123892. doi:10.1016/j.jclepro.2020.123892
Food and Agriculture Organization of the United Nations (2021). The Impact of Disasters and Crises on Agriculture and Food Security.
Furfey, P. H. (1927). A Note on Lefever's "Standard Deviational Ellipse". Am. J. Sociol. 33 (1), 94–98. doi:10.1086/214336
Gao, M., Fan, J., and Wu, Q. (2012). Influence of Drought and Grain Production in Shaanxi Province. J. China Agric. Univ. 17 (3), 149–153. doi:10.11841/j.issn.1007-4333.2012.03.024
Ge, J., and Si, W. (2020). Contribution Facors to World's Increasing Sugarcane Production Based on LMDI Model. Chin. J. Agric. Resour. Reg. Plann. 41 (1), 21–29. doi:10.7621/cjarrp.1005-9121.20200104
Ghose, B. (2014). Food Security and Food Self‐sufficiency in China: from Past to 2050. Food Energy Secur 3 (2), 86–95. doi:10.1002/fes3.48
Glotter, M., and Elliott, J. (2016). Simulating US Agriculture in a Modern Dust Bowl Drought. Nat. Plants 3 (1), 16193–16196. doi:10.1038/nplants.2016.193
Gong, Y., and Zhang, H. (2010). Quantitative Estimation on Drought Yield and Economic Loss of the Regional Crop: Take Tangshan as the Example. Chin. Agric. Sci. Bull. 26 (23), 375–379.
González, P. F., Landajo, M., and Presno, M. (2014). Multilevel LMDI Decomposition of Changes in Aggregate Energy Consumption. A Cross Country Analysis in the EU-27. Energy Policy 68, 576–584. doi:10.1016/j.enpol.2013.12.065
Guan, D., Meng, J., Reiner, D. M., Zhang, N., Shan, Y., Mi, Z., et al. (2018). Structural Decline in China's CO2 Emissions through Transitions in Industry and Energy Systems. Nat. Geosci 11 (8), 551–555. doi:10.1038/s41561-018-0161-1
Guan, Y., Zheng, F., Zhang, P., and Qin, C. (2015). Spatial and Temporal Changes of Meteorological Disasters in China during 1950-2013. Nat. Hazards 75 (3), 2607–2623. doi:10.1007/s11069-014-1446-3
Guo, J., Mao, K., Zhao, Y., Lu, Z., and Xiaoping, L. (2019). Impact of Climate on Food Security in mainland China: A New Perspective Based on Characteristics of Major Agricultural Natural Disasters and Grain Loss. Sustainability 11 (3), 869. doi:10.3390/su11030869
Holst, R., Yu, X., and Grün, C. (2013). Climate Change, Risk and Grain Yields in China. J. Integr. Agric. 12 (7), 1279–1291. doi:10.1016/s2095-3119(13)60435-9
Hou, M., Deng, Y., and Yao, S. (2021). Spatial Agglomeration Pattern and Driving Factors of Grain Production in China since the Reform and Opening up. Land 10 (1), 10. doi:10.3390/land10010010
Hu, H. (2016). Research on the Impact of Climate Change on Grain Production and Yield Loss Risk in China. Nanjing: Nanjing University of Information Science & Technology.
Hua, X. (2016). The Influence Factors Decomposition of Grain Output Increase in China: 2003-2014. Jas 8 (11), 59–68. doi:10.5539/jas.v8n11p59
Jin, T., and Lu, J. (2011). Factor Decomposition in Regional Disparities of Grain Production in Jiangsu Province. Econ. Geogr. 31 (11), 1886–1890.
Kim, W., Iizumi, T., and Nishimori, M. (2019). Global Patterns of Crop Production Losses Associated with Droughts from 1983 to 2009. J. Appl. Meteorology Climatology 58 (6), 1233–1244. doi:10.1175/jamc-d-18-0174.1
Lefever, D. W. (1926). Measuring Geographic Concentration by Means of the Standard Deviational Ellipse. Am. J. Sociol. 32 (1), 88–94. doi:10.1086/214027
Leng, G. (2021). Maize Yield Loss Risk under Droughts in Observations and Crop Models in the United States. Environ. Res. Lett. 16 (2), 024016. doi:10.1088/1748-9326/abd500
Lesk, C., Rowhani, P., and Ramankutty, N. (2016). Influence of Extreme Weather Disasters on Global Crop Production. Nature 529 (7584), 84–87. doi:10.1038/nature16467
Li, C., Li, N., and Meng, Z. (2008). Estimation of Grain Yield Loss in Jiangsu Province Based on Grey Prediction Model. J. Nat. Disasters 17 (1), 104–108. doi:10.13577/j.jnd.2008.0118
Li, J., Wu, W., Ye, X., Jiang, H., Gan, R., Wu, H., et al. (2019). Innovative Trend Analysis of Main Agriculture Natural Hazards in China during 1989–2014. Nat. Hazards 95. doi:10.1007/s11069-018-3514-6
Li, T., Baležentis, T., Cao, L., Zhu, J., Kriščiukaitienė, I., and Melnikienė, R. (2016). Are the Changes in China's Grain Production Sustainable: Extensive and Intensive Development by the LMDI Approach. Sustainability 8 (12), 1198. doi:10.3390/su8121198
Li, W.-j., Qin, Z.-h., and Lin, L. (2010). Quantitative Analysis of Agro-Drought Impact on Food Security in China. J. Nat. Disasters 19 (3), 111–118. doi:10.13577/j.jnd.2010.0319
Li, X., Fang, S., Zhu, Y., and Wu, D. (2021). Risk Analysis of Wheat Yield Losses at County Level in mainland China. Front. Environ. Sci. 9, 141. doi:10.3389/fenvs.2021.642340
Liu, Y., Gao, B., Pan, Y., and Gao, Y. (2014). Investigating Contribution Factors to China's Grain Output Increased Based on LMDI Model during the Period 1980-2010. J. Nat. Resour. 29 (10), 1709–1720. doi:10.11849/zrzyxb.2014.10.007
Liu, Z.-j., Zhong, H.-m., Li, Y.-r., Wen, Q., Liu, Z.-j., Liu, X.-q., et al. (2021). Change in Grain Production in China and its Impacts on Spatial Supply and Demand Distributions in Recent Two Decades. J. Nat. Resour. 36 (6), 1413–1425. doi:10.31497/zrzyxb.20210605
Lobell, D. B., and Asseng, S. (2017). Comparing Estimates of Climate Change Impacts from Process-Based and Statistical Crop Models. Environ. Res. Lett. 12 (1), 015001. doi:10.1088/1748-9326/aa518a
Lobell, D. B., Field, C., Cahill, K. N., and onfils, C. B. (2006). Impacts of Future Climate Change on California Perennial Crop Yields: Model Projections with Climate and Crop Uncertainties. Agric. For. Meteorology 141 (2-4), 208–218. doi:10.1016/j.agrformet.2006.10.006
Luan, J., and Zhou, Y. (2016). An Estimation of Grain Loss Caused by Natural Disasters in Shandong Province Based on Grey Prediction Model and its Correlation with Disasters. Res. Agric. Modern. 37 (6), 1068–1075. doi:10.13872/j.1000-0275.2016.0127
Lyu, C., and Xu, Z. (2020). Crop Production Changes and the Impact of Grain for Green Program in the Loess Plateau of China. J. Arid Land 12 (1), 18–28. doi:10.1007/s40333-020-0091-9
Ma, J., Kong, W., and Zhu, T. (2020). Characteristics, Impact of Agricultural Disaster, and Mechanism of Disaster Prevention, Mitigation and Response: From the Perspective of Literature Review. J. China Agric. University(Social Science) 37 (5), 122–129. doi:10.13240/j.cnki.caujsse.2020.05.013
Mei, X., 2021. How Much Has China Lost in Grain Production after Heavy rains Hit Four Major Grain-Producing Provinces?. https://i.ifeng.com/c/88SuM0oG0do.
Pan, J., Chen, Y., Zhang, Y., Chen, M., Fennell, S., Luan, B., et al. (2020). Spatial-temporal Dynamics of Grain Yield and the Potential Driving Factors at the County Level in China. J. Clean. Prod. 255, 120312. doi:10.1016/j.jclepro.2020.120312
Pathak, P. (2006). InfoCrop: A Dynamic Simulation Model for the Assessment of Crop Yields, Losses Due to Pests, and Environmental Impact of Agro-Ecosystems in Tropical Environments. I. Model Description. Agric. Syst. 89 (1), 1–25. doi:10.1016/j.agsy.2005.08.001
Pei, X., Wu, J., and Xue, J. (2021). Analysis on the Influencing Factors of SO2 Emission in China's Provincial Industry Based on LMDI and Hierarchical Clustering. Ecol. Econ. 37 (12), 183–189.
Peng, R., Zhao, Y., Elahi, E., and Peng, B. (2021). Does Disaster Shocks Affect Farmers’ Willingness for Insurance? Mediating Effect of Risk Perception and Survey Data from Risk-Prone Areas in East China. Nat. Hazards 106, 1–17. doi:10.1007/s11069-021-04569-0
Qiao, J., Yu, D., Wang, Q., and Liu, Y. (2018). Diverse Effects of Crop Distribution and Climate Change on Crop Production in the Agro-Pastoral Transitional Zone of China. Front. Earth Sci. 12 (2), 408–419. doi:10.1007/s11707-017-0665-9
Rosenzweig, C., Tubiello, F. N., Goldberg, R., Mills, E., and Bloomfield, J. (2002). Increased Crop Damage in the US from Excess Precipitation under Climate Change. Glob. Environ. Change 12 (3), 197–202. doi:10.1016/s0959-3780(02)00008-0
Shi, W., Wang, M., and Liu, Y. (2021). Crop Yield and Production Responses to Climate Disasters in China. Sci. Total Environ. 750, 141147. doi:10.1016/j.scitotenv.2020.141147
United Nations (2016). Food Security and Why it Matters. Available at: https://www.weforum.org/agenda/2016/01/food-security-and-why-it-matters/.
Wang, C., Linderholm, H. W., Song, Y., Wang, F., Liu, Y., Tian, J., et al. (2020). Impacts of Drought on maize and Soybean Production in Northeast China during the Past Five Decades. Ijerph 17 (7), 2459. doi:10.3390/ijerph17072459
Wang, J., Liu, B., Liu, Y., Yang, X., and Bai, W. (2013). Grain Yield Estimation Models and Loss Analysis Based on Agro-Meteorological Disaster Exposure in Northeast China. Chin. J. Agrometeorology 34 (5), 720–726. doi:10.3969/j.issn.1000-6362.2013.06.016
Wang, J., Zhang, Z., and Liu, Y. (2018). Spatial Shifts in Grain Production Increases in China and Implications for Food Security. Land Use Policy 74, 204–213. doi:10.1016/j.landusepol.2017.11.037
Wang, X., and Li, M. (2012). Analysis on Decoupling Relationship between Natural Disasters and Grain Production in China. J. Catastrophology 27 (1), 94–97. doi:10.3969/j.issn.1000-811X.2012.01.019
Wen, D., Li, J., and He, P. (2017). Grey Correlation Analysis of Agro-Meteorological Disasters and Soybean Yield in Heilongjiang Province. J. Nat. Disasters 26 (4), 56–62. doi:10.13577/j.jnd.2017.0407
Xiao, D., Li, H., and Yang, D. (2017). Evaluation Method of Grain Reduction Caused by Droughts and Floodsand Empirical Analysis of China Grain Reduction. J. Catastrophology 32 (2), 26–31. doi:10.3969/j.issn.1000-811X.2017.02.005
Xu, J., Gao, J., de Holanda, H. V., Rodríguez, L. F., Caixeta-Filho, J. V., Zhong, R., et al. (2021). Double Cropping and Cropland Expansion Boost Grain Production in Brazil. Nat. Food 2 (4), 264–273. doi:10.1038/s43016-021-00255-3
Xu, L., and Zhang, Q. (2011). Assessment Approach for Agricultural Catastrophic Risk in China. Scientia Agricultura Sinica 44 (9), 1945–1952. doi:10.3864/j.issn.0578-1752.2011.09.023
Xu, X., and Tang, Q. (2021). Spatiotemporal Variations in Damages to Cropland from Agrometeorological Disasters in mainland China during 1978-2018. Sci. Total Environ. 785, 147247. doi:10.1016/j.scitotenv.2021.147247
Yu, X., Chen, H., Ji, Z., and Li, C. (2019). Gray Correlation Analysis of Agricultural Meteorological Disasters and Main Crop Yields in Shandong Province. J. Catastrophology 34 (3), 104–108. doi:10.3969/j.issn.1000-811X.2019.03.020
Zhang Jianping, J. P., Wang Chunyi, C. Y., Zhao Yanxia, Y. X., Yang Xiaoguang, X. G., and Wang Jing, J. (2012). Impact Evaluation of Low Temperature to Yields of maize in Northeast China Based on Crop Growth Model. Acta Eco Sin 32 (13), 4132–4138. doi:10.5846/stxb201106070758
Zhang, J. (2004). Risk Assessment of Drought Disaster in the maize-growing Region of Songliao Plain, China. Agric. Ecosyst. Environ. 102 (2), 133–153. doi:10.1016/j.agee.2003.08.003
Zhang, Q., Zhang, J., Yan, D., and Bao, Y. (2013). Dynamic Risk Prediction Based on Discriminant Analysis for maize Drought Disaster. Nat. Hazards 65 (3), 1275–1284. doi:10.1007/s11069-012-0406-z
Zhang, X., Zhang, C., and Wu, J. (2009). Risk Assessment of Yield Losses from Agro-Meteoroogical Disasters in Fujian Province. J. Nat. Disasters 18 (1), 90–94. doi:10.13577/j.jnd.2009.0114
Zhang, Y., Liu, B., Yang, X., Liu, Y., Bai, W., and Dong, B. (2018). Grain Yield Loss Evaluation Based on Agro-Meterological Disaster Exposure in the Middle-Lower Yangtze Plain. Chin. J. Agrometeorology (4), 280–291. doi:10.3969/j.issn.1000-6362.2018.04.007
Zhang, Z., Wang, P., Chen, Y., Zhang, S., Tao, F., and Liu, X. (2014). Spatial Pattern and Decadal Change of Agro-Meteorological Disasters in the Main Wheat Production Area of China during 1991-2009. J. Geogr. Sci. 24 (3), 387–396. doi:10.1007/s11442-014-1095-1
Zhao, Y., Guo, J., Mao, K., Xiang, Y., Li, Y., Han, J., et al. (2017). Spatio-temporal Distribution of Typical Natural Disasters and Grain Disaster Losses in China from 1949 to 2015. Acta Geogr. Sin 72, 1261–1276. doi:10.11821/dlxb201707011
Zheng, J., and Huang, J. (1998). An Estimation of Grain Loss Caused by Natural Disasters in China, 1950-1990. Acta Geogr. Sin 53 (6), 501–510.
Zhu, B., Zhou, Q., and Dong, X. (2015). Analysis of Agro-Meteorological Disasters Intensity Variation and Impacts on Grain Yield Decrease in Dezhou City. China Popul. Resour. Environ. 25 (11), 262–265.
Zhu, J., Li, T., Lin, D., and Zhong, F. (2013). Analysis on China’s Nine-Year Consecutive Grain Production Growth: Contribution and Future Potential of Inter-crop Structural Adjustment. Issues Agric. Economy 34 (11), 36–43.
Keywords: logarithmic mean Divisia index (LMDI), grain yield loss, yield loss density, disaster intensity, grain planting area
Citation: Zhao X, Deng G and Xi Y (2022) Spatial–Temporal Characteristics and Driving Factors of Disaster-Induced Grain Yield Loss in China. Front. Environ. Sci. 10:808565. doi: 10.3389/fenvs.2022.808565
Received: 03 November 2021; Accepted: 24 January 2022;
Published: 25 February 2022.
Edited by:
Xander Wang, University of Prince Edward Island, CanadaReviewed by:
Ehsan Elahi, Shandong University of Technology, ChinaCopyright © 2022 Zhao, Deng and Xi. This is an open-access article distributed under the terms of the Creative Commons Attribution License (CC BY). The use, distribution or reproduction in other forums is permitted, provided the original author(s) and the copyright owner(s) are credited and that the original publication in this journal is cited, in accordance with accepted academic practice. No use, distribution or reproduction is permitted which does not comply with these terms.
*Correspondence: Xiaojing Zhao, emhhb3hqMTk4NjAzQDE2My5jb20=
Disclaimer: All claims expressed in this article are solely those of the authors and do not necessarily represent those of their affiliated organizations, or those of the publisher, the editors and the reviewers. Any product that may be evaluated in this article or claim that may be made by its manufacturer is not guaranteed or endorsed by the publisher.
Research integrity at Frontiers
Learn more about the work of our research integrity team to safeguard the quality of each article we publish.