 Jordan McLeod
 Marshall Shepherd
94% of researchers rate our articles as excellent or good
Learn more about the work of our research integrity team to safeguard the quality of each article we publish.
Find out more
ORIGINAL RESEARCH article
Front. Environ. Sci., 16 March 2022
Sec. Atmosphere and Climate
Volume 10 - 2022 | https://doi.org/10.3389/fenvs.2022.808026
This article is part of the Research TopicWeather and Climate Extremes in the Urban Environment: Modeling and ObservationsView all 10 articles
Observational and numerical modeling studies continue to affirm the existence of the “urban rainfall effect” (URE), or a discernible anomaly in warm season precipitation due to urbanization. However, the literature has been lacking a progression towards the predictability of the URE. Atlanta, Georgia has consistently appeared in the literature because of its well-studied urban rainfall anomalies. Using the Multi-sensor Precipitation Estimates (MPE) dataset and the ERA-Interim reanalysis dataset, an 18-year period (2002–2019) is examined. Three similar but distinct methods are used to define urban rainfall days (URDs), or periods when the precipitation in the urbanized areas of Atlanta are greater than the surrounding rural areas. A combination of compositing, wind rose, and k-means cluster analyses are employed to extract the synoptic framework supportive of the URE in Atlanta, Georgia. The synoptic-scale compositing analysis reveals that there are a consistent set of meteorological ingredients that are needed to produce an URD, including weaker-than-average southwesterly-to-northwesterly flow at 700 hPa, copious amounts of moisture throughout the tropospheric column, and a background low-level convergent flow. Composite atmospheric soundings reveal that there is enhanced moisture throughout the tropospheric column on URDs, leading to marginal instability that favors localized convection across the Atlanta metropolitan area. The study also provides clarity on how often the URE is present (roughly 8% of the time) during warm season days across the Atlanta metropolitan area. Taken together, this synoptic framework will aid in the forecasting of the URE in Atlanta and can be easily applied to other cities.
More than half of the global population lives in urban spaces, and that number may exceed 65% by 2025 (Shepherd et al., 2013). The literature chronicles how urban environments modify weather and hydroclimate (Seto and Shepherd, 2009; Debbage and Shepherd, 2019). Like urban heat islands, urban effects on the hydroclimate have increasingly become well-understood. For decades, a scholarly question loomed regarding the role of urbanization on precipitation processes (Landsberg, 1956; Shepherd et al., 2002; Mitra and Shepherd, 2016). A host of investigators employed field campaigns (Shepherd et al., 2013), remote sensing platforms and long-term observations (Shepherd et al., 2002; Mote et al., 2007; Jin and Shepherd, 2008; Mitra et al., 2012; McLeod et al., 2017; Johnson and Shepherd, 2018), or numerical weather models (Schmid and Niyogi, 2013; Debbage and Shepherd, 2019) to answer the following fundamental questions:
Can cities, via urban landscapes and/or associated aerosol processes, initiate or modify precipitating cloud systems?
If so, what processes are of first-order significance in urban-influenced precipitating storms?
Liu and Niyogi (2019) recently established, with some degree of conclusiveness, that urbanization affects rainfall processes. Key findings from their meta-analysis established or confirmed several long-standing issues within the urban hydrometeorological community. While historical studies from the METROMEX (i.e., Metropolitan Meteorological Experiment) era argued that urban effects on rainfall are primarily downwind of the city, their analysis revealed that urbanization modifies rainfall in distinct spatial patterns around the central business district of a city: 18% downwind, 16% over the city, 2% on the left, and 4% on the right relative to storm direction. This is consistent with work by other investigators as well (Ashley et al., 2012; Bentley et al., 2012) and an important step in establishing what Shepherd et al. (2010) called the “urban rainfall effect,” or URE. The URE is a broad term that captures the various ways that the urban environment modifies the initiation or modification of precipitation processes.
While the concept of the URE has been established for many cities using a variety of methodological approaches, the predictability of urban-generated rainfall remains largely unexplored. Previous studies (e.g., Bentley et al., 2012) have shown that the URE occurs most frequently during periods of weak synoptic flow, and McLeod et al. (2017) revealed that the magnitude and spatial pattern of urban-induced rainfall around Atlanta, Georgia was dependent on the synoptic flow regime. In addition, Dixon and Mote (2003) have shown that low-level moisture, rather than the intensity of the urban heat island, was the most significant predictor of urban-generated convection for the city of Atlanta. However, only a limited effort has been focused on identifying which meteorological variables in the synoptic-scale environment most effectively distinguish days exhibiting the URE. Bentley et al. (2012) revealed that a synoptic environment characterized by moderate thermodynamic instability was most favorable for producing urban convection and rainfall over Atlanta. Herein, the research was motivated by the following questions: (1) Can urban-generated rainfall be predicted with satisfactory skill for a city that has a strong URE during the warm season, such as Atlanta, GA? and (2) If so, which suite of meteorological variables can be used to most effectively distinguish days with a detectable URE from those days lacking a URE signal?
This paper provides a potentially “first of its kind” attempt at establishing a framework for predicting the URE. Building upon the work of McLeod et al. (2017), we use the city of Atlanta as a testbed for the analysis. Section 2 will provide an overview of the data and methodology, and Section 3 presents results. Section 4 summarizes key conclusions and potential pathways forward.
One novel aspect of this study is the use of the Multi-sensor Precipitation Estimates (MPE) dataset to create a database of urban rainfall days (URDs). MPE (Fulton et al., 1998; Seo, 1998; Seo et al., 2010) is a gridded precipitation product that blends Doppler radar estimates and observations from station gauges. The use of this gridded dataset offers a more complete representation of precipitation across the study region, which is particularly important given the convective nature of precipitation during the warm season. The network of station gauges across northern Georgia is not be able to adequately capture convective precipitation totals at the local scale, but Doppler radar provides estimated precipitation totals that can aid in filling these coverage gaps. Our analysis spanned the period 2002–2019 (18 years), which reflects the availability of MPE data. The spatial resolution is approximately 4 km × 4 km, while the temporal resolution is defined as a hydrologic day, or the 24-h period extending from 1200 UTC to 1200 UTC. The high spatial resolution reflects another important reason for using the MPE dataset in this study. It is important to acknowledge that typical inaccuracies associated with Doppler radar (e.g., bright band contamination, Z-R relationships, spatial coverage, precipitation type, and range issues) and station gauges (e.g., wind, siting, and undercatch) will affect the precipitation estimates analyzed in this study (Smith et al., 1996; Sieck et al., 2007; Seo et al., 2010).
The ERA-Interim reanalysis dataset (Dee et al., 2011) is employed to construct synoptic-scale composite maps of the following meteorological variables: 500 hPa geopotential heights, 700 hPa vertical velocity, 700 hPa wind speed, 2-m dew point temperature, integrated vapor transport, precipitable water, and 1,000 hPa divergence. This dataset is produced from a 4-dimensional variational (4D-Var) analysis of observations over a 12-h analysis window. The spatial resolution is 0.75° × 0.75° (80 km × 80 km), and the temporal resolution is 6-hourly (0000, 0600, 1200, 1800 UTC), which was further aggregated to the daily scale for this study. The period of record used for the ERA-Interim reanalysis is the same as that of the MPE dataset.
The ERA-Interim reanalysis is also used to create a daily database of 700 hPa wind speed and direction over the metropolitan area of Atlanta. Shepherd et al. (2002) noted that the 700 hPa level can be used for defining prevailing wind flow in urban climatology studies. The average of four ERA-Interim reanalysis grid cells centered over the Atlanta area (32.75–34.25°N, 83.5–85°W) was used to develop the wind climatology. While the 700 hPa wind climatology could have been developed from atmospheric sounding data collected from nearby Peachtree City, GA (KFFC; located about 25 miles southwest of downtown Atlanta), there are a few advantages to using the reanalysis data. First, atmospheric sounding data is only collected twice (1200 UTC and 0000 UTC) per day, whereas the 6-hourly resolution of the reanalysis dataset provides a more precise daily average of 700 hPa winds. In addition, the gridded reanalysis data can be used to compute a more spatially representative average of the 700 hPa wind field across the Atlanta metropolitan area, while the sounding data provides a more localized, point-based estimate of 700 hPa winds.
The third key dataset used in this study is the archive of atmospheric soundings provided by the University of Wyoming’s Department of Atmospheric Science (University of Wyoming, 2020). During the 18-year period from 2002 to 2019, sounding data were gathered at KFFC for every day during meteorological summer (JJA). However, only soundings launched at 0000 UTC each day were collected since we are only interested in the most convectively active portion of the day. Because each sounding has a different number of observations at unique pressure levels, a linear interpolation scheme had to be applied to pressure, air temperature, dew point temperature, and wind components. Thus, composite soundings were constructed from these interpolated values, similar to Schroeder et al. (2016).
The analysis in this study was restricted to the core of the convective season, which we define as meteorological summer (JJA). Previous scholars (e.g., Hand and Shepherd, 2009; Mote et al., 2007) have noted that there is less large-scale atmospheric forcing and more locally-forced convective activity during this period of time. Similar to Hand and Shepherd (2009) and McLeod et al. (2017), a geographic framework with nine equally-sized grid cells is applied to the city of Atlanta, Georgia. Specifically, the grid is centered on downtown Atlanta, with the central MPE pixel located at approximately 33.77°N and 84.39°W. Each grid cell is 9 × 9 MPE pixels, or approximately 36 km × 36 km. Thus, the total grid is 27 × 27 MPE pixels, or approximately 108 × 108 km. The approximate geographic bounds of the total grid are as follows: 33.23–34.36°N and 84.93–83.80°W. Figure 1 shows the average daily precipitation across the Atlanta metropolitan area from 2002 to 2019, coupled with an overlay of the grid cell framework. Similar to Figure 3 in McLeod et al. (2017), the urban enhancement of summer precipitation over and downwind of Atlanta can be readily observed in Figure 1A. Climatologically, the entire 9-grid region is within a maritime tropical regime, so the enhancement of warm season rainfall (yellow, orange, and red shading) over and to the east of the central business district of Atlanta is indicative of the URE and consistent with previous literature (Shepherd et al., 2002; Mote et al., 2007). Figure 1B shows the average daily precipitation during summer over a broader region of the central and eastern United States. The urban enhancement of precipitation is still clearly visible over and downwind of the Atlanta metropolitan area. These figures serve as the foundation for all analyses conducted in this study.
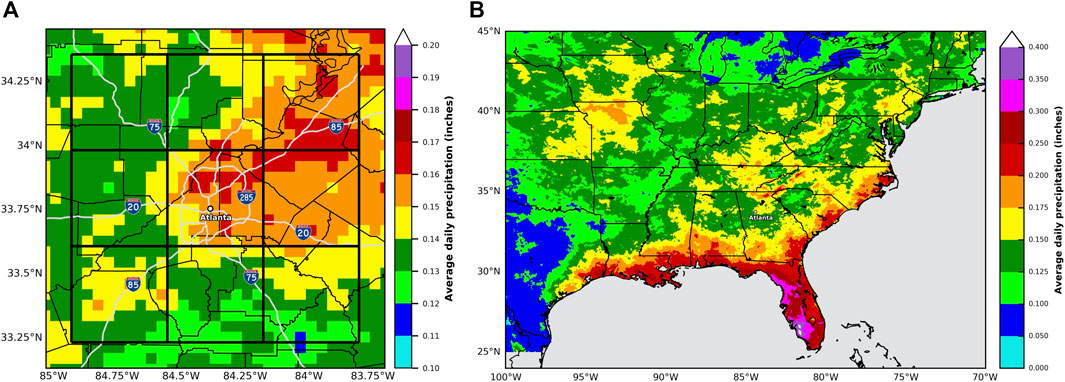
FIGURE 1. (A) Mean daily precipitation during meteorological summer (JJA, 2002–2019). The 9-cell gridded framework is indicated by the black-outlined boxes. (B) Same for the entire southeastern U.S.
Recent studies are increasingly refining what “downwind” means within the context of these studies. Earlier studies from the METROMEX era (see Shepherd et al., 2013 for a review) and into the early 2000s (Shepherd et al., 2002) operated under the assumption of a “fixed” downwind region based on climatology. McLeod et al. (2017) and Schmid and Niyogi (2013) have found that the URE is strongly a function of the prevailing wind regime such that the “downwind” effect may vary around the urban area.
For each day during the study period, the average precipitation amount was computed for each of the nine grid cells centered on the Atlanta metropolitan area. In order to define an URD, two methods were selected from previous studies and one novel method was devised. Three methods were used in this study to account for sensitivity in selecting URDs, with the goal of creating a more robust, comprehensive definition of an URD. The first method was adapted from Debbage and Shepherd (2015), who established that the intensity of an urban heat island was equal to the minimum temperature averaged over the urban area minus the minimum temperature averaged over the rural area. Similarly, we define an URD as the average precipitation over the central urban grid cell minus the precipitation averaged across the remaining 8 “rural” grid cells. Thus, an URD is observed when this relationship is positive, or the average precipitation over the central urban grid cell exceeds the average precipitation across the remaining 8 “rural” grid cells. The second method was adapted from Mote et al. (2007), who compared radar-based precipitation data over an urban grid cell centered on Atlanta with a more rural grid cell located immediately to the west. We use the same procedure for our second method for defining an URD, where an URD is observed when the average precipitation over the central urban grid cell exceeds the average precipitation over the more rural grid cell located to the west. Finally, a novel third method was created to test whether the average precipitation observed across the urban core, eastern, and northeastern grid cells were greater than the average precipitation over the remaining six grid cells. McLeod et al. (2017) showed that the greatest rainfall anomalies occur climatologically in the urban core, eastern, and northeastern grid cells due to the prevailing southwesterly-to-northwesterly mid-tropospheric wind flow during the summer. Therefore, an URD would occur if the precipitation averaged across the urban core, eastern, and northeastern grid cells exceeded that of the remaining six grid cells. This novel third method is customized for the Atlanta metropolitan area, but future work could explore whether this method can be used for other regions, depending on the local mid-tropospheric wind pattern.
Figure 2 shows the percentage of URDs by month and season for the three different methods. The first method based on Debbage and Shepherd (2015) is clearly the most conservative of the three methods, as only 30 percent of all summer days from 2002 to 2019 are classified as URDs. In contrast, over 40 percent of all summer days are classified as URDs for the Mote et al. (2007) and novel methods. Similar monthly patterns emerge among the three methods, as all three observe their greatest percentage of URDs during July. The Debbage and Shepherd (2015) and Mote et al. (2007) methods record their least percentage of URDs during June, while the novel method records its least percentage of URDs during August.
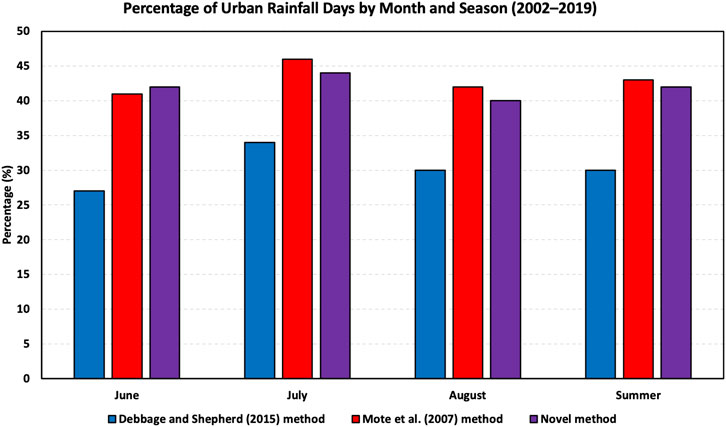
FIGURE 2. Percentage of urban rainfall days by month and season (2002–2019) for the three different methods employed in this study.
A HYSPLIT (Hybrid Single-Particle Lagrangian Integrated Trajectory) backward trajectory analysis was conducted for the 99th percentile and greater URDs (n = 17 days), based on the novel method of defining URDs (Stein et al., 2015; Rolph et al., 2017). Each trajectory was initialized over Atlanta and run backward in time for a total of 72 h using the North American Regional Reanalysis (NARR) dataset. Three distinct trajectories initialized at 10 m, 500 m, and 1,500 m above ground level were computed for each daily simulation. Finally, the hourly latitude and longitude coordinates for all of the 17 trajectory simulations were averaged together to form single composite trajectories at the three heights above ground level.
Zhang et al. (2020) used a k-means cluster analysis in their assessment of urbanization and rainfall variability. However, the cluster analysis was used for categorizing the intensity of urbanization. Herein, a k-means cluster analysis was performed on the daily MPE data spanning each summer (JJA) season from 2002 to 2019, resulting in a total of 1,652 days for analysis. This sample of 1,652 days was partitioned into 8 clusters, in which each daily observation is assigned to the cluster with the nearest mean. Thus, the precipitation values for each pixel depicted in Figure 12 represent the nearest means, or the centers of each cluster. A total of 8 clusters was chosen to provide enough variability in the cluster partitioning so that an urban signal could be detected. A sensitivity analysis was conducted by selecting 7 and 9 clusters, but the results were generally similar to the analysis using 8 clusters. Because the urban signal was more robust in the 8-cluster analysis, it was chosen for further examination.
The synoptic-scale compositing analysis reveals that there are a consistent set of meteorological ingredients that are needed to produce an URD. Because the three methods produce very similar composite maps across all seven meteorological variables, only the maps for the most conservative method (i.e., Debbage and Shepherd, 2015) are displayed in the corresponding figures below. It is important to note that the anomalies for each map were calculated as the difference between the average of all URDs and non-URDs during 2002–2019. While the magnitude of the anomalies may appear small, it is likely just a function of the time of year being analyzed (i.e., summer) and the mesoscale nature of the precipitation pattern under examination.
In Figure 3, the composite map for 500 hPa geopotential heights indicates that Atlanta is caught between weak negative anomalies to the west and stronger positive anomalies to the northeast. Both the negative height anomalies over the Great Plains and the positive height anomalies over the Mid-Atlantic and Northeast U.S. are statistically significant based on a Z-score test. This anomaly pattern should promote west-southwesterly flow and advection over the Atlanta area, which is consistent with the wind rose analysis presented in Figure 4. Figure 5A shows that negative anomalies of 700 hPa vertical velocity are present over the Atlanta metropolitan area, indicating upward motion is occurring downstream of the weakly negative 500 hPa height anomalies over the Central Plains region. Figure 5B indicates that slightly weaker-than-average 700 hPa winds are present over Atlanta. This is consistent with the results of McLeod et al. (2017), who found that positive rainfall anomalies over the urban core of Atlanta are often associated with weaker-than-average 700 hPa winds. Low-level moisture is anomalously high over the Atlanta area, as depicted in Figure 6. Dixon and Mote (2003) found that low-level moisture was more important than UHI intensity in producing urban-generated precipitation over Atlanta. In addition, Figures 7, 8 reveal that positive anomalies of precipitable water and integrated vapor transport are present across the Atlanta metropolitan area during URDs. Thus, the entire atmospheric column is moister compared to average, which is supported by the composite sounding analysis shown later in Figure 10. Schroeder et al. (2016) found that for extreme urban flooding, precipitable water values were typically in the 1–3% range of historical values.
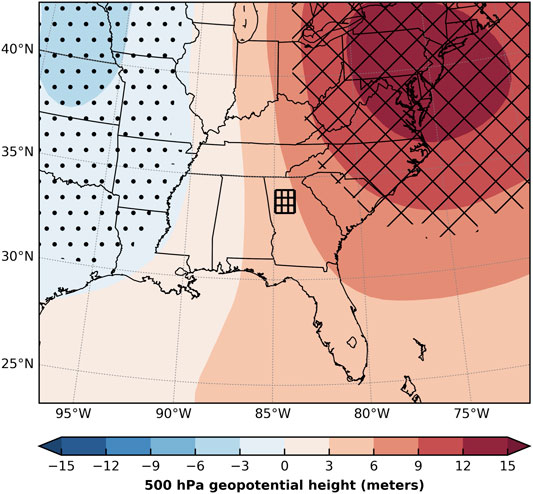
FIGURE 3. Composite anomaly map of 500 hPa geopotential height for URDs compared to non-URDs. Cross hatching (dot hatching) indicates height anomalies that are at least 1 standard deviation greater (lower) than the sample mean. The 9-cell gridded framework centered on Atlanta is indicated by the black-outlined boxes.
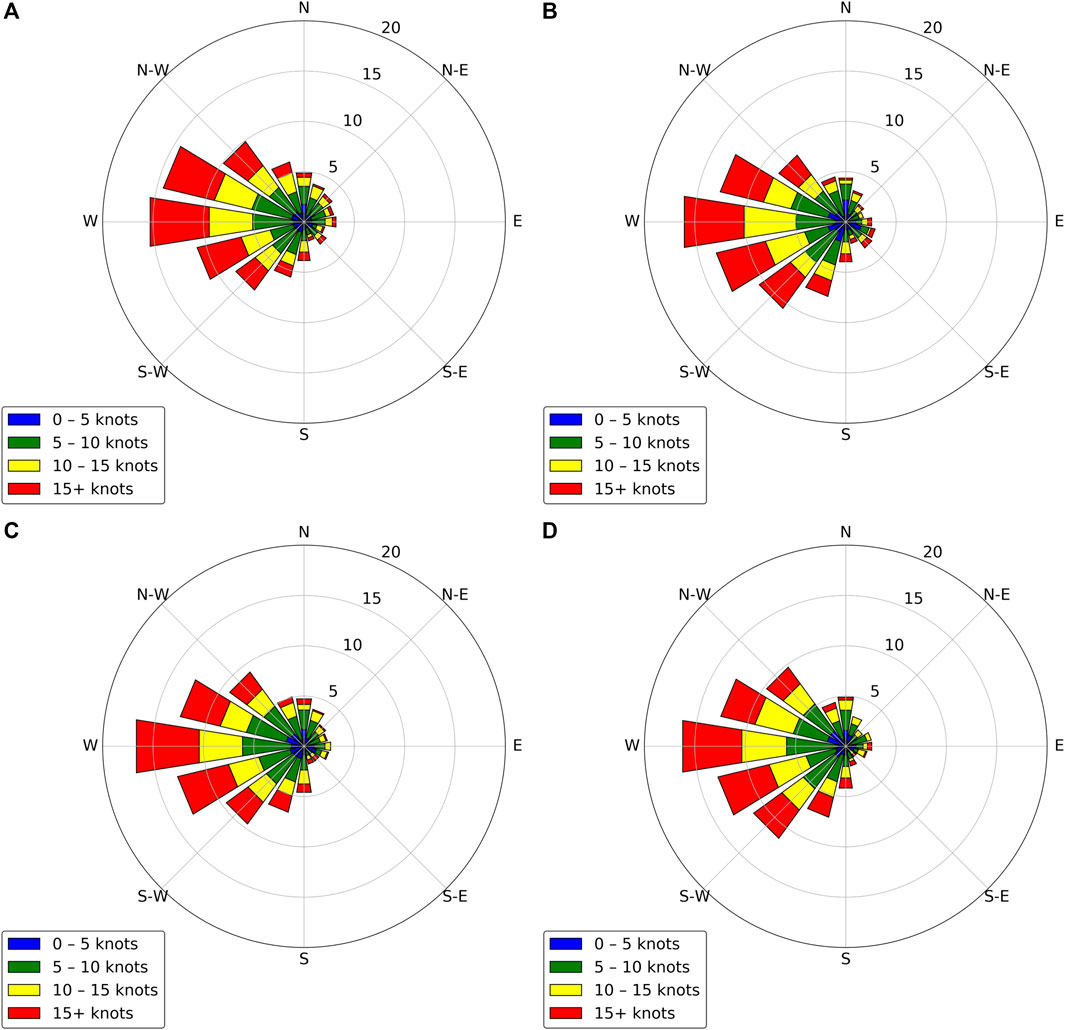
FIGURE 4. 700 hPa wind roses corresponding to (A) climatology, (B) the Debbage and Shepherd (2015) method of defining URDs, (C) the Mote et al. (2007) method of defining URDs, and (D) the novel method of defining URDs.
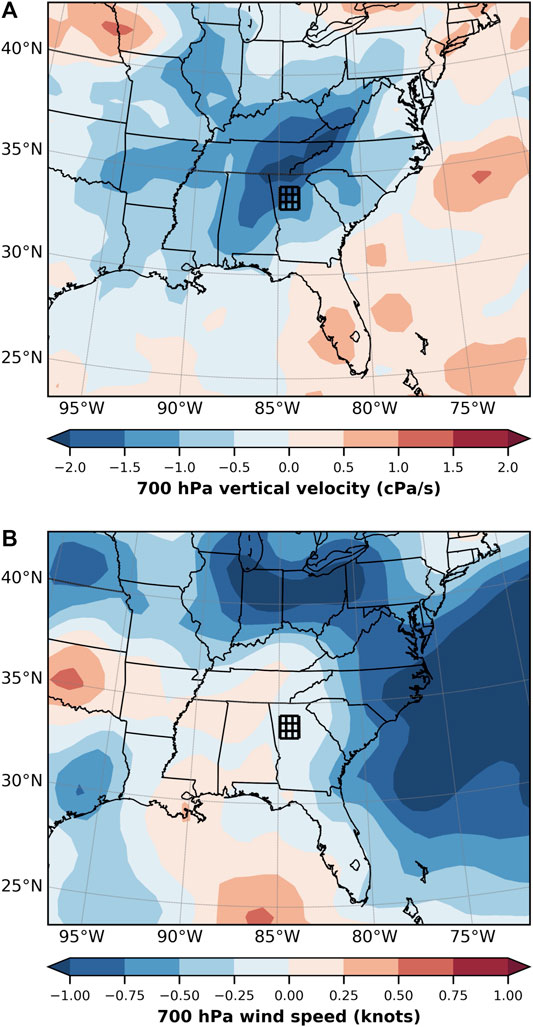
FIGURE 5. Composite anomaly map of (A) 700 hPa vertical velocity and (B) 700 hPa wind speed for URDs compared to non-URDs. The 9-cell gridded framework centered on Atlanta is indicated by the black-outlined boxes.
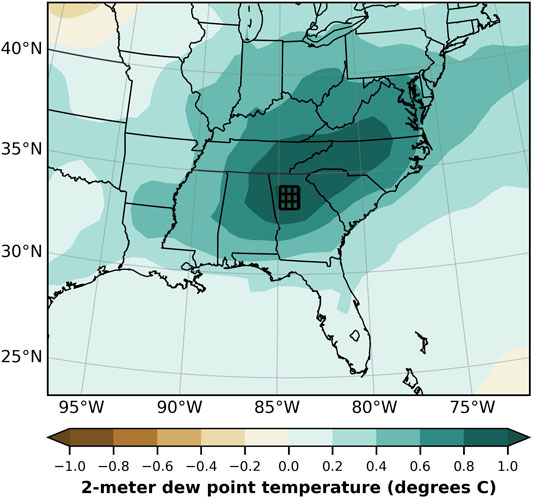
FIGURE 6. Composite anomaly map of 2-m dew point temperature for URDs compared to non-URDs. The 9-cell gridded framework centered on Atlanta is indicated by the black-outlined boxes.
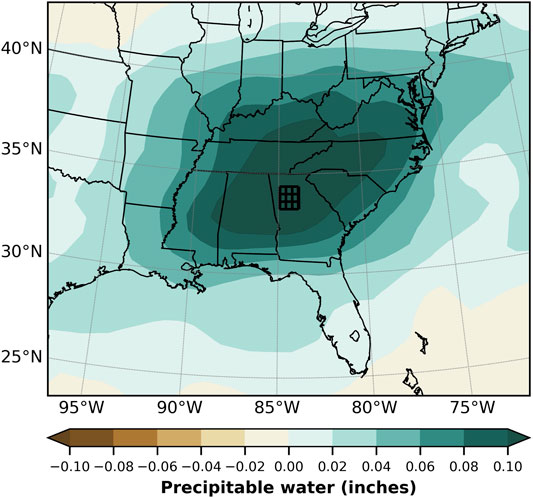
FIGURE 7. Composite anomaly map of precipitable water for URDs compared to non-URDs. The 9-cell gridded framework centered on Atlanta is indicated by the black-outlined boxes.
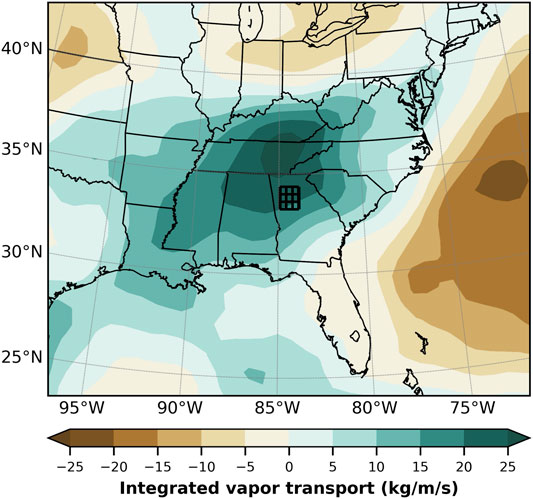
FIGURE 8. Composite anomaly map of integrated vapor transport for URDs compared to non-URDs. The 9-cell gridded framework centered on Atlanta is indicated by the black-outlined boxes.
In Figure 9, a HYSPLIT backward trajectory analysis is presented for the 99th percentile and greater URDs (n = 17 days), according to the novel method of defining URDs. It is clear that the most extreme URDs are characterized by low-level moisture transport from the Atlantic Ocean, while mid-level moisture transport occurs from the Gulf of Mexico. This deep-layer moisture transport from two subtropical bodies of water supports the positive anomalies in both precipitable water and integrated vapor transport that were shown over the Atlanta area in Figures 7, 8.
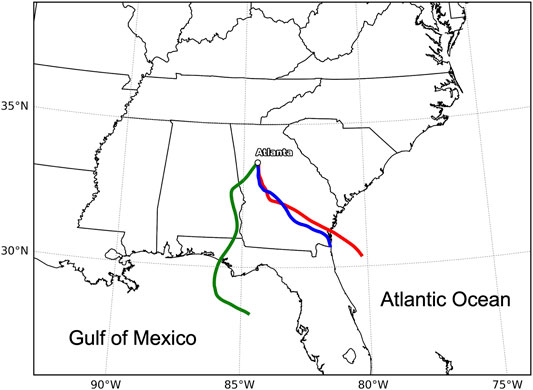
FIGURE 9. HYSPLIT backward trajectory analysis for the 99th percentile and greater URDs (n = 17 days). The trajectories are color-coded as follows: 10 m above ground level (red line), 500 m above ground level (blue line), and 1,500 m above ground level (green line).
Given that the synoptic environment on URDs are supportive for convection, a composite of 1,000 hPa divergence was conducted. Figure 10 shows that a broad area of convergence is present on URDs as compared to non-URDs. We hypothesize that the background convergent flow is a condition supportive of convective forcing at the meso-gamma scale associated with the urban environment itself. Shepherd el al. (2010) and Debbage and Shepherd (2019) found evidence of enhanced low-level convergence in their modeling studies of urban-enhanced convective precipitation.
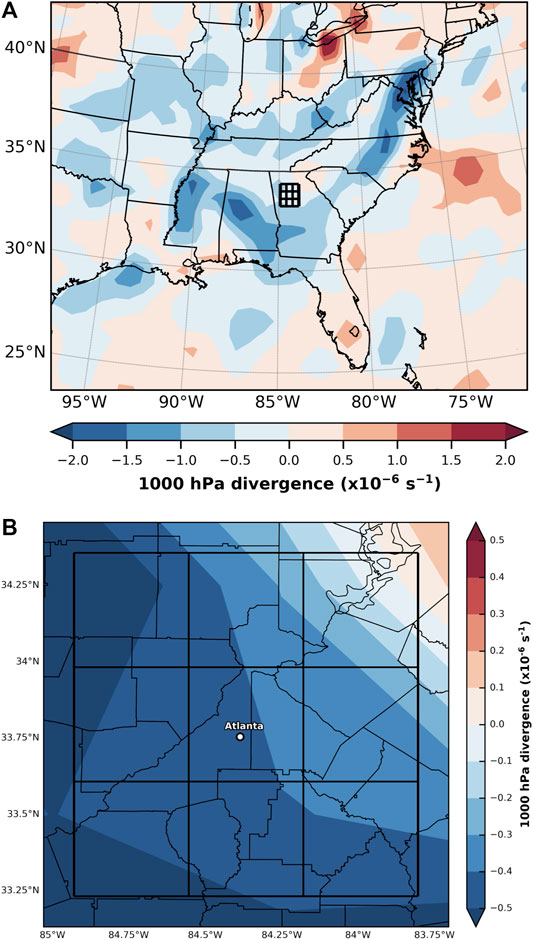
FIGURE 10. Composite anomaly map of 1,000 hPa divergence for URDs compared to non-URDs across the Southeast region (A) and the metropolitan Atlanta area (B). The 9-cell gridded framework centered on Atlanta is indicated by the black-outlined boxes.
The compositing results suggests that a synoptic urban convective regime (SUCR) represents a baseline environment supportive of the urban rainfall effect. However, additional analysis is required to add credibility to the SUCR hypothesis.
In Figure 4, 700 hPa wind roses for the three methods of defining URDs (Figures 4B–D) are compared against the climatological wind rose for all summer days during 2002–2019 (Figure 4A). While it is evident that the climatological wind rose is nearly identical to the other three wind roses, there are some important points that can be made with respect to URDs. First, URDs can occur under any wind direction at 700 hPa, but they are most commonly observed when the flow is southwesterly-to-northwesterly. Indeed, over 50% of URDs for any of the three methods observed southwesterly-to-northwesterly flow at 700 hPa. McLeod et al. (2017) captured this finding when describing the urban rainfall signature around Atlanta as “flow regime dependent.” In addition, URDs can occur under a wide range of 700 hPa wind speeds, but they most commonly occur when wind speeds are between 5 and 10 knots. Around one-third of URDs for any of the three methods observed 700 hPa wind speeds between 5 and 10 knots. McLeod et al. (2017) showed that slower 700 hPa wind speeds were more effective at producing positive precipitation anomalies directly over the Atlanta urban core, while faster wind speeds tended to be associated with enhanced precipitation downwind of the Atlanta urban core.
Figure 11 presents composite atmospheric soundings for all URDs identified using each of the three methods. Each sounding has a set of dashed and solid air temperature and dew point temperature lines. The dashed lines represent the climatological mean sounding for every June–August day during 2002–2019, while the solid lines represent only the URDs. The air temperature lines are mostly on top of each other, indicating very little difference between URDs and climatology. However, the dew point temperature lines for URDs are consistently warmer and closer to the air temperature lines, when compared against climatology. The atmosphere during URDs is thus more moist compared to the climatological average summer day, and this enhanced moisture can be found throughout the tropospheric column. Finally, the wind profiles reveal that flow is predominately westerly throughout much of the atmospheric column, with an increase in speed as pressure decreases with height.
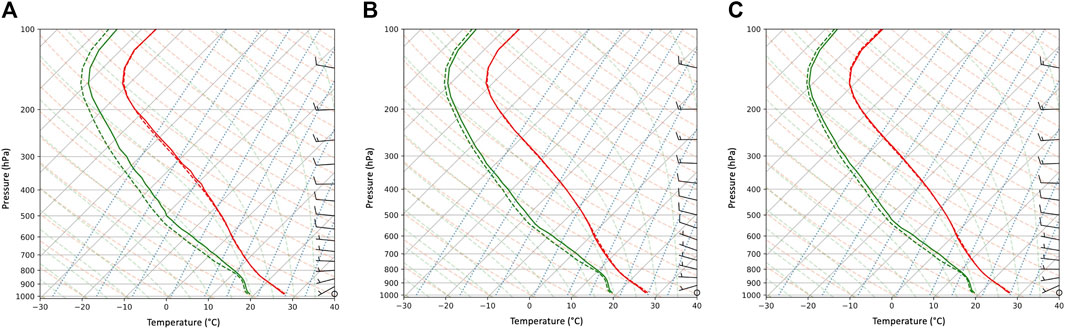
FIGURE 11. Composite soundings corresponding to (A) the Debbage and Shepherd (2015) method of defining URDs, (B) the Mote et al. (2007) method of defining URDs, and (C) the novel method of defining URDs. Each sounding has a set of dashed and solid air temperature (red) and dew point temperature (green) lines. The dashed lines represent the climatological mean sounding for every June–August day during 2002–2019, while the solid lines represent only the URDs.
These soundings indicate marginal instability, or the condition when localized convection is favored over widespread thunderstorm activity. The urban environment of Atlanta via the heat island and convergent forcing can more effectively initiate convection during periods of weak instability when the mesoscale dominates any synoptic-scale processes. These findings are strongly supported by Dixon and Mote (2003), who also performed a comparison of soundings between UHI-induced precipitation events and their climatological study period. While they found that both air temperature and dew point temperature differed significantly between UHI-induced precipitation days and average days, the differences for dew point temperature were much greater in magnitude, particularly in the bottom half of the troposphere (Dixon and Mote, 2003). This led them to conclude that low-level moisture, rather than UHI intensity, is the dominant factor controlling the occurrence of urban-generated convection.
Figures 12A–H show the results of the k-means cluster analysis, with the 8 clusters mapped across the Atlanta, GA region. Over 60% of the sample corresponds to days with relatively minimal precipitation (Cluster #2), which is consistent with the summertime climatology of thunderstorm activity across the Atlanta metropolitan area (Rose et al., 2008; Bentley et al., 2012). Most days during the summer are characterized by little to no convective precipitation. The next highest (∼20%) percentage of days occurs in Cluster #7, where the greatest precipitation occurs over northern portions of the region and within the urban core of Atlanta. This cluster provides some indication of an urban rainfall effect over the I-285 corridor of Atlanta, but the most compelling evidence of an urban rainfall effect can be found in Clusters #1 and #4. Though collectively occurring only about 8% of the time, these two clusters reveal a pronounced urban rainfall signal, as precipitation is maximized immediately over and downwind (i.e., to the east) of downtown Atlanta. Taken together, the results of this cluster analysis confirm that the urban rainfall effect can be readily detected in the summertime precipitation climatology across the Atlanta metropolitan area.
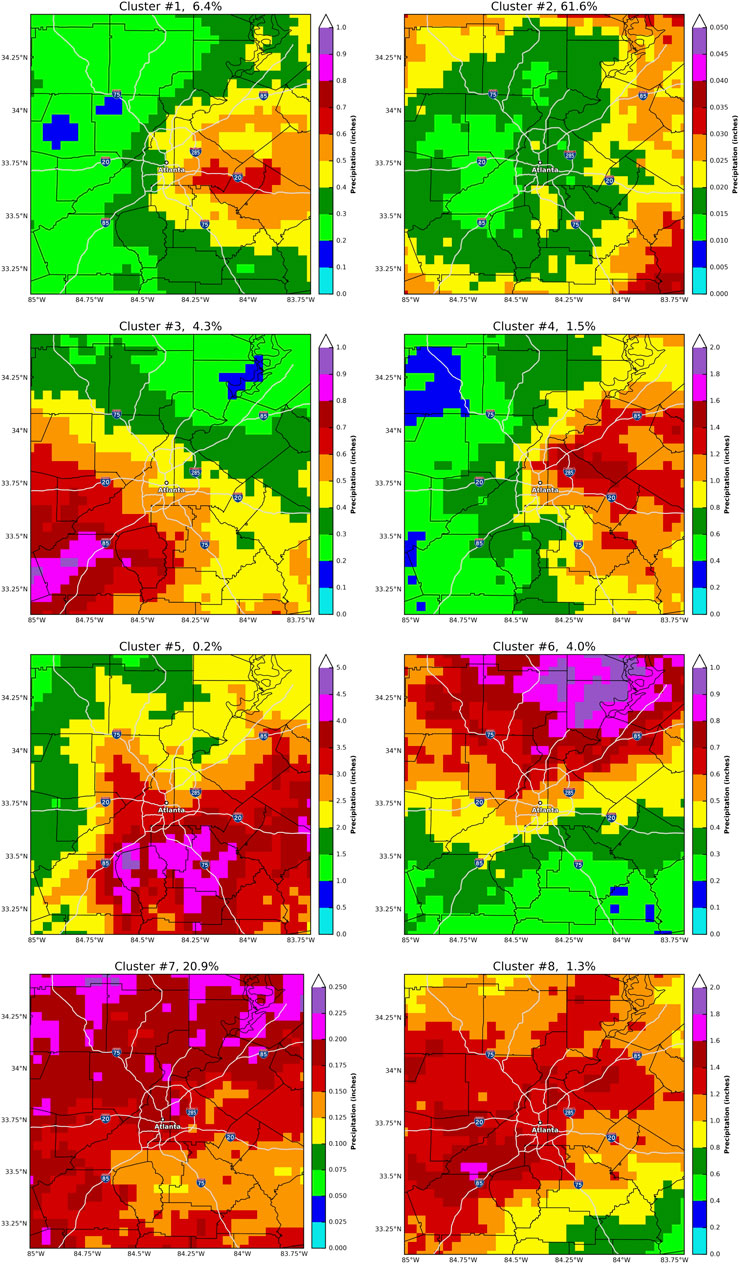
FIGURE 12. K-means cluster maps (1–8), with the percentage of days associated with each cluster located at the top of each map.
Overall, this study has moved the literature a step forward towards the predictability of the urban rainfall effect. Using a combination of synoptic compositing, wind rose, and k-means cluster analyses, a set of ingredients supportive of the urban rainfall effect in the Atlanta area are presented as representative of a synoptic urban convective regime (SUCR):
• Primarily southwesterly-to-northwesterly flow at 700 hPa
• Weaker-than-average winds at 700 hPa
• Weakly negative (strongly positive) 500 hPa height anomalies to the west (northeast)
• Anomalously moist surface and atmospheric column
• Background low-level convergent flow
Our analysis, possibly for the first time, also quantifies how often the urban rainfall effect occurs during the warm season. The k-means cluster analysis suggests that the urban rainfall effect is detectable in about 8% of the sample days.
Ultimately, the urban rainfall effect will need to be a part of detailed predictive capabilities by forecasters and modeling systems. This study has laid a basic foundation for understanding the synoptic-scale environment that is supportive of the urban rainfall effect. This could provide some initial guidance for forecasters on large-scale conditions in order to refine localized precipitation or lightning guidance around cities. Future regional modeling studies can evaluate our findings by conducting simulations of case days representative of this synoptic urban convective regime under varying urban landscape scenarios. A limitation of this study is the focus on one geographic region. Future studies should consider other cities and methodologies like self-organizing maps.
Publicly available datasets were analyzed in this study. The MPE database can be found here: http://convection.meas.ncsu.edu:8080/thredds/catalog/ncep/mpe/netcdf/stage4/catalog.html. The ERA-Interim reanalysis dataset can be found here: https://www.ecmwf.int/en/forecasts/datasets/reanalysis-datasets/era-interim. The University of Wyoming atmospheric sounding data can be found here: http://weather.uwyo.edu/upperair/sounding.html. The HYSPLIT backward trajectory data can be found here: https://www.ready.noaa.gov/HYSPLIT_traj.php.
MS and JM contributed equally to the development of this manuscript including analysis and interpretation. JM generated much of the data analysis and MS conducted the interpretation and writing. JM also assisted with writing and interpretation.
This research was funded by NASA Grant 80NSSC20K1268.
The authors declare that the research was conducted in the absence of any commercial or financial relationships that could be construed as a potential conflict of interest.
All claims expressed in this article are solely those of the authors and do not necessarily represent those of their affiliated organizations or those of the publisher, the editors, and the reviewers. Any product that may be evaluated in this article, or claim that may be made by its manufacturer, is not guaranteed or endorsed by the publisher.
The authors acknowledge the NASA Interdisciplinary Science Program (NASA IDS). We particularly acknowledge the guidance of Kathy Hibbert and Aaron Pina. We also extend a special acknowledgment to Gail Skafronick-Jackson.
Ashley, W. S., Bentley, M. L., and Stallins, J. A. (2012). Urban-Induced Thunderstorm Modification in the Southeast United States. Climatic Change 113 (2), 481–498. doi:10.1007/s10584-011-0324-1
Bentley, M. L., Stallins, J. A., and Ashley, W. S. (2012). Synoptic Environments Favourable for Urban Convection in Atlanta, Georgia. Int. J. Climatol. 32 (8), 1287–1294. doi:10.1002/joc.2344
Debbage, N., and Shepherd, J. M. (2015). The Urban Heat Island Effect and City Contiguity. Comput. Environ. Urban Syst. 54, 181–194. doi:10.1016/j.compenvurbsys.2015.08.002
Debbage, N., and Shepherd, J. M. (2019). Urban Influences on the Spatiotemporal Characteristics of Runoff and Precipitation during the 2009 Atlanta Flood. J. Hydrometeorology 20 (1), 3–21. doi:10.1175/jhm-d-18-0010.1
Dee, D. P., Uppala, S. M., Simmons, A. J., Berrisford, P., Poli, P., Kobayashi, S., et al. (2011). The ERA-Interim Reanalysis: Configuration and Performance of the Data Assimilation System. Q.J.R. Meteorol. Soc. 137, 553–597. doi:10.1002/qj.828
Dixon, P. G., and Mote, T. L. (2003). Patterns and Causes of Atlanta's Urban Heat Island-Initiated Precipitation. J. Appl. Meteorol. 42, 1273–1284. doi:10.1175/1520-0450(2003)042<1273:pacoau>2.0.co;2
Fulton, R. A., Breidenbach, J. P., Seo, D. J., Miller, D. A., and O’Bannon, T. (1998). The WSR-88D Rainfall Algorithm. Weather Forecast. 13 (2), 377–395. doi:10.1175/1520-0434(1998)013<0377:twra>2.0.co;2
Hand, L., and Shepherd, J. M. (2009). An Investigation of Warm Season Spatial Rainfall Variability in Oklahoma City: Possible Linkages to Urbanization and Prevailing Wind. J. Appl. Meteorology Climatology 48, 251–269. doi:10.1175/2008JAMC2036.1
Jin, M., and Shepherd, J. M. (2008). Aerosol Relationships to Warm Season Clouds and Rainfall at Monthly Scales over east China: Urban Land versus Ocean. J. Geophys. Res. Atmospheres 113 (D24), 1–12. doi:10.1029/2008jd010276
Johnson, B., and Shepherd, J. M. (2018). An Urban-Based Climatology of winter Precipitation in the Northeast United States. Urban Clim. 24, 205–220. doi:10.1016/j.uclim.2018.03.003
Landsberg, H. E. (1956). The Climate of Towns. Man’s Role in Changing the Face of the Earth 2, 584–606.
Liu, J., and Niyogi, D. (2019). Meta-Analysis of Urbanization Impact on Rainfall Modification. Sci. Rep. 9 (1), 7301–7314. doi:10.1038/s41598-019-42494-2
McLeod, J., Shepherd, M., and Konrad, C. E. (2017). Spatio-Temporal Rainfall Patterns Around Atlanta, Georgia and Possible Relationships to Urban Land Cover. Urban Clim. 21, 27–42. doi:10.1016/j.uclim.2017.03.004
Mitra, C., and Shepherd, M. (2016). “Urban Precipitation: A Global Perspective,” in The Routledge Handbook of Urbanization and Global Environment Change. Editors K. C. Seto, and W. Solecki (London, United Kingdom: Routledge), 152–168. Chapter 11.
Mitra, C., Shepherd, J. M., and Jordan, T. (2012). On the Relationship between the Premonsoonal Rainfall Climatology and Urban Land Cover Dynamics in Kolkata City, India. Int. J. Climatol. 32 (9), 1443–1454. doi:10.1002/joc.2366
Mote, T. L., Lacke, M., and Shepherd, J. M. (2007). Radar Signatures of the Urban Effect on Precipitation Distribution: a Case Study for Atlanta, Georgia. Geophys. Res. Lett. 34 (20), L20710. doi:10.1029/2007GL031903
Rolph, G., Stein, A., and Stunder, B. (2017). Real-Time Environmental Applications and Display System: Ready. Environ. Model. Softw. 95, 210–228. doi:10.1016/j.envsoft.2017.06.025
Rose, L. S., Stallins, J. A., and Bentley, M. L. (2008). Concurrent Cloud-To-Ground Lightning and Precipitation Enhancement in the Atlanta, Georgia (United States), Urban Region. Earth Interactions 12 (11), 1–30. doi:10.1175/2008EI265.1
Schmid, P. E., and Niyogi, D. (2013). Impact of City Size on Precipitation‐modifying Potential. Geophys. Res. Lett. 40 (19), 5263–5267. doi:10.1002/grl.50656
Schroeder, A., Basara, J., Shepherd, J. M., and Nelson, S. (2016). Insights into Atmospheric Contributors to Urban Flash Flooding across the United States Using an Analysis of Rawinsonde Data and Associated Calculated Parameters. J. Appl. Meteorology Climatology 55 (2), 313–323. doi:10.1175/JAMC-D-14-0232.1
Seo, D.-J. (1998). Real-Time Estimation of Rainfall fields Using Radar Rainfall and Rain Gage Data. J. Hydrol. 208, 37–52. doi:10.1016/S0022-1694(98)00141-3
Seo, D.-J., Seed, A., and Delrieu, G. (2010). “Radar and Multisensor Rainfall Estimation for Hydrologic Applications,” in Rainfall: State of the Science (Geophysical Monograph Series). Editors F. Y. Testik, and M. Gebremichael (Washington, DC: American Geophysical Union), 191, 79–104. doi:10.1029/2010gm000952
Seto, K. C., and Shepherd, J. M. (2009). Global Urban Land-Use Trends and Climate Impacts. Curr. Opin. Environ. Sustainability 1 (1), 89–95. doi:10.1016/j.cosust.2009.07.012
Shepherd, J. M., Andersen, T., Strother, C., Horst, A., Bounoua, L., and Mitra, C. (2013). Urban Climate Archipelagos: A New Framework for Urban Impacts on Climate. IEEE Earthzine. Available at: https://earthzine.org/urban-climate-archipelagos-a-new-framework-for-urban-impacts-on-climate/ (Accessed May 6, 2020).
Shepherd, J. M., Pierce, H., and Negri, A. J. (2002). Rainfall Modification by Major Urban Areas: Observations from Spaceborne Rain Radar on the TRMM Satellite. J. Appl. Meteorology 41 (7), 689–701. doi:10.1175/1520-0450(2002)041<0689:rmbmua>2.0.co;2
Shepherd, J. M., Carter, M., Manyin, M., Messen, D., and Burian, S. (2010). The Impact of Urbanization on Current and Future Coastal Convection: A Case Study for Houston. Environ. Environ. Plann. B Plann. Des. 37, 284–304. doi:10.1068/b34102t
Sieck, L. C., Burges, S. J., and Steiner, M. (2007). Challenges in Obtaining Reliable Measurements of point Rainfall. Water Resour. Res. 43 (1), 1–23. doi:10.1029/2005WR004519
Smith, J. A., Seo, D. J., Baeck, M. L., and Hudlow, M. D. (1996). An Intercomparison Study of NEXRAD Precipitation Estimates. Water Resour. Res. 32 (7), 2035–2045. doi:10.1029/96WR00270
Stein, A. F., Draxler, R. R., Rolph, G. D., Stunder, B. J. B., Cohen, M. D., and Ngan, F. (2015). NOAA's HYSPLIT Atmospheric Transport and Dispersion Modeling System. Bull. Amer. Meteorol. Soc. 96, 2059–2077. doi:10.1175/BAMS-D-14-00110.1
University of Wyoming (2020). Weather. Dept. Of Atmospheric Science. University of Wyoming. Available online at http://weather.uwyo.edu/upperair/sounding.html (Accessed April 25, 2020).
Keywords: urban, rainfall, synoptic, Atlanta, K-means, MPE, reanalysis
Citation: McLeod J and Shepherd M (2022) A Synoptic Framework for Forecasting the Urban Rainfall Effect Using Composite and K-Means Cluster Analyses. Front. Environ. Sci. 10:808026. doi: 10.3389/fenvs.2022.808026
Received: 02 November 2021; Accepted: 15 February 2022;
Published: 16 March 2022.
Edited by:
Ashish Sharma, University of Illinois at Urbana-Champaign, United StatesReviewed by:
Zhonghua Zheng, Columbia University, United StatesCopyright © 2022 McLeod and Shepherd. This is an open-access article distributed under the terms of the Creative Commons Attribution License (CC BY). The use, distribution or reproduction in other forums is permitted, provided the original author(s) and the copyright owner(s) are credited and that the original publication in this journal is cited, in accordance with accepted academic practice. No use, distribution or reproduction is permitted which does not comply with these terms.
*Correspondence: Marshall Shepherd, bWFyc2hnZW9AdWdhLmVkdQ==
Disclaimer: All claims expressed in this article are solely those of the authors and do not necessarily represent those of their affiliated organizations, or those of the publisher, the editors and the reviewers. Any product that may be evaluated in this article or claim that may be made by its manufacturer is not guaranteed or endorsed by the publisher.
Research integrity at Frontiers
Learn more about the work of our research integrity team to safeguard the quality of each article we publish.