 Geoff Sawyer
 Eleftherios Mamais
 Dimitri Papadakis2*
- 1European Association of Remote Sensing Companies, Brussels, Belgium
- 2Evenflow, Brussels, Belgium
The role of Earth Observation (EO) data from satellites in supporting informed decision-making and more efficient operational processes is becoming increasingly recognized. However, analysing the value that this generates remains a challenge. Often, top-down cost-benefit analyses are used to justify budgets but with very broad-based, macro-economic assumptions. The approach discussed in this paper is bottom-up building on the use of a single product or service arising from the use of data coming from one or more of the Copernicus Sentinel satellites. This allows a much finer, detailed understanding of how the data is being used and hence contributing to informed decision making. A case-based, value-chain methodology has been applied through which the impact on society can be analysed. Whilst early cases focused on economic value i.e., monetized benefits, later ones recognise that often the benefits may be wider than this. For instance, organisations can benefit through an increased reputation, or societal values such as quality of life can be felt. Consequently, a set of non-monetary dimensions have been defined which provide a new framework for the analysis. The six dimensions are described in the paper and have been tested on a significant number of recent cases. The paper describes the updated methodology and the results obtained through its application.
Introduction
The role of Earth Observation (EO) data from satellites to support informed decision-making and more efficient operational processes is becoming increasingly recognized. Both public actors–who have been traditionally the driver of investments in Earth Observation systems - and private companies, are seeking to exploit information stemming from the use of EO data across a wide range of sectors (agriculture, disaster management, environmental monitoring, etc.). Yet, a thorough understanding of the value of this information is still, to a large extent, lacking. With increasing attention being placed on environmental sustainability, digitalization and economic viability, by policy makers and industry actors alike, it becomes essential to understand and quantify the benefits from the use of satellite-derived information.
In Europe, this effort has centered around the Copernicus Programme, providing access on a full, free and open basis to the Sentinel satellites’ data. This, together with other data collected by contributing missions and ground, sea or airborne instruments, is used to support key economic or societal areas, underpinned by strategic, cross-cutting policies. Sentinel data are thus a key component of the Copernicus Programme contributing to the Copernicus Services and serving as a crucial data source used by companies and public organisations alike to generate products and services.
Initially, the programme has been subject to cost-benefit analyses which have provided the justification evidence to convince policy makers to make the large investments necessary. These analyses have been, typically, macro-economic, lacking thus–by construction–the ability to illuminate fine details around the use of Copernicus Sentinel data and the benefits this generates. The Sentinel Benefits Study (SeBS) has been established to address precisely this issue. The core of the analysis is to understand how a specific EO-derived service is being used by an organisation which is in turn, benefiting others and ultimately society and citizens at large. The approach is bottom-up, based on the evaluation of a value chain. In this, it differs from the cost-benefit studies which work top-down at a macro-economic scale. The approach has been developed and tested through the analysis of over 20 case studies. Through this portfolio of cases, the methodology has been strengthened to cover not only economic benefits but also to include non-monetary ones. This process has yielded a number of well-defined indicators against six dimensions of benefit: economic, environmental, regulatory, innovation and entrepreneurship, science and technology, and, finally, societal. This paper presents key cross-cutting findings of the analysis of the more than 20 cases, underlining the strength of the SeBS value chain approach for the assessment of the benefits stemming from the use of Sentinel data. For full details of each case, we refer the reader to respective case reports.
Methods
Building on earlier work by Geoff Sawyer and Marc de Vries in 20151, SeBS deploys a rigorous analytical approach to assess the value of information (for other relevant approaches see for instance Macauley 2005; Pearlman et al., 2016; Bernknopf et al., 2018) produced thanks to the use of Copernicus Sentinel data in well-defined operational scenarios. This earlier work included three case studies and mostly focused on economic benefits, whereas the new cases studied under SeBS include assessments of all six dimensions of benefit: economic, environmental, regulatory, innovation and entrepreneurship, science and technology, societal. In that regard, SeBS has developed a balanced portfolio of cases whereby Copernicus Sentinel data is used operationally and contributes to better decisions or actions by different actors along the value chain. It is therefore essential to understand how the EO service fits into the operational process of the primary user and which decisions or actions it empowers along the value chain reflecting the beneficiaries of the services deriving from the primary user. This extends to wider societal benefits for citizens and society. Thus, for each of the cases, SeBS sets out to conduct bottom-up quantitative and qualitative assessments of the benefits using different analytical tools appropriate for each case. The results of the analysis are presented with a powerful storytelling approach, which includes short cases using a simplified (and less rigorous) methodology than the full reports. The full reports also provide insights on the extrapolation of results and the attribution of the role of Sentinels. The overarching methodological approach is presented in a report (Sawyer and Papadakis, 2020) and summarised in Figure 1, followed by a discussion of key aspects around its components.
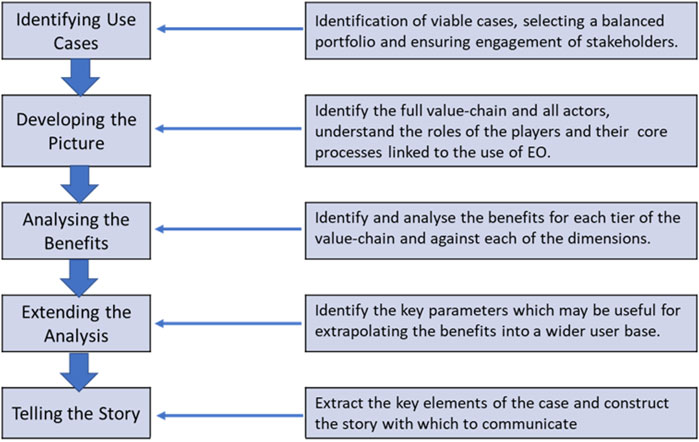
FIGURE 1. Overview of the SeBS case Methodology.
Developing a Portfolio of Cases
Generally, finding a case starts from the perspective of an EO service. Given the fairly strict criteria for selecting cases, a wide search is made, and the list of potential cases is constantly refreshed and reviewed to identify candidates. This involves scouring all possible sources, including social media, for news of services or service providers promoting new products. As these are found they are reviewed against the first key criteria for feasibility, which will involve making initial contact with one of the stakeholders in the case, most usually the service provider.
For SeBS, our goal is to study and promote the value coming from the use of Sentinel data, hence, a key criterion is that some form of Sentinel data is being used to generate the service. However, other analyses may start from another perspective and the SeBS methodology could equally be applied to these other situations.
The key criteria which are first reviewed for SeBS are:
• Sentinel data: this is a fundamental requirement for this work. It does not mean that only Sentinel data is being used and indeed this would be unlikely, but there should be a certain dependence on the Sentinel data to be valid for our work. There may also be cases which are based on the prospective use of Sentinel data. In other words, a service has been built up using a data source which is, or can be, replaced by data coming from one of the Sentinel satellites.
• Operational use: this is essential as it guarantees that there is an understanding of the way that the data is integrated into operational processes and this is understood sufficiently well that the value generated by using satellite data can be analysed. This means that the primary user has used the data enough to be able to describe the impact it is having. Note that, as stated above, the meaning of operational may sometimes be stretched and includes event-based cases (e.g., floods) as well as project-oriented ones. On the other hand, where the use is part of a research project, it is considered too immature to be suitable for analysis.
• Primary user engagement: this has been found to be a critical step to a case being feasible and so is introduced as a criterion at the very beginning of the selection process. It is difficult to overestimate how important it is that the primary user is fully engaged, and not just the contact but their management hierarchy as well. It is extremely disruptive if the primary user moves to a different job or work on the case is suspended by management. Ideally, an initial conversation is held with the primary user otherwise the service provider is asked to validate this point.
• Willingness to share information: for a full case, the service provider and the primary user must be willing to be open with what may be quite sensitive information. Cases are of value to both of these stakeholders as marketing tools either for commercial sales or to demonstrate the value of work that is being done. The level of information to be shared is a key determinant between full and short cases. These points will all be discussed with the service provider who must be fully committed for the case to proceed.
In SeBS, the objective is to analyze many different use cases that use the Copernicus Sentinels’ data and ultimately to form a portfolio of suitable cases. If a case is considered feasible, it will then be evaluated against several additional criteria which reflect its fit into the overall portfolio. This means that some good or even excellent cases get set aside as they do not fit the portfolio needs.
Having an extensive portfolio of cases provides an excellent opportunity to extract more knowledge concerning applications and the value chain. For our work on SeBS, the key criteria are:
• Location of use: most of the SeBS cases are analysed in relation to a single (European) country. The exceptions are those cases which have a regional or global dimension. The country is important reflecting the political nature of the Copernicus Programme and its Sentinel satellites. At least one of the key players in the case should be from a country participating to the Copernicus programme and a balance of countries should be reflected in the final portfolio of cases–as it builds up in time.
• Applications: the thematic application of the cases should be balanced whilst at the same time multiple examples of similar cases will also be attractive to develop cross-cutting lessons. Hence, this is not a straight-forward criterion to evaluate and relies a lot on judgement.
• The Value chain: for the SeBS methodology to work, a value chain must be described such that further stakeholders may be identified. This may be developed at this point in the study but will mostly be done during the initial steps of the next phase.
As we have progressed, another criterion has started to emerge. This relates to the nature of the organisations and hence the more dominant benefits that shall apply. An example is the use of EO services by public organisations and hence the benefit to tasks related to public policies or operations administrations. These are often not monetary benefits and fall more in the category of improving services to citizens.
At the end of this stage of the process, it should be clear whether the case is to be analysed and if so, whether it will be done as a full case or a short case. At the time of writing SeBS has collected 250 potential cases, of which 15 have been analysed as full cases and 8 as short ones.
Conducting Value Chain Analyses
At the heart of the SeBS methodology is the value chain approach. Before starting to explain the steps taken to assess benefits in individual cases, it is first important to explain what this means.
The principle for the case analysis is that a single product derived from EO data is used by a user organisation. This organisation is referred to as the primary user and is placed at tier two in the value chain (Figure 2).
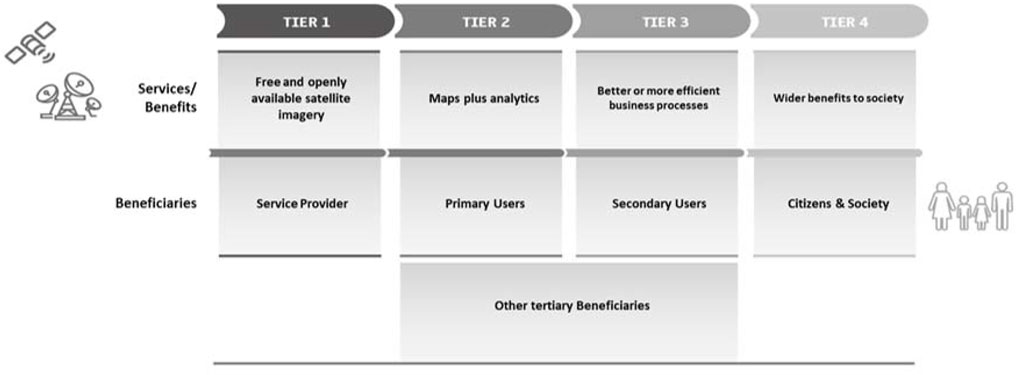
FIGURE 2. Illustration of the Value chain.
We define the value chain as having 4 “tiers”. Early cases had more than four tiers in the value chain but, as the work has progressed, we have moved to restrict it to 4. In each case, tier one is the “service provider”, tier two is the “primary user”. Tier three are the “secondary users” i.e., all the specific users of the service provided by the primary user, and tier four is the wider “citizens and society”. Note that the tier three users are those directly linked to the function which the primary user is providing. For an agriculture case, it may be food processors or chemical suppliers, for a roads case, it may be engineering companies. There may be tertiary beneficiaries who sit alongside the main value chain, being government bodies or other institutions with a direct responsibility or interest in the sector. For example, the Ministry of Agriculture and the Ministry of Environment would be relevant for an agriculture case.
The starting point for each case study is the value chain. For each tier, we shall seek to identify the benefits brought about by the availability of the data. This means analysing the increase in efficiency and effectiveness of operations as a result of better decision-making due to the availability of enhanced information.
Achieving this means a close understanding of the case—“getting under the skin of a case”—and the first step in this phase of the work will be interviews with the primary user and some representative tier three beneficiaries. These may be conducted by phone, but face-to-face meetings, especially with the primary user, are much to be preferred.
The next step is to assess the degree or scale of the benefit in such a way that cases may be quickly understood and compared if a number of similar cases exist have already been analysed. In the longer run, this will allow comparisons of cases in the same country or for the same application area (e.g. agriculture) or using the same technology (e.g. Ground ground motion maps).
The final step is to extend the analysis, if necessary, to the required boundary. Most usually, for SeBS, this will be a national one and impacts primarily the benefits in the economic dimension. For example, the analysis on aquifer management in the Murcia region2 has been extended to the whole of Spain based on the other regions of Spain which are extracting water from aquifers.
Another way of considering the value chain is through the inputs and outputs at each tier. In our representation, the input for the supplier is satellite data and their output are maps or analyses in the form of geospatial information. These in turn form the input to tier two whilst the output from the primary user depends strongly on their business processes and the decisions which are taken as a result of using the information - which is also the case for tier 3. Finally, the social benefits come in many forms which cannot easily be characterised. For each case, this value chain should be drawn up with case specific data introduced into the visual representation.
• In tier 1, the service provider is using the satellite data along with any other data and transforming it into maps or other information for the use of the primary user. At this point, the nature of the service is rather clear.
• In tier 2, the primary user is transforming the value through their business process. In selecting the case, it has been determined that the EO service has become integral to their business process. Hence the business process and consequent decisions need to be understood to be able to estimate the benefits associated with its use.
• In tier 3, the effect of the service has become strongly diluted to the extent that its dependancy on the use of satellite data may be completely invisible to a tier three stakeholder. In other words, they are benefiting from improved outputs produced by the primary user and hence are largely unaware that satellite data is being used. For example, a roads agency may use satellite data to identify the risk of the ground movement, but the engineers or construction workers are only concerned with the defined works and not how the route was chosen. Similarly, a farmer may be using data concerning his fields to manage his crops, but his customers are only interested in the quantity and quality of the crops. Again, the business process must be evaluated to determine the benefit which is being generated. As we move down the value chain, the question of attribution becomes more prevalent.
• In tier 4, the benefits of the satellite data have become very diffuse and the general population, citizens and society, will will typically be completely unaware that there are any links with satellites! They may suffer fewer delays on the roads but have no idea of the process going on to achieve this or that satellite data has been used to determine a route which will hopefully avoid remedial works in the future. In many ways, this emphasizes one of the objectives of the SeBS studies; to make the citizens and their representatives aware of the true value being created.
This approach now reveals a very important factor. Benefits are realised at each tier of the value chain, but they may be non-monetary in nature. It is this realisation that has progressively given rise to the framework of the six dimensions of benefits discussed below.
Executing Bottom-Up Assessment of Benefits Against six Dimensions
As more cases were developed, patterns began to emerge leading to further and deeper insights into value creation. This led us to explore the non-monetary benefits in more detail and to start to identify and classify them.
The Ireland case3 showed how the synoptic view, obtained through the use of Sentinel data, enabled co-operation between different emergency services and even allowed these services to improve their communication with the general public via the publication of punctual maps in local newspapers. In Belgium4, the use of countrywide maps of potato crops enabled the different political levels in the country as well as experts from different domains, to come together to address common issues. These two cases showed the benefit of “working together”.
In Sweden5, the regulatory approach of “freedom with responsibility” adopted for managing the country’s forests, provides a framework whereby the 300,000 individual owners of forest, are encouraged to behave in ways which develop the timber stock and increase its value. This has a strategic benefit for the country. In Greenland6 and in the Baltic7, the harsh environment makes everyday life hard during the winter. The use of Sentinel data enables the many remote towns and communities to be supplied and to transport goods for sale. Life in these areas would be very different without the means to sail through the winter ice. The use of Sentinel data improves the reliability of the ship transport and ensures that the remote communities are able to develop. Hence the service has a strategic value to these countries.
In Norway8, the use of a map showing movement of the ground provides regulators with important information around construction works. Knowing if and when any movement has occurred more precisely than is possible by other means, enables improved regulations to be developed. The same applies in Spain9 where movement of the land surface due to underground water abstraction can be monitored far more precisely using Sentinel one InSAR technology. The alternative, sensors at each well-head provide point measurements whilst the satellite data provides measurements made over a larger area. Damage to buildings can be avoided by applying better and more precise controls over the regulated abstraction.
All these examples show how understanding the value creation and how it is being driven leads to new insights into the value of the data. As this has developed, we have defined six classes of benefits which are used as a focus on new cases (Table 1).
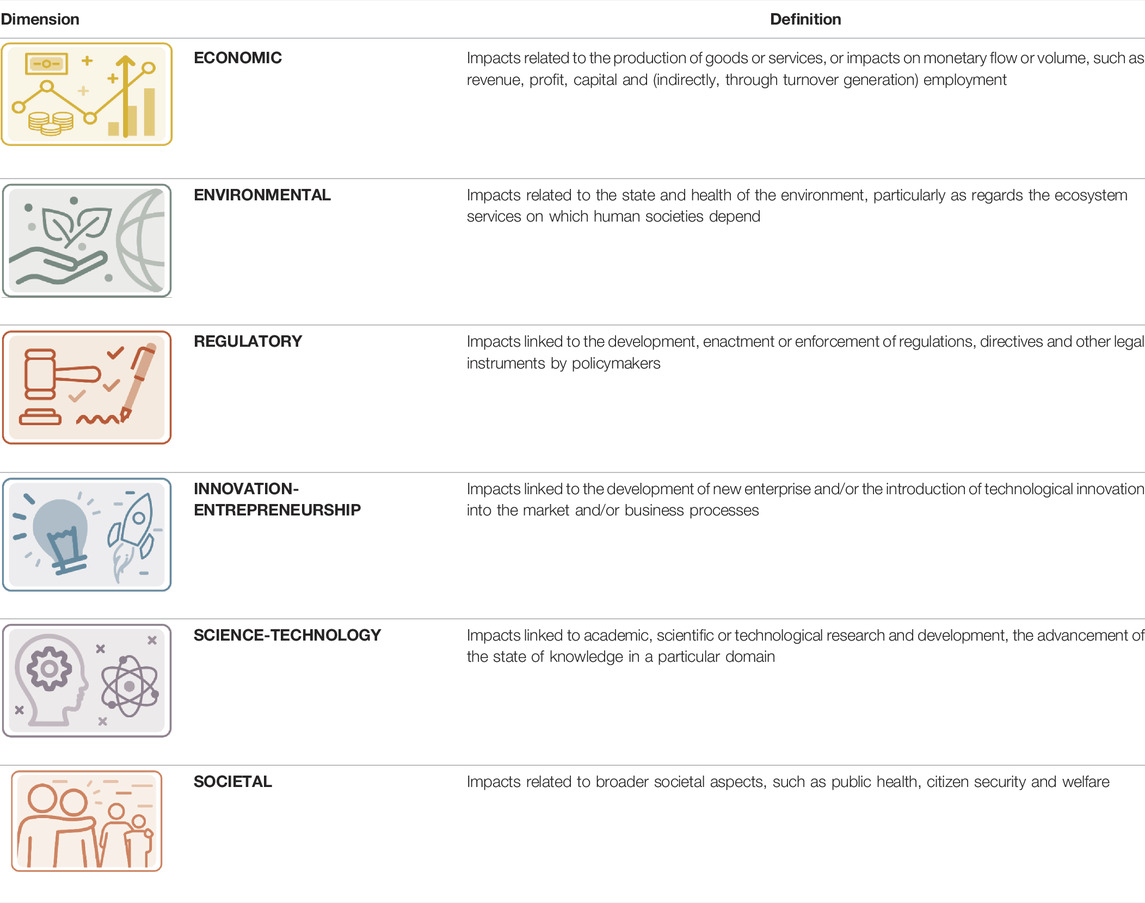
TABLE 1. Framework for analysis of benefits against six dimensions.
In order to help evaluate each of these dimensions, a set of indicators has been developed as a guide.
Indicators and a Scale of Benefits
To assess the benefits in each dimension, we introduced and tested a set of indicators which represent standardized types in which a certain benefit can be manifested. A “set” is given for each dimension, oriented towards the impact which the EO data has along the case value chain. The indicators are not rigid, nor mutually exclusive and may in fact be overlapping, e.g., economic benefits are likely entailing improved living conditions and welfare, but both dimensions are worthy to be considered. For example, when we identify “quality of life from increased leisure activities” as a benefit for Swedish forest owners, it is a benefit in the societal dimension which is also given an economic representation through the perceived value of the leisure utility. The specific indicators currently forming our methodological framework under each of the dimensions of benefit are discussed in this methods section and then again as part of the presentation of results. The economic indicators are all quantitative and expressed in monetary terms e.g., Euro. Some of the other indicators may also be quantified but not monetised i.e., number of research papers, numbers of employees, but the majority are qualitative.
Hence, to provide a visual representation of the importance of the indicator and by extension, the dimension, a grading system or scale from 0 to 5 has been introduced. The scale is applied to all of the dimensions and is by definition subjective. Thus, the analyst uses their judgement to assess the importance of a dimension for a given case. In that regard, a simple rule serves as guidance: zero indicates no relevance whatsoever now or in the future; one indicates a latent benefit where there are potential benefits but without any having been identified during the analysis; two to five is where some benefit is manifest and is judged as a level to be low, moderate, high, or exceptional. At present the scale is applied to the whole dimension which leads to difficulty in its definition. This arises as indicators of differing factors are being combined and hence all are taken into account in assigning the subjective value. This could be an area for improvement in the future but for now, relies on the judgement of the analyst on whether the importance is small, considerable, or significant. Only for the economic dimension have we tried to introduce some specific values but even this is difficult to apply when comparing the benefits today with those potentially available in the future.
More precise evaluation and grading of the dimensions can be imagined if these are made at the level of the indicator which are then combined to provide an overall grade. The increased precision needs to be balanced against the considerably increased effort to evaluate and grade each indicator which is relevant.
With a growing number of cases across different geographic and application areas, a benchmarking exercise can be attempted which could help to refine the reference scales and enlarge their representativeness at the same time as making them easier to apply. The use of indicators is discussed in detail below against each of the six dimensions.
Economic Benefit Indicators
The economic benefits are those related to the economic performance of the actors at each tier of the value chain. By definition, the benefits can be monetised although this may not always be easy to do. This is the hardest part of analysing the benefits and consumes the most time and effort. It requires the development of models representing the way in which the business process is generating value. Often, direct figures are not available from the primary user or other stakeholders, and we must rely on many assumptions which are each clearly stated. The indicators which have been used in cases to estimate economic benefits are shown in Table 2.
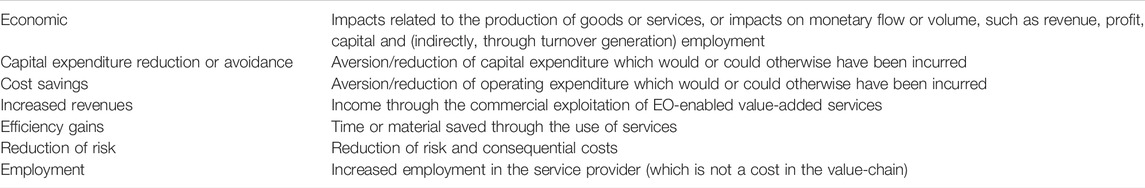
TABLE 2. Indicators of economic benefits.
Economic Impact Along the Value Chain
The economic benefit is relatively easy to identify in tier 1 as it relates directly to the EO service provider. In tier 2, the EO service is used by the primary user to improve some parts of their business process, their operations. Hence the types of benefits are much broader as reflected by the full set of indicators.
Calculation of the value is most easily performed when it is known what was done before the EO service was available. This leads to a counterfactual which may be translated into a reduced cost, a gain in efficiency, a reduction of capital expenditure or a reduction of risk. These benefits come on top of any increased revenues or employment.
In tier 3 and 4, not only is the transformation much greater, but the impact of the EO service is becoming much more diluted and spread over a wider range of operations. As a result, it becomes hard to identify the role and added value of EO data in these next tiers. Furthermore, as there are no data costs (Sentinel data is available under a free and open policy), the associated cost component does not need to be passed on to the next tiers in the value chain (which is the case in “normal” value chains) and so it is hard to identify a correlation between the use of the data and economic performance.
Even if the impact of the use of the data explodes, the value manifests more and more in the form of non-monetary benefits. Put differently, as you move down the value chain, the volume of impact becomes much larger even as the percentage due to the use of EO data becomes increasingly insignificant.
This also has important implications for the actual measurement of this incremental value. Where in the first tiers we can still measure the value based on “solid” economic figures (like decrease in costs, increase in output), as we move down the value chain that incremental value is watered down. What you see is not the value itself, but rather indicators or proxies of that value.
Introducing Fit-For-Purpose Models
Estimating the benefits requires the use of models. There may be one embracing model or several reflecting different decisions or business processes relevant to the case. These may vary according to the tier of the value chain and the specific characteristics of each case. For instance, for Winter Navigation in the Baltic10 we have deployed a statistical model to represent the uncertainty in arrival time of ships at ice-bound ports and the economic impact of reducing it. In other cases, a business model was used to calculate the impact on the users’ balance sheet through better use of investment capital. Other types of models have been used based on financial or economic parameters.
Models are essentially used in two ways depending on the nature of the benefit. The information coming from the use of EO may be better or it may be cheaper. If it is cheaper, then the cost of acquiring the data by alternative means will be the rationale that drives the benefits. In this instance, the model may well be used to calculate the cost of the alternative means to gather the needed data. Note that this may not have been the case, and the alternative could have been seen as too expensive as seen in Flood Management in Ireland11 and Forest Management12 in Sweden.
However, in most situations the data coming from the use of satellite data is better than the alternatives and here the model must attempt to rationalise how this improved performance feeds into the business decisions and leads to better outcomes. This is the case with the ground motion mapping services analysed in Norway13 and Spain14.
Whatever the model used, some of the values of the physical, technical or economic parameters driving the model will likely be unknown. This leads us to make assumptions which are clearly stated and open to be challenged. Uncertainties in the assumption may lead to considering a range of values. These are injected into the model to calculate the benefits.
If more than one of the parameters is given a range of values, combining them follows a pragmatic approach. If say three parameters are to be used in a model, we should not use a maximum value for all three which risks leading to an extreme result. Neither will we calculate all the possible outcomes as our goal will be to find a minimum and maximum for the variable in question (ie. reduction in fertiliser use). In the extreme, a monte-carlo analysis could be used to arrive at a realistic outcome.
In some situations, values become very imprecise to the extent that modelling them becomes impossible. Two approaches are being used to overcome this. Mostly this arises where there is a public amenity as in the value to the local population of increasing incomes, of keeping transport infrastructure open or of improved leisure activities. In this case we generally use a willingness-to-pay (WTP) approach. In our studies, we do not have resources to conduct a full survey, so we tend to ask several of the actors we are interviewing to gather their views. Afterwards, we are estimating the population which reap the benefits and assigning a range of values to the amount each would be prepared to pay.
One further factor to consider is when the benefits are realised i.e., are they current or will they arise in the future? Several cases predict increasing value with time. An example of this is when farm management systems are introduced, their efficacy (and hence value) increases with each year that they are used and better knowledge is incorporated coming from crop yield, pests and impact of changing growing conditions.
Environmental Benefit Indicators
The focus for our work is on indicators describing environmental benefits stemming from the use of satellite data, not on indicators describing the precise state of the environment or evaluation of benefits stemming from such a state. Therefore, the focus of the research is shifted from a static estimate to a dynamic context–describing a change induced by the use of satellite data.
The effects of such dynamic change could be reported after monitoring (observing) over certain period of time. This rather “direct” approach, however, could require substantial time (e.g., a few years in case of agricultural applications where statistics on annual crop yields has to be collected as discussed above). The long time-span and dynamic nature both call for alternative methods for assessments of the value of satellite data (e.g., scenario- and expert-based estimates).
The analysis of the environmental aspects requires us to understand the impact of EO data on the user business process in environmental terms. Care should be taken to make the distinction between the impact of the underlying sector and the impact of the EO service. For example, InSAR is seen to have a very strong potential to help with management of roads infrastructure–and roads and their use has a huge environmental footprint. However, the impact of the use of InSAR is not perceived to have an impact on the environment and hence the grading for these cases is low.
As with most non-market driven indicators, putting an economic value on the environmental impact is complex. Various contingent valuation techniques may be used including using a WTP process. However, our goal is not so much to put an economic value on these factors but to highlight them as significant within the confines of the case. To evaluate the environmental impact, we are generally relying on specific experts. If environmental factors lie at the core of the case, the primary user will likely have sufficient knowledge. If not, we generally seek contact with a leading expert in a university or research institute who can advise us.
Often there will be a direct regulatory link since much environmental regulation exists. In other cases, environmental benefits might be better seen as elements related to societal benefit, such as matters linked to public health (societal dimension). The fundamental test is if environmental parameters are affected directly, which is reflected in the set of indicators shown in Table 3.
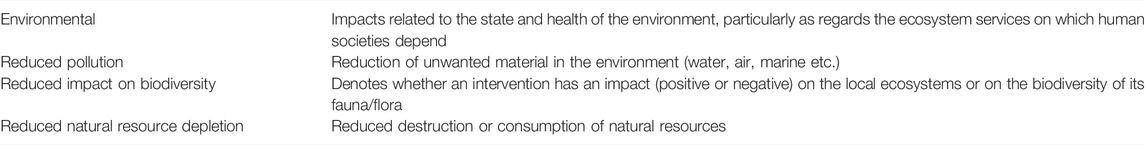
TABLE 3. Indicators of environmental benefits.
Regulatory Benefit Indicators
The regulatory benefits are those where the capability which the EO service provides has a direct impact on the regulatory environment.
This may be achieved by regulators being able to draft better policies either thanks to information stemming from the use of EO data and provided as input in the process or because EO data can be used to monitor policies. It also concerns the ability to carry out more effective implementation of the policy or regulation thanks to the availability of EO data. As an example of the former, the use of precise measurements of land subsidence can help water management authorities understand when risk arises from water abstraction from underground aquifers. Knowing the movement can be measured more precisely allows regulators to put tighter limits on the permitted movement before it causes problems for buildings in the proximity of groundwater extraction wells so limiting the economic damage (Wade et al., 2018).
An example of the latter, improved monitoring, can be present when such measurements provide a better knowledge of when movement of the ground took place as well as where, and hence can support resolution of or even avoid claims for damages due to engineering works.
Hence, we have two areas where value is realised, the ability to draft better regulations or the ability to measure compliance with regulations more accurately or more efficiently. This gives rise to indicators shown in Table 4.
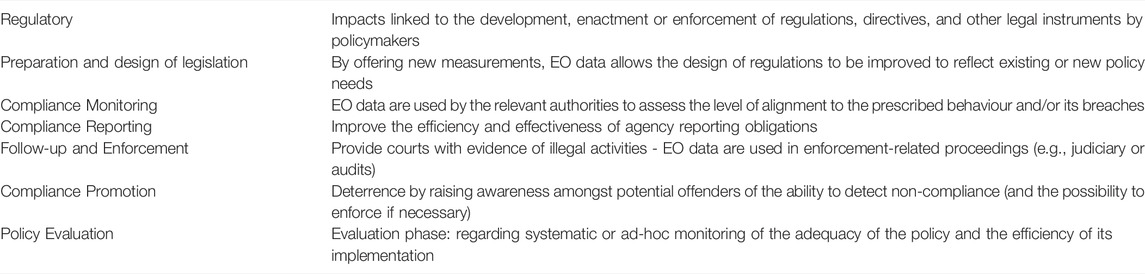
TABLE 4. Indicators of regulatory benefits.
Indicators for Innovation and Entrepreneurship Benefits
In this dimension, we are looking at the capability brought by the EO service to help stimulate innovation and new businesses. We have identified three indicators for this dimension, although others such as revenues and employment are covered in the economic dimension.
EO is not yet a generally or widely applied technology, so the introduction of the service may itself be innovative and/or be a source of further innovation within the supplier and/or the primary user. This can often bring a strong benefit and high value through new employment and research projects (which links to the science and technology research dimension). In many instances, the EO service is developed within a new company (a start-up) or by a new business line within an existing company. Either or both can lead to new jobs which will be contained within the economic dimension. The strong political interest in start-ups and SME’s led to the identification of this as a distinct dimension. A separate study has been made of the impact on Start-ups.
The service may also have been offered outside the supplier’s home market as an export business. This is taken into account in this dimension as a change of business process within the supplier. However, any associated revenues or increased employment would be considered under the economic dimension.
The introduction of the use of EO services into organisations (e.g., the primary user) can drive new business processes. If the information is directly replacing data obtained from other sources e.g., satellite images replacing helicopters as in the case in the Baltic, then the innovative co-efficient is low. However, more usually, the introduction drives new processes and hence innovation is high.
Some importance may also be placed upon the nature of the service itself; its origins and whether it has been patented. The latter would be an indicator itself of the service, but absence of patents should not be considered in any way as a detracting factor.
In all of these indicators, as shown in Table 5, the degree of importance of the satellite data should be assessed. In other words, would the new company exist if the satellite data was not available, or has the satellite data “only” been a factor contributing to a more successful start-up?
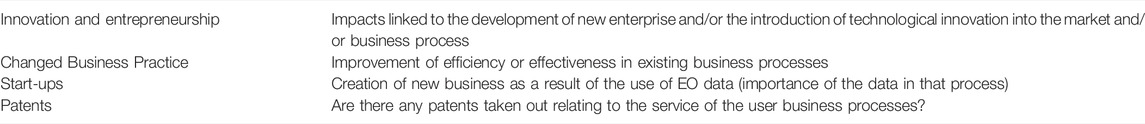
TABLE 5. Indicators of innovation or entrepreneurial benefits.
Indicators for Science and Technology Benefits
How much has the EO service contributed to improving the understanding about the Earth system or to advance any Frontier technological know-how?
In judging the importance of the research dimension, we are considering how much the EO service can contribute to science and technological goals. Hence, it is less a question of the background of the service but more about the future evolution of it as a contribution to R&D goals.
One of the clearest indicators of research interest is the presence of an academic institution within the value chain. We have found this several times among the analysed cases. Indeed, this is an indication of links to research activities but not of the importance of the service to further research activities.
Indicators have been identified linked to the number of academic publications, numbers of research staff and the budgets which are assigned to the topic. Although a rare occurrence we also recognise that there is the possibility of spin-offs from the academic institution which would be considered as a start-up recognised under innovation and entrepreneurship. The list of indicators is shown in Table 6.

TABLE 6. Indicators of science and technological research benefits.
Societal Benefit Indicators
Generally, these are recognised at tier four of the value chain, but not exclusively so. These are benefits which are attributed to society at large including industrial or governmental players which are not closely associated with tiers 2 or 3. It is also true that benefits which are recognised in the case but which are not attributed to any specific actor may be considered here. The societal benefits may manifest at a local or a national level.
Improvements to public health may arise due to the use of the service to reduce pollution of some form or to reduce human exposure to pollution, for example by predicting peaks of air pollution and enabling citizens to avoid it. Examples could be found through the reduced use of fertilisers or chemicals in farming so improving water quality. These would essentially be linked to increased opportunity for leisure activities ie swimming in non-polluted lakes.
The citizens’ sense of security can be improved by enabling a better response to a dangerous situation, as seen in Flood Management in Ireland15. The use of the EO service supports emergency response and reduces risks to both individuals and property.
The geostrategic value can be affected by the quality of life for the local population as is the case in ice-bound territories where ice breakers keep local communities served with essential goods through the winter. In the extreme, the community would not exist without a shipping service and whilst the EO data is not fundamental to the service it does greatly improve efficiency and save costs. Hence the strong link between economic benefits and societal ones.
The use of EO services can help raise local public awareness of a risk or danger by increasing transparency of operations of public services which can also improve public utility of an asset such as a lake affected by a harmful algal bloom.
The quality of life in the community can be increased by a general raising of wealth by increased revenues within the value chain. It may also be improved through better access to infrastructure by, for example, reducing times when roads are closed for remedial works.
Finally, the EO service can help improve oversight by promoting a common operating picture amongst stakeholders, for example, the emergency services, and so improve co-ordination of actions. The use of EO data as a “neutral” source which is open to all players to use can give confidence to citizens that their interests are being respected. The indicators which have been identified are shown in Table 7.
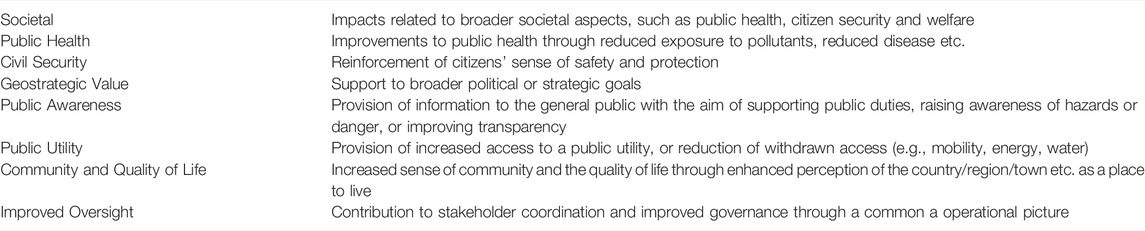
TABLE 7. Indicators of societal benefits.
Having provided a brief overview of the various indicators against the different dimensions of benefit we now move to a discussion around the approach we have followed for the extrapolation of results.
Extrapolating the Results
By construction, SeBS relies on a “bottom-up” approach. Thus, instead of looking at a sector from a macro-perspective, we dive in a specific case, look at a specific value chain and discuss the specific benefits experienced by specific actors in well-defined processes. But just how “specific” are these cases and how readily can we extrapolate the findings? In answering this we are effectively assessing the “universality” or “uniqueness” of each case. In that regard, our experience so far has shown that there are important commonalities and significant differences to consider, with most cases presenting both at the same time. Therefore, when considering extrapolation perspectives, it is instructive to look in three dimensions: 1) geographic extension, 2) increased market penetration and 3) improved technological maturity. These are discussed below.
Geographic Extension
The global coverage of Sentinel-based observations, i.e., their ability to capture every spot of the Earth, allows service providers to offer solutions that address customers across borders. Therefore, in principle, the findings of a given case can be extended beyond the geographic borders of the country in which the case is being carried out. In practice, however, this also depends on multiple other factors:
• is the Sentinel-enabled service addressing a problem that is–to a large–extent similar in different countries?
• Is the climatology, geomorphology and other relevant environmental conditions comparable to the extent that a given solution is transferrable?
• Is the regulatory or business framework equally conducive to the uptake of a given solution?
Depending on the answers to such questions, we are able to project the benefits of a given case in a wider geographical scale. In essence, this is a market sizing exercise, whereby the questions above act as filters that allow us to zoom in from the total addressable market (TAM), potentially at a global level, into the serviceable addressable (SAM) and eventually serviceable obtainable (SOM) markets. This process is applied for each individual case and, naturally, case-specific parameters are taken into account to define the extent to which this extrapolation can be justifiably done. Yet, despite such case-specific parameters, when we look at the full portfolio of cases that have been analysed, we can already note that the geographic extension perspective is very strong.
Increased Market Penetration
The cases we have been studying under SeBS all share one common denominator: a very committed primary user who can appreciate the value of the Sentinel-based services they receive. These primary users are the ones that typically offer an entry point to a specific market for the service provider. But how many more such clients could the service provider target? And what is a reasonable market share that either the specific cases or a bouquet of similar services can capture?
These are the questions that characterise the market penetration perspectives. In this regard it is important to observe that most of the EO-services are offered to their users through widely spread user interfaces (e.g., web services, smartphone apps, etc.). This means that such services have wider market potential. What is more, the back end of these services relies on the processing of different sets of data (satellite observations, in situ, meteorological) which are typically provided at scale. In the specific case of Sentinels, the extra “handling costs” might not be negligible but they are certainly not restrictive for companies that want to serve multiple users simultaneously. Moreover, thanks to the proliferation of automated workflows, there is large growth potential. This may well be supported by the recent rise of services offering cloud computing services “next to the data”. These technological and service provision trends do not of course necessarily reduce the effort required by companies in business development and marketing of their solutions. They do however facilitate reaching out to a wider pool of potential users.
So, when it comes to defining the potential market penetration that a given Sentinel-based service could achieve, we need to make a number of assumptions. These assumptions have been so far built on an ad hoc, case-by-case basis. But as we gain more insights on similar cases (e.g., in agriculture), we are observing patterns that could help us build an appropriate framework for such extrapolation efforts. At minima, this will entail a qualitative assessment of key parameters (e.g., conducive regulation/legislation, market readiness, market saturation, etc.).
Improved Technological Maturity
Technological maturity should be understood here as 1) the capacity of the users to make optimal use of a given service (even when this service remains unchanged over time), 2) the ability of the providers to improve their value proposition using the feedback (and data analytics) from their customers. In both cases, the effect is that, over time, Sentinel-enabled services will yield more significant economic benefits for users (and consequently greater revenue for providers). A prime example underlying this scalability factor is presented in the case of agriculture with the proliferation of 1) VRA-enabled farm machinery, 2) standardised protocols (e.g., ISOBUS-compliant) that allow different types of machinery or software tools to “speak” to each other. Practically, the more hardware and software solutions are “communicating with each other” the more farmers are able to make optimal use of Sentinel-enabled services and the information these unlock. Similar observations can be made in other sectors, especially when users had enough time to fully integrate the services into their workflows and fine-tune it based on their own needs and capacities. The quantification of these effects is very complex and rather subjective at this stage. In the case of Denmark16, we have attempted to make some first inroads in this dimension using insights from their stakeholders themselves. Nonetheless, for this approach to become adequately robust more cases have to be analysed and work on the methodological framework carried out. The first case that illustrates how these three dimensions have been analysed in practice is Farm Management Support in Poland17. Similar analyses have been included in all subsequent cases.
The methodology described has been applied to 23 cases at the time of writing, with several more being in progress. This has allowed the assessment of benefits along the six dimensions previously introduced in very different operational conditions and for a wide range of value chain actors. It has also enabled the iterative improvement of the approach, testing the limits of its applicability, highlighting its advantages and underlining its shortcomings. To illuminate these aspects, we provide below concrete results from selected cases against each of the six dimensions of benefit.
Results
Analysis of Economic Benefits
The use of Copernicus Sentinel data at the entry point of the value chain generates significant economic benefits for the service providers, their primary users and other actors further down the chain. Looking at a subset of the analysed cases (Table 8) economic benefits take various different shapes, as discussed in detail below.
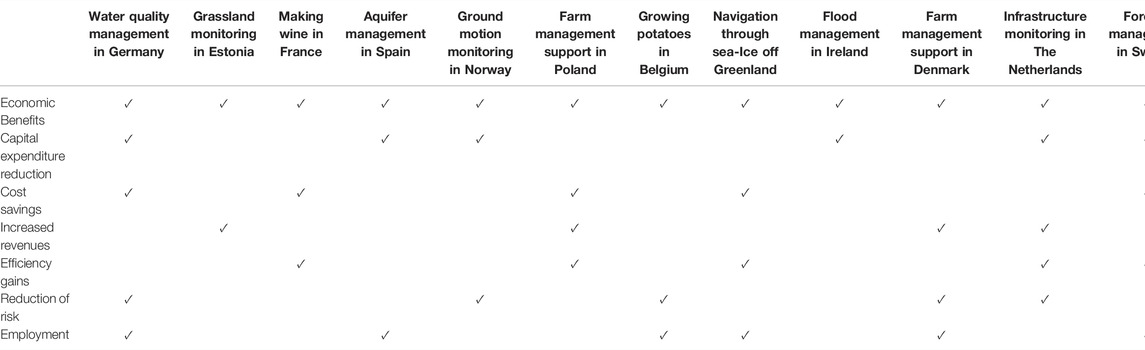
TABLE 8. Economic benefits against selected cases3.1 Analysis of economic benefits.
Avoided Costs (Capital Expenditure Reduction and Operational Cost Savings)
This concerns situations whereby making evidence-based decisions or undertaking well-informed actions would require the use of an alternative data source to Copernicus Sentinel data against payment. This counterfactual approach typically represents cases where value chain actors buy commercial satellite data or use other means of inspection (manned aircrafts, drones, on-the-spot checks) to perform mapping and monitoring functions in support of their operational needs. A prime example is that of “Winter Navigation in the Baltic”18 where before the availability of Sentinel data, the guidance of ice-breaker ships was conducted using on-board helicopters. Thanks to Sentinel satellite data, shipping companies no longer have to rely on this, saving significant capital and operational costs. This aspect of avoided costs becomes even more pronounced when looking into cases that require the monitoring of very large geographical areas. In the case of Flood Management in Ireland19, where a large part of the country was flooded, the alternative use of a fleet of manned aircraft would simply be not economically viable for the national civil protection agency. Avoided costs connected to the use of Sentinel-based services can be documented further down the value chain too. In the case of Aquifer Management in Spain20, the Sentinel-enabled InSAR monitoring of the extraction operations in the Segura Basin allows quick reactions to potential excessive subsidence, thus protecting homes or business buildings in the proximity of extraction wells. This amounts to avoided costs from potential damages at the order of €3.25 Million per year.
Generation of Revenues
The generation of increased revenues is primarily associated to higher prices (over fixed volume of sales) or to higher volumes of sold goods and/or services. The latter concerns practically all service providers building innovative solutions that exploit Sentinel data and serving clients’ needs in several market segments. Increased volumes are also met in the many agricultural cases we have analysed, whereby higher yield can be achieved through the use of satellite-enabled services, as seen for instance in the case of Growing potatoes in Belgium21. In the case of Farm Management in Poland22, we have also observed the seemingly paradoxical example of major fertiliser companies incorporating into their offering satellite-based services which help farmers reduce their fertiliser input. Yet, the logic behind this is clear: at a time when regulation is pushing for more sustainable agriculture, fertiliser companies can better retain clients if they provide them with satellite-based products that help them better perform variable rate application of fertilisers. They can also enter new markets thus not only overcoming potential loss but effectively diversifying their portfolio. A similar paradigm where regulation or public pressure calls for more sustainable practices is observed in the case of Deforestation Monitoring for Palm Oil Production. There, agricultural commodity traders are using Sentinel-based services to establish objective evidence on deforestation-free production of palm oil. This allows them to reduce the occurrence of stranded assets, e.g., plantations that are suspended because of deforestation and associated volumes of produce not being sold since they don’t meet deforestation-free production commitments.
Reduced Inputs
Spending less time, using less fuel, applying reduced inputs (e.g., water, fertilisers, pesticides) or deploying fewer people in the course of a specific operation translates into concrete financial benefits. This aspect often represents one of the most important economic benefits realised thanks to the use of Copernicus Sentinel data, as documented in many of the studied cases. In the case of Grassland Monitoring in Estonia23, for instance, the Estonian Paying Agency used to send inspectors to perform on-the-spot checks for 5% of the grassland registered for Common Agriculture Policy monitoring. Today, thanks to Sentinel-based services, the Estonian Paying Agency covers the totality of agricultural fields with minimised need for on-the-spot-checks leading to direct savings of €50,000 per year and a better use of its personnel’s time. Time savings have been reported in several other cases, from faster construction project completion in the case of Ground Movement Monitoring in Norway24, to shorter voyage time for Navigation through sea-ice in Greenland25. Reduced inputs is a common theme in all agriculture-related cases. There, Sentinel-based services allow farmers to apply fertilisers, pesticides or water where, when and as much as needed, thus achieving significant economic benefits.
Improved Efficiency
Acting with high accuracy, at the right time and at the right place is critical to the success of many operational processes across different sectors. When this is coupled with optimised use of resources (see previous point on “reduced inputs”) it translates into improved efficiency. The key here is the timely availability of reliable data. Sentinels are offering exactly that for a wide range of applications. The impact of improved efficiency has often a tremendous contribution to the magnitude of benefits experienced further down the chain. For instance, in the case of Deforestation Monitoring for Palm Oil Production, the primary user of Sentinel-based services–an agricultural commodity trader, can organise the inspection of suppliers against whom grievances have been raised in a much more efficient way, optimising the use of their operational resources. In practice, this means that they can either establish immediately whether suspicion of deforestation is well-founded, or investigate only the cases where satellite data points to potential harmful activity. A similar situation applies to the case of Infrastructure Monitoring in the Netherlands26 where the use of Sentinel-based services allows the detection of deformations and helps the infrastructure management company to fully focus on those pipeline connections that are very likely to malfunction.
Looking at the 10 cases presented in Table 8, we see that the combined economic benefit is between €116 m and € 299 m following the low-high scenarios presented in detail in the cases themselves.
Analysis of Environmental Benefits
As discussed in the methods section, SeBS focusses directly on the change induced by the use of satellite data, either directly or indirectly. In that regard, the study of multiple cases where the operational use of Sentinel data empowers more informed decisions has allowed us to pinpoint a wide variety of environmental benefits typically experienced further down the value chain.
Reduced Pollution
The use of Sentinel-enabled services often leads to reduced amounts of pollutants in key resources (e.g., watercourses or the atmosphere). This is quite prevalent in agricultural cases, where Sentinel-enabled services (see the cases of Farm Management in Denmark27 and Poland28) can contain the quantity of fertilisers and pesticides infiltrating into the groundwater and eventually affecting the occurrence of algal blooms. Similarly, reduced use of fuel and/or emissions thanks to better ship routing can have a very positive environmental impact, as indicated in the two cases of satellite-enabled navigation through sea-ice in the Baltic29 and in Greenland30.
Reduced Impact on Biodiversity
Thanks to reduced pollution, as discussed above, Sentinel-enabled services can also help to protect biodiversity and critical ecosystems. This is further supported by early detection of environmental threats, perhaps best illustrated in the case of Water Quality Management in Germany31, where Harmful Algae Blooms can be accurately identified and monitored allowing for better protection of biodiversity in various water bodies. Similarly, by helping palm oil supply chain companies to fulfil their sustainability commitments around no deforestation, Sentinel-based services also contribute to the preservation of local biodiversity such as Orangutans. Another consideration is that of the impact of natural disasters on the environment. This has been highlighted in the case of Flood Management in Ireland32, where the civil protection agency and regional authorities have been able to perform better emergency management thanks to the use of Sentinel-enabled flood maps. This, in turn, has helped reduce the impact of flooding on important habitats and on wildlife.
Reduced Natural Resources Depletion
The use of Sentinel-enabled services can also help competent authorities to prevent or reduce the depletion of natural resources. In the case of Aquifer Management in Spain33, the local River Basin Authority is taking advantage of the accurate, long-term monitoring of the operation of extraction wells, to optimise their use and promote more sustainable management of the aquifer. This in turn helps to reduce the occurrence of effects such as ground erosion and the appearance of gullies.
Reduced Impact on Natural Resources
We should note that whilst the SEBS study has shed light onto the various environmental benefits experienced by actors in the value chain, it has not pursued a deeper analysis that would establish stronger causal links between the use of Sentinel-enabled services for the improvement of certain practices (e.g., crop cultivation) and the occurrence of harmful environmental impacts. This would require dedicated investigations that are out of scope of our current work.
Analysis of Regulatory Benefits
The use of Sentinel data often has a profound impact on the design and implementation of regulatory measures and policies, as documented in several of the cases studied under SeBS.
Improved Efficiency in Regulation/Policy Monitoring
The most fitting example, perhaps, is the case of the Common Agricultural Policy (CAP) which establishes the legislative framework around a system of subsidies and other support programmes for agricultural activities in the European Union. Since 1962, and throughout a series of reforms, the CAP has not only supported farmers in their efforts to supply EU citizens with good quality and safe food; it has also been guiding the implementation of sustainable agriculture across the EU. The recent amendment to the regulation, introduced in May 2018, attempts to modernise the implementation of checks for area-based payments and for cross-compliance requirements. This landmark change foresees modern solutions such as geo-tagged photos, GNSS enabled receivers, drones and data from Copernicus Sentinel satellites which are used to carry out checks. This new “monitoring approach” promises significant benefits for farmers and administrations alike. The new rules will allow those member states that wish to do so to eventually replace or complement on-site checks with automated and less burdensome controls. This is precisely the case of Grassland Monitoring in Estonia34, where the national Paying Agency is able to perform better monitoring and enforcement of the CAP thanks to the use of Sentinel-based services. Similarly, in the case of Water Quality Management in Germany35, the regional environmental institutes use Sentinel-based services to monitor the quality of the water across a much larger number of water bodies than they could do without. This provides richer input into their reporting for the Water Framework Directive and for national regulations.
Improved Ability to Draft Appropriate Regulation/Policies
The use of Sentinel data is not only enabling a more efficient monitoring process once the regulation is in place. In certain cases, it also allows the drafting or fine-tuning of regulation itself. A good example illustrating this aspect is the case of Aquifer Management in Spain36. In this case, the operation of pumps extracting water from the aquifer may lead to significant land subsidence, which in turn may cause significant damages to buildings. To avoid this, the local authorities responsible for the operation of the pumps have to follow strict regulatory boundaries with regards to the specific extent of allowable land subsidence (e.g., 2 cm per year). This number however has been defined many years ago using means available at the time. Today, thanks to Sentinel-enabled InSAR measurements this threshold can be refined (i.e., informing the specifications of the regulation) allowing the authorities to operate in a more evidence-based manner.
Analysis of Benefits to Innovation and Entrepreneurship
The availability of Copernicus Sentinel data has also proven to be a strong driver for innovation and entrepreneurship.
Enabling Viable Business Model
Without exception, all commercial service providers involved in the SeBS cases have underlined that without free and open access to the Sentinel data their business model would not be viable. In such cases, the innovative service they currently provide can either not be delivered in another way (i.e., no counterfactual is available) or, instead, achieving the same service level with other means would lead to completely unfeasible scenarios (e.g., from a financial perspective). In fact, this perspective is responsible for the creation of many new start-ups which would otherwise not have been able to translate their innovative ideas into products with strong market fit.
Supporting Innovative Governance Models
Whilst not studied in detail, SEBS cases have shed light into the contribution of Sentinel data to the establishment of innovative governance models. For instance, in the case of Growing potatoes in Belgium37 the fact that several actors in the value chain (farmers, processors, agronomists) get access to a centralised platform that provides information (thanks to the use of Sentinel data) on key parameters about the cultivation of potatoes has enabled new alliances among these actors, including ones that foresee sharing of different datasets so as to improve provided services and increase transparency of processes over time.
Analysis of Benefits to Science and Technology
When looking into the impact of Sentinels on science and technology we can identify different potential signals: 1) academic outputs, 2) utilisation in R&D projects, 3) human capital (researchers and students) and 4) applied science leading to operational services. Here we only discuss the third of these signals.
Human Capital (Researchers and Students)
Directly tied to the viability of business models discussed earlier (enabled by the free, full and open data policy of Copernicus), the hiring of researchers and scientists by both private and public sector actors in order to conduct applied research and contribute to innovative services has been a common theme among several of the studied cases. This includes not only remote sensing specialists but researchers from several other disciplines including but not limited to agronomists, environmental scientists, data analysts, oceanographers, etc. Thus, the employment of these specialists results in both business and academic outputs with strong roots on operational uses of scientific or technological breakthroughs. A prime example illustrating this aspect comes from the case of Aquifer Management in Spain38. There, the geological survey enhances its scientific output thanks to an improved ability to perform geological studies and modelling with the use of Sentinel-enabled InSAR.
Analysis of Societal Benefits
Whilst often perceived as intangible, societal benefits are often considered by the interviewed stakeholders as essential aspects in the greater picture. In many cases, they may even represent a key driver motivating the primary users to procure the Sentinel-based service in the first place. Below we discuss some of these benefits.
Improved Public Health
This is typically associated with less toxicological risk or exposure to health-threatening agents. For instance, when people are better informed about air quality, they can better protect themselves against outbreaks of pollen or other pollutants. It must be underlined, that this aspect has not been studied in depth so far due to increased complexity.
Common Understanding
This refers to the ability to convey key messages to the involved stakeholders using the same means. In other words, thanks to the fact that different actors have access to the same information (typically satellite images or reports), a common understanding is ensured. A prime example for this is the case of Flood Management in Ireland39. There, different actors (emergency management personnel at strategic and tactical level, politicians, journalists, general public) had access to the same flood delineation maps as a common point of reference. This helped the authorities to communicate in an easily understandable manner on the evolution and impact of the floods to all relevant stakeholders (political hierarchy, responders, media, citizens).
Increased Trust and Better Transparency
The “common understanding” described above often helps to build trust between the involved stakeholders. In the case of the flood management example quoted above this means that citizens will heed the instructions of the authorities more effectively, because they see with their own eyes the same information conveyed to them, eventually helping to reduce the impact of the flooding. This also significantly reduced the transmission of erroneous information, helping to make better operational decisions. The same level of effectiveness in communications and common understanding cannot be easily achieved with numbers (e.g., measurements of the gauges or meteorological data). This type of benefit materialises in a different yet strongly related manner. Authorities can ensure greater transparency of their actions by sharing information that is 1) accessible to all actors, 2) retrieved with reliable, unbiased means. This, as well, contributes to building better trust between citizens and authorities or clients and providers.
Strategic Value
Whether looking at the economic and geo-political independence of a country or the strengthening of its industrial, scientific and entrepreneurial output, Sentinel data have been shown to provide significant benefits. For instance, in the case of Sentinel-enabled Navigation through Sea-ice in Greenland40, the ability to remain connected to the rest of the world all year long and provide the local economy with necessary supplies is of paramount importance not only for Greenland but also for Denmark and even for the EU.
Conclusion
The analysis work carried out under the SeBS study has produced some valuable and widely appreciated results. The progressive analysis of cases has allowed the methodology to be refined and new approaches to the challenge of measuring value to be tested and assessed. The result is a streamlined process for analysing the value of EO data which can be applied to any source of data and indeed may even be applied in non-related fields.
Our concluding observations from the cross-cutting analysis of this rich portfolio of cases include:
• The economic benefits deriving from the use of EO data are usually one of the first pieces of information sought when justifying or proposing new programmes. Various methods to estimate value have been used based on simple models.
• Whilst the economic value may be the first sought, non-economic or nonmonetary benefits may be even more important than ones quantified in monetary terms. Whilst we contend that with enough effort any benefit can be expressed in monetary terms, in reality, resources are strictly limited and hence we introduced the concept of six dimensions of value to express benefits in recognisable and structured forms.
• The six dimensions have proven to be robust in the cases we have analysed. Sets of indicators have been generated but these are non-exhaustive and future work could build upon them.
• Indicators are valuable to characterise the dimensions but grading the relative importance of these is still rather subjective and maybe linked to the input data e.g., Sensor resolution or revisit time. This is an area for future research to improve the methodology.
• Developing a portfolio of cases opens up deeper analysis leading to insights into how organisations incorporate and adapt to the use of EO derived information services. Cross-cutting analyses looking at for example the benefits to public administrations have been possible as a result of the portfolio. Further development of this methodology would be highly promising to improve our understanding of how EO data is perceived by others.
• Expressing the results of the research as a story is a powerful way to communicate the benefits of using EO to society and hence to gain the attention of decision makers.
The cases are analysed in a strictly confined and bounded way. Further research could help to expand the horizon of the cases. Specifically:
• The science of placing value on natural resources and their loss when damaged or extracted has developed significantly over the last few years. Natural Capital Accounting or Ecosystem Accounting can be a useful tool to help analyse the benefits of actions being taken using EO data. Introducing specialists with the knowledge of how to make these analyses would be a useful step to broadening the SeBS capability.
• As noted in point four above, significant benefits have been observed through the ability to compare and contrast cases and to develop transversal or cross-cutting analyses. Refining this to select cases which can throw a spotlight on specific ideas could be a very effective extension of the SeBS case work. The example of benefits to public administrations has been widely appreciated and helps to show why public administration at all levels (regional, national, local) should adopt new tools and how this can drive their operations.
• Our cases are bounded by national administration i.e., countries. This has been quite deliberate to enable a reasonable estimation of value as well as providing consistent market conditions within a fixed regulatory environment. Particularly the latter which with small changes can have a significant impact on the benefits. Further research could be conducted to understand the limitations of this and to seek to develop new tools with which to extend the analysis to a wider geographical base.
The SeBS work continues to evolve. The elements reported in this paper are defined by the time of publication. As research develops further, we still seek to further refine the methodology and by extension the value of the results.
Data Availability Statement
The original contributions presented in the study are included in the article/Supplementary Materials, further inquiries can be directed to the corresponding author.
Author Contributions
All authors listed have made a substantial, direct, and intellectual contribution to the work and approved it for publication.
Funding
This work has been funded by the EU and ESA. ESA Contract Number: 4000119743/17/I-SBo. “Showcasing the benefits brought by the usage of Sentinels data to society, environment and economy: a bottom-up assessment based on traceable impacts along selected value chains”.
Conflict of Interest
Authors EM and DP were employed by the company Evenflow SRL. Author GS was employed by EARSC, the European Association of Remote Sensing Companies.
Publisher’s Note
All claims expressed in this article are solely those of the authors and do not necessarily represent those of their affiliated organizations, or those of the publisher, the editors and the reviewers. Any product that may be evaluated in this article, or claim that may be made by its manufacturer, is not guaranteed or endorsed by the publisher.
Acknowledgments
The authors wish to acknowledge the invaluable contributions of Alessandra Tassa (ESA), Marc de Vries (the Green Land), the many value chain actors involved in the analyses of the respective cases and the colleagues at EARSC (Christopher Oligschlager), Evenflow (Daire Boyle, Stefka Domuzova) and IIASA (Nikolay Khabarov) who have supported the execution of several analyses. Elements of this manuscript have been published in the SeBS Methodology, authors Sawyer G and Papadkis D document available at https://earsc.org/sebs/wp-content/uploads/2020/12/SeBS-Methodology-2020.pdf.
Footnotes
1https://earsc.org/sebs/wp-content/uploads/2019/03/Winter-Navigation-in-the-Baltic-Full-case.pdf.
2https://earsc.org/sebs/wp-content/uploads/2020/10/Aquifer-Management-in-Spain_vf.pdf.
3https://earsc.org/sebs/wp-content/uploads/2019/03/Flood-management-Ireland-Full-case.pdf.
4https://earsc.org/sebs/wp-content/uploads/2019/08/1_full-report-Growing-Potatoes-in-Belgium.pdf.
5https://earsc.org/sebs/wp-content/uploads/2019/03/Forest-Management-in-Sweden.pdf.
6https://earsc.org/sebs/wp-content/uploads/2019/04/1_full-report_Navigation-through-Sea-Ice-in-Greenland-final-issue-2.pdf.
7https://earsc.org/sebs/wp-content/uploads/2019/03/Winter-Navigation-in-the-Baltic-Full-case.pdf.
8https://earsc.org/sebs/wp-content/uploads/2020/07/Ground-Movement-Monitoring-in-Norway-final.pdf.
9https://earsc.org/sebs/wp-content/uploads/2020/10/Aquifer-Management-in-Spain_vf.pdf.
10https://earsc.org/sebs/wp-content/uploads/2019/03/Winter-Navigation-in-the-Baltic-Full-case.pdf.
11https://earsc.org/sebs/wp-content/uploads/2019/03/Flood-management-Ireland-Full-case.pdf.
12https://earsc.org/sebs/wp-content/uploads/2019/03/Forest-Management-in-Sweden.pdf.
13https://earsc.org/sebs/wp-content/uploads/2020/07/Ground-Movement-Monitoring-in-Norway-final.pdf.
14https://earsc.org/sebs/wp-content/uploads/2020/10/Aquifer-Management-in-Spain_vf.pdf.
15https://earsc.org/sebs/wp-content/uploads/2019/03/Flood-management-Ireland-Full-case.pdf.
16https://earsc.org/sebs/wp-content/uploads/2019/03/Farm-management-in-Denmark-Full-case.pdf.
17https://earsc.org/sebs/wp-content/uploads/2020/02/SeBS-Case-Agriculture-in-Poland.pdf.
18https://earsc.org/sebs/wp-content/uploads/2019/03/Winter-Navigation-in-the-Baltic-Full-case.pdf.
19https://earsc.org/sebs/wp-content/uploads/2019/03/Flood-management-Ireland-Full-case.pdf.
20https://earsc.org/sebs/wp-content/uploads/2020/10/Aquifer-Management-in-Spain_vf.pdf.
21https://earsc.org/sebs/wp-content/uploads/2019/08/1_full-report-Growing-Potatoes-in-Belgium.pdf.
22https://earsc.org/sebs/wp-content/uploads/2020/02/SeBS-Case-Agriculture-in-Poland.pdf.
23https://earsc.org/sebs/wp-content/uploads/2021/05/Grassland-Monitoring-in-Estonia_vfinal.pdf.
24https://earsc.org/sebs/wp-content/uploads/2020/07/Ground-Movement-Monitoring-in-Norway-final.pdf.
25https://earsc.org/sebs/wp-content/uploads/2019/04/1_full-report_Navigation-through-Sea-Ice-in-Greenland-final-issue-2.pdf.
26https://earsc.org/sebs/wp-content/uploads/2019/03/Infrastructure-monitoring-Netherlands-Full-case.pdf.
27https://earsc.org/sebs/wp-content/uploads/2019/03/Farm-management-in-Denmark-Full-case.pdf.
28https://earsc.org/sebs/wp-content/uploads/2020/02/SeBS-Case-Agriculture-in-Poland.pdf.
29https://earsc.org/sebs/wp-content/uploads/2019/03/Winter-Navigation-in-the-Baltic-Full-case.pdf.
30https://earsc.org/sebs/wp-content/uploads/2019/04/1_full-report_Navigation-through-Sea-Ice-in-Greenland-final-issue-2.pdf.
31https://earsc.org/sebs/wp-content/uploads/2021/06/Water-Quality-Management-in-Germany-final-1.pdf.
32https://earsc.org/sebs/wp-content/uploads/2019/03/Flood-management-Ireland-Full-case.pdf.
33https://earsc.org/sebs/wp-content/uploads/2020/10/Aquifer-Management-in-Spain_vf.pdf.
34https://earsc.org/sebs/wp-content/uploads/2021/05/Grassland-Monitoring-in-Estonia_vfinal.pdf.
35https://earsc.org/sebs/wp-content/uploads/2021/06/Water-Quality-Management-in-Germany-final-1.pdf.
36https://earsc.org/sebs/wp-content/uploads/2020/10/Aquifer-Management-in-Spain_vf.pdf.
37https://earsc.org/sebs/wp-content/uploads/2019/08/1_full-report-Growing-Potatoes-in-Belgium.pdf.
38https://earsc.org/sebs/wp-content/uploads/2020/10/Aquifer-Management-in-Spain_vf.pdf.
39https://earsc.org/sebs/wp-content/uploads/2019/03/Flood-management-Ireland-Full-case.pdf.
40https://earsc.org/sebs/wp-content/uploads/2019/04/1_full-report_Navigation-through-Sea-Ice-in-Greenland-final-issue-2.pdf.
References
Bernknopf, R., Brookshire, D., Kuwayama, Y., Macauley, M., Rodell, M., Thompson, A., et al. (2018). The Value of Remotely Sensed Information: The Case of a GRACE-Enhanced Drought Severity Index. Weather Clim. Soc. 10 (1), 187–203. doi:10.1175/WCAS-D-16-0044.1
Macauley, M. K. (2005). The Value of Information: A Background Paper on Measuring the Contribution of Space-Derived Earth Science Data to National Resource Management. No. 1318-2016-103485.
Pearlman, F., Pearlman, J., Bernknopf, R., Coote, A., Craglia, M., Friedl, L., et al. (2016). Assessing the Socioeconomic Impact and Value of Open Geospatial Information. Geol. Surv. Open-file Rep. 1036, 36. doi:10.3133/ofr20161036
Sawyer, G., and Papadakis, D. (2020). SEBS Methodology: A Practical Guide for Practioners to Evaluating the Benefits Derived from the Use of Earth Observation Data. https://earsc.org/sebs/wp-content/uploads/2020/12/SeBS-Methodology-2020.pdf.
Keywords: Copernicus, Sentinels, Benefits, value-chain, cases
Citation: Sawyer G, Mamais E and Papadakis D (2022) The Six Dimensions of Value Associated to the use of Copernicus Sentinel Data: Key Findings From the Sentinel Benefits Study. Front. Environ. Sci. 10:804862. doi: 10.3389/fenvs.2022.804862
Received: 29 October 2021; Accepted: 09 March 2022;
Published: 10 May 2022.
Edited by:
David Haight, Canadian Space Agency, CanadaCopyright © 2022 Sawyer, Mamais and Papadakis. This is an open-access article distributed under the terms of the Creative Commons Attribution License (CC BY). The use, distribution or reproduction in other forums is permitted, provided the original author(s) and the copyright owner(s) are credited and that the original publication in this journal is cited, in accordance with accepted academic practice. No use, distribution or reproduction is permitted which does not comply with these terms.
*Correspondence: Geoff Sawyer, Z2VvZmYuc2F3eWVyQGVhcnNjLm9yZw==; Dimitri Papadakis, bGVmdGVyaXNAZXZlbmZsb3cuZXU=