 Yuling Du
 Shiyong Yan1,2*
 Feng Zhao
94% of researchers rate our articles as excellent or good
Learn more about the work of our research integrity team to safeguard the quality of each article we publish.
Find out more
ORIGINAL RESEARCH article
Front. Environ. Sci., 24 February 2022
Sec. Environmental Informatics and Remote Sensing
Volume 10 - 2022 | https://doi.org/10.3389/fenvs.2022.799946
This article is part of the Research TopicInSAR Crustal Deformation Monitoring, Modeling and Error AnalysisView all 12 articles
The environment management and land utilization of the abandoned mining region is critically dependent on precise monitoring and comprehensive understanding of mining subsidence. In order to overcome the shortcomings of the traditional distributed target phase optimization method in the space continuity constraints of adjacent pixels, an improved phase optimization algorithm was proposed, which combines region growing and time series interferometric synthetic aperture radar with distributed scatterers (DS-InSAR). By using 17 L-band and 51 C-band SAR images, the characteristics of temporal and spatial distribution in Peibei mining area of Xuzhou, China, were obtained during the period from 2007 to 2011 and the period from 2017 to 2020. With the long-term monitoring, the evolution of deformation in the mining area was carried out. The modified phase optimization technique has proven its ability in the density of measurement points and the influence of noise in space, which is promising for the detection of large gradient deformation and the accurate analysis of surface deformation in mining areas. The study has been concentrated toward detecting continuous subsidence in the mining region. Coal mines in operation are usually accompanied by unstable ground, and the uplift or second subsidence has sometime occurred in the closed mine region. Conclusively, the presented methodology is practically feasible for long-term deformation pattern analysis in coal-exhausted mining areas.
The exploitation and utilization of coal resources play an important role in global economic development. Peibei mining area, the largest coal production base in East China, has made outstanding contributions to rapid growth of China’s economy in the 20th century. However, many environmental problems and geological disasters caused by the high-intensity and large-scale mining bring severe damage to our lives and property (Yang et al., 2017; Dong et al., 2021). Due to the strong hysteresis property of surface subsidence caused by underground mining, the phenomenon of ground subsidence has occurred even in some coal mines that are idled or closed (Zhao, 2003). Meanwhile, the transformation and development of the old mining areas are also hindered by surface unstable phenomena (Mi et al., 2017). Moreover, with the impact of coal capacity reduction and urban economic development on land demand, the land in mining regions needs to be urgently reutilized for urban construction and development. Therefore, it is of great significance to carry out the long-term monitoring and comparative analysis of surface deformation in the mining area.
The time series interferometric synthetic aperture radar (TS-InSAR) technology with advantages in efficient monitoring of large scale is less affected by spatiotemporal incoherence (Wang et al., 2013); thus, it has been widely used for accurate measurements of surface deformation, such as cities (Chen et al., 2013), landslides (Ao et al., 2019), glacier movements (Lin et al., 2019), and mining areas (Li et al., 2016; Lu et al., 2016). Nevertheless, the capability of the traditional InSAR time series approach is often limited by the scarcity of artificial targets and the coverage of sparse vegetation, which increases the difficulty in obtaining deformation features because of the lack of monitoring points (Zhang et al., 2015), especially in the mining region. The SqueeSAR technology has been widely used in recent years, whereby the concepts of distributed scatterer (DS) and persistent scatterer (PS) are first being introduced, respectively (Ferretti et al., 2011; Cao et al., 2015; Du et al., 2018). In order to make full use of distributed targets, a number of phase optimization methods are proposed. Phase optimization determines the phase quality and affects the measurement point’s density, the application of which provides a practical value about the monitoring of surface deformation in mining areas. The maximum likelihood estimation (MLE) (Monti and Stefano, 2008) method assumes that only subscatterers with a single dominant scattering mechanism exist in the resolution cell, and a probability density function model of the distributed target is required. The eigenvalue decomposition (EVD) (Gianfranco et al., 2014) method is used in covariance matrix or coherent matrix, while the corresponding eigenvector with the largest eigenvalue can be considered to be the reconstructed interferometric signals. The eigen-decomposition-based maximum-likelihood-estimator of interferometric phase (EMI) (Ansari et al., 2018) was proposed, which increases the model complexity of conventional phase estimators to improve the estimation performance. Although the aforementioned methods adopt different strategies to reduce the decorrelation of DS pixels, however, the phase continuity between adjacent pixels is not carefully considered, and noise on the deformation monitoring results is neglected in the process of optimizing the DS phase value.
According to the aforementioned issues, an improved phase optimization method combining region-growing algorithm and T-EVD is presented. The subsidence area of Peibei mining area in Xuzhou city, Jiangsu Province, China, is selected as the research area, and the ALOS/PALSAR data and Sentinel-1 data covering the study area are processed by this method. Then, deformation in the mining area from February 2007 to March 2011 and January 2017 to December 2020 is obtained, and the evolution of surface subsidence in the mining area in the last 10 years is shown. The final results obtained from the synthesized analysis are promising to identify potential risks and develop further techniques to mitigate the impact of mining areas on environment and resources.
Peibei mining region, located in the northwest of Xuzhou city, Jiangsu Province, is one of the important mine resource basements in the eastern part of China. There are main eight mines in the study area as indicated in Figure 1 (Dong et al., 2014), including Yaoqiao (YQ) Coal Mine, Longdong (LD) Coal Mine, Xuzhuang (XZ) Coal Mine, Kongzhuang (KZ) Coal Mine, Zhangshuanglou (ZSL) Coal Mine, Sanhejian (SHJ) Coal Mine, Peicheng (PC) Coal Mine, and Longgu (LG) Coal Mine. The surface classification information is obtained from the global land cover dataset (Gong et al., 2019). Meanwhile, due to the rapid development of coal-mining operations, a lot of land resources were occupied, resulting in the reduction of traditional land resources. In recent years, with the closure of some coal mines such as SHJ coal mine and PC coal mine, the land was restored by the government, which increased the area of wetlands and waters (Zhang et al., 2016). The study region, with the temperate monsoon climate, is featured with very longer summer and winter. Generally, there is a large seasonal difference in land cover, especially in the region with bare land and sparse vegetation; most of them yield the similar characteristics such as the typical distributed targets, which would easily lead to incoherence in traditional SAR interferometry processing.
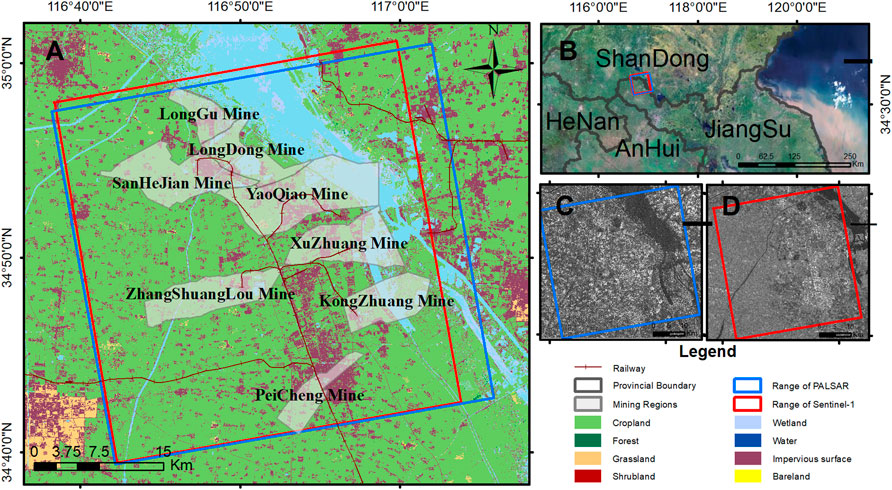
FIGURE 1. Geographical elements and land cover in the Peibei mining area, Xuzhou city, China. (A) Land cover mapping based on Sentinel-2. (B) Google Maps. (C) Itensity map of ALOS/PALSAR. (D) Itensity map of Sentinel-1.
In this article, the surface deformation in Peibei mining area is measured with both L-band ALOS/PALSAR during 2007.2–2011.3 and C-band Sentinel-1A during 2017.1–2020.12 in an ascending orbit. The used dataset description is shown in Table 1. In order to avoid the serious incoherence phenomenon caused by the relative long temporal baseline and the adverse effects on the extraction of surface subsidence in the mining region, two periods were separated for research during 2017–2020 because of the large changes caused by mining operation and different surface coverage. In addition, the SRTM DEM with 30 m resolution provided by USGS is used for geocoding and topographic phase compensation for SAR data.

TABLE 1. Basic information of data.
For monitoring and identifying the land subsidence of mining areas, the improved DS-InSAR technology with combination of PS points and DS points was proposed and used in this article, which fully optimizes the phase quality with both region growing and T-EVD. The main data processing flowchart is shown as follows:
1) Statistically homogenous pixels (SHPs) identification and selection:
In order to process homogenous patches without the impact of PS targets, SHP should be identified from the beginning. Several statistical techniques have been used to detect SHP, such as the Kolmogorov–Smirnov test, Anderson–Darling test, generalized likelihood ratio test, fast SHP selection (Jiang et al., 2014), and two-sample t-test. All these methods are based on evaluating the similarity of the amplitude distribution of two image pixels. Hypothesis testing is used to analyze the similarity of sample distribution characteristics, and adaptive multi-view processing is performed on points with the same statistical attributes as the target pixel. In this article, the two-sample t-test is used because of the high efficiency in identification and selection of SHPs (Shamshiri et al., 2018). The two-sample t-test is defined as:
where
where
2) Optimized phase estimation:
The phase optimization plays an important key role in exploring the available DSC points. First, the coherent matrix is calculated based on the SHPs, and then the spatiotemporal phase optimization of DSC points is realized by using both the T-EVD and region growing method in this article, and the general data process flowchart is shown in Figure 2. With the help of combined filtering operation, the phase-optimized interferometry fringes have been largely improved, especially in low-coherent areas, where negative influence of incoherence noise has been effectively suppressed along with the DSC exploitation.
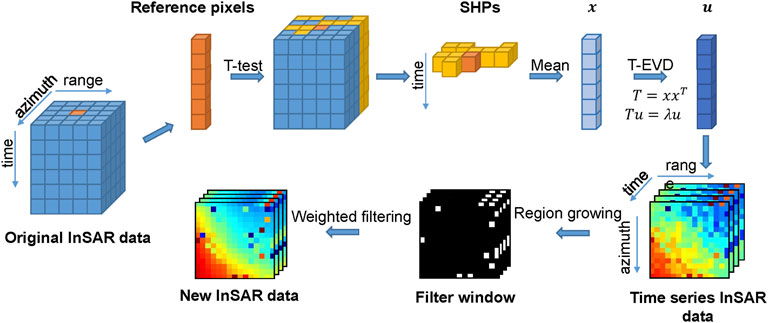
FIGURE 2. Schematic diagram of phase optimization.
Assuming a homogenous point set
where
where
Generally, there are multiple and undermined scattering mechanisms interacting with each other existing in the resolution unit, especially for the middle resolution SAR imagery. According to the characteristic of the coherence matrix, it can be written in the form of
where
where
However, in the process of constructing the coherence matrix by the T-EVD method, the spatial information between homogenous pixel points is lost, and the optimized phase value space is not sufficiently constrained. In order to eliminate acnode noise existing in the EVD-based optimized phase and further improve the quality of interferometry, the spatial filter window, generated by the region growing method relaying on the difference of interferometric phase differences, is used to realize the re-optimization of the DSC phase. Thus, the method fully utilizes the pixel connectivity in interferograms (Wang and Qin, 2009).
In this research, the center pixel of the preset window (15 × 15) is used as the initial seed point to select the pixels whose phase value could represent primary phase characteristics in the window. In order to preserve the fringe characteristics of the InSAR image, the phase difference threshold T of adjacent pixels is set at the growth criterion R, which is used to determine whether the selected window should continue to extend. Then, the final filter template can generate windows with various directions and sizes according to actual surface scenes, which would not be restricted by a regular shape.
where
where
3) Phase optimization quality evaluation:
In order to measure the extent of temporal incoherence on DSC and evaluate the quality of phase optimization, the temporal coherence
4) Observation targets fusion:
The selection of high-quality point targets is mainly based on high signal–noise ratio and stable phase scattering characteristics. The amplitude dispersion method and phase stability analysis are used in StaMPS to select high-quality point targets. Based on the amplitude deviation index, pixels greater than 0.4 are used as the initial permanent scatterer candidate (PSC). In addition, phase stability analysis is then further performed on each candidate point by calculating the temporal coherence coefficient to determine whether the PS points could satisfy the selection requirements (Figures 3A,C). Finally, along with the selected DS points in aforementioned (3), the observation targets could be obtained by the combination of PSs and DSs (Figures 3B,D).
5) TS-InSAR analysis:
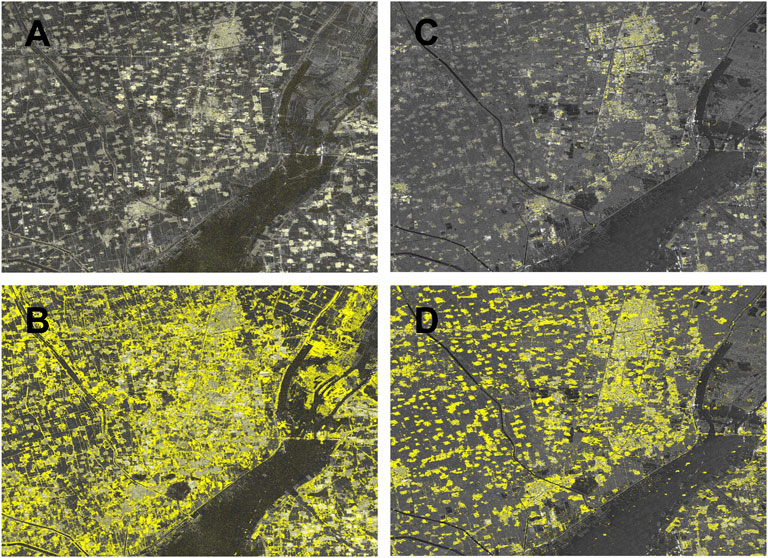
FIGURE 3. Distribution of high coherent targets in the study area. (A) PSs distribution of ALOS/PALSAR. (B) Combination of PSs and DSs distribution of ALOS/PALSAR. (C) PSs distribution of Sentinel-1. (D) Combination of PSs and DSs distribution of Sentinel-1.
Following this, analysis is performed in accordance with the traditional TS-InSAR data processing flow, such as residual terrain correction, phase unwrapping, and both GACOS-based (Yu et al., 2017) and temporal–spatial statistical-based atmospheric estimation and correction.
The entire process is shown in Figure 4.
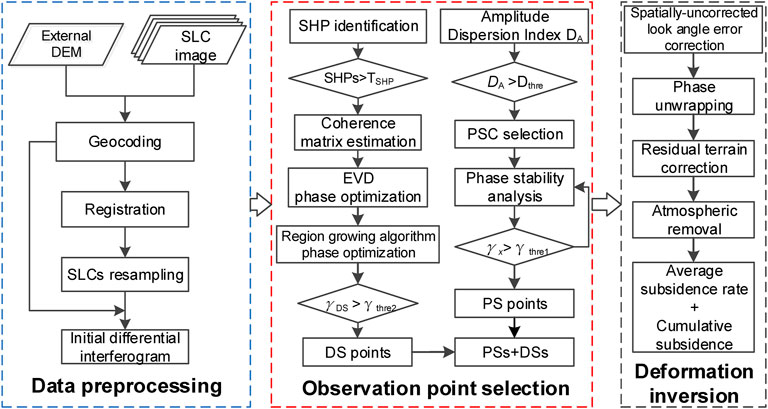
FIGURE 4. Workflow of the study.
Compared with the results of traditional persistent scatterer interferometric synthetic aperture radar (PS-InSAR) (Figure 5), the negative influence of noise obtained from the deformation field was reduced, and then smooth results and clear boundary information of the subsidence region could be obtained by using the presented method. The improved method can increase the number of points by an average of about 14.3 times by comparing with the traditional PS-InSAR technology. By comparing the average coherence corresponding to the interferogram with the longest spatial baseline, it can be seen that the average coherence can be improved by about 1.63 times with the improved method.(Table 2). The subsidence results in Peibei mining area were calculated by the proposed method in this article along with both ALOS/PALSAR and Sentinel-1A data covering three periods from February 2007 to March 2011 (Figure 6A), January 2017 to December 2018 (Figure 6B), and January 2019 to December 2020 (Figure 6C). It can be seen that the spatial distribution and density of the measurement points were uniform during each period. But, the subsidence distribution was obviously yielded in Peibei mining area.
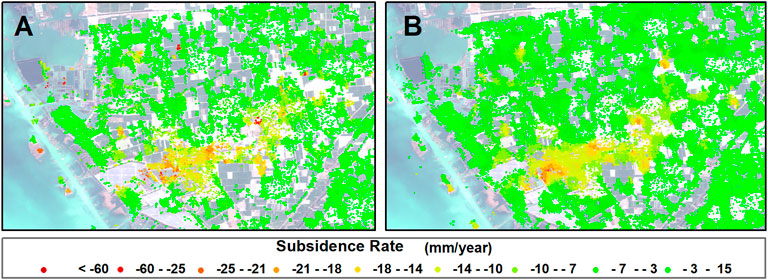
FIGURE 5. Subsidence result obtained by DS-InSAR. (A) Tradition method. (B) Improved method.
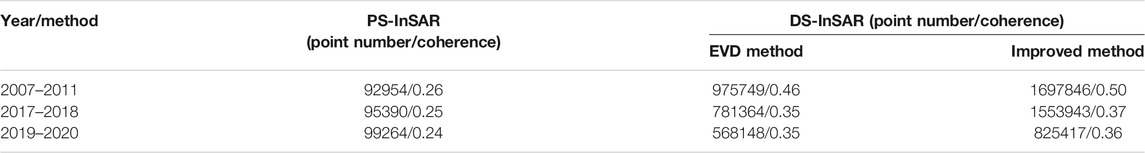
TABLE 2. Comparison of points and coherence of different methods.
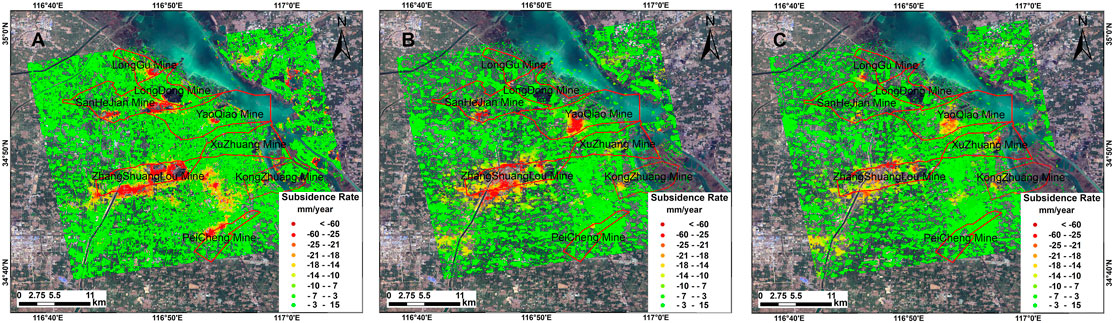
FIGURE 6. Average deformation rate map of Peibei mining area. (A) 2007–2011. (B) 2017–2018. (C) 2019–2020.
The comparison of monitoring results during different periods showed that there are different types in spatial evolution of deformation, such as expansion, offset, and reduction, and corresponding magnitude of subsidence also significantly varied. It can be seen that there were five obvious subsidence areas from 2007 to 2011 (Figure 6A). Among them, the region with the largest subsidence existed in ZSL Coal Mine, which included three obvious subsidence centers with the deformation ranging between −120 and −60 mm/year. In SHJ Coal Mine, there were two obvious subsidence areas with the deformation varying in the range between −90 and −70 mm/year. There are three obvious subsidence regions in PC Coal Mine with the subsidence value ranging from −60 to −30 mm/year, which were mainly located in the south of Peixian county and the west of Peicheng town. In addition, YQ Coal Mine had a comparatively small subsidence area as well.
During the period from 2017 to 2018 (Figure 6B), the surface was stable in LG and LD coal mines. However, there was localized subsidence in PC, KZ, and XZ coal mines, and large-scale subsidence in ZSL, YQ, and SHJ coal mines. Then, the surface of PC Coal Mine became stable between 2019 and 2020 (Figure 6C), and the deformation of the SHJ, YQ, ZSL, XZ, and KZ coal mines were significantly reduced at the same period.
In conclusion, the subsidence is mainly concentrated in ZSL, YQ, SHJ, and PC coal mines, where both the different deformation evolution patterns and serious large-scale subsidence could be observed.
In order to understand the evolution of goafs in different mining areas during different temporal periods, ZSL, YQ, SHJ, and PC coal mines were selected for further comparative analysis (Table 3). In addition, the cumulative subsidence curve of different research periods for the same location in each mine is given in Figure 7, which would be benefit for analyzing the evolution characteristics of each coal mine.
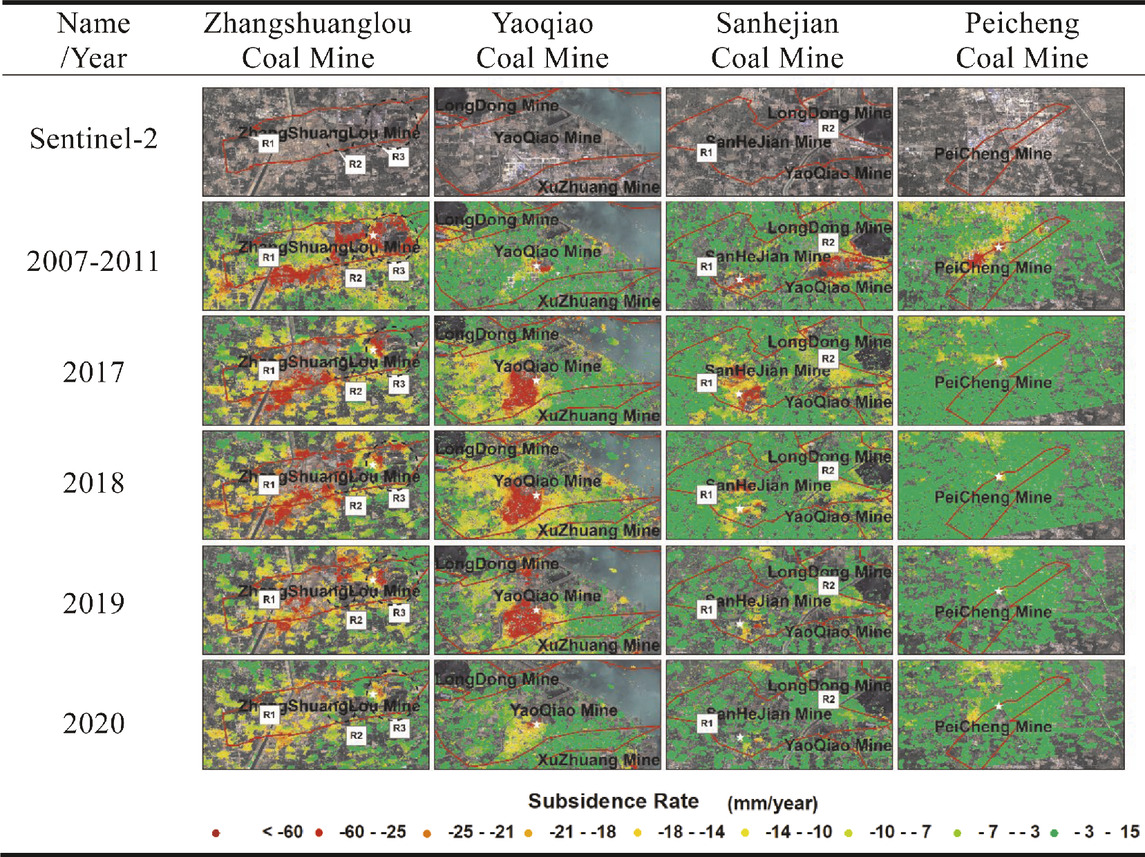
TABLE 3. Comparison of subsidence distribution during different periods in typical mining regions.
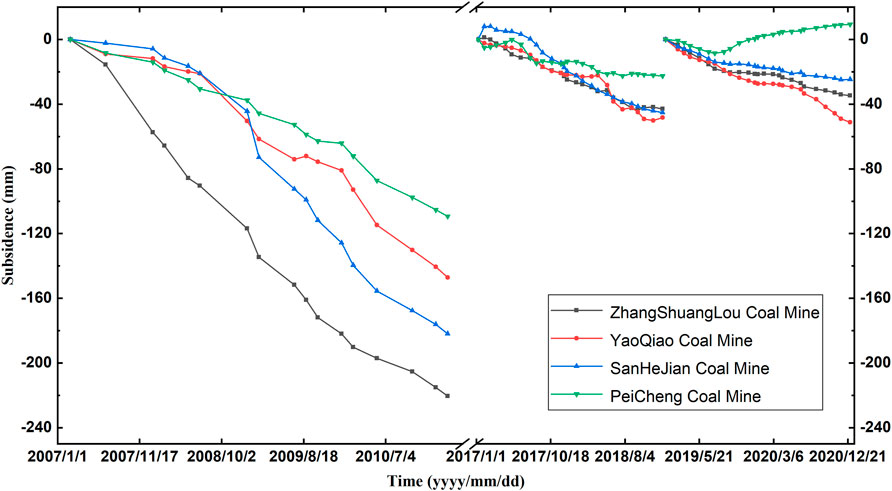
FIGURE 7. Accumulated ground deformation of the coal mines deformation center in different time periods. The corresponding locations are indicated in Table 3 with white stars.
As shown in Table 3, three obvious subsidence centers could be found in ZSL Coal Mine during different monitoring periods. As data display, the mining was put into production in December 1986 and still in progress now. However, compared with the deformation results from 2007 to 2011, the results obtained from 2017 to 2020 yield that the subsidence center of R1 and R2 expanded gradually and then finally merged into a new large one, which was mainly caused by continuous underground mining operations in ZSL coal mines during corresponding periods. However, with the increase of the exploiting depth and the expansion of the mining range, the subsidence region was spatially expanding along with a comparative decrease in the magnitude of subsidence. Also, the subsidence occurred in R3, a excavate coal subside seeper area located in ZSL Coal Mine, was reduced significantly, and the surrounding region became stable except for the northwest corner. It could be seen that the gradually stable surface status has mainly been brought by the goaf overburden strata compaction since the closure of the mining operation.
YQ Coal Mine was put into production in December 1976. Comparing the subsidence process in YQ Coal Mine (Table 3), the surface subsidence was evolved from partial to extensive during the period before 2020, while there was an expansion and offset to the southwest and the northeast in spatial evolution of deformation. Apparently, the subsidence range and magnitude of the mining area was reduced in 2020, but the operation is still in progress. Therefore, regular monitoring of YQ Coal Mine is needed to be carried out for improving the efficiency in development and utilization of the abandoned goaf. Furthermore, with the time series deformation obtained in the YQ mining region (Figure 7), it can be seen that the slope of the deformation curve during different monitoring periods had varied from steep to gentle, which is closely related to the comprehensive of multiple coal seams and the increase in exploiting depth.
The subsidence occurred in R2, located on the east side of SHJ Coal Mine, has slowed down significantly. The production of the mine started in August 1988. Due to the long-term natural compaction of the overburden in the goaf, the surface has been basically stable in recent years. However, there are still two obvious subsidence centers observed during the period from 2017 to 2019 on the south side of the SHJ Coal Mine, which corresponds to the actual mining activity at last. In addition, the surface subsidence caused by underground mining exhibits temporal hysteresis in SHL Coal Mine closed in May 2019, so that the surface instability is only often presented in the initial stage after mine closures. Furthermore, it can be seen that the region of R1 in SHJ coal mines tended to stabilize in 2020.
PC Coal Mine, which is nearest to the city, was established in 1971 and shut down earlier in August 2013. Compared with the three obvious subsidence centers during the period from 2007 to 2011, the surface subsidence of the goaf was weakened significantly in 2017, and there was no obvious subsidence during period from 2018 to 2020, which could be considered a stable goaf. The accumulated subsidence observed in Figure 7 was mainly caused by the combination of overburden strata gravity and groundwater level. With the further compaction of the overburden layer and the rise of the groundwater level, the surface gradually stabilized with slight uplift.
In order to verify the results of this method, the subsidence rate of PS points obtained by the traditional PS-InSAR method was used as a reference value; the nearest point within 20 m was selected from the result of DS-InSAR as the point with the same name. In addition, correlation estimation is given on the points with the same name observed in both PS and DS-InSAR technology (Figure 8), and the corresponding difference could indicate the capability of the presented DS-InSAR in the mining region. There are 16,742 points with the same name in PALSAR data, and the average and standard deviation of those are 1.64 mm/year and 2.51 mm/year (Figures 8A,C), respectively. For Sentinel-1 data, a total of 12,404 points were selected with the average and standard deviation of 1.22 mm/year and 2.04 mm/year (Figures 8B,C), respectively. Moreover, referring to the ellipse shown in Figure 8B, large gradient subsidence in the mining region is much easier to be detected by the DS-InSAR method because of the improving accuracy of phase unwrapping along with the increasing observed points and interferometric phase optimization. The aforementioned analysis shows that the results of corresponding points obtained from the traditional PS-InSAR and DS-InSAR are congruous, which proves the consistency between the two monitoring methods.
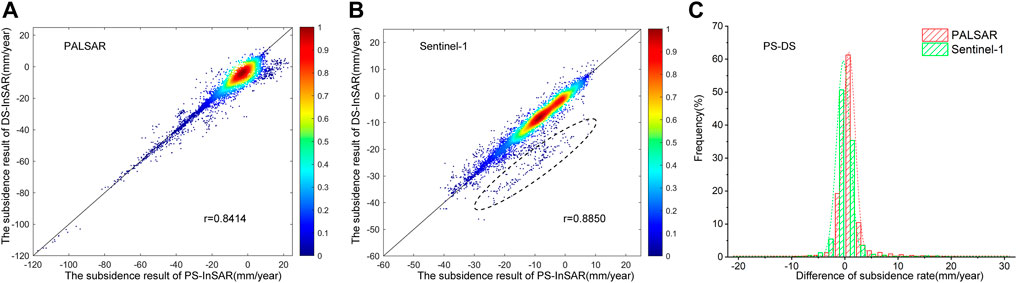
FIGURE 8. Correlation diagram of the deformation rate and statistical histogram of the deformation rate difference of the same name between different monitoring results.
Compared with the conventional PS-InSAR results, the DS-InSAR approach could largely increase the number and spatial distribution density of measurement points by fully exploiting PS and DS points in the mining region. According to the reduction of the distance between measurement points along with the increasing point density, the phase unwrapping operation could be partly improved by overcoming large distance between two adjacent points. Therefore, the deformation characteristics could be apparently reflected in the results obtained by the present method. In addition, the phase optimization processing of the DS target, filtering with both region growing and T-EVD algorithm, could improve the quality of the extracted deformation by weakening the negative influence of noise. The results obtained with DS-InSAR could provide a decision-making support for the land recycling in the abandoned mining region, which proved adaptability of the presented approach in surface activities analysis of the mining region.
Satellite imagery with C- and L-bands covering different temporal periods was only used for comparison and evolution analysis of subsidence in different mining stages owing to the limitation of data acquisition capability. In order to study the evolution of surface deformation fully in mining areas, it is necessary to use more abundant data to carry out a more in-depth and deliberate monitoring and analysis in the future. The comparison results of different periods indicate that the surface deformation during mining operation is mainly caused by underground mining activities. However, both the subsidence center and the deformation range changed along with the variation of the exploiting depth and actual mining. In recent years, some inefficiency and obsolete coal mines were closed gradually, and the phenomenon of surface rebound had been observed with DS-InSAR in some closed mines. In addition, affected by many factors such as the stability of the reserved coal pillars, the compaction of the stratum soil, and the restoration, small fluctuations in surface deformation would be occurring in the mining region. Along with an increase in the closure time, the surface of the mining region gradually became stabilized. In addition, the uplift or secondary subsidence of the surface might occur in some mining areas due to the changes in the groundwater level and the geological environment. Therefore, carrying out a comparative analysis of surface subsidence in Peibei mining area in the past 10 years is of great significance for understanding the surface deformation, stability evaluation, and development and utilization of mining areas.
An improved processing approach was proposed by combining region growing algorithm and T-EVD for phase optimization of distributed scatterers in this article. The number of measurement points could be largely increased, and the negative influence of noise can be weakened, which significantly improved the accuracy and reliability of PS-InSAR technology in surface deformation monitoring in the mining region. The long-term surface subsidence of mining areas in Peibei as well as 68 scenes of multi-source SAR data was calculated and analyzed with the proposed method in the past 10 years. Also, the deformation patterns over the mining region were comparatively studied during the different periods.
The results indicate that coal mines in operation were usually accompanied by the unstable surface with the subsidence. Obviously, with the deepening of the exploiting depth and the expansion of mining, the range of subsidence was expanding, while the mining intensity was decreasing. The surface gradually became stabilized along with the closure of the mining operation. However, the phenomenon of uplift or second subsidence could be sometime observed in the closed mine region, which might be brought by the variation of the groundwater level change along with the complex geological conditions. Thus, it is necessary to continuously carry out regular surface deformation monitoring in the mining area. Generally, the proposed method is not only favorable for detecting the deformation position and influencing the range of goafs, but also promising for general survey of wide area and large gradient surface deformation and detection of subsidence in the mining area, which are vital for land restoration in mining areas and the prevention of related geological disasters.
The original contributions presented in the study are included in the article/Supplementary Material; further inquiries can be directed to the corresponding author.
YD designed and completed experiments and wrote the manuscript. SY contributed significantly to analysis and manuscript preparation. FZ contributed to the conception of the study. DC performed the experiment. HZ helped in performing the analysis with constructive discussions.
This work is funded by the National Natural Science Foundation of China (42004011), the Postgraduate Research and Practice Innovation Program of Jiangsu Province (KYCX21_2301), the Assistance Program for Future Outstanding Talents of China University of Mining and Technology (2021WLJCRCZL141), and the China Postdoctoral Science Foundation (2020M671646).
The authors declare that the research was conducted in the absence of any commercial or financial relationships that could be construed as a potential conflict of interest.
All claims expressed in this article are solely those of the authors and do not necessarily represent those of their affiliated organizations, or those of the publisher, the editors, and the reviewers. Any product that may be evaluated in this article, or claim that may be made by its manufacturer, is not guaranteed or endorsed by the publisher.
The authors would like to express their gratitude to the European Space Agency (ESA) for providing the Sentinel-1 data and the Japan Aerospace Exploration Agency (JAXA) and ESA for providing the ALOS/PALSAR data.
Ansari, H., De Zan, F., and Bamler, R. (2018). Efficient Phase Estimation for Interferogram Stacks. IEEE Trans. Geosci. Remote Sensing 56 (7), 4109–4125. doi:10.1109/tgrs.2018.2826045
Ao, M., Zhang, L., Shi, X., Liao, M., and Dong, J. (2019). Measurement of the Three-Dimensional Surface Deformation of the Jiaju Landslide Using a Surface-Parallel Flow Model. Remote Sensing Lett. 10 (7-9), 776–785. doi:10.1080/2150704X.2019.1608601
Chen, J., Wu, J., Zhang, L., Zou, J., Liu, G., Zhang, R., et al. (2013). Deformation Trend Extraction Based on Multi-Temporal InSAR in Shanghai. Remote Sensing 5 (4), 1774–1786. doi:10.3390/rs5041774
Cloude, S. R., and Pottier, E. (1997). An Entropy Based Classification Scheme for Land Applications of Polarimetric SAR. IEEE Trans. Geosci. Remote Sensing 35 (1), 68–78. doi:10.1109/36.551935
Dong, L. L., Ding, Z. Y., Liu, Y. W., Mao, M. Q., and Wang, Y. T. (2014). Ecaluation of Land Ecological Quality in Coal-Based Cities: a Case Study of Peixian County, Jiangsu Province. Scientific Technol. Manag. Land Resour. 31 (005), 34–40. doi:10.3969/j.issn.10-09-4210.2014.05.006
Dong, L., Wang, C., Tang, Y., Tang, F., Zhang, H., Wang, J., et al. (2021). Time Series InSAR Three-Dimensional Displacement Inversion Model of Coal Mining Areas Based on Symmetrical Features of Mining Subsidence. Remote Sensing 13 (11), 2143. doi:10.3390/RS13112143
Du, Z., Ge, L., Ng, A. H.-M., Zhang, Q., and Alamdari, M. M. (2018). Assessment of the Accuracy Among the Common Persistent Scatterer and Distributed Scatterer Based on SqueeSAR Method. IEEE Geosci. Remote Sensing Lett. 15, 1877–1881. doi:10.1109/LGRS.2018.2864274
Ferretti, A., Fumagalli, A., Novali, F., Prati, C., Rocca, F., and Rucci, A. (2011). A New Algorithm for Processing Interferometric Data-Stacks: SqueeSAR. IEEE Trans. Geosci. Remote Sensing 49 (9), 3460–3470. doi:10.1109/tgrs.2011.2124465
Fornaro, G., Verde, S., Reale, D., and Pauciullo, A. (2015). CAESAR: An Approach Based on Covariance Matrix Decomposition to Improve Multibaseline-Multitemporal Interferometric SAR Processing. IEEE Trans. Geosci. Remote Sensing 53 (4), 2050–2065. doi:10.1109/TGRS.2014.2352853
Gong, P., Liu, H., Zhang, M., Li, C., Wang, J., Huang, H., et al. (2019). Stable Classification with Limited Sample: Transferring a 30-m Resolution Sample Set Collected in 2015 to Mapping 10-m Resolution Global Land Cover in 2017. Sci. Bull. 64 (06), 370–373. doi:10.1016/j.scib.2019.03.002
Guarnieri, A. M., and Tebaldini, S. (2008). On the Exploitation of Target Statistics for SAR Interferometry Applications. IEEE Trans. Geosci. Remote Sensing 46, 3436–3443. doi:10.1109/TGRS.2008.2001756
Jiang, M., Ding, X., Hanssen, R. F., Malhotra, R., and Chang, L. (2015). Fast Statistically Homogeneous Pixel Selection for Covariance Matrix Estimation for Multitemporal InSAR. IEEE Trans. Geosci. Remote Sensing 53 (3), 1213–1224. doi:10.1109/TGRS.2014.2336237
Jiang, M., and Guarnieri, A. M. (2020). Distributed Scatterer Interferometry with the Refinement of Spatiotemporal Coherence. IEEE Trans. Geosci. Remote Sensing 58 (6), 3977–3987. doi:10.1109/tgrs.2019.2960007
Li, M., Zhang, L., Liao, M., and Shi, X. (2016). Detection of Coal-Mining-Induced Subsidence and Mapping of the Resulting Deformation Using Time Series of ALOS-PALSAR Data. Remote Sensing Lett. 7 (7-9), 855–864. doi:10.1080/2150704X.2016.1193794
Liu, L., Jiang, L., Jiang, H., Wang, H., Ma, N., and Xu, H. (2019). Accelerated Glacier Mass Loss (2011-2016) over the Puruogangri Ice Field in the Inner Tibetan Plateau Revealed by Bistatic InSAR Measurements. Remote Sensing Environ. 231, 111241. doi:10.1016/j.rse.2019.111241
Lu, Y. Y., Ke, C. Q., Chen, D. L., and He, M. (2016). Applocation of PS-InSAR in Pei County Mining Area Surface Subsidence Monitoring. Geospatial Inf. 14 (5), 96–99. doi:10.3969/j.issn.16724623.20-16.05.030
Mi, J. X., Zhang, S. L., Hou, H. P., Guo, S. C., and Shang, Z. M. (2017). Study on the Impact of Cutting Coal Overcapacity on Ecological Environment in Mining Area. China Mining Mag. (08), 86–92.
Ning Cao, N., Hyongki Lee, H., and Hahn Chul Jung, H. C. (2015). Mathematical Framework for Phase-Triangulation Algorithms in Distributed-Scatterer Interferometry. IEEE Geosci. Remote Sensing Lett. 12 (9), 1838–1842. doi:10.1109/LGRS.2015.2430752
Shamshiri, R., Nahavandchi, H., Motagh, M., and Hooper, A. (2018). Efficient Ground Surface Displacement Monitoring Using Sentinel-1 Data: Integrating Distributed Scatterers (DS) Identified Using Two-Sample T-Test with Persistent Scatterers (PS). Remote Sensing 10 (5), 794. doi:10.3390/rs10050794
Wang, T., Gu, L. J., Zhan, M. H., Wen, Y. M., Hong, S. Y., and He, F. H. (2013). Research on Ground Subsidence Monitoring of Tianjin Area Based on D-InSAR Technique. Sci. Surv. Mapp. 38 (06), 49–51. doi:10.16251/j.cnki.1009-2307.2013.06.008
Wang, Y. M., and Qin, Y. Y. (2009). Target Detection in SAR Images Based on Region Growing. J. Comp. Appl. 29 (01), 45–46. doi:10.3724/sp.j.1087.2009.00045
Yang, Z., Li, Z., Zhu, J., Yi, H., Hu, J., and Feng, G. (2017). Deriving Dynamic Subsidence of Coal Mining Areas Using InSAR and Logistic Model. Remote Sensing 9 (2), 125. doi:10.3390/rs9020125
Yu, C., Li, Z., and Penna, N. T. (2018). Interferometric Synthetic Aperture Radar Atmospheric Correction Using a GPS-Based Iterative Tropospheric Decomposition Model. Remote Sensing Environ. 204, 109–121. doi:10.1016/j.rse.2017.10.038
Zhang, Y., Wang, Y. J., and Yan, S. Y. (2016). Ground Subsidence Detection of Peibei Mining Area Based on Stacking InSAR Technology. Coal Tech. 35 (07), 102–105. doi:10.13301/j.cnki.ct.2016.07.042
Zhang, Z. J., Wang, C., Tang, Y. X., Fu, Q. Y., and Zhang, H. (2015). Subsidence Monitoring in Coal Area Using Time-Series InSAR Combining Persistent Scatterers and Distributed Scatterers. Int. J. Appl. Earth Observations Geoinformation 39 (99), 1–11. doi:10.1109/JSTARS.2019.294672910.1016/j.jag.2015.02.007
Keywords: DS-InSAR technology, phase optimization algorithm, surface deformation, comparative analysis, mining region
Citation: Du Y, Yan S, Zhao F, Chen D and Zhang H (2022) DS-InSAR Based Long-Term Deformation Pattern Analysis in the Mining Region With an Improved Phase Optimization Algorithm. Front. Environ. Sci. 10:799946. doi: 10.3389/fenvs.2022.799946
Received: 22 October 2021; Accepted: 18 January 2022;
Published: 24 February 2022.
Edited by:
Chen Yu, Newcastle University, United KingdomCopyright © 2022 Du, Yan, Zhao, Chen and Zhang. This is an open-access article distributed under the terms of the Creative Commons Attribution License (CC BY). The use, distribution or reproduction in other forums is permitted, provided the original author(s) and the copyright owner(s) are credited and that the original publication in this journal is cited, in accordance with accepted academic practice. No use, distribution or reproduction is permitted which does not comply with these terms.
*Correspondence: Shiyong Yan, eWFuc2hpeW9uZ0BjdW10LmVkdS5jbg==
Disclaimer: All claims expressed in this article are solely those of the authors and do not necessarily represent those of their affiliated organizations, or those of the publisher, the editors and the reviewers. Any product that may be evaluated in this article or claim that may be made by its manufacturer is not guaranteed or endorsed by the publisher.
Research integrity at Frontiers
Learn more about the work of our research integrity team to safeguard the quality of each article we publish.