 Siddhi Garg1
 Purushottam Kumar Garg
 Bisma Yousuf
 Aparna Shukla
 Uma Kant Shukla
- 1Wadia Institute of Himalayan Geology, Dehradun, India
- 2Indian Institute of Technology, Indore, India
- 3Department of Remote Sensing and GIS, University of Jammu, Jammu, India
- 4Ministry of Earth Sciences, New Delhi, India
- 5Department of Geology, Institute of Science, Banaras Hindu University, Varanasi, India
Proglacial lakes are continually developing and expanding across the Himalayan glaciered terrain in response to climate change. These lakes are known to destabilize the glaciers by enhancing their frontal ablation, causing higher than average glacier area and mass losses. Thus, to comprehend the dynamics of proglacial lakes and their influence on the overall glacier health, we study the lake-terminating Dulung Glacier located in the Suru sub-basin, Ladakh, western Himalaya and compare it with the adjacent land-terminating Chilung Glacier. The pronounced melting of the Dulung Glacier, supported by glacier topography (surface gradient between accumulation and ablation zone) and valley morphology (wider near the snout and narrower downwards), seems to be the prime reason for the formation, accommodation and sustenance of the proglacial lake. The expansion in proglacial lake (.008 km2a−1) during 1977–2018 is accompanied by an enhanced degeneration of the Dulung Glacier (mass balance: −.47 ± .06 m w.e.a−1, shrinkage rate: .3 ± .001% a−1; retreat rate: 32 ± .7 ma−1, surface ice velocity reduction: 16%), which has accelerated post-1993. In comparison, land-terminating Chilung Glacier shows lower degeneration rates (mass balance: −.28 ± .02 m w.e.a−1; shrinkage rate: .2 ± .001% a−1; retreat rate: 17 ± 0.7 ma−1, surface ice velocity reduction: 8%) during 1971–2018. This suggests a substantial impact of the proglacial lake in enhancing the Dulung Glacier’s sensitivity towards climate change compared to the Chilung Glacier. If the current rate of lake expansion continues, it would further enhance the Dulung Glaciers’ degeneration rates, thus impacting its stability.
1 Introduction
The Himalayan glaciers’ response has markedly changed due to climate fluctuations in the last few decades (Kumar et al., 2005). This alteration is evident from the enhanced mass wastage, shrinkage and retreat of most Himalayan glaciers, however, with few exceptions (Bolch et al., 2012; Kulkarni and Karyakarte, 2014; Azam et al., 2018; Shukla et al., 2020b). Such glacier degeneration poses a serious problem for regional-scale water budget and resource management (Barnett et al., 2005; Immerzeel et al., 2020). Another significant threat to the Himalayan cryosphere as a consequence of glacier retreat and shrinkage is the formation of glacial lakes (Nie et al., 2017; Shugar et al., 2020). Glacial lakes have become quite frequent in the Himalayan glaciated environment, with majority of them formed in the last 50 years (Raj, 2010). According to a report by the International Centre for Integrated Mountain Development, there are 15,000 glaciers and 9,000 glacial lakes in the Himalayan region (Mool, 2005). Amongst all these lakes, the proglacial lakes (PGLs), specifically the moraine-dammed lakes, have been recognized as the most disastrous ones. The PGLs typically develop in over-deepened glacier beds behind the lateral and terminal moraines that were formed during the Little Ice Age (Benn et al., 2012; Westoby et al., 2014). Largely, the PGLs receive input from the meltwater generated supra-, en- or sub- glacially. Their origin can be directly linked to the climate-induced thinning/negative mass balance of the associated lake-terminating glaciers (glaciers that reach or terminate in a lake) (Reynolds, 2000; Singh et al., 2011; Kääb et al., 2012; Gardelle et al., 2013; Neckel et al., 2014; King et al., 2019). Once formed, these lakes grow over time due to the differential thermal regimes of ice and warm water that instigate calving, leading to increased terminus retreat of the mother (lake-terminating) glacier (Kirkbride and Warren, 1997; Sakai et al., 2000; Nie et al., 2017; Shukla et al., 2018). In contrast, the dominant ablation process on land-terminating glaciers (glaciers that reach or terminate on dry land) is through surface melting (Singh et al., 2011). The lakes also have the ability to drain out a huge volume of water stored within them to the downstream areas resulting in glacial lake outburst floods (Richardson and Reynolds, 2000; Quincey et al., 2007; Liu et al., 2008). Therefore, to understand the contribution of the PGLs in altering the glaciers’ response and future prediction of any hazard, it is imperative to regularly monitor and study the dynamics of PGLs.
Glacial lakes, being typically situated at remote locations, are difficult to monitor through field investigations owing to obvious challenges of harsh weather, inadequate workforce and logistics. Under such conditions, remote sensing provides the suitable platform to assess lake dynamics and hazard potential on a regular basis (Huggel et al., 2002; Schneider, 2004; Quincey et al., 2005; Bolch et al., 2008; Zheng et al., 2021). Remote sensing techniques have been widely employed in the Himalayan region to monitor the glacial lakes (Quincey and Richardson, 2007; Allen et al., 2009; Gardelle et al., 2011; Raj et al., 2012; Worni et al., 2013; Zhang et al., 2015; Nie et al., 2017; Shukla et al., 2018). These studies have either inventoried the glacial lakes (Worni et al., 2013; Zhang et al., 2015; Aggarwal et al., 2017; Shukla et al., 2018; Pandey and AliChamati, 2021), or investigated their impact on two-dimensional (area, retreat) (Basnett et al., 2013; Mir et al., 2018; Kumar et al., 2021; Pandey and AliChamati, 2021), or three-dimensional (ice thickness, velocity) glacier parameters (King et al., 2018; Liu et al., 2020; Pronk et al., 2021). Though there are many studies on mapping and monitoring Himalayan glacial lakes (Richardson and Reynolds, 2000; Salerno et al., 2012; Majeed et al., 2020), questions on their evolution and role in modifying the overall glacier response still exist. With the second-highest count of glacial lakes after the Brahmaputra, the Indus basin shows an increase in their number during 1990–2010 (Zhang et al., 2015). Meanwhile, though less frequent, glacial lake outburst floods are well reported from the latter, with a recent event (2014) at the Gya village of Ladakh region (Schmidt et al., 2020). Therefore, studies focusing on lake dynamics and their impact on glacier stability need earnest attention to not only predict any hazardous situation in the future but also comprehending the associated glaciers’ state.
The present study focuses on the Dulung Glacier and associated PGL at its snout, located in the Suru sub-basin, Ladakh, western Himalaya. Recently, Mir et al. (2018) also evaluated the Dulung Glacier lake and its impact on glacier response (i.e., shrinkage and retreat rates). Though the study could partly explain the glaciers’ behavior, the comprehensive glacier response remains unexplored. Also, the causative factors influencing the lake formation were only partly assessed. Therefore, to have an in-depth understanding of the glacial lake evolution, apart from Dulung, we also investigated a neighboring glacier named Chilung. Even though Dulung and the adjacent Chilung Glacier share similar geographical and climatic settings, the latter does not have any glacial lake. Therefore, it was interesting to assess and compare the respective valley and other topographic conditions possibly contributing to the lake evolution on one glacier and not on the other. From this study, we aim to: 1) assess the conditions linked with the PGL formation and 2) understand the impact of the PGL expansion on the response of the lake-terminating (Dulung) in contrast to the land-terminating (Chilung) glacier in the adjoining valley.
2 Study Area
The present study involved two mountain glaciers, namely Dulung (size: 14 km2) and Chilung (size: 10 km2) (Figure 1), located in the Suru sub-basin, Ladakh, western Himalaya. The study area extends between the latitude 33°52′ to 33°57′ N and longitude 76°09′ to 76°13′ E. The tributary glaciers contributing to the main trunk are considered single glacier entities (GLIMS, 2015). The Dulung Glacier comprises four glacierets (D1, D2, D3, and D4) along with the main trunk, while the Chilung Glacier comprises two main trunks (C1 and C2) and a glacieret (C3) (Figure 1). In the past, these smaller glacierets would have existed as a single glacier entity. The Dulung and Chilung Glacier’s snouts are located at an elevation of ∼4,450 m above sea level (m asl) and ∼4,550 m asl, respectively, with the presence of a PGL at the formers’ snout (Figure 1). The mean elevation of the glacial lake is 4,407 m asl. The glaciers occupy the maximum altitude of ∼5,700 m asl (Dulung) and ∼5,600 m asl (Chilung). The total length of the Dulung Glacier is approximately 6 km, while that of the Chilung Glacier is approximately 3 km in 2018.
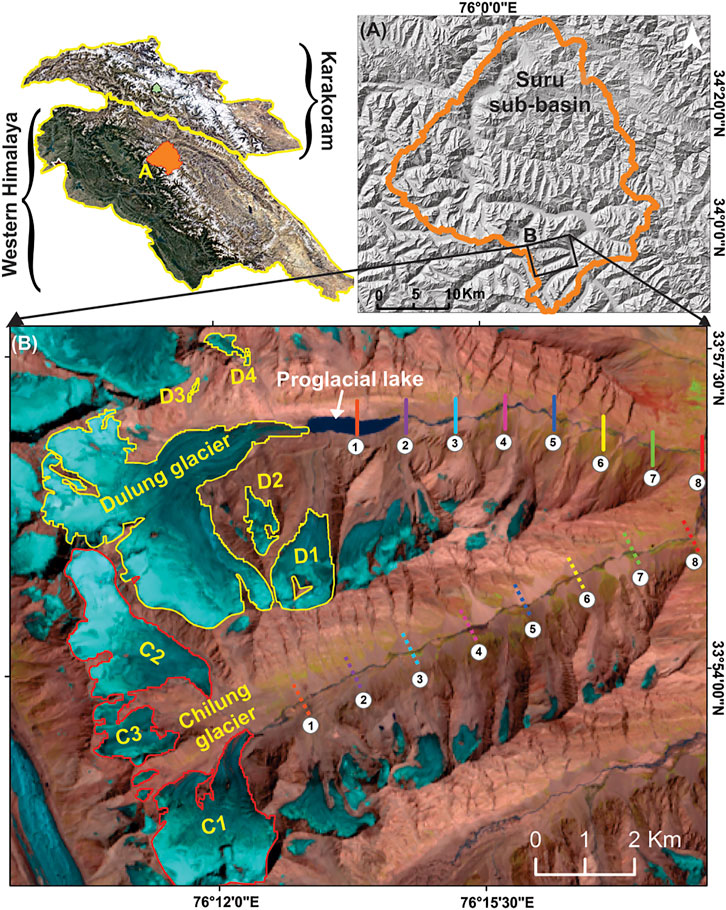
FIGURE 1. Location map of the study area. (A) The study investigates the proglacial lake (PGL) located in the Suru sub-basin, western Himalaya and its impact on the associated Dulung Glacier’s health and compare the response with neighboring Chilung Glacier. (B) The glacier boundaries marked with yellow (Dulung) and red (Chilung) colors are overlaid on the Landsat OLI image acquired on 29 August 2018 with the band combination (false-color composite: R: short-wave infrared, G: near-infrared, B: red). The Dulung Glacier comprises a main trunk along with four glacierets (D1, D2, D3, and D4), while the Chilung Glacier comprises two main trunks (C1 and C2) and a glacieret (C3). To understand the conditions favoring the lake formation, the transverse profiles of the valleys were derived along the equally spaced colored (solid & dashed) lines.
Both the glaciers drain their meltwater into the Suru River, a tributary of River Indus. Suru River originates from the Pensilungpa glacier, which lies near the Pensi La pass. The Suru River is the main hydrological source in the Kargil district of the Ladakh union territory. The villages situated in close proximity (downstream) to the Dulung Glacier are Rangdum, Parkachik, Tangole and Panikhar, with the respective aerial distance of about 21, 58, 67, and 74 km. The regional climatic conditions are harsh, with the occurrence of heavy snowfall during October to June.
3 Materials and Methods
3.1 Dataset Used
A total of 16 Landsat [Multispectral Scanner (MSS), Thematic mapper (TM), Enhanced thematic mapper plus (ETM+) and Operational land imager (OLI)] scenes were used (Supplementary Table S1) in this study to map the PGL boundary and extract glacier parameters such as lake and glacier area, retreat, debris cover, snow line altitude (SLA) and surface ice velocity (SIV) for the period 1971/77–2018. Historical glacier parameters (glacier area, length) for the year 1971 were mapped from declassified Corona KH-4B imagery. All the acquired satellite images were preferentially of the peak ablation period, i.e., August-September, having minimal cloud and seasonal snow cover to ensure accurate mapping and assessment of glacier and lake parameters (Paul et al., 2013). The Landsat, declassified Corona KH-4B and Sentinel Multispectral Instrument (MSI) satellite images were downloaded from the Earth Explorer website (http://earthexplorer.usgs.gov). Besides, high-resolution Linear Imaging Self Scanning Sensor (LISS)-4 (5.8 m) imagery, obtained from nrsc. gov.in, along with the Sentinel MSI (10 m) were also used for validating our mapping results. Advanced Spaceborne Thermal Emission and Reflection Radiometer (ASTER) DMO product along with the Shuttle Radar Topography Mission (SRTM) Digital Elevation Model (DEM) were used for extraction of surface elevation change during 2000–2017. The details of the dataset used are given in Supplementary Table S1. SRTM DEM was also used to extract the topographic parameters and valley profiles. The transverse and longitudinal profiles of the Dulung and Chilung Glacier valleys were prepared at equal distances (1 and 1.2 km for Dulung and Chilung, respectively) from the glacier snout till their confluence with the mainstream. The profile spacing (with a difference to 200 m) was chosen considering the fact that the extent of Chilung Glacier valley (9.8 km) is longer compared to the Dulung Glacier (7.8 km).
3.2 Methodology
The study involved the assessment of multidimensional glacier parameters (area, retreat, debris cover, SLA, SIV, surface elevation changes and mass balance), during the period 1971/77–2018. The time frames for assessing glacier and lake parameters were kept the same, except for SIV and mass balance, which are evaluated for 1993–2018 and 2000–2017, respectively.
3.2.1 Glacier and Proglacial Lake Mapping
Before mapping and extraction of glacier parameters, the raw image data was pre-processed. For this, the satellite images were coregistered with respect to the reference/base image, which in this study is Landsat ETM+ image, acquired on 4 September 2000. For 1971, 1994, 2000, and 2017, the glacier boundaries were obtained from Shukla et al. (2019). The glacier boundaries for these years were delineated using a hybrid approach, i.e., normalized difference snow index (NDSI) for snow and ice boundary and debris cover delineated manually. However, we have not evaluated the lake dimensions for 1971 due to its shadowing in the concerned satellite imagery. Glacier boundaries (mainly the debris cover boundary) for the remaining years (1993, 2008, and 2018) and lake boundaries for all the studied years were manually digitized using false-color composite with RGB band combinations of SWIR-NIR-red, NIR-green-blue and red-green-blue. Band combination SWIR-NIR-red was used for the identification of the glaciers (appearing blue-green). Visual interpretation like terminus shadow, convex/concave shape, emergence of stream and proglacial lake was used to identify the glacier terminus. High-resolution imageries from Google Earth were also referred to identify the actual position of glacier snout and for 3-dimensional visualization. The upper boundaries of the glaciers were kept the same, assuming that they remained unchanged over the studied period. A band combination of NIR-red-green was used to identify water surfaces (Paul et al., 2013), as water shows maximum absorption in the near-infrared and middle infrared bands with slight reflectance in the visible bands. This sharp spectral contrast helps distinguish between the glacial lake and the surrounding topography/feature (Pietroniro and Leconte, 2000).
3.2.2 Extraction of Glacier and Lake Parameters
3.2.2.1 Estimation of Lake and Glacier Area, Retreat, Debris Cover and Snow Line Altitude
The glacier area and supraglacial debris cover estimates were directly extracted from the manually delineated glaciers’ boundaries. The glacier length was measured along the central flow line of the glacier. The frontal retreat was measured using the parallel line method following Garg et al. (2017) and Shukla et al. (2020b). Theoretically, snow line demarcates the boundary separating the accumulation and the ablation zones of the glacier. SLA fluctuates both seasonally and annually and when estimated at the end of hydrological year, it is considered equivalent to equilibrium line altitude (ELA) (Guo et al., 2014). The snow and ice facies show maximum contrast in their spectral signature in the SWIR and NIR bands. The same principle was used for delineating the annual fluctuations in snowlines during 1977–2018. The altitude of snowlines was extracted using the SRTM DEM as per Shukla et al. (2020b).
3.2.2.2 Assessment of Glacier Dynamics
Surface Ice Velocity. The SIV was estimated as per Leprince et al. (2007) and Shukla and Garg (2020), using the feature tracking method on optical imageries (1993/94, 1999/2000, 2009/10, 2017/18). The basic principle involved is the correlation between two orthorectified and co-registered imageries acquired at two different periods. Correlation of the image pairs was performed in Co-registration of Optically Sensed Images and Correlation (COSI-Corr) using the initial and final window size of 64 down to 32 pixels for ETM+ and OLI (PAN band) and 64 down to 16 pixels in case of TM (NIR band) images. The images were resampled to 60 m by selecting the step size of 4 and 2 pixels for ETM+/OLI and TM images, respectively. The correlation produced three components: north-south, east-west displacements and Signal to Noise Ratio images. The signal-to-noise ratio measures the established correlation’s accuracy and may be introduced due to the poor correlation of the images. Therefore, these poorly correlated pixels need to be eliminated so that the error does not propagate to the displacement measurements. For this, the data filtering algorithm was used, removing pixels with a signal-to-noise ratio less than .9 (Saraswat et al., 2013; Gantayat et al., 2014). After that, de-striping was performed separately on the east-west and north-south displacement images, followed by a median filter to smoothen the images.
Further, the directional filter was applied to remove miscorrelations from the displacement images. The offsets in north-south and east-west directions were then utilized to obtain the net surface displacement using the Euclidean norm (Leprince et al., 2007). Finally, the annual SIV was estimated by normalizing the displacement for 365 days interval. Thereafter, the SIV was extracted along the central flow line considering the fact that the glacier velocity is maximum at the center due to the minimum frictional resistance. After extracting the SIV values, the magnitude filter was applied manually, considering that the glacier flow rate should not be abrupt but gradual (Scherler et al., 2008; Garg et al., 2017).
Surface Elevation Change and Mass Balance. To estimate surface elevation change/“dh”, the remote sensing-based geodetic method was adopted for 2000–2017. Before deriving the “dh”, certain horizontal and vertical adjustments were made in the secondary DEM (ASTER DMO) with respect to the master (SRTM) DEM. In this regard, the secondary DEM was initially corrected for X-Y/horizontal shift (Berthier et al., 2007, 2016) to ensure maximum congruence between the DEMs. Following this, the secondary DEM was corrected for vertical biases possibly influencing the “dh”. Prior to the implementation, the following masks were built, on which the corrections were applied: 1) outlier mask- the elevation difference of ≥±100 were eliminated, 2) slope mask- gentle (<4°) to steep (>45°) sloping areas were excluded (Berthier et al., 2016; Garg et al., 2019), 3) cloud and glacier mask- clouds and glacier boundaries (digitized manually) were removed.
Thereafter, the secondary DEM was corrected for: 1) sensor-specific biases, i.e., along/cross-track, which might have aroused due to distortions in sensor geometry (pitch/yaw/roll). To account for these errors, the coordinate system was rotated from X & Y to cross & along-track directions, respectively. The respective elevation difference was computed and added to the ASTER DEMs (Nuth and Kääb, 2011). 2) elevation-dependent biases were minimized by fitting a higher-order polynomial between elevation and elevation difference and subtracted from the secondary DEM (Berthier et al., 2006; Schiefer et al., 2007; Bolch et al., 2008). 3) slope-dependent biases might be frequent in steeper terrain and have been corrected by establishing a relation between slope and elevation difference and fitting it into the ASTER DEM. Finally, the “dh” of the range ±100 was extracted, as the values less or greater than 100 are considered outliers (Bolch et al., 2011). Another possible error may be introduced due to the penetration of the C-band radar waves in the glacier surface, which may vary from 0 to 10 m depending on the local climatic conditions (Schiefer et al., 2007). Due to this, the SRTM DEM underestimates the surface elevation values at higher and overestimates at lower elevations (Berthier et al., 2006; Schiefer et al., 2007). Previous studies have widely recognized this potential source of error and need to be accounted for while estimating the glacier elevation changes (Kääb et al., 2012; Vijay and Braun, 2016; Bhushan et al., 2018). Also, the depth of penetration varies for the different glacier classes, namely snow/firn, ice and debris (Kääb et al., 2012). In this study, penetration depth values of 2.3 ± .6, 1.7 ± .6, and .4 ± .8 m for snow, clean ice, and debris-covered ice, respectively, were used separately, as estimated by Kääb et al. (2012).
The “dh” was computed by subtracting the old DEM from the newer DEM (Eq. 1). The “dh” was estimated along the central flow line, which has maximum changes in the elevation.
Another aspect that needs due consideration is the difference in the acquisition months of the DEM being compared (Gardelle et al., 2013; Zhou et al., 2018). The SRTM DEM was acquired during early February and ASTER DEM during September. Hence, the seasonality correction is required to account for the possible mass change during these 4–5 months. For this, a winter accumulation rate of ± .15 m w.e (equivalent to .17 m) per winter month was used (Gardelle et al., 2013).
The obtained “dh” is further used to estimate mass balance by multiplying the “dh” with average snow/ice density, i.e., 850 kg m−3 (Huss, 2013).
3.2.3 Estimation of Uncertainties
The present study assessed multidimensional glacier parameters involving multisource data, hence, liable to introducing errors (Paul et al., 2013). Therefore, to have confidence in our results, estimation of uncertainties is necessary (Racoviteanu et al., 2008) and was carried out using well-established methods. While mapping the lake or glacier boundaries, the possible error sources are locational and interpretational (Bhambri et al., 2013). The locational errors were rectified through coregistration of satellite images with minimum possible root mean square error (Supplementary Table S1). Meanwhile, the interpretational errors were rectified/minimized using high-resolution satellite data, i.e., LISS-4 and Sentinel MSI imageries for 2017 and 2018, respectively. Comparing our results with these high-resolution satellite data suggest the length and area mapping uncertainties of .5 and 3.8% (Liss-4) and .9 and 4.6% (Sentinel), respectively. Further, area mapping uncertainty has also been assessed using the buffer method by Granshaw and Fountain (2006), mentioned in detail in Shukla et al. (2020b).
Further, the glacier area and length change uncertainties were also estimated (Table 1) utilizing the formula proposed by Hall et al. (2003):
where “a” and “b” are the pixel resolution of images 1 and 2, respectively and 'σ' is the registration error.
where UT is the terminus uncertainty and “x” is the spatial resolution of the sensor.
TABLE 1. Terminus (UT) and area change (UA) uncertainties associated with satellite datasets as defined by Hall et al. (2003). x = spatial resolution of the satellite sensor, σ= registration accuracy, “a” and “b” are the pixel resolution of image 1 and 2, respectively.
Since the debris extents were delineated within the respective glacier boundaries, the proportionate errors are likely to have propagated in debris cover estimates as per Garg et al. (2017). The SLA uncertainty is equal to half the spatial resolution of the satellite images used (for creating the buffer on either side of the snow line demarcating the snow and ice facies) in the horizontal direction and ±17 m (vertical accuracy of SRTM DEM) in the vertical direction.
Surface ice velocity estimations may be subjected to errors arising primarily due to 1) poor correlation of the images, 2) data quality 3) errors during orthorectification. To improve the correlation, the signal-to-noise ratio less than .9 were eliminated. Furthermore, peak ablation and cloud-free images were used to minimize the errors introduced due to poor quality images (cloud and seasonal snow-covered). Also, the Landsat scenes were used here for SIV assessment, which are orthorectified, eliminating the chances of error (Gantayat et al., 2014; Bhushan et al., 2018). Uncertainty in glacier dynamics is estimated over the stable ground, which, ideally, should not have any movement (Table 2).
TABLE 2. Uncertainties associated with the surface ice velocity measurements over the stable terrain. Mean and standard deviation observed over the stable terrain was added to determine the total uncertainties.
Uncertainty in mass balance (
4 Results
4.1 Proglacial Lake Changes
Corona imagery of 1971 shows that the PGL existed as a small pond (Figure 2), located at around 100 m from the Dulung Glaciers’ snout. The PGL is expanding since then, with an overall increase in area by .36 km2 (.01 km2a−1), from .15 km2 (1977) to .51 km2 (2018). For convenience, the multi-temporal changes in the lake are assessed in three different stages: Stage 1 (1977–1993; 16 years), Stage 2 (1993–2008; 15 years) and Stage 3 (2008–2018; 10 years) (Figure 2).
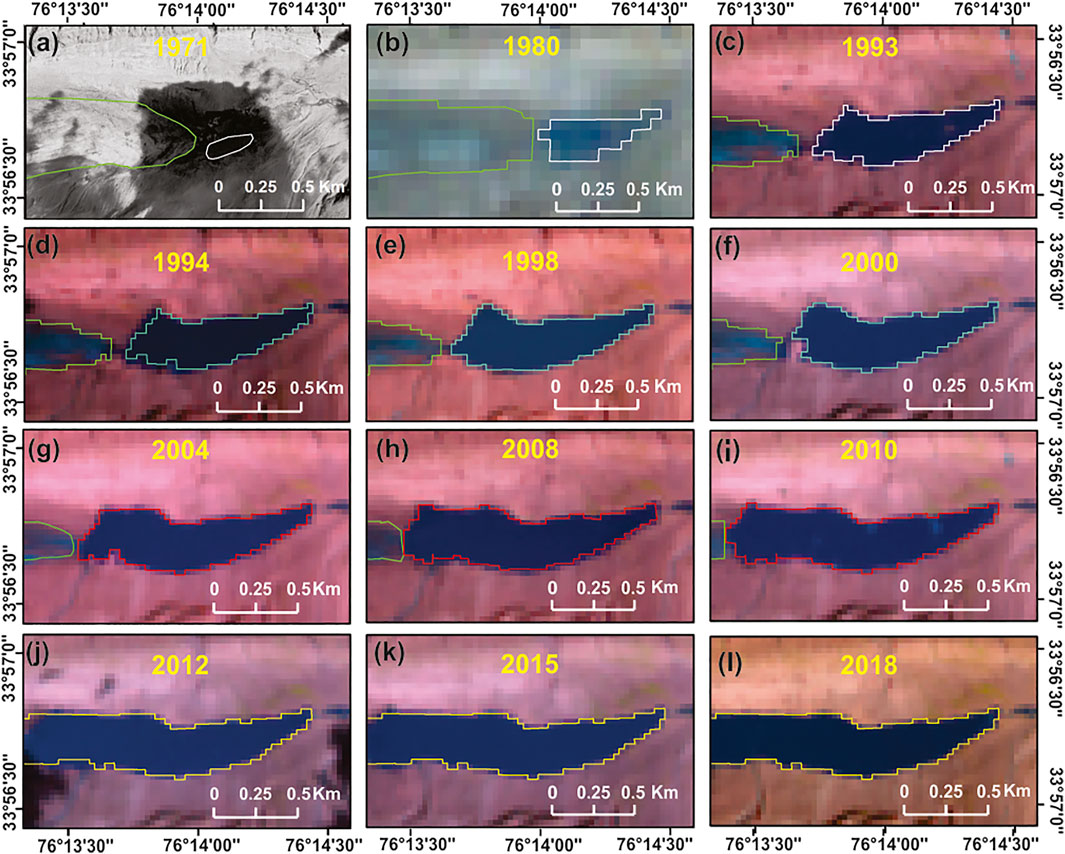
FIGURE 2. Stages of proglacial lake (PGL) expansion during 1971–2018. (A) The PGL existed as a small pond in 1971. (B,C) represents Stage 1: 1977/80–1993, (D–H) Stage 2: 1994–2008, (I–L) Stage 3: 2008–2018 of PGL growth.
Stage 1 (1977–1993): represents the period of slowest and insignificant PGL growth by .008 ± .14 km2a−1.
Stage 2 (1993–2008): represents an increased expansion rate of .01 ± .005 km2a−1.
Stage 3 (2008–2018): represents the continued increment in the lake expansion at the rate of .02 ± .01 km2a−1.
4.2 Glacier Morphological Changes
To understand the impact of lake dynamics on glacier response, multidimensional glacier parameters, i.e., area, length, SLA, SIV, surface elevation change and mass balance, were analyzed from 1971 to 2018.
4.2.1 Frontal Retreat and Area Changes
The snout position of the glaciers monitored for 47 years (Figure 3) reveals an overall retreat of the Dulung Glacier by 1,327 m (retreat rate: 32 ± .7 ma−1). Meanwhile, the Chilung Glacier in the adjacent valley has retreated by 690 m (retreat rate: 17 ± .7 ma−1). Decadal analysis reveals the highest retreat during Stage 3, followed by Stage 2 and minimum during Stage 1 (Table 3).
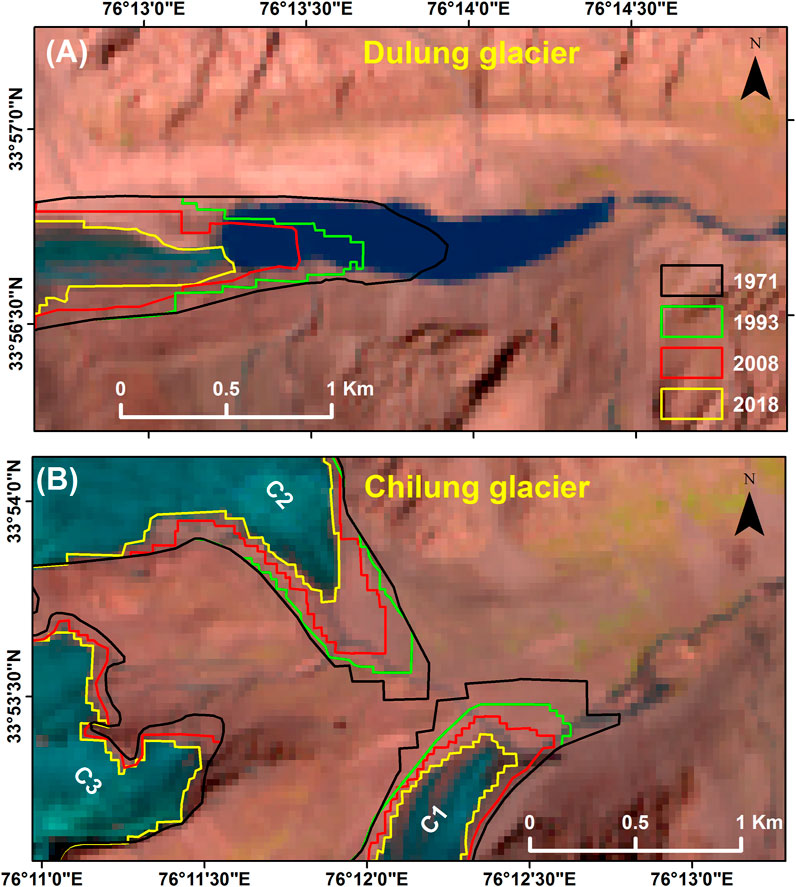
FIGURE 3. Temporal changes in the snout position of Dulung and Chilung Glaciers during 1971–2018. (A) Dulung and (B) Chilung Glacier boundaries are overlaid on Landsat OLI imagery acquired on 28 August 2018 with the band combination [false color composite: R: short-wave infrared (SWIR), G: near-infrared (NIR), B: red].
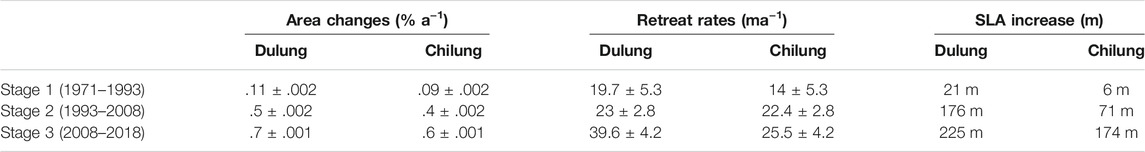
TABLE 3. Decadal-scale changes in the glacier parameters (area, retreat rate and snow line altitude) during 1971/77–2018.
In sync with the overall retreat, the glaciers have also deglaciated by .3 ± .001% a−1 (Dulung) and .2 ± .001% a−1 (Chilung) during 1971–2018. Similar to retreat, the maximum deglaciation is observed during Stage 3, followed by Stage 2 and the minimum during Stage 1 (Table 3).
4.2.2 Snow Line Altitude Changes
The end-of-summer SLA obtained during 1977–2018 shows an average altitude of 5,021 ± 70 and 5,073 ± 90 m asl for Chilung and Dulung Glaciers, respectively (Figure 4). Apart from the higher average SLA, a slightly increased overall rise in SLA (absolute increase: 204 m) has also been observed for the Dulung Glacier (Figure 4), compared to the Chilung Glacier (absolute increase: 191 m). On the decadal scale, maximum upshift in the SLA has been observed during Stage 3, followed by Stage 2 and minimum during Stage 1 (Table 3).
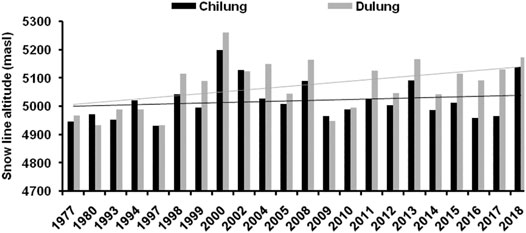
FIGURE 4. Variations in snow line altitude (SLA) of the Chilung and Dulung Glaciers during 1977–2018. Note the higher average SLA of Dulung compared to the Chilung Glacier except for few years.
4.2.3 Changes in Glacier Dynamics
The assessment of SIV during 1993–2018 reveals higher flow rates for Dulung (14.6 ± 4 ma−1) compared to the Chilung (9 ± 4 ma−1) glacier. Both the glaciers have slowed down during the 23 years, however, at variable rates. The Dulung Glacier has slowed down by 16%, from 12.9 ± 3.6 ma−1 (1993/94) to 10.8 ± 1.8 ma−1 (2017/18), while Chilung by 8%, from 8.8 ± 3.6 ma−1 (1993/94) to 8.1 ± 1.8 ma−1 (2017/18), during 1993–2018. Period-wise assessment of SIV suggests an increase during 1993–2000 (Chilung: 3.1 ± 3.6 ma−1; 34%; Dulung: 7.3 ± 3.6 ma−1; 57%), with a reduction thereafter (Chilung: 3.8 ± 3.4 ma−1; 31%; Dulung: 9.4 ± 3.4 ma−1; 47%) (Figure 5). Zonal analysis of Dulung Glacier SIV during 1993–2018 reveals an almost similar magnitude of the decline in the ablation and accumulation zones by approximately 2.3 ma−1(17%) and 1.7 ma−1(14%), respectively. Meanwhile, the Chilung Glacier velocity reveals a significant decrease in the accumulation zone (ACZ) by 2.2 ma−1(23%) and a slight decrease of .3 ma−1(3%) in the ablation region (Figure 5).
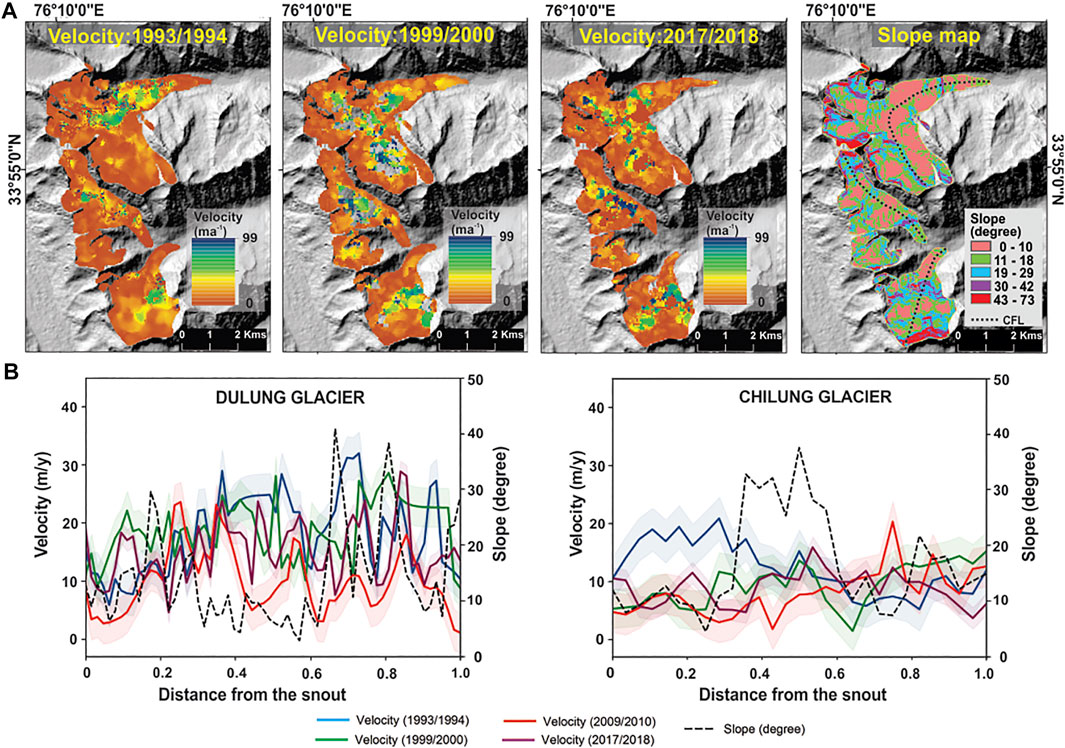
FIGURE 5. Spatio-temporal variability in the surface ice velocity (SIV) of the Dulung and Chilung Glaciers during 1993–2018. (A) Spatial variation in the SIV and slope along the central flow line during three time periods, i.e., 1993/94, 1999/2000 and 2017/18. (B) Variability in SIV resampled over every 100 m distance from the snout alongwith the associated uncertainties.
In sync with the SIV changes, the glaciers have also experienced an average negative mass balance of −.47 ± .06 m w.e.a−1 (Dulung) and −.28 ± .02 m w.e.a−1 (Chilung) during 2000–17 (Figure 6). Also, surface elevation change estimates along the CFL show a slightly increased lowering rate for the Dulung Glacier by −1.34 ± .15 ma−1, compared to the Chilung Glacier (−1.16 ± 0.15 ma−1) during 2000–17. Meanwhile, zone-wise estimates reveal the maximum lowering in the snout (Dulung: −78.82 m; Chilung: −69.28 m), followed by ablation (Dulung: −34.1 ± 27 m; Chilung: −26.5 ± 11 m) and thickening (Dulung: 5.19 ± 4 m; Chilung: 4.59 ± 4 m) in the accumulation zone.
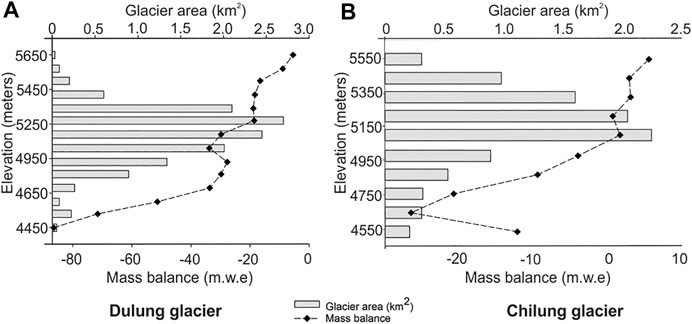
FIGURE 6. Specific mass gain/loss (m w.e) and glacierized area at every 100 m altitude of the (A) Dulung and (B) Chilung Glaciers during 2000–17. Note the higher average mass loss of the Dulung Glacier in the snout region.
5 Discussion
5.1 Response of Lake-Terminating Dulung Glacier and Synchronicity With Other Western Himalayan Glaciers
The overall response of the Dulung Glacier to climate change suggest its degeneration (mass loss: −.47 ± .06 m w.e.a−1) during 2000–2017. The glacier has also shown an upshift in the SLA (absolute increase: 204 m) during 1977–2018, suggesting its melting during the study period. This overall melting has resulted in the glacier shrinkage (.3 ± .001% a−1) during 1971–2018 and reduction in velocity (by 2 ma−1 equivalent to 16%) during 1993–2018. The overall glacier degeneration has also altered its frontal dynamics (retreat: 1,327 m; retreat rate: ∼32 ± .7 ma−1). These results are indicative of the overall negative health of the Dulung Glacier. Further, to comprehensively understand the Dulung Glaciers’ state and its synchronicity with the regional trend, the glaciers’ response is evaluated with respect to the other western Himalayan glaciers (discussed in this section).
Compared to the Dulung, the neighboring land-terminating Chilung Glacier has experienced less mass wastage (−.28 ± .02 m w.e.a−1) during 2000–2017. The mass balance estimate of Dulung Glacier is comparable with the nearby Pensilungpa and Lalung Glaciers of the Suru sub-basin (sharing similar climatic conditions as per (Shukla et al., 2020b)), showing an average mass loss of −.41 m w.e.a−1, respectively during 1999–2016 (Bhushan et al., 2018). Comparing the Dulung Glaciers’ mass loss with other lake terminating glaciers of the western Himalaya (Drung Drang and Samudra Tapu), a fair coherence is also observed (Mukherjee et al., 2018; Ramsankaran et al., 2019; Figure 7A; Supplementary Table S3).
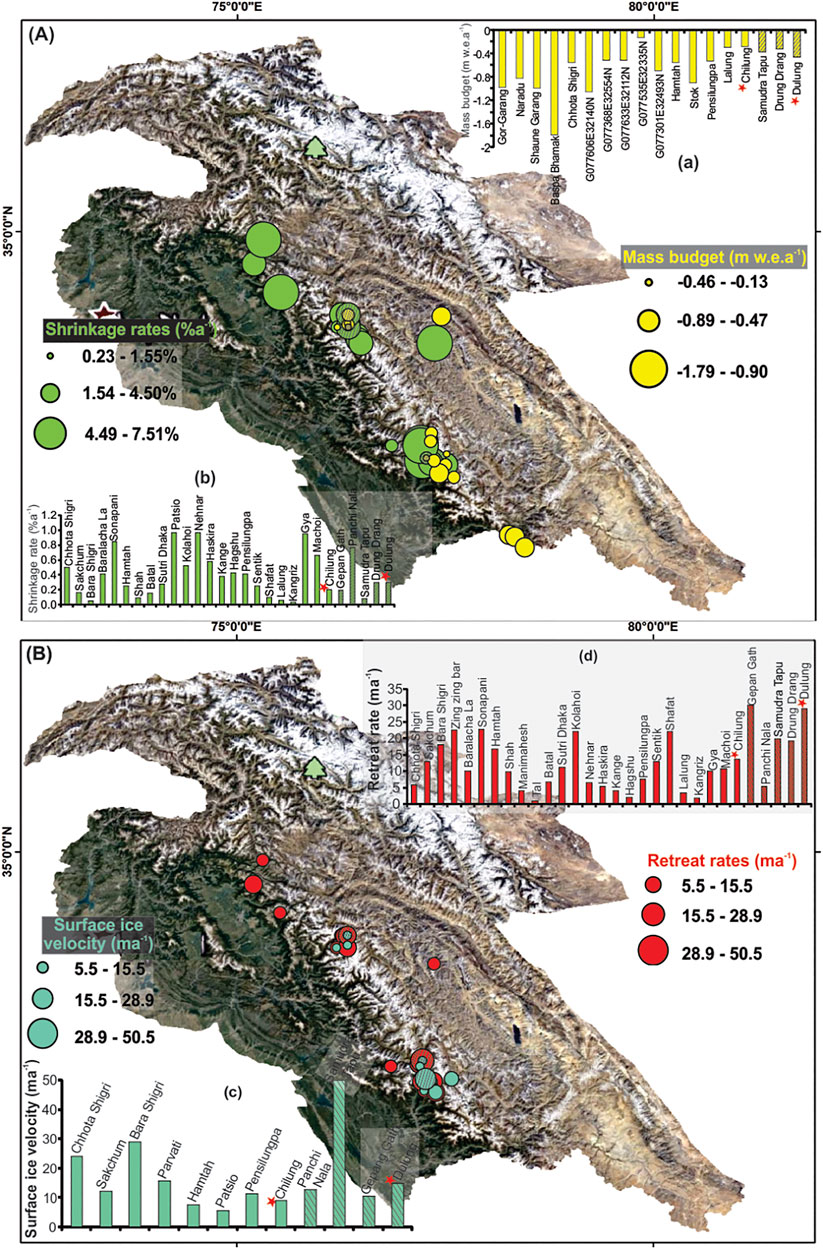
FIGURE 7. Comparative analysis of multiple glacier parameters (A) mass budget (a), shrinkage rates (b) and (B) surface ice velocity (c) and retreat (d), in the western Himalayan glaciers. Shaded circles and graphs represent the lake-terminating glaciers. Star mark shows the results derived in the present study.
As a consequence of mass wastage, the glaciers have been shrinking throughout the Himalaya, with a few exceptions (Bolch et al., 2012; Aggarwal et al., 2017; Azam et al., 2018; Maurer et al., 2019; Shukla et al., 2020b). Likewise, our study also revealed shrinkage of Dulung Glacier, which is relatively higher compared to the Chilung (.2 ± .001% a−1) Glacier during 1971–2018. Overall, the western Himalayan glaciers have shown an average shrinkage rate of .4 ± .3% a−1 during 1962–2019 (Figure 7A; Supplementary Table S2). On average, the shrinkage rate was slightly higher for the lake-terminating (.35 ± .3% a−1) compared to the land-terminating (.3 ± .3% a−1) glaciers (Supplementary Table S2). Similar to Dulung, other lake terminating glaciers of the adjacent Doda sub-basin also showed an overall shrinkage of .29% a−1 during 1977–2013 (Shukla and Qadir, 2016). While Rathore et al. (2015) reported an overall shrinkage of Gepang-gath and Katkar (lake-terminating) Glaciers in western Himalaya by .2% a−1 during 1962–2014. Our results agree with the previous findings, which suggest that the lake-terminating glaciers show enhanced shrinkage than their land-terminating counterparts (Basnett et al., 2013; King et al., 2018; Supplementary Table S2).
As a result of mass loss and shrinkage, the Himalayan glaciers accumulate debris cover (dominantly in the lower ablation region), causing their slowdown (Dehecq et al., 2019). The SIV estimates obtained from the previous investigations in the western Himalaya suggest an average velocity of 18 ± 13 ma−1, with a slowdown rate of 2.1 ± 1.4% a−1 during 1992–2018 (Figure 7B; Supplementary Table S3). Amongst these studies, the lake-terminating glaciers have shown higher average velocity (22 ± 19 ma−1) and slowdown (3 ± 2.4% a−1), compared to the land-terminating ones (average velocity: 14 ± 8 ma−1, slowdown: 1.9 ± .6% a−1). The velocity change rates of these glaciers are also in accordance with our estimates of Dulung, showing average flow rates of 14.6 ma−1 (slowdown: 16%), almost double that of Chilung Glacier (average velocity: 9 ma−1, slowdown: 8%) during 1993–2018. These studies support the findings, which suggest enhanced flow rates of the lake-terminating glaciers compared to their land-terminating counterparts (Pronk et al., 2021).
Other than mass, area and velocity changes, Dulung Glacier has also retreated during 1971–2018 (Figure 3), like the most other Himalayan glaciers (Kamp et al., 2011; Bhambri et al., 2013; Kulkarni and Karyakarte, 2014; Shukla and Qadir, 2016). On the regional scale, the western Himalayan glaciers have retreated at an average rate of 11.6 ± 8 ma−1 during 1962–2019 (Figure 7B; Supplementary Table S3). Amongst these western Himalayan glaciers, the land-terminating ones have shown an average retreat rate of 10.4 ± 7 ma−1. Whereas, the lake-terminating ones (Samudra Tapu, Gepang Gath, Panchi Nala and Drung Drang) have retreated significantly at an average rate of 18.6 ± 10 ma−1. In agreement with these findings, a lower retreat rate was observed for Chilung (∼17 ± .7 ma−1), the land-terminating glacier, compared to the Dulung Glacier (∼32 ± .7 ma−1). Mir et al. (2018) and Kamp et al. (2011) suggested an average retreat rate of 23.3 and 26.6 ma−1 for the Dulung Glacier during 1962–2015 and 1975–2003, respectively. The reported difference in the estimates may be attributed to the different time durations considered by the respective studies. Furthermore, the retreat rate of Dulung has not only exceeded that of Chilung but with respect to all other western Himalayan glaciers except Gepang Gath (Figure 7B; Supplementary Table S3).
These studies, thus, reveal the crucial role of PGL in influencing the calving rates (Figure 3), leading to the rapid retreat of the lake-terminating glaciers compared to their counterparts (R’ohl, 2006; Maurer et al., 2019; Shugar et al., 2020). Similarly, the enhanced degeneration of the Dulung Glacier would have led to the formation of a lake at its snout. However, this cannot be the sole reason, therefore, we investigated other possible factors that could have possibly contributed in the lake evolution.
5.2 Evolution of Proglacial Lake: Forming Factors and Dynamics
The Dulung PGL existed as a small pond in 1971, suggesting its formation during or before the 1970s. However, before understanding the impact of PGL on glacier response, certain queries regarding its formation and dynamics need to be answered.
Often the origin of the PGLs is closely linked to initial occurrences as supraglacial ponds, with the latter acting as the precursor for its (PGL) formation. Therefore, similar to supraglacial, the PGLs’ evolution should also depend upon factors such as glacier topography and its (mother glacier hosting the lake) response to climate change. Besides, valley morphology should also have an important role in PGL formation, as it is the valley that ultimately accommodates the lake. Amongst these factors, the enhanced melting of the mother glacier is an obvious prerequisite for forming any type of glacial lake. This is because of the reason that the impoundment of water anywhere on or near the glacier suggests that the melt produced is in excess of the system’s capacity to drain it. These factors are thus examined in detail to understand their role in the lakes’ formation and subsequent expansion. Also, these factors are assessed for both, i.e., the Dulung and Chilung Glaciers, to comprehend the reason for lake formation only on Dulung.
Glacier surface gradient plays an important role in controlling the glacier dynamics, which, in turn, has a profound influence on glacial lake development (Salerno et al., 2012). The assessment of glacier topography suggests that the Dulung Glacier has attained a gentler mean slope of 18° compared to the Chilung Glacier (20°). Meanwhile, the PGL has a mean slope of 6°. Besides, the difference between the accumulation and the ablation region gradients of Dulung is also more (21.1°/12.6°) compared to the Chilung (19.2°/16.8°). This implies that, unlike Chilung, the steeper slope in the accumulation and gentler in the ablation portions of the Dulung Glacier must have been one of the important factors in the formation of the PGL. Salerno et al. (2012) also suggested that the difference in the surface gradients between the two zones and not the overall slope is the key responsive factor contributing to the lake formation.
The longitudinal valley profile of the glaciers has been studied in three main sections (Figure 8). In the first section, i.e., 500 m from the snout downglacier, the Dulung Glacier exhibits a steeper slope of 5.4° than Chilung (4°). In the second section (500–1,000 m downglacier), the Dulung valley shows a flat profile, restricting the lake. This flat region ends into a mound (elevation of ∼4,357 m) at a distance of ∼1.8 km from the snout of Dulung. This mound is the moraine dam, which is ∼9 m high and ∼195 ± 5 m wide and seen as a loose and unconsolidated material in the Google Earth Imagery. On the other hand, Chilung Glacier valley is gently sloping for the rest of its length. It is important to note that the Chilung valley has not shown any mound in this section; rather, it follows a steep (less than the first section) profile downstream. Thereafter till 4,500 m, both the glaciers follow almost similar profiles. In the third section (4,500 m and further downglacier), Dulung valley differed from Chilung in having a lower elevation and a steeper slope (Figure 8).
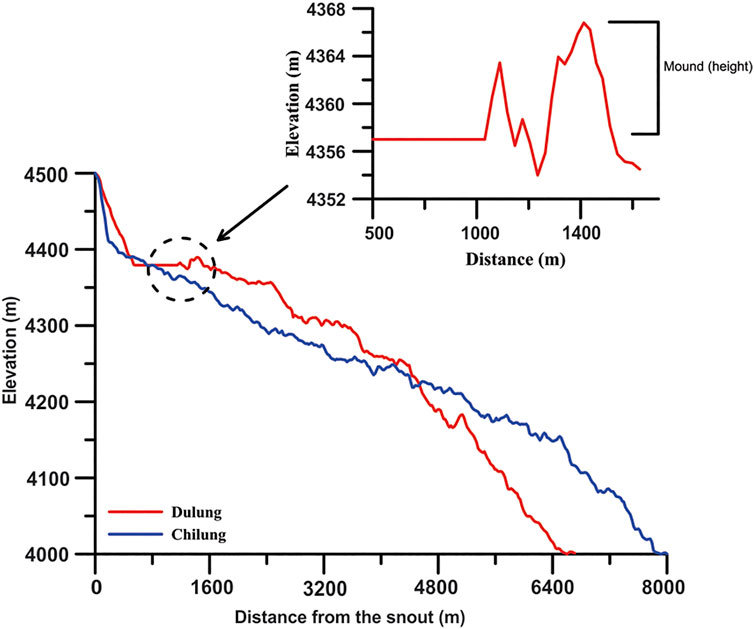
FIGURE 8. Longitudinal profiles of the Dulung (red) and Chilung (blue) glacier valleys. Dulung has an initial steeper section followed by a flat region that ends in a mound. The proglacial lake has formed behind this mound.
The glacier valleys have a typical “U” shape, with a wide and flat floor and steep sides due to the intense erosion of the floor than sides. Investigation of the transverse profile (Figure 1) reveals a wider (226 ± 5 m) and narrower (87 ± 5 m) valley for the initial distance of ∼4 km of the Dulung and Chilung Glaciers’ snout downglacier, respectively. After this distance in downward direction, the trend is opposite, with a narrower (109 ± 5 m) and wider (104 ± 5 m) valley for Dulung and Chilung, respectively (Figure 9).
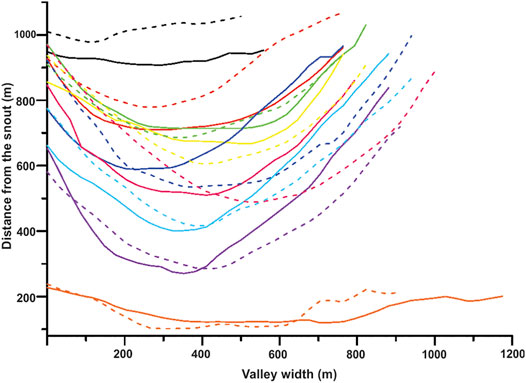
FIGURE 9. Transverse profile of Dulung (solid line) and Chilung (dashed line) glacier valley corresponding to the colored lines in Figure 1. Nine profiles are drawn at a distance of 1 and 1.2 km from the snout for Dulung and Chilung, respectively. The valley of Dulung is wider initially and narrows down later, while Chilung shows an opposite trend.
From these investigations of the glacier topography and valley morphology, it is evident that the relatively higher difference in the surface gradient between the accumulation and the ablation zones of the Dulung Glacier (compared to the Chilung Glacier) would have facilitated the formation of the PGL. Meanwhile, the Dulung Glacier valley, which is initially wider (for a distance of about 400 m from the glacier snout) and narrower down later, must have contributed to the accommodation and sustenance of the lake. Besides accommodating the PGL, valley morphology (shape, slope, erosion capacity, avalanche zones) also has a crucial role in determining its hazard potential (Schneider et al., 2014; Patel et al., 2017).
Once formed, these lakes grow over time due to the differential thermal regimes of ice and warm water at the glacier’s terminus, thus, altering the glaciers’ response to climate change. Thus, to understand the expansion of the PGL, we assessed the long-term end-of-summer SLA (or ELA), which gives a close approximation of the mass balance condition of the studied glaciers (specifically during 1977–2000, when the mass balance data is not available). During 1977–2000, a higher rise in the SLA was observed for the Dulung (increased by 13 ma−1) compared to the Chilung Glacier (increased by 11 ma−1). The relatively higher increase in the Dulung Glacier’s SLA (compared to the Chilung Glacier) indicates its enhanced melting, which would have been a contributing factor in initiating the PGL formation. Further, this trend (of glacier melting) continued post-2000 and is reflected from the glaciers’ mass balance condition depicting an increased mass loss of the Dulung (−.47 ± .06 m w.e.a−1) glacier compared to the Chilung (−.28 ± .02 m w.e.a−1) glacier. Also, the variations in SLA can very well be correlated with the lake area changes. Initially, the slow growth rate of the lake area (.008 km2a−1) during 1977–1993 may be attributed to the slight upshift in the SLA during this period (Section 4.2.2). Meanwhile, in the subsequent years, i.e., during 1993–2008 and 2009–2018, SLA upshifted drastically by about 12 ma−1 and 25 ma−1, respectively, for Dulung compared to the Chilung Glacier (9 ma−1 and 19 ma−1, respectively). This upshift is reflected from the rate of increase in lake area during the respective time frames, i.e., .01 km2a−1 and .02 km2a−1. Also, a good positive correlation (R2 = .69) has been observed between the SLA changes and the rate of increase in the lake area. All these evidences reveal a synchronized relation between the Dulung Glaciers’ melting and the glacial lake dynamics. All these inferences are in agreement that the initiation, formation and enlargement of the PGLs have a much closer and direct relationship with volumetric changes of the glacier, as they are ultimately fed from meltwater discharged from the mother glaciers (Yao et al., 2010).
5.3 Impact of Proglacial Lake on Glacier Stability
Glacier dynamics influence the PGL formation and vice versa. To understand the impact of the lake on its mother glacier, i.e., Dulung, its response was compared to the adjacent land-terminating, Chilung Glacier. The investigation reveals that both the glaciers have degenerated during 1971–2018 (Table 3; Figures 5, 6). All these evidences show the sensitivity of both the Dulung and Chilung Glaciers towards climate change (Shukla et al., 2020b).
Besides the overall degenerative responses of these glaciers, their degeneration rates have also varied, with Dulung being more responsive towards climate change than the Chilung Glacier. Despite sharing similar geographic and climate settings (Shukla et al., 2020a), the Dulung Glacier has shown an increased mass loss, nearly twice that of the Chilung from 2000–2017. Meanwhile, the SLA change also reveals a higher increase for Dulung compared to the Chilung Glacier during 1977–2018 (Figure 4). Other than the overall changes, the variability in glacier response is also observed on different time scales. The glaciers have degenerated more during Stage 2 and 3 compared to the Stage 1 (Section 4). This heterogeneity is also clearly visible in the lake area changes, showing an increase stage 2 onwards (Section 5.1). All these evidences reveal that the PGL has significantly modified the response of the Dulung Glacier over the last four decades. Besides the glacier-wide negative mass balance of the glaciers, the zonal analysis reveals maximum mass loss in the snout region of the Dulung in contrast to the Chilung Glacier (maximum mass loss further up in the ablation zone) (Figure 6). This may be attributed to the different mechanisms operating for lake and land-terminating glaciers. The accelerated melting at the snout portion of the former is owing to the transmission of thermal energy due to the increased absorption of solar energy at the ice-water interface, leading to enhanced terminal melting and, thus, loss in glacier area (King et al., 2018; Liu et al., 2020).
The shrinkage and mass loss of the glaciers have resulted in the increment of debris coverage of the glaciers (average 36%), predominantly in the snout portion. However, the Dulung Glacier has accumulated less debris content (33%) compared to the Chilung Glacier (39%) during the period 1971–2017 (Shukla et al., 2020b). Given the enhanced melt rates of the Dulung Glacier, it should have accumulated more debris cover at its snout (Ali et al., 2017); however, it is not so. This might have occurred due to the magnified mass loss at the snout-lake interface of the Dulung Glacier (Figure 6), thus transferring the debris cover to the moraine dam (surrounding the lake) rather than its accumulation in the lower ablation portion (Garg et al., 2019).
Consequent to the observed mass loss, both the glaciers have slowed down during the 1993–2018 period (Figure 5), however, at variable rates (Dulung: 16%, Chilung: 8%). Despite the overall slowdown, a periodic acceleration was also noticed during 1993–2000 (Section 4.2.3). Relatively higher flow rates are observed for Dulung (14.6 ± 4 ma−1), almost double that of the Chilung (9 ± 4 ma−1) glacier. The velocity has also varied spatially, with higher flow rates observed at the Dulung Glacier’s snout (14.4 ma−1), reducing further to 12.3 ± 3 ma−1 in the lower ablation zone (Figure 5). Compared to Dulung, the Chilung Glacier showed nearly half the velocity rates in the snout region (5.9 ma−1, Figure 5), increasing to 8.8 ± 2 ma−1 further up in the lower ablation zone. Meanwhile, a maximum velocity is observed near the ELA for both the glaciers (Dulung: 16.2 ± 1 ma−1; Chilung: 14.2 ± 3 ma−1), further reducing in the accumulation zone (Dulung: 14.1 ± 4 ma−1; Chilung: 10.3 ± 5 ma−1). The heterogeneity in the velocity profiles is mainly noticed in the snout portion of the glaciers, which can be attributed to the dynamic thinning of the lake-terminating glaciers, also reported by Patel et al. (2021); Pronk et al. (2021). It occurs as a consequence of the reduction in the effective pressure, which may further reduce the compressive stress in the terminus region, leading to dynamic thinning of the glacier (Benn et al., 2012; Liu et al., 2020). Whereas the dynamics of Chilung Glacier differs from the Dulung Glacier, which is not influenced by any glacier lake and similar to other glaciers, flow according to the topography.
The glaciers have also retreated significantly during 1971–2018 (Figure 3). Compared to the Chilung (17 ± .7 ma−1), the Dulung Glacier has retreated at an accelerated rate of 32 ± .7 ma−1 during 1971–2018. Besides, the overall retreat of the glacier during 1971–2018, the retreat rates have also varied on the decadal scale. Decadal analysis reveals that Dulung’s retreat rate has enhanced manifolds compared to the Chilung, showing only a slight increase during different periods (Section 4.2.1). Also, the regression coefficient presented a very good correlation (r2 = .9) between the lake area and the length of Dulung, which indicates the role of the PGL in modifying the Dulung Glaciers’ retreat.
All these evidences thus prove that the presence of PGL at the Dulung Glaciers’ snout significantly influenced its stability as compared to the Chilung Glacier.
6 Conclusions
This study investigated the evolution of a proglacial lake (PGL) associated with the Dulung Glacier, Suru sub-basin, western Himalaya and its impact on the glacier’s response during 1971–2018. Further, to better comprehend the impact of PGL dynamics on the glacier stability, the adjacent land-terminating Chilung Glacier was also assessed. The PGL has dynamically evolved since 1970, favored by topography, valley morphology and glacier morphological changes. The expansion rates of the PGL almost doubled during the investigation periods, i.e., for stage 2 (1993–2008) and 3 (2008–2018) compared to stage 1 (1977–1993). The continuous PGL expansion during 1971–2018 has induced enhanced degeneration of the Dulung Glacier, which shows 1.5 times higher shrinkage and mass loss rates and twice higher retreat rate and velocity reduction than the land-terminating Chilung Glacier. A clear heterogeneity in the glaciers velocity profiles is also noticed in the snout portion (higher flow rates in case of Dulung Glacier), attributed to the dynamic thinning of the lake-terminating glaciers. The accelerated degeneration of the Dulung Glacier is observed stage 2 onwards, which is in sync with the increased lake expansion rate, implying the control of PGL in influencing the Dulung Glaciers’ behavior. The degeneration rate estimated for the Dulung Glacier accords well with other lake-terminating glaciers of western Himalaya and is observed to be higher compared to the land-terminating glaciers, suggesting the highly responsive nature of the lake-terminating glaciers. With the continued melting of the Dulung Glacier, its PGL has a higher potential to grow further. Considering these changes, regular monitoring of the Dulung Glacier and its PGL is recommended. In the future, the GLOF risk assessment should also be performed to establish early warning systems in the susceptible areas in case of any future glacial hazard.
Data Availability Statement
The original contributions presented in the study are included in the article/Supplementary Material, further inquiries can be directed to the corresponding author.
Author Contributions
SG and AS designed the study and led the writing of the manuscript. SG executed the experiments and prepared the figures. AS supervised the study and improved the data analysis and interpretation. PG, BY, and US thoroughly read the paper and contributed to the interpretation of results.
Conflict of Interest
The authors declare that the research was conducted in the absence of any commercial or financial relationships that could be construed as a potential conflict of interest.
Publisher’s Note
All claims expressed in this article are solely those of the authors and do not necessarily represent those of their affiliated organizations, or those of the publisher, the editors and the reviewers. Any product that may be evaluated in this article, or claim that may be made by its manufacturer, is not guaranteed or endorsed by the publisher.
Acknowledgments
Authors are grateful to the Director, Wadia Institute of Himalayan Geology, Dehradun for providing all the research facilities and support for successful completion of this work. AS acknowledges the Secretary, Ministry of Earth Science, New Delhi, India, for providing requisite support.
Supplementary Material
The Supplementary Material for this article can be found online at: https://www.frontiersin.org/articles/10.3389/fenvs.2022.788359/full#supplementary-material
References
Aggarwal, S., Rai, S. C., Thakur, P. K., and Emmer, A. (2017). Inventory and Recently Increasing GLOF Susceptibility of Glacial Lakes in Sikkim, Eastern Himalaya. Geomorphology 295, 39–54. doi:10.1016/j.geomorph.2017.06.014
Ali, I., Shukla, A., and Romshoo, S. A. (2017). Assessing Linkages Between Spatial Facies Changes and Dimensional Variations of Glaciers in the Upper Indus Basin, Western Himalaya. Geomorphology 284, 115–129. doi:10.1016/j.geomorph.2017.01.005
Allen, S. K., Schneider, D., and Owens, I. F. (2009). First approaches towards modelling glacial hazards in the Mount Cook region of New Zealand’s Southern Alps. Nat Hazards Earth Syst Sci 9, 481–499. doi:10.5194/nhess-9-481-2009
Azam, M. F., Wagnon, P., Berthier, E., Vincent, C., Fujita, K., and Kargel, J. S. (2018). Review of the Status and Mass Changes of Himalayan-Karakoram Glaciers. J. Glaciol. 64, 61–74. doi:10.1017/jog.2017.86
Barnett, T. P., Adam, J. C., and Lettenmaier, D. P. (2005). Potential Impacts of a Warming Climate on Water Availability in Snow-Dominated Regions. Nature 438, 303–309. doi:10.1038/nature04141
Basnett, S., Kulkarni, A. V., and Bolch, T. (2013). The Influence of Debris Cover and Glacial Lakes on the Recession of Glaciers in Sikkim Himalaya, India. J. Glaciol. 59, 1035–1046. doi:10.3189/2013jog12j184
Benn, D. I., Bolch, T., Hands, K., Gulley, J., Luckman, A., Nicholson, L. I., et al. (2012). Response of Debris-Covered Glaciers in the Mount Everest Region to Recent Warming, and Implications for Outburst Flood Hazards. Earth-Science Rev. 114 (1-2), 156–174. doi:10.1016/j.earscirev.2012.03.008
Berthier, E., Arnaud, Y., Kumar, R., Ahmad, S., Wagnon, P., and Chevallier, P. (2007). Remote Sensing Estimates of Glacier Mass Balances in the Himachal Pradesh (Western Himalaya, India). Remote Sensing Environ. 108 (3), 327–338. doi:10.1016/j.rse.2006.11.017
Berthier, E., Arnaud, Y., Vincent, C., and Rémy, F. (2006). Biases of SRTM in High-Mountain Areas: Implications for the Monitoring of Glacier Volume Changes. Geophys. Res. Lett. 33 (8), L08502. doi:10.1029/2006gl025862
Berthier, E., Cabot, V., Vincent, C., and Six, D. (2016). Decadal Region-wide and Glacier-wide Mass Balances Derived from Multi-Temporal ASTER Satellite Digital Elevation Models. Validation over the Mont-Blanc Area. Front. Earth Sci. 4 (63), 1–16. doi:10.3389/feart.2016.00063
Bhambri, R., Bolch, T., Kawishwar, P., Dobhal, D. P., Srivastava, D., and Pratap, B. (2013). Heterogeneity in Glacier Response in the Upper Shyok Valley, Northeast Karakoram. The Cryosphere 7, 1385–1398. doi:10.5194/tc-7-1385-2013
Bhushan, S., Syed, T. H., Arendt, A. A., Kulkarni, A. V., and Sinha, D. (2018). Assessing Controls on Mass Budget and Surface Velocity Variations of Glaciers in Western Himalaya. Sci. Rep. 8, 8885. doi:10.1038/s41598-018-27014-y
Bolch, T., Buchroithner, M., Pieczonka, T., and Kunert, A. (2008). Planimetric and Volumetric Glacier Changes in the Khumbu Himal, Nepal, since 1962 Using Corona, Landsat TM and ASTER Data. J. Glaciol. 54, 592–600. doi:10.3189/002214308786570782
Bolch, T., Kulkarni, A., Kääb, A., Huggel, C., Paul, F., Cogley, J. G., et al. (2012). The State and Fate of Himalayan Glaciers. Science 336, 310–314. doi:10.1126/science.1215828
Bolch, T., Pieczonka, T., and Benn, D. I. (2011). Multi-decadal Mass Loss of Glaciers in the Everest Area (Nepal Himalaya) Derived from Stereo Imagery. The Cryosphere 5 (2), 349–358. doi:10.5194/tc-5-349-2011
Dehecq, A., Gourmelen, N., Gardner, A. S., Brun, F., Goldberg, D., Nienow, P. W., et al. (2019). Twenty-first century Glacier Slowdown Driven by Mass Loss in High Mountain Asia. Nat. Geosci 12, 22–27. doi:10.1038/s41561-018-0271-9
Gantayat, P., Kulkarni, A. V., and Srinivasan, J. (2014). Estimation of Ice Thickness Using Surface Velocities and Slope: Case Study at Gangotri Glacier, India. J. Glaciol. 60, 277–282. doi:10.3189/2014jog13j078
Gardelle, J., Arnaud, Y., and Berthier, E. (2011). Contrasted Evolution of Glacial Lakes along the Hindu Kush Himalaya Mountain Range between 1990 and 2009. Glob. Planet. Change 75 (1-2), 47–55. doi:10.1016/j.gloplacha.2010.10.003
Gardelle, J., Berthier, E., Arnaud, Y., and Kääb, A. (2013). Region-wide Glacier Mass Balances over the Pamir-Karakoram-Himalaya during 1999-2011. The Cryosphere 7, 1263–1286. doi:10.5194/tc-7-1263-2013
Garg, P. K., Shukla, A., and Jasrotia, A. S. (2019). On the Strongly Imbalanced State of Glaciers in the Sikkim, Eastern Himalaya, India. Sci. Total Environ. 691, 16–35. doi:10.1016/j.scitotenv.2019.07.086
Garg, P. K., Shukla, A., Tiwari, R. K., and Jasrotia, A. S. (2017). Assessing the Status of Glaciers in Part of the Chandra basin, Himachal Himalaya: A Multiparametric Approach. Geomorphology 284, 99–114. doi:10.1016/j.geomorph.2016.10.022
GLIMS (2015). GLIMS Glacier Database Version 1. Boulder, CO: National Snow and Ice Data Center. doi:10.7265/N5V98602
Govindha Raj, B. K., Kumar, V. K., and S.N., R. (2013). Remote Sensing-Based Inventory of Glacial Lakes in Sikkim Himalaya: Semi-automated Approach Using Satellite Data. Geomatics, Nat. Hazards Risk 4, 241–253. doi:10.1080/19475705.2012.707153
Govindha Raj, K. B. (2010). Remote Sensing Based hazard Assessment of Glacial Lakes: a Case Study in Zanskar basin, Jammu and Kashmir, India. Geomatics, Nat. Hazards Risk 1 (4), 339–347. doi:10.1080/19475705.2010.532973
Granshaw, F. D., and G. Fountain, A. (2006). Glacier Change (1958-1998) in the North Cascades National Park Complex, Washington, USA. J. Glaciol. 52, 251–256. doi:10.3189/172756506781828782
Guo, Z., Wanga, N., Kehrwald, N. M., Mao, R., Wua, H., Wu, Y., et al. (2014). Temporal and Spatial Changes in Western Himalayan Firn Line Altitudes From 1998 to 2009. Global Planet 118, 97–105. doi:10.1016/j.gloplacha.2014.03.012
Hall, D. K., Bayr, K. J., Schöner, W., Bindschadler, R. A., and Chien, J. Y. L. (2003). Consideration of the Errors Inherent in Mapping Historical Glacier Positions in Austria from the Ground and Space (1893-2001). Remote Sensing Environ. 86, 566–577. doi:10.1016/S0034-4257(03)00134-2
Huggel, C., Kääb, A., Haeberli, W., Teysseire, P., and Paul, F. (2002). Remote Sensing Based Assessment of Hazards from Glacier lake Outbursts: a Case Study in the Swiss Alps. Can. Geotech. J. 39 (2), 316–330. doi:10.1139/t01-099
Huss, M. (2013). Density Assumptions for Converting Geodetic Glacier Volume Change to Mass Change. The Cryosphere 7 (3), 877–887. doi:10.5194/tc-7-877-2013
Immerzeel, W. W., Lutz, A. F., Andrade, M., Bahl, A., Biemans, H., Bolch, T., et al. (2020). Importance and Vulnerability of the World's Water Towers. Nature 577, 364–369. doi:10.1038/s41586-019-1822-y
Kääb, A., Berthier, E., Nuth, C., Gardelle, J., and Arnaud, Y. (2012). Contrasting Patterns of Early Twenty-First-century Glacier Mass Change in the Himalayas. Nature 488, 495–498. doi:10.1038/nature11324
Kamp, U., Byrne, M., and Bolch, T. (2011). Glacier Fluctuations between 1975 and 2008 in the Greater Himalaya Range of Zanskar, Southern Ladakh. J. Mt. Sci. 8, 374–389. doi:10.1007/s11629-011-2007-9
King, O., Bhattacharya, A., Bhambri, R., and Bolch, T. (2019). Glacial Lakes Exacerbate Himalayan Glacier Mass Loss. Sci. Rep. 9, 18145. doi:10.1038/s41598-019-53733-x
King, O., Dehecq, A., Quincey, D., and Carrivick, J. (2018). Contrasting Geometric and Dynamic Evolution of lake and Land-Terminating Glaciers in the central Himalaya. Glob. Planet. Change 167, 46–60. doi:10.1016/j.gloplacha.2018.05.006
Kirkbride, M. P., and Warren, C. R. (1997). Calving Processes at a Grounded Ice Cliff. Ann. Glaciol. 24, 116–121. doi:10.3189/S0260305500012039
Kulkarni, A. V., and Karyakarte, Y. (2014). Observed Changes in Himalayan Glaciers. Curr. Sci. 106, 237–244.
Kumar, R., Singh, R. D., and Sharma, K. D. (2005). Water Resources of India. Curr. Sci. 89, 774–811.
Kumar, V., Mehta, M., and Shukla, T. (2021). Spatially Resolved Estimates of Glacial Retreat and lake Changes from Gepang Gath Glacier, Chandra Basin, Western Himalaya, India. J. Geol. Soc. India 97, 520–526. doi:10.1007/s12594-021-1718-y
Leprince, S., Barbot, S., Ayoub, F., and Avouac, J.-P. (2007). Automatic and Precise Orthorectification, Coregistration, and Subpixel Correlation of Satellite Images, Application to Ground Deformation Measurements. IEEE Trans. Geosci. Remote Sensing 45 (6), 1529–1558. doi:10.1109/TGRS.2006.888937
Liu, J. J., Cheng, Z. L., Li, Y., and Su, C. P. (2008). Characteristics of Glacier-lake Breaks in Tibet. Journal of catastrophology 23 (1), 55–60.
Liu, Q., Mayer, C., Wang, X., Nie, Y., Wu, K., Wei, J., et al. (2020). Interannual Flow Dynamics Driven by Frontal Retreat of a lake-terminating Glacier in the Chinese Central Himalaya. Earth Planet. Sci. Lett. 546, 116450. doi:10.1016/j.epsl.2020.116450
Majeed, Z., Mukhtar, M. A., Mir, R. A., Kumar, P., and Krishna, K. (2020). Sonapani Glacier Recession over a Century from 1906-2016, Chandra Basin, Himachal Himalaya. J. Geol. Soc. India 95, 36–44. doi:10.1007/s12594-020-1384-5
Maurer, J. M., Schaefer, J. M., Rupper, S., and Corley, A. (2019). Acceleration of Ice Loss across the Himalayas over the Past 40 Years. Sci. Adv. 5, eaav7266–12. doi:10.1126/sciadv.aav7266
Mir, R. A., Jain, S. K., Lohani, A. K., and Saraf, A. K. (2018). Glacier Recession and Glacial lake Outburst Flood Studies in Zanskar basin, Western Himalaya. J. Hydrol. 564, 376–396. doi:10.1016/j.jhydrol.2018.05.031
Mool, P. K. (2005). Monitoring of Glaciers and Glacial Lakes from 1970 S to 2000 in Poiqu Basin, Tibet Autonomous Region, PR China. Kathmandu, Nepal, and CAREERI, Gansu, China: Unpublished report prepared by ICIMOD.
Mukherjee, K., Bhattacharya, A., Pieczonka, T., Ghosh, S., and Bolch, T. (2018). Glacier Mass Budget and Climate Reanalysis Data Indicate A Climatic Shift Around 2000 in Lahaul-Spiti, Western Himalaya. Clim. Chang. 148, 219–233. doi:10.1007/s10584-018-2185-3
Neckel, N., Kropáček, J., Bolch, T., and Hochschild, V. (2014). Glacier Mass Changes on the Tibetan Plateau 2003-2009 Derived from ICESat Laser Altimetry Measurements. Environ. Res. Lett. 9 (1), 014009. doi:10.1088/1748-9326/9/1/014009
Nie, Y., Sheng, Y., Liu, Q., Liu, L., Liu, S., Zhang, Y., et al. (2017). A Regional-Scale Assessment of Himalayan Glacial lake Changes Using Satellite Observations from 1990 to 2015. Remote Sensing Environ. 189, 1–13. doi:10.1016/j.rse.2016.11.008
Nuth, C., and Kääb, A. (2011). Co-registration and Bias Corrections of Satellite Elevation Data Sets for Quantifying Glacier Thickness Change. The Cryosphere 5 (1), 271–290. doi:10.5194/tc-5-271-2011
Pandey, P., AliChampati Ray, S. N. P. K., and Champati Ray, P. K. (2021). Glacier-Glacial Lake Interactions and Glacial Lake Development in the Central Himalaya, India (1994-2017). J. Earth Sci. 32, 1563–1574. doi:10.1007/s12583-020-1056-9
Patel, L. K., Sharma, P., Laluraj, C. M., Thamban, M., Singh, A., Ravindra, R., et al. (2017). A geospatial analysis of Samudra Tapu and Gepang Gath glacial lakes in the Chandra Basin, Western Himalaya. Natural Hazards 86, 1275–1290. doi:10.1007/s11069-017-2743-4
Patel, L. K., Sharma, P., Singh, A. T., Pratap, B., Oulkar, S., and Thamban, M. (2021). Spatial Surface Velocity Pattern in the Glaciers of Chandra Basin, Western Himalaya. Geocarto Int., 1–18. doi:10.1080/10106049.2021.1920627
Paul, F., Barrand, N. E., Baumann, S., Berthier, E., Bolch, T., Casey, K., et al. (2013). On the Accuracy of Glacier Outlines Derived from Remote-Sensing Data. Ann. Glaciol. 54 (63), 171–182. doi:10.3189/2013AoG63A296
Pietroniro, A., and Leconte, R. (2000). A Review of Canadian Remote Sensing Applications in Hydrology, 1995–1999. Hydrological processes 14, 1641–1666. doi:10.1002/1099-1085(20000630)14:93.0.CO;2-I
Pronk, J. B., Bolch, T., King, O., Wouters, B., and Benn, D. I. (2021). Proglacial Lakes Elevate Glacier Surface Velocities in the Himalayan Region. The Cryosphere 15, 5577–5599. doi:10.5194/tc-2021-90
Quincey, D. J., Lucas, R. M., Richardson, S. D., Glasser, N. F., Hambrey, M. J., and Reynolds, J. M. (2005). Optical Remote Sensing Techniques in High-Mountain Environments: Application to Glacial Hazards. Prog. Phys. Geogr. Earth Environ. 29, 475–505. doi:10.1191/0309133305pp456ra
Quincey, D. J., Richardson, S. D., Lucas, R. M., Reynolds, J. M., Hambrey, M. J., and Glasser, N. F. (2007). Early Recognition of Glacial lake Hazards in the Himalaya Using Remote Sensing Datasets. Glob. Planet. Change 56 (1–2), 137–152. doi:10.1016/j.gloplacha.2006.07.013
Racoviteanu, A. E., Arnaud, Y., Williams, M. W., and Ordoñez, J. (2008). Decadal Changes in Glacier Parameters in the Cordillera Blanca, Peru, Derived from Remote Sensing. J. Glaciol. 54, 499–510. doi:10.3189/002214308785836922
Ramsankaran, R., Pandit, A., and Parla, A. (2019). “Decadal Estimates of Surface Mass Balance for Glaciers in Chandra Basin, Western Himalayas, India-A Geodetic Approach,” in Climate Change Signals and Response. Editorset al. (Springer publication), 109–125.doi:10.1007/978-981-13-0280-0_7
Rathore, B. P., Singh, S. K., Brahmbhatt, R., Bahuguna, I. M., and Rajawat, A. S. (2015). Monitoring of Moraine-Dammed Lakes: a Remote Sensing-Based Study in the Western Himalaya. Curr. Sci. 109 (10), 00113891. doi:10.18520/v109/i10/1843-1849
Reynolds, J. M. (2000). On the Formation of Supraglacial Lakes on Debris Covered Glaciers. Debris- Covered Glaciers (Proceedings of a Workshop Held at Seattle, Washington, USA: IAHS Publ. no., 264. 153–161pp.
Richardson, S. D., and Reynolds, J. M. (2000). An Overview of Glacial Hazards in the Himalayas. Quat. Int. 65-66, 31–47. doi:10.1016/s1040-6182(99)00035-x
Röhl, K. (2006). Thermo-Erosional Notch Development at Fresh-Water-Calving Tasman Glacier. New Zealand. J. Glaciol. 52, 203–213. doi:10.3189/172756506781828773
Sakai, A., Chikita, K., and Yamada, T. (2000). Expansion of a Moraine-Dammed Glacial lake, Tsho Rolpa, in Rolwaling Himal, Nepal Himalaya. Limnol. Oceanogr. 45 (6), 1401–1408. doi:10.4319/lo.2000.45.6.1401
Salerno, F., Thakuri, S., D’Agata, C., Smiraglia, C., Manfredi, E. C., Viviano, G., et al. (2012). Glacial lake Distribution in the Mount Everest Region: Uncertainty of Measurement and Conditions of Formation. Glob. Planet. Change 92-93, 30–39. doi:10.1016/j.gloplacha.2012.04.001
Saraswat, P., Syed, T. H., Famiglietti, J. S., Fielding, E. J., Crippen, R., and Gupta, N. (2013). Recent Changes in the Snout Position and Surface Velocity of Gangotri Glacier Observed from Space. Int. J. Remote Sensing 34 (24), 8653–8668. doi:10.1080/01431161.2013.845923
Scherler, D., Leprince, S., and Strecker, M. (2008). Glacier-surface Velocities in alpine Terrain from Optical Satellite Imagery-Accuracy Improvement and Quality Assessment. Remote Sensing Environ. 112, 3806–3819. doi:10.1016/j.rse.2008.05.018
Schiefer, E., Menounos, B., and Wheate, R. (2007). Recent Volume Loss of British Columbian Glaciers, Canada. Geophys. Res. Lett. 34 (16). doi:10.1029/2007gl030780
Schmidt, S., Nüsser, M., Baghel, R., and Dame, J. (2020). Cryosphere Hazards in Ladakh: the 2014 Gya Glacial lake Outburst Flood and its Implications for Risk Assessment. Nat. Hazards 104, 2071–2095. doi:10.1007/s11069-020-04262-8
Schneider, J. F. (2004). Risk Assessment of Remote Geohazards in Western Pamir, GBAO, Tajikistan. In Proceedings of the international conference on high mountain hazard prevention, pp 252–255.
Schneider, D., Huggel, C., Cochachin, A., Guillén, S., and García, J. (2014). Mapping Hazards From Glacier Lake Outburst Floods Based on Modelling of Process Cascades at Lake 513, Carhuaz. Peru. Adv. Geosci. 35, 145–155. doi:10.5194/adgeo-35-145-2014
Shugar, D. H., Burr, A., Haritashya, U. K., Kargel, J. S., Watson, C. S., Kennedy, M. C., et al. (2020). Rapid Worldwide Growth of Glacial Lakes since 1990. Nat. Clim. Chang. 10, 939–945. doi:10.1038/s41558-020-0855-4
Shukla, A., and Garg, P. K. (2020). Spatio-temporal Trends in the Surface Ice Velocities of the central Himalayan Glaciers, India. Glob. Planet. Change 190, 103187. doi:10.1016/j.gloplacha.2020.103187
Shukla, A., Garg, P. K., and Srivastava, S. (2018). Evolution of Glacial and High-Altitude Lakes in the Sikkim, Eastern Himalaya over the Past Four Decades (1975-2017). Front. Environ. Sci. 6, 1–19. doi:10.3389/fenvs.2018.00081
Shukla, A., Garg, B., Kumar, V., Mehta, M., and Shukla, U. K. (2020a). “Sensitivity of Glaciers in Part of the Suru Basin, Western Himalaya to Ongoing Climatic Perturbations,”. Editors A. P. Dimri, B. Bookhagen, M. Stoffel, and T. Yasunari Himalayan Weather and Climate and its Impact on the Environment(Springer publication), 351–377. doi:10.1007/978-3-030-29684-1_18
Shukla, A., Garg, S., Mehta, M., Kumar, V., and Shukla, U. K. (2019). Temporal Inventory of Glaciers in the Suru Sub- basin, Western Himalaya. Pangaea. doi:10.1594/PANGAEA.904131
Shukla, A., Garg, S., Mehta, M., Kumar, V., and Shukla, U. K. (2020b). Temporal Inventory of Glaciers in the Suru sub-basin, Western Himalaya: Impacts of Regional Climate Variability. Earth Syst. Sci. Data 12, 1245–1265. doi:10.5194/essd-12-1245-2020
Shukla, A., and Qadir, J. (2016). Differential Response of Glaciers with Varying Debris Cover Extent: Evidence from Changing Glacier Parameters. Int. J. Remote Sensing 37, 2453–2479. doi:10.1080/01431161.2016.1176272
Singh, V. P., Singh, P., and Haritashya, U. K. (2011). Encyclopedia of Snow, Ice and Glaciers. Dordrecht: Springer. http://site.ebrary.com/id/10480367.
Vijay, S., and Braun, M. (2016). Elevation Change Rates of Glaciers in the Lahaul-Spiti (Western Himalaya, India) during 2000-2012 and 2012-2013. Remote Sensing 8, 1038. doi:10.3390/rs8121038
Westoby, M. J., Glasser, N. F., Brasington, J., Hambrey, M. J., Quincey, D. J., Reynolds, J. M., et al. (2014). Modelling Outburst Floods From Moraine-Dammed Glacial Lakes. Earth-Science Reviews 134, 137–159. doi:10.1016/j.earscirev.2014.03.009
Worni, R., Huggel, C., and Stoffel, M. (2013). Glacial Lakes in the Indian Himalayas - from an Area-wide Glacial lake Inventory to On-Site and Modeling Based Risk Assessment of Critical Glacial Lakes. Sci. Total Environ. 468-469, S71–S84. doi:10.1016/j.scitotenv.2012.11.043
Yao, T., Li, Z., Yang, W., Guo, X., Zhu, L., Kang, S., et al. (2010). Glacial Distribution and Mass Balance in the Yarlung Zangbo River and its Influence on Lakes. Chin. Sci. Bull. 55 (20), 2072–2078. doi:10.1007/s11434-010-3213-5
Zhang, Y., Hirabayashi, Y., Fujita, K., Liu, S., and Liu, Q. (2015). Heterogeneity in Supraglacial Debris Thickness and its Role in Glacier Mass Changes of the Mount Gongga. Sci. China Earth Sci. 59, 170–184. doi:10.1007/s11430-015-5118-2
Zheng, G., Allen, S. K., Bao, A., Ballesteros-Cánovas, J. A., Huss, M., Zhang, G., et al. (2021). Increasing Risk of Glacial lake Outburst Floods from Future Third Pole Deglaciation. Nat. Clim. Chang. 11, 411–417. doi:10.1038/s41558-021-01028-3
Keywords: Dulung Glacier, western himalayas, glacier response, proglacial lake, suru sub-basin
Citation: Garg S, Garg PK, Yousuf B, Shukla A and Shukla UK (2022) Dulung Proglacial Lake, Suru Sub-Basin, Western Himalaya: Evolution, Controls and Impacts on Glacier Stability. Front. Environ. Sci. 10:788359. doi: 10.3389/fenvs.2022.788359
Received: 02 October 2021; Accepted: 24 January 2022;
Published: 16 February 2022.
Edited by:
Irfan Rashid, University of Kashmir, IndiaReviewed by:
Mauri Pelto, Nichols College, United StatesYong Nie, Institute of Mountain Hazards and Environment (CAS), China
Copyright © 2022 Garg, Garg, Yousuf, Shukla and Shukla. This is an open-access article distributed under the terms of the Creative Commons Attribution License (CC BY). The use, distribution or reproduction in other forums is permitted, provided the original author(s) and the copyright owner(s) are credited and that the original publication in this journal is cited, in accordance with accepted academic practice. No use, distribution or reproduction is permitted which does not comply with these terms.
*Correspondence: Aparna Shukla, YXBhcm5hLnNodWtsYTIyQGdtYWlsLmNvbQ==