 Cheyuan Liu1,2
 Michael Yao-Ping Peng
- 1School of Economics and Management, Guangxi Normal University, Guilin, China
- 2Guangxi-Taiwan Cooperation Research Center, Guilin, China
- 3School of Economics and Trade, Fujian Jiangxia University, Fuzhou, China
- 4College of Urban Economics and Public Administration, Capital University of Economics and Business, Beijing, China
The competitiveness of a city is in the process of competitive development. This study uses the Spatial Dubin Model (SDM) technique to explore the influencing factors and spatial spillover effects of the economic competitiveness of 565 cities in Asia. The study finds that the factor spillover bandwidth affecting the improvement of urban competitiveness is primarily concentrated in the range of 1,000 km. Furthermore, with a maximum elasticity value of roughly 11.6%, a city’s spatial spillover effect is a crucial factor in selecting strategies for enhancing its competitiveness level. Financial services, industrial structure, and human resources all have an influence on the level of urban competitiveness. Therefore, in order to better improve the level of regional urban competitiveness, one is to improve the overall level of factors affecting urban competitiveness and enhance the competitiveness of the city itself; the other is to enhance the flow of factors between regions and make full use of the space of factors Spillover effects enhance the level of regional competitiveness; the third is to enhance the spatial interaction between regions and use the externality of urban competitiveness to achieve an overall improvement in the level of regional competitiveness.
Introduction
In the 21st century, with the acceleration of globalization and the rapid development of informatization, the status of cities in global development has become increasingly prominent, and competition among cities in terms of factors and industries has become increasingly fierce. According to the World Urban Outlook (Revision 2018) report of Economic and Social Affairs of the United Nations Secretariat, as the global economic recovery and urbanization process accelerate, 68% of the population is expected to live in cities by 2050 worldwide, and China’s urban population will grow by 255 million. Cities will become the primary living area of human beings, and the competition between cities will gradually depend on the competitiveness levels of cities (Begg, 1999). Therefore, urban competitiveness research has become a hot topic in the fields of economics, urban planning and management, and an increasing number of academic institutions and scholars have joined the ranks of urban competitiveness research. The extent to which a city, or urban region, in reference to other “contending” cities, is able to provide the employment, income, sports and recreational amenities, degree of social coherence, governance, and urban environment to which its current and potential new residents strive (GUCP and competitiveness, 2020). What is the significance of evaluating urban (and, by extension, regional and national) competitiveness? The answer is that competitiveness cannot be improved until it can be quantified. Because cities compete on a regional, national, and global scale, increasing urban competitiveness enhances city productivity, visibility, popularity, attractiveness, and quality of life, as well as regional and national ones (Bruneckiene et al., 2010). It is clear that understanding and identifying the key factors affecting urban competitiveness, combining their comparative advantages and improving the level of comprehensive competitiveness of cities have become urgent tasks for urban development. Urban competitiveness may indicate the degree of urban development and comprehensive strength, which dictate the trajectory of urban growth (Song and Xie, 2021). The study of urban competitiveness may assist the government in strengthening its position and clarifying its direction, allowing it to better understand the genuine situation in each city and design more appropriate programmes. Different cities’ growth plans are now distinct (Cui and Xu, 2021).
The essence of urban competitiveness is the ability to create more value and welfare for the city (Lever and Turok, 1999; Budd and Hirmis, 2004). At the heart of city competition is the search for different ways and means to create, attract, sustain, and use diverse resources, knowledge, ideas, and innovations to support each individual city’s economic growth and, as a result, to strengthen the city’s position in the urban hierarchy both short-term and long-term (Činčikaitė and Meidute-Kavaliauskiene, 2021). The existing research has primarily focused on qualitative analyses of the factors affecting competitiveness. For example, the basic driving forces of urban development include scientific and technological progress, financial capital, ecological environment, culture and the institutional environment were ignored. In recent years, with the promotion of information and technology in urban development, the role of information and technology in cities has risen rapidly, and science and technology innovation centers and central cities of emerging economies are entering the ranks of the most competitive cities (Ni, 2001) (Song and Xie, 2019). Limited by the availability of urban data, there are relatively few quantitative studies on the degree of influence of the above factors on urban competitiveness. There are also few studies on the key elements of urban competitiveness and the spatial spillover effect. There are several ideas that attempt to explain what it takes for cities to be competitive.
The first is the trade base theory of urban competitiveness, which asserts that exports play a key role in defining a city’s competitiveness (Rowthorn, 1999). The second approach to urban competitiveness is the city’s growing returns approach, in which municipal competitiveness and economic success are dependent on the capacity to recruit talented and educated labor, money, and technology (Hoover; 1937, 1948). The third endogenous growth model considers the city to be a knowledge and innovation center. Lucas (2001) and Romer (1990) emphasize the significance of education, learning by doing, and knowledge spillover. Schumpeter (1934) emphasizes the need of profit-making research and development by firms. The fourth is cluster theory is of urban competitiveness. Spatial/geographical proximity is important for positive and mutually reinforcing interactions that result in competitive advantage and innovation among businesses (Porter, 1990; Porter, 1998; Martin and Simmie, 2008). Fifth, there is a cultural model of economic competitiveness in cities; social and cultural systems either encourage or impede city’s growth and development (Martin and Simmie, 2008).
Because of their relative relevance in the process of urban competitiveness, this study utilizes a mix of these theoretical models. In view of this trend, this paper uses the latest spatial econometrics method, the generalized nested space (GNS) model, and economic competitiveness data for 565 sample cities in Asia to analyze their urban competitiveness level. By controlling the spatial autocorrelation of explanatory variables, the impacts of key elements on urban competitiveness are quantitatively analyzed, and the spatial spillover effect is measured. On this basis, relevant policy implications are discussed, and targeted policy recommendations are provided for enhancing urban competitiveness and building urban agglomerations and economic belts. This study takes into consideration previously disregarded scientific and technical factors, making it more measurable.
The following is how the rest of this article is organized: The second section is a brief review of important literature in this area. The third section describes how to create an empirical analysis model and analyze data. The fourth section looks at results for measurement models, along with optimal model selection and robustness test. The fifth section discusses the mechanisms of spatial spillover effect and urban competitiveness. The key findings of the study are discussed in the sixth section.
Literature Review
tSince the concept of urban competitiveness was first proposed, it has received extensive attention from scholars worldwide. The existing literature shows that factors such as the business environment, cultural foundation, infrastructure, technological innovation, and industry type will have an important impact on the competitiveness of cities, countries and regions (Lacka, 2015; Mullen and Marsden, 2015; Krammer, 2017; Chen et al., 2017; Garden and marten, 2005). Moreover, Stefan (2014) study shows that not single, but multiple factors influence the level of urban competitiveness, such as the business environment, infrastructure, human resources, cultural resources, natural resources, and specific regulatory frameworks, namely, the institutional environment. There is a strong correlation between the level of competitiveness of a city and its institutional environment. Factors such as talent, government management, capital, technology and infrastructure have been the main drivers of urban competitiveness of smart cities (Matos et al., 2017; Sycheva et al., 2020). As the flow of factors between cities continues to accelerate, the above mentioned literature has to a certain extent discussed the important factors affecting the level of urban competitiveness but neglected the impact of spatial spillover between cities on the level of urban competitiveness.
With the rapid development of spatial economics and econometrics, the spatial spillover effect of factors between regions has gradually become accepted. In the existing literature, some scholars have explored the spatial spillover of factors between cities, which plays an important role in promoting urban competitiveness. Cohen and Morrison Paul, (2004), Bronzini and Piselli, (2009), Hu and Li (2015), Wang and Ni (2016) and other scholars have shown that infrastructure such as transportation has a spatial spillover effect on regional economic growth and total factor productivity, thus affecting the competitiveness in a region (Gunderson et al., 2017). Fischer et al. (2009) studied the European region and argued that the spatial autocorrelation and spatial spillover of knowledge between regions will affect the competitiveness level of the region through productivity levels; this effect increases with decreasing distance) Capone and Boix (2005) used a nonspatial model and a spatial model to examine concerning several types of Italian tourism local systems (rural systems, artistic cities, tourist districts) in order to assess external economics and territorial networks. In conclusion, higher growth rates are related with the existence of all stages of the tourism filiere in the local network. Unlike infrastructure spillover and knowledge spillover, Wang (2013) used a nonspatial model and a spatial Durbin model to examine the impact of environmental regulation on industrial competitiveness. According to this study, environmental regulation has a significant geographical spillover impact. Foreign direct investment, the number of scientific and technical personnel, and the industrial scale related to environmental regulation all have a significant positive spillover effect on industrial competitiveness. They stimulate regional competition and improves a region’s overall competitiveness. Su et al. (2021) studied the regional spillovers between digital financial technology and urban ecological efficiency using data from 284 Chinese cities from 2008 to 2018. Financial technology and urban ecological efficiency complement one another, with the latter taking precedence. Spatial and temporal heterogeneity characterizes the spatial interaction spillover effect between the two. These findings contribute to the discovery of new regional ecological efficiency drivers and to the development of digital finance and green ecology in tandem.
In contrast to the above studies, the main research object of this paper is the internal region of a country. Some scholars have extended the research object of urban competitiveness to the country level. Luh et al. (2016) studied the impact of trade-related spillover on the industrial competitiveness of China and the Organization for Economic Cooperation and Development (OECD). The authors suggested that trade-related spillovers can both positively and negatively impact the industrial competitiveness of OECD countries. Both trade and trade-related logistics also have an impact on urban competitiveness. Taking the countries along the “New Silk Road Economic Belt” as the research object, Liu et al. (2017) applied dynamic analysis methods and found that the spatial spillover effect of logistical competitiveness plays an important role in improving urban competitiveness. It is clear that the spatial spillover effect between cities or countries is an important factor for enhancing competitiveness.
Hashi and Stojčić (2013) explored how knowledge spillovers created by firms’ innovation efforts influence their industries’ capacity to compete on quality. The study’s findings confirm the link between innovation, quality improvement, and industry market share, and point to numerous forms of spillover that are important for the competitiveness of national industries in EU member states.
The spatial spillover effect between cities can vary, and this effect is largely limited by geospatial distance. In the existing literature, scholars generally suggest that the overflow-concentration area of the factor spatial spillover effect is between 200 and 1,000 km, and the overflow margin of the spatial spillover effect is as great as 3,000 km. For example, Rodríguez-Pose and Crescenzi (2008) proposed the optimal distance for space overflow as 3 h of travel time (approximately 200 km), which is consistent with the conclusion of Yu et al. (2016) regarding the attenuation of agglomeration space in the productive service industry. Taking China as the research object, Wenqing (2013) reported that the spatial spillover of market potential has the greatest impact on the economy for regions within 1,000 km of the provincial capital. When this distance exceeds 3,000 km, the spatial spillover effect is weakened. Gong and Xu, (2017) suggested a high elasticity distance of 1,150 km∼1,650 km for the spatial spillover effect of regional utilization capacity and an effective spillover boundary of 2,450 km. Chiu and Liu (2021) studied urban development and competitiveness in Keelung, a secondary region city. The study reviewed various urban competitiveness assessment methods and indices used in Taiwan and worldwide. Then, a system for measuring urban competitiveness was developed to identify indices of urban growth. The assessment indices were built using FDM and DANP, with expert opinion determining the effects of different dimensions on each other. Using the DEMATEL-based ANP, experts deemed governance, economics, and society dimensions critical to city competitiveness. Xu and Cui (2021), b y looking at data on urban growth from 2010 to 2018, found 16 indicators of urban competitiveness, such as urban GDP and per capita green space area. They then used principal component analysis to figure out which cities were the most competitive in recent years. In addition, the analytic hierarchy method showed that the main factors that make a city competitive are its size and its ability to compete with other cities in the environment. The report looks at how each city is growing and comes up with Shandong Peninsula Blue Economic Zone development countermeasures.
Although many scholars have studied urban competitiveness (Jiang and Shen, 2010; Lember et al., 2011; Ni et al., 2014), existing research still has the three following research gaps. First, the existing research on the factors affecting urban competitiveness is relatively scattered (Ni et al., 2014; Ni and Jie, 2014). Basically, studies on competitiveness have focused on a single dimension. It is difficult to identify which factors simultaneously affect urban competitiveness, and targeted discussions on the improvement of urban competitiveness are rare. Second, the spatial spillover effect is generally studied between cities (Jiang andShen, 2010; Shen and Yang, 2014). Unfortunately, the spatial spillover effects of different factors affecting urban competitiveness have not attracted sufficient attention. Third, the existing literature on urban competitiveness primarily focuses on qualitatively determining which factors affect urban competitiveness, while there are relatively few quantitative studies on urban competitiveness. In view of these shortcomings, this study uses the spatial econometrics method to quantitatively analyze the various factors affecting urban competitiveness and spatial spillover effects. The spillover boundary, within which urban competitiveness is enhanced, is employed to provide targeted policy recommendations for improving urban competitiveness.
Model Construction and Index Selection
Construction of an Empirical Analysis Model
Elhorst (2014) and Halleck Vega and Elhorst (2015) looked at eight different types of measurement models, including the benchmark OLS model used in the generalized nested space (GNS) model. When certain conditions are met, the GNS model can be gradually reduced to the OLS baseline model, as shown in Figure 1. The GNS can be expressed as:
where
where μ = λWμ+ℇ
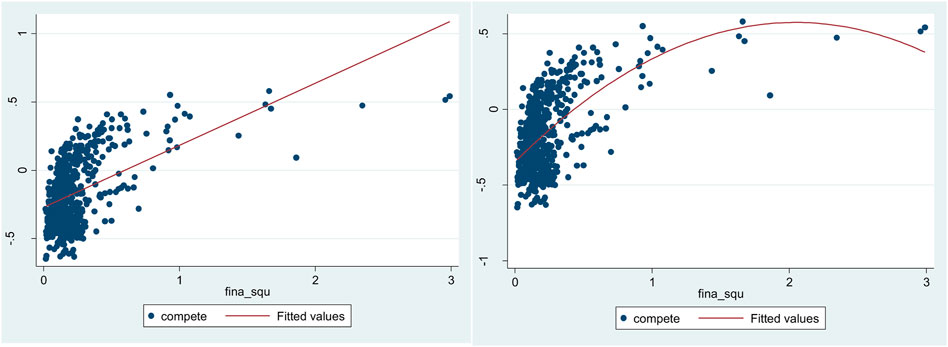
FIGURE 1. Fitting Chart for Performance in Financial Services and Urban Competitiveness.
In Equation 2,
Variable Selection
The explanatory variable of this paper is the level of urban competitiveness. The level of urban competitiveness is the ability of a city to create value and continue to create value in the future. In the short term, this factor represents the scale, speed and efficiency of current value creation. Therefore, the level of urban competitiveness is determined following the method of Peng et al. (2017), based on the economic growth of the city and its comprehensive economic efficiency.
The conditions for promoting urban competitiveness are based on the urban environment, including the soft environment and hard environment. Through the spatial agglomeration of economic entities such as talent and enterprises, the absolute and comparative advantages of the urban industrial system and the competitiveness of the city are determined. Following Peng et al. (2017), this paper selects nine explanatory variables to explore the competitiveness of Asian cities. The first variable is the financial service level of the city (finance), which reflects the city’s ability to mobilize savings and absorb and allocate capital; this factor is based on the bank index and the number of bank branches, and its inverse U-shaped relationship with the level of competitiveness is examined. The second variable is the city’s technological innovation capability (tech), which is the fundamental determinant of new global cities and is determined by the city’s patent index and paper index. The third variable is the city’s industrial system (indust), which is used to reflect the city’s industrial quality and modernization level, specifically based on the number of urban production services and the number of technology companies. The fourth variable is the city’s human capital (psacp), which is the population of the city that can create wealth and value, determined from the size of the labor force, the proportion of inhabitants aged 20–29 years and the university index. The fifth variable is the urban demand (demand) measured by the disposable income of urban residents. The sixth variable is the city’s business cost (business), which is based on the ratio of loan interest rates, tax to GDP, and per capita disposable income to the benchmark hotel price, reflecting the level of corporate income within the city. The seventh variable is the infrastructure index (infrastru), which reflects the basic conditions of the city, based on the city’s shipping convenience, broadband users and aviation convenience. The eighth factor is the living environment indicator (live), reflecting urban life and safety and determined from the city’s PM2.5 and crime rate. It should be noted that this paper takes a square term (fina_squ) for the city’s financial services, reflecting the need for a city’s financial services to develop to a certain extent in order to effectively promote the city’s competitiveness.
To assess the level of urban economic competitiveness and its subindicators, we first conduct a dimensionless indexing process for each specific indicator dataset, and equal weights are added to form a comprehensive index. The formula is
Data-Processing Methods
First, all of the indexes are treated as dimensionless. The dimensions of each global city competitiveness indicator differ, and all of the indicator data must be dimensionless. This report primarily adopts four methods: standardization, indexing, the threshold method and the percentage level method.
The standardized calculation formula is
The calculation formula for the exponential method is
The calculation formula for the threshold method is
The calculation formula for the percentage level method is
Next, we calculate the sub competitiveness index. All indexes that have undergone dimensionless treatment are treated by an equal weight addition, and the indexes of competitiveness for each subitem are obtained. The formula is
where
We then calculate the comprehensive score of global city competitiveness, resulting in the score data for this article.
The research object in this paper includes 565 cities in Asia with more than 500,000 people. The main data sources are the database of the Center for Urban and Competitive Research of the Chinese Academy of Social Sciences and cross-sectional data from the International Statistical Yearbook 2016.
Empirical Analysis and Model Robustness Test
Comparison of Estimation Results for Eight Types of Measurement Models and Optimal Model Selection
Halleck Vega and Elhorst (2015) gave a relationship among eight models, including the baseline model OLS and seven spatial econometric models, and suggested that eight different econometric models could be simultaneously estimated in an empirical analysis. The optimal measurement model can then be selected based on the test parameters of the model estimation results. Following this approach, Table 1 shows the estimation results for eight types of measurement models, including the baseline model OLS.
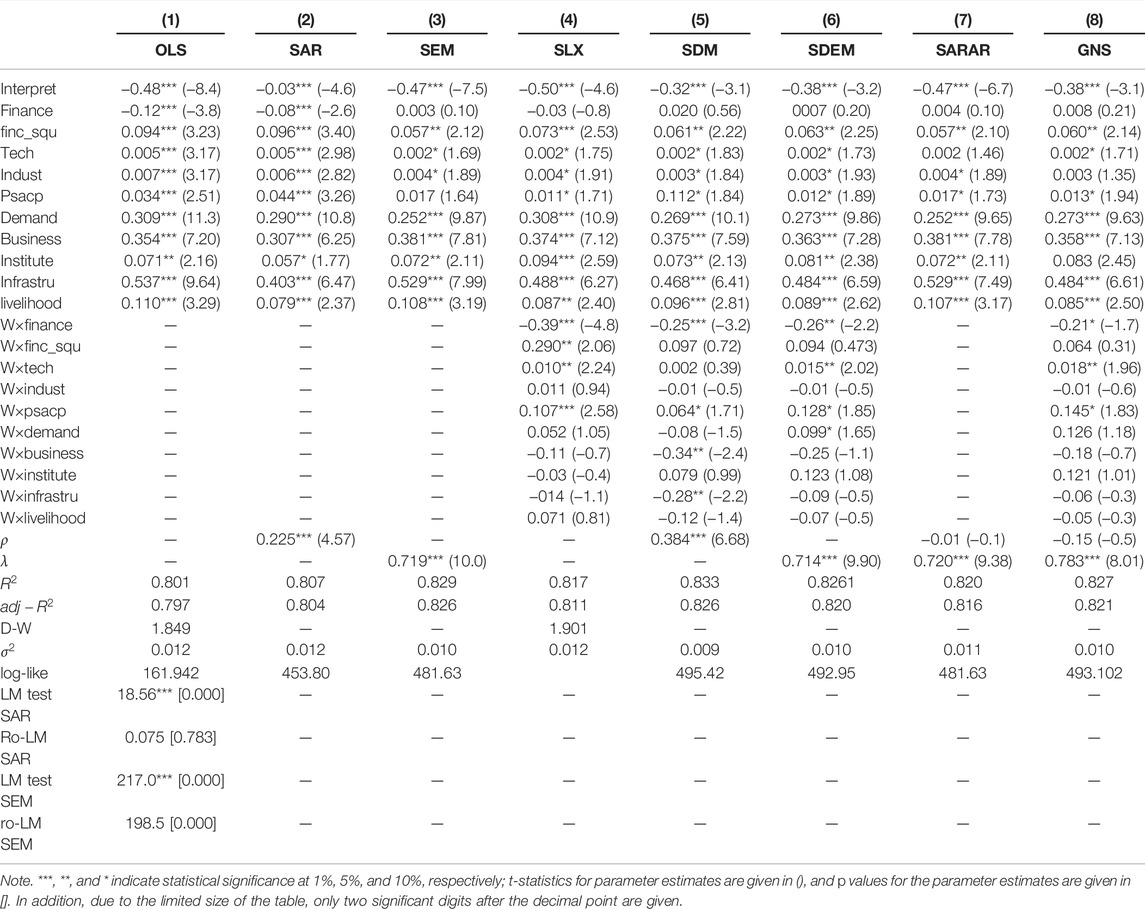
TABLE 1. Comparison of 8 types of measurement models and the selection of an optimal model.
By comparing the results for the reference model OLS and the seven spatial measurement models, the SDM estimation results
According to the estimation results of the SDM, the quadratic term of the financial service, technological innovation capability, industrial structure, human capital, market demand, business environment, institutional environment, infrastructure and living environment are significant with a significance level of at least 10%, and the effects are positive. Therefore, for the target cities, improvements in the abovementioned factors will promote competitiveness, but the promotion of competitiveness for each target city will differ. Infrastructure, business environment and market demand play a greater role in promoting the competitiveness of the target cities. A point increase in each factor will promote the competitiveness of the target cities by 0.468, 0.357 and 0.269 percentage points, respectively. The human capital level and living environment are the second most influential factors, with elasticity values of 11.2% and 9.6%, respectively. The institutional environment, second financial service item, technological innovation capability and industrial system play relatively small roles in promoting urban competitiveness, with elasticity values of 7.3%, 6.1%, 0.2% and 0.3%, respectively.
As shown in Table 2, The estimation result of the financial service level factor is not significant, but its spatial lag term of −0.25 is negative and significant at the 1% significance level; thus, the financial service level of neighboring cities will be improved, and improvements in the competitiveness of the target city will be impeded. This result arises because the level of financial services is conducive to the normal operation and convenient improvement of urban production and life. Residents tend to choose cities with higher financial service levels for production and life. Similarly, the spatial lags for the business environment and infrastructure are also negative, at −0.34 and −0.28, respectively, with a significance level of at least 10%. Hence, improvements in the business environments of neighboring cities and the quality of their facilities will hinder the competitiveness of the target cities because there is a strong competitive effect between cities. Among the spatial items for all of the variables, only the spatial lag term of human capital is significantly positive, at 0.064; thus, an increase in the human capital level will also enhance the competitiveness level of all cities through spillover effects in Figure 2.
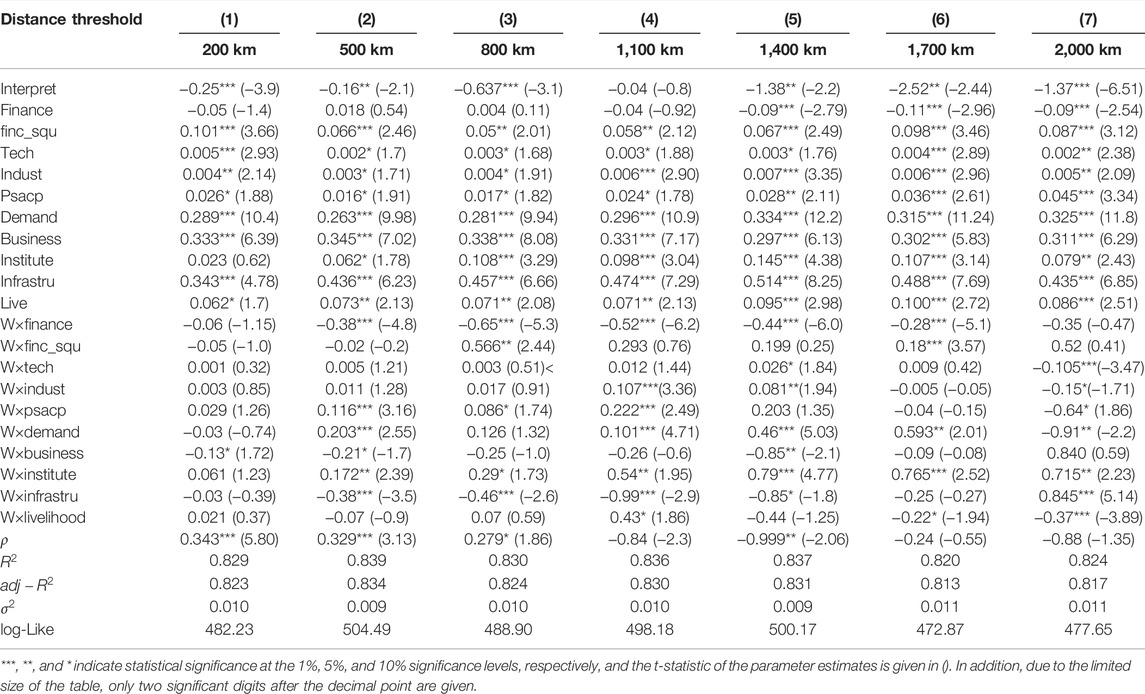
TABLE 2. SDM estimation results for space-time double fixed effects for different distance thresholds.
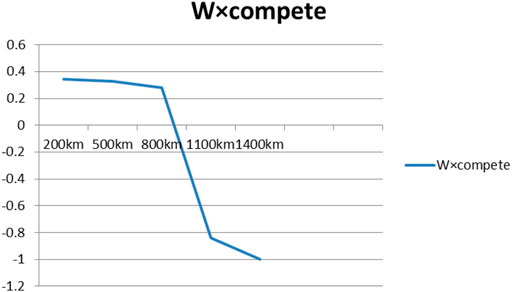
FIGURE 2. Spatial Attenuation of Neighboring Urban Competitiveness.
It is worth noting that the spatial lag coefficient of the interpreted variable
Robustness Test
To determine whether the SDM parameter estimation results of the space-time double fixed effect in Table 1 are robust, the distance threshold matrix is used. Keller (2002) found that technology spillovers are localized rather than globalized, and their impact on economic growth is attenuated as the distance increases; this finding is widely used in studies on the boundary of spatial spillover effects. Concerns and lots of references. On this basis, Rodríguez-Pose and Crescenzi (2008) proposed the optimal distance for space overflow as 3 h of travel time (approximately 200 km). This article follows the approach of Jung and López-Bazo (2017), starting at 200 km and performing a regression for each additional 300 km until the parameter estimation results are no longer significant, up to 2,000 km.
It can be seen in the above table that the SDM estimation results for different distance thresholds have a stronger robustness than the SDM estimation results for space-time double fixed effects. First, in addition to the financial service level elements, promotion of the target city’s nine elements, including the second term of its financial services, technological innovation capabilities, industrial structure, human capital, market demand, business environment, institutional environment, infrastructure and living environment will promote the competitiveness of the city. Second, not all elements that promote the competitiveness of neighboring cities will promote the competitiveness of the target cities. For neighboring cities, there are only six influential elements: financial services, industrial structure, human capital, market demand, institutional environment and infrastructure. Increased investment can improve the competitiveness level of target cities through spatial spillover, while increases in secondary financial services, technological innovation, business environment and living environment elements in neighboring cities do not promote the competitiveness of target cities through spatial spillover. Upgrade. Third, the spatial lag coefficient
Fourth, the spatial overflow distance for a partial factor input is greater than that for the urban competitiveness level. When the distance threshold is greater than or equal to 1,700 km, improvements in technological innovation capability and market demand in neighboring cities will become a hindrance to the competitiveness of the target cities. Improvements in the infrastructure level of a neighboring city change from hindering to promoting the target city’s competitiveness level. Increases in the quadratic term of the level of financial services and institutional environment always promote the competitiveness of the target cities, while improvements in financial services, industrial structure and living environment in neighboring cities always inhibit the competitiveness of the target cities.
Indirect Effects and Their Mechanism of Action
Spatial Spillover Effect and Its Mechanism
Elhorst (2014) noted that when investigating the spatial spillover effect between regions, it is necessary to investigate the feedback effect between regions. By calculating the direct, indirect and total effects, including the reflux effect between regions, one can accurately analyze the spatial spillover effects between regions. Therefore, this paper will analyze the factors affecting the competitiveness of the target city by calculating the direct, indirect and total effects. Table 3 shows the direct, indirect and total effects of different factors for different distance thresholds.
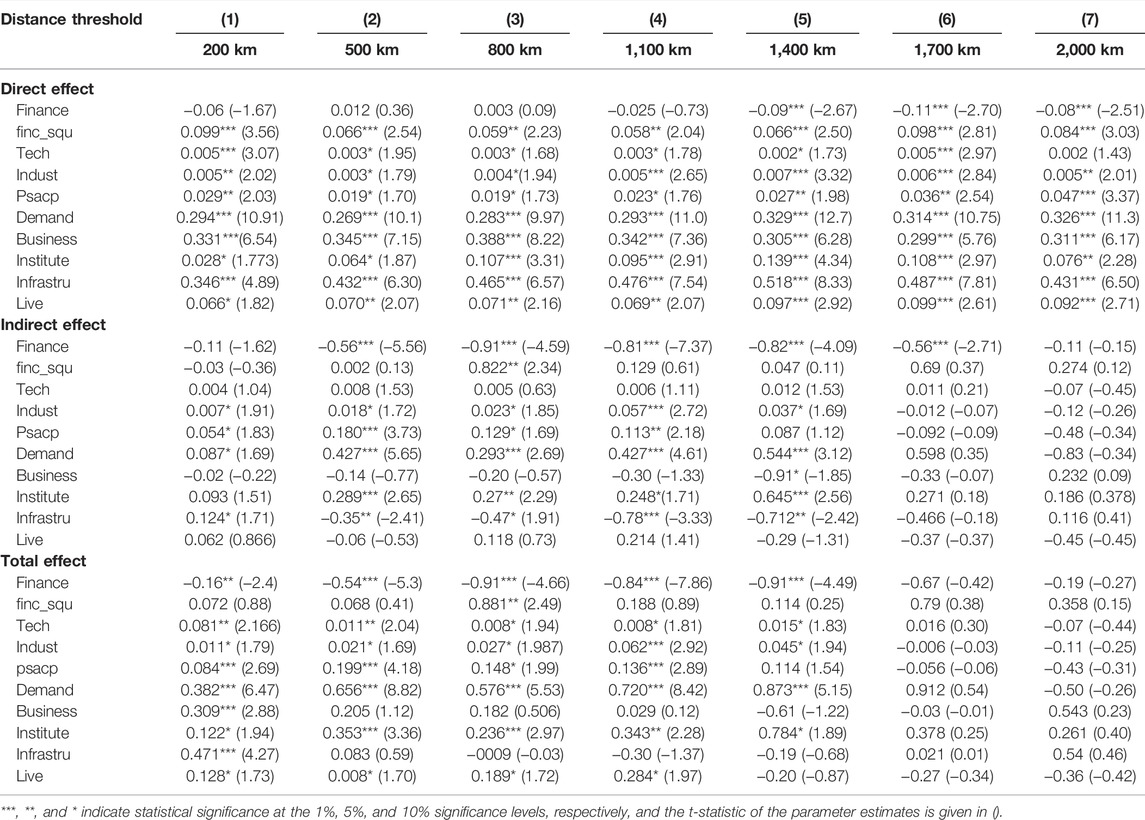
TABLE 3. Direct, indirect and total effect estimates of factor inputs.
Table 3 shows that the level of financial services affects the level of urban competitiveness, as well as the quadratic term of the level of financial services, technological innovation capabilities, industrial systems, human capital, local needs, business environment, institutional environment, infrastructure and life environment. The ten input factors, including the target city’s competitiveness level, do not play a significant role in promoting technological innovation ability at 2,000 km; financial services do not have a significant impact on the city’s competitiveness level beyond 1,400 km and will hinder the city’s competitiveness if the threshold exceeds 1,400 km. The other elements significantly promote the competitiveness of the target city within 2000 km. Moreover, consistent with the estimation results presented for the SDM in Table 1, the infrastructure, business environment and market demand have a greater flexibility in enhancing the level of urban competitiveness, with maximum values of 0.518, 0.388 and 0.329, respectively. The elasticity values of the institutional environment, the quadratic term of the level of financial services and life environment are the second largest, with maximum values reaching 0.139, 0.099 and 0.099, respectively. Technological innovation ability, industrial system and human capital have a relatively small elasticity with respect to the target city’s competitiveness level, with maximum values of only 0.005, 0.007 and 0.047, respectively. Figure 3 shows an attenuation of the direct effects of element inputs on the competitiveness of the target city as the distance threshold increases.
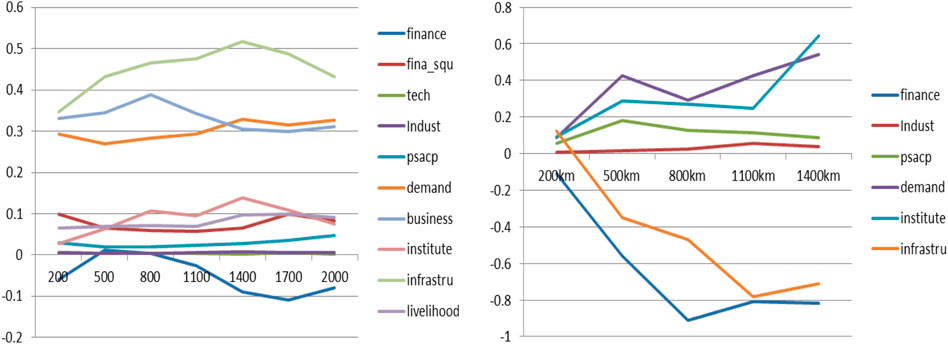
FIGURE 3. Spatial Attenuation Chart for Direct and Indirect Effects of Urban Factor Inputs.
In contrast to the direct impact of elements on the competitiveness level of the target city, not all elements have a significant indirect effect. Among the 10 elements, only the financial service level, industrial system, human capital, local needs, institutional environment and infrastructure had a significant indirect effect on the target city’s competitiveness level, while the quadratic term of the level of financial services, technology innovation, business environment and living environment had no significant indirect effect. The six elements with a significant spatial spillover effect can be divided into two categories. The first category includes the market demand, institutional environment, human capital and industrial structure, which have a positive spatial spillover effect over a range of 1,400 km; the spatial spillover effect elasticity value of the institutional environment, human capital, market demand and industrial structure increased from 0.093, 0.054, 0.087, and 0.007 to 0.645, 0.113, 0.544 and 0.037, respectively. As the distance threshold increases, the spatial spillover effect of human capital decreases. The second category includes financial services and infrastructure, with a geographic threshold of 1,400 km; the negative spatial spillover effect of these factors gradually increases with increasing distance, and the elasticity values gradually decrease from −0.11 and −0.35 to −0.82 and −0.712, respectively. In addition, the negative spatial spillover effect of financial services is larger, and the infrastructure only has a positive spatial spillover effect within 300 km. Figure 2 shows the attenuation of the indirect effect of elements affecting the competitiveness level of the target city with an increasing distance threshold.
In terms of the total effect, the threshold range of the promotion effect of competitiveness level for the target cities is equivalent to that of the indirect effects. For a geographical range of 1,400 km, technological innovation, industrial structure, human capital, market demand, institutional environment and living environment all have a significant positive total effect, with maximum elasticity values of 0.081, 0.062, 0.199, 0.873, 0.784, and 0.284, respectively. The financial service level shows a negative total effect for a range of 1,400 km, with a maximum value of −0.91. The elasticity value of the quadratic term of the level of financial services is only 0.822 for a distance threshold of 800 km, and the elasticity values of the business environment and infrastructure are only 0.309 and 0.471, respectively, within 200 km.
The Mechanism of Urban Competitiveness Improvement
Thus far, we have quantitatively analyzed the indirect effect of different factors with a focus on the factors, and we can see that the spatial spillover effect existing between cities can indeed promote the competitiveness level of the target city. Next, this paper will discuss the promotion spatial spillover effect obtained for cities on the improvement of urban competitiveness with a focus on the cities. Specifically, we calculate the spatial spillover effect for each city and apply it as a variable influencing the urban competitiveness level with other influential parameters, with the help of benchmark OLS regression; we then perform a quantitative analysis of the spatial spillover effect on the competitiveness of the target city. The regression results of the benchmark OLS model are shown in Table 4.
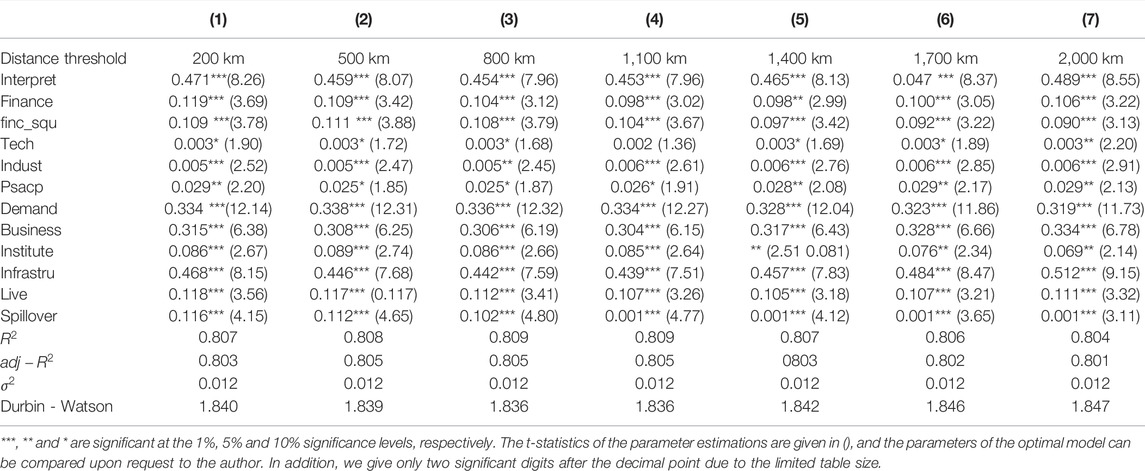
TABLE 4. Spatial spillover effect and its mechanism in cities (同上).
Table 4 shows that the spatial spillover effect on a city is regarded as an element input to promote the city’s competitiveness, and the benchmark regression is conducted while including other factors affecting urban competitiveness. Within the range threshold of 200–2,000 km, all of the regression
The results in Table 4 show that the spatial spillover effect for target cities within 200–2,000 km has a significant impact on urban competitiveness, with a maximum elasticity value of 0.116 at 200 km; this effect is equal to the effect of the quadratic term of the level of financial services, the institutional environment and the living environment and greater than the effect of science and technology innovation ability and human capital on urban competitiveness. Within the range of 200–1,200 km, the competitiveness level of the target city is improved, but the competitiveness is hindered beyond 2,000 km. In terms of the magnitude of its promotion effect, the spatial spillover effect between cities within 800 km is highly elastic and promotes urban competitiveness; for distances of 800–1,100 km, rapid attenuation occurs. A positive spatial spillover effect for cities is observed until a distance of 1,200 km is reached, beyond which the effect on the competitiveness level of target cities is reduced to zero. Thus, the distance threshold obtained in this work for the city spatial spillover effect on the urban competitiveness level is basically consistent with the findings of Yu et al. (2016), who reported a production efficiency space attenuation threshold for the clustering of producer services. However, our threshold is smaller than those reported by Gong and Xu, (2017), who reported an elasticity space area of 1,150 km–1,650 km for regional externalities, and Shao and Su (2017), who argued that the overflow effective boundary for the production efficiency of a global value chain is 1,900 km. This result provides us with a useful reference for the hinterland area of urban agglomeration; namely, the hinterland area of urban agglomeration should be controlled within 1,000 km and should not exceed 1,200 km if possible, in order to ensure that cities within the urban agglomeration can make full use of the spatial spillover effect to improve their competitiveness.
For a distance threshold of 200–2,000 km, improvements in the nine elements, including the quadratic term of the level of financial services, science and technology innovation ability, industrial system, human capital, local demand, business environment, institutional environment, infrastructure and living environment, can significantly promote the urban competitiveness level, with maximum elasticity values of 0.111, 0.003, 0.006, 0.029, 0.338, 0.334, 0.089, 0.512 and 0.118, respectively. However, the level of financial services hinders the improvement of the target city’s competitiveness, with a maximum elasticity of 0.489.
Conclusion
The level of urban competitiveness is the basis for attracting resources and factors, improving urban resilience, and realizing sustainable and rapid urban development. Especially since the outbreak of the new crown pneumonia at the end of 2019, cities that are more resilient and attract more resources and factors have a strong level of economic competitiveness, so that they can quickly resume production and achieve economic development. Anyway, they have fallen into a recession in economic development. Reshape the spatial pattern of Asian cities. Therefore, it is particularly important to quantitatively analyze the influencing factors of urban competitiveness and its impact.
Based on the spatial perspective, this paper uses the SDM method to study the level of economic competitiveness of 565 Asian cities and their spatial spillover effects. The results show that first, the improvement of technological innovation capabilities, industrial system, human capital and other factors will significantly improve the level of economic competitiveness of the city; second, the four factors of industrial structure, human capital, market demand and institutional environment can not only directly improve The level of urban competitiveness will also enhance the level of urban competitiveness through spatial spillover effects; third, the spatial spillover effects of elements have spillover boundaries, and the spillover boundaries of elements are concentrated within a range of 1,400 km. Fourth, the spatial spillover effect of urban economic competitiveness is concentrated in the range of 1,000 km, and the maximum elasticity value is 0.116. Exceeding the spillover boundary will hinder urban competition.
Through the above research, many important enlightenments can be obtained. One is the need to pay attention to the accumulation of factors and the improvement of factor levels in urban development to enhance the level of urban economic competitiveness. The second is to remove barriers to the flow of factors between cities, enhance the mobility of factors between regions, and make full use of the spatial spillover effects of factors to enhance the level of economic competitiveness of cities; third, make reasonable planning and take measures within the radiation range of spatial spillover effects. The multi-center strategy makes full use of the spatial spillover effects of economic competitiveness between cities to achieve an overall improvement in the competitiveness of regional cities.
Data Availability Statement
The original contributions presented in the study are included in the article/supplementary material, further inquiries can be directed to the corresponding author.
Author Contributions
CL, MY-PP, and WG, these three authors made substantial contribution to the conception of the work. CL has made significant construction and modifications to the framework of the article, MY-PP checked the English expression of the manuscript, and he was contributed to conceptual design and discussion. WG has made major contributions to the writing, revision and proofreading of papers, and responsible for the contribution.
Conflict of Interest
The authors declare that the research was conducted in the absence of any commercial or financial relationships that could be construed as a potential conflict of interest.
Publisher’s Note
All claims expressed in this article are solely those of the authors and do not necessarily represent those of their affiliated organizations, or those of the publisher, the editors and the reviewers. Any product that may be evaluated in this article, or claim that may be made by its manufacturer, is not guaranteed or endorsed by the publisher.
References
Begg, I. (1999). Cities and Competitiveness. Urban Stud. 36 (5-6), 795–809. doi:10.1080/0042098993222
Bronzini, R., and Piselli, P. (2009). Determinants of Long-Run Regional Productivity with Geographical Spillovers: The Role of R&D, Human Capital and Public Infrastructure. Regional Sci. Urban Econ. 39 (2), 187–199. doi:10.1016/j.regsciurbeco.2008.07.002
Bruneckiene, J., Guzavicius, A., and Cincikaite, R. (2010). Measurement of Urban Competitiveness in Lithuania. Engineering Economics 21 (5), 493–508.
Budd, L., and Hirmis, A. (2004). Conceptual Framework for Regional Competitiveness. Regional Studies 38 (9), 1015–1028.
Chen, C., Zhang, F., and Zhang, N. (2017). Geographical Distance,Technological Progress and Spatial Spillover Effect of Urban Economic Growth:The Empirical Analysis of the Third Party Effect Based on Extending Solow Model[J]. Nankai Econ. Stud., 23–43.
Chiu, Y. H., and Liu, Y. Y. (2021). The Elaborated Assessment Framework of City Competitiveness from the Perspective of Regional Resource Integration. Sustainability 13 (11), 5932. doi:10.3390/su13115932
Činčikaitė, R., and Meidute-Kavaliauskiene, I. (2021). An Integrated Competitiveness Assessment of the Baltic Capitals Based on the Principles of Sustainable Development. Sustainability 13 (7), 3764. doi:10.3390/su13073764
Cohen, J. P., and Paul, C. J. (2004). Public Infrastructure Investment, Interstate Spatial Spillovers, and Manufacturing Costs. Rev. Econ. Statistics 86 (2), 551–560. doi:10.1162/003465304323031102
Cui, J., and Xu, S. (2021). Study on Regional Competitiveness Differentiation of Shandong Peninsula Urban Agglomeration. integration 1, 2.
Elhorst, J. P. (2014). “Spatial panel data models,” in Spatial Econometrics (Berlin, Heidelberg: Springer), 37–93.
Fischer, M. M., Scherngell, T., and Reismann, M. (2009). Knowledge Spillovers and Total Factor Productivity: Evidence Using a Spatial Panel Data Model. Geogr. Anal. 41 (2), 204–220. doi:10.1111/j.1538-4632.2009.00752.x
Gong, W., and Xu, C. (2017). Spatial Spillover Effect and Regional Economic Growth: an Analysis Based on Local Utilizing Capacity[J]. China J. Econ. 4 (1), 41–61.
Gunderson, E. A., Hamdan, N., Sorhagen, N. S., and D’Esterre, A. P. (2017). Who Needs Innate Ability to Succeed in Math and Literacy? Academic-Domain-Specific Theories of Intelligence About Peers Versus Adults. Developmental Psychology 53 (6), 1188.
Halleck Vega, S., and Elhorst, J. P. (2015). The SLX Model. Journal of Regional Science 55 (3), 339–363.
Hashi, I., and Stojčić, N. (2013). The Impact of Innovation Activities on Firm Performance Using a Multi-Stage Model: Evidence From the Community Innovation Survey 4. Research Policy 42 (2), 353–366.
Hu, Y., and Li, H. (2015). The Estimate of Transport Hub Level and its Spatial Spillover Effects-A Spatial Panel Data Study on China’s Prefecture-Level City[J]. China Ind. Econ., 32–43.
Jung, J., and López-Bazo, E. (2017). Factor Accumulation, Externalities, and Absorptive Capacity in Regional Growth: Evidence from Europe. J. Reg. Sci. 57 (2), 266–289. doi:10.1111/jors.12304
Keller, W. (2002). Geographic Localization of International Technology Diffusion. Am. Econ. Rev. 92 (1), 120–142. doi:10.1257/000282802760015630
Krammer, S. M. S. (2017). Science, Technology, and Innovation for Economic Competitiveness: The Role of Smart Specialization in Less-Developed Countries. Technol. Forecast. Soc. Change 123 (5), 95–107. doi:10.1016/j.techfore.2017.06.028
Łącka, I. (2015). Innovativeness and Competitiveness of the New European Union States in Variable Economic Situation between 2006 and 2013. Procedia - Soc. Behav. Sci. 213 (1), 185–191. doi:10.1016/j.sbspro.2015.11.424
Lember, V., Kalvet, T., and Kattel, R. (2011). Urban Competitiveness and Public Procurement for Innovation. Urban Studies 48 (7), 1373–1395.
Lever, W. F., and Turok, I. (1999). Competitive Cities: Introduction to the Review. Urban Studies 36 (5–6), 791–793.
Liu, R., Wang, J., and Huang, Z. (2017). Transportation Infrastructure, Spatial Spillover Effect and Efficiency of the Logistics Industry—The Empirical Research Based on Five Provinces in Northwest China Of”the Silk Road Economic Belt”[J]. Jounal Industrial Technol. Econ. 36 (6), 21–27.
Luh, Y. H., Jiang, W. J., and Huang, S. C. (2016). Trade-related Spillovers and Industrial Competitiveness: Exploring the Linkages for OECD Countries. Econ. Model. 54 (6), 309–325. doi:10.1016/j.econmod.2016.01.002
Martin, R., and Simmie, J. (2008). Path Dependence and Local Innovation Systems in City-Regions. Innovation 10 (2–3), 183–196.
Matos, J., Cardoso, C., Bandarra, N. M., and Afonso, C. (2017). Microalgae as Healthy Ingredients for Functional Food: A Review. Food & Function 8 (8), 2672–2685.
Mullen, C., and Marsden, G. (2015). Transport, Economic Competitiveness and Competition: A City Perspective. J. Transp. Geogr. 49 (12), 1–8. doi:10.1016/j.jtrangeo.2015.09.009
Ni, P. (2001). Theoretical Research and Empirical Analysis of Urban Competitiveness in China[J]. City, 21–24.
Peng, F., Zhou, D. L., Long, M., and Sun, X. M. (2017). Discrimination of Natural Images and Computer Generated Graphics Based on Multi-Fractal and Regression Analysis. AEU-International Journal of Electronics and Communications 71, 72–81.
Porter, M. E. (1998). Clusters and the New Economics of Competition. Boston: Harvard Business Review 76, 77–90.
Rodríguez-Pose, A., and Crescenzi, R. (2008). Research and Development, Spillovers, Innovation Systems, and the Genesis of Regional Growth in Europe. Reg. Stud. 42 (1), 51–67. doi:10.1080/00343400701654186
Rowthorn, R. (1999). Unemployment, Wage Bargaining and Capital-Labour Substitution. Cambridge Journal of Economics 23 (4), 413–425.
Shao, C., and Su, D. (2017). The Spatial Spillover Effect of Global Value Chain on Productivity[J]. China Ind. Econ., 94–114.
Song, M., and Xie, Q. (2021). Evaluation of Urban Competitiveness of the Huaihe River Eco-Economic Belt Based on Dynamic Factor Analysis. Comput. Econ. 58 (3), 615–639. doi:10.1007/s10614-019-09952-5
Ştefan, D. C. (2014). Travel &Tourism Competitiveness: A Study of World's Top Economic Competitive Countries. Procedia Econ. Finance 15 (5), 1273–1280. doi:10.1016/s2212-5671(14)00588-7
Su, Y., Li, Z., and Yang, C. (2021). Spatial Interaction Spillover Effects between Digital Financial Technology and Urban Ecological Efficiency in China: An Empirical Study Based on Spatial Simultaneous Equations. Ijerph 18 (16), 8535. doi:10.3390/ijerph18168535
Sycheva, E., Budagov, A., and Novikov, A. (2020). “Urban Infrastructure Development in a Global Knowledge-Based Economy” in SHS Web of Conferences (EDP Sciences) 74, 03013.
Wang, W. (2013). Regulation, Spatial Spillover and Regional Industrial Competitiveness[J]. China Popul. Resour. Environ. 23 (8), 123–130.
Wang, Y., and Ni, P. (2016). Economic Growth Spillover and Spatial Optimization of High-Speed Railway[J]. China Ind. Econ., 21–36.
Wenqing, P. (2013). Regional Correlation and Spatial Spillovers in China's Regional Economic Growth. Soc. Sci. China 34 (3), 125–139. doi:10.1080/02529203.2013.820566
Keywords: urban competitiveness, spatial spillover, spillover bandwidth, SDM, Asia
Citation: Liu C, Peng MY-P and Gong W (2022) Spatial Spillover Effects Promote the Overall Improvement of Urban Competitiveness: Evidence of SDM in Asian Cities. Front. Environ. Sci. 10:779596. doi: 10.3389/fenvs.2022.779596
Received: 19 September 2021; Accepted: 14 March 2022;
Published: 08 September 2022.
Edited by:
Qaiser Abbas, Ghazi University, PakistanReviewed by:
Gordon Brady, Florida Southern College, United StatesEhsan Rasoulinezhad, University of Tehran, Iran
Copyright © 2022 Liu, Peng and Gong. This is an open-access article distributed under the terms of the Creative Commons Attribution License (CC BY). The use, distribution or reproduction in other forums is permitted, provided the original author(s) and the copyright owner(s) are credited and that the original publication in this journal is cited, in accordance with accepted academic practice. No use, distribution or reproduction is permitted which does not comply with these terms.
*Correspondence: Weijin Gong, Z3dlaWppbkBzaW5hLmNvbQ==