 Erica Pascale
 Elena Franchitti
 Elisa Anedda
 Sara Bonetta
 Deborah Traversi
- Department of Public Health and Pediatrics, University of Torino, Torino, Italy
Rapid population growth and urbanization have led to increased waste generation rates. Avoiding, reducing and reusing waste is imperative in the international approach to avoid impacting disposals. Composting plants are crucial for better organic waste management, although one of their environmental impacts is bioaerosol production, which can lead to adverse health effects. This work analyzed bioaerosol contamination in composting plants through multiple analytic methods, including culture-based techniques and qPCR, subfractionated PM10, and PM4.5 sampling. The aim was to identify indicators useful for assessing the human health risk associated with bioaerosol exposure during organic waste treatment. Two composting plants and four different areas (reception/selection, methanization, composting and refinement) were selected for sampling. The analysis revealed high contamination levels and large microbial heterogeneity both for PM (until to 3 times above the guideline value) and bioaerosol samples (until to 3 magnitude orders above the proposed reference value). Bacillus spp., Saccharopolyspora, and Thermomyces always showed detectable but highly variable concentrations (ranging from 2.12 to 4.86, from 3.65 to 7.30 and from 3.45 to 6.94 Log gene copies/m3 respectively). They correlated positively and significantly with other measured microbial parameters, suggesting their potential use as indicators of biological contamination in composting plants. Moreover, the integration of culture indipendent methods can increase the monitoring sensitivity and improve the bioaerosol risk assessment. The reduction of bioaerosol exposure levels in composting plants remains a primary goal but it requires in-depth characterization of the complex bioaerosol composition, its airborne dispersion, and its association with specific adverse health outcomes.
Introduction
Waste management is one of the crucial points in international development policies, and nations should adopt and implement optimization programs (European Parliament and Council, 2018). The first issue is waste collection and management with methods appropriate to its composition; in this context, the separation and biologic treatment of the organic fraction of municipal solid waste (OFMSW) (approximately 30–40% of municipal solid waste) is crucial (Fernández-González et al., 2020). Composting plants supply an organic waste treatment opportunity, and they allow for a considerable reduction in the amount of urban waste disposed of in incinerators and landfills. Such plants can contribute to reaching the EU directive in the future in terms of the reduction of municipal waste landfilled (by 2035 to 10% or less of the total amount of municipal waste generated by weight) (European Parliament and Council, 2018). In Italy, more than 340 plants are currently actively treating the organic fraction of waste by composting and/or anaerobic digestion. They manage 23% of the annual average of 455 kg of OFMSW produced per capita, more than 6.3 × 10⁶ tons per year (Anedda and Traversi, 2020; Istituto Nazionale per la Protezione e la Ricerca Ambientale, 2020).
Microbial Aspects of the Composting Process
During composting, organic waste is treated through biological degradation under aerobic conditions provided by an extremely complex and dynamic microbiota, resulting in the hygienization and stabilization of organic matter (Ferguson et al., 2021; Pan et al., 2021). In particular, thermophilic bacteria play a key role in such biological processes, resulting in a useful fertilizer if compatible with EU fertilizing product regulations (Official Journal of the European Union, 2019). Examples of mesophilic microorganisms involved are mainly bacterial families such as Pseudomonaceae, Enterobacteriaceae, and Streptomycetaceae, while thermophilic microorganisms include bacteria belonging to the Thermoactinomycetacea family. Finally, during maturation, there is no degradation or an actual increase in the fungal concentration.
Anaerobic treatment is generally an additional preliminary step during the composting process; it is catalyzed by anaerobic and microaerophilic microorganisms that promote the degradation of organic biomass, leading to biogas production. Its application has two main advantages: a reduction of the treatment volume during the composting phase and the production of a valuable energetic vector. Anaerobic digestion of OFMSW generally occurs under a thermophilic process, appropriate for hygienization necessities. Hydrolytic, acidogenic, acetogenic, and methanogenic microorganisms catalyze this process (Carballa et al., 2015).
Potential Health Impacts of Bioaerosol Emissions From Composting Plants
Although composting is an eco-friendly process that is beneficial for the environment and public health, it is not free of risks, including biological risks, which must be properly assessed and managed.
One of the downsides of composting is air pollution, known as odorous molecule production and bioaerosol release. Such pollution is primarily generated during processes that involve the vigorous movement of materials, such as shredding, compost pile turning, or compost screening. Odorous molecule production, such as volatile organic compounds (VOCs), including sulfur compounds, is the most perceived impact by the population, but it is not the most harmful for human health (Schlegelmilc et al., 2005).
Produced particles include particulates attributable to vehicle movement but also particles with a biological nature due to biomass treatment (bioaerosol) (Wery, 2014; Robertson et al., 2019). It can contain pathogenic or nonpathogenic and dead or alive microorganisms, including Bacteria and Archaea, fungal spores and fragments, pollen, viruses, algae and cyanobacteria, biological crusts and lichens, and others (such as plant or animal fragments and detritus).
By virtue of their small size and lightweight, bioaerosols easily drift from one place to another (Ferguson et al., 2021). Consequently, bioaerosols may cause health hazards in occupational environments and nearby residential communities could be subjected to risk exposure (Kim et al., 2018; Robertson et al., 2019). Human effects, with a public health impact, include a wide range of acute and chronic adverse diseases, in many occupational and residential environments (Schlosser et al., 2009; Robertson et al., 2019). Depending on the particle size and the components of nonbiological origin, bioaerosols may penetrate deep into the lungs. Exposure may be mainly from inhalation but can also occur through ingestion, dermal and ocular contact (Kim et al., 2018). Additionally, workers may be exposed to organic matter through mucous membranes, cuts, and abrasions (Farling et al., 2019).
Bioaerosols emitted by composting plants contain mainly Actinobacteria, Thermoactinomyces sp., and Bacillus sp.; at the genus level, there are Thermobifida, Saccharomonospora, and Saccharopolyspora (Le Goff et al., 2012). Among the fungi and fungal spores, Aspergillus fumigatus is particularly relevant in composting plants. It is a thermotolerant species and can cause severe aspergillosis; moreover, Thermomyces lanuginosus and Penicillium are also generally present (Le Goff et al., 2010).
Moreover, bioaerosols include viral components. They are not well-described in the literature, and only metagenome projects—including valid sampling and extraction protocols—can define the aerodispersed virome in depth (Prussin et al., 2018) and whether they are components of bioaerosols from composting plants. However, knowledge of the environmental viral component becomes crucial under “one health” perspectives (Liang and Bushman, 2021).
Infectious diseases, such as aspergillosis, Legionnaires’ disease (LD) and Pontiac fever (Wery, 2014), is possible via bioaerosol exposure in composting plants (Douwes et al., 2003; Wery, 2014). An increased risk of hepatitis A, B, or C has been observed in waste collectors (Douwes et al., 2003), and generally, some vaccinations, including antitetanus, anti-HBV, and anti-HAV vaccines, should be recommended to organic waste treatment plant workers. For such workers, nonspecific symptoms such as gastrointestinal (GI) disturbance, fatigue, weakness, and headache have also been described (Robertson et al., 2019).
The most frequent potential health effects of bioaerosols from composting facilities are respiratory system problems (such as rhinitis, asthma, bronchitis and sinusitis, and lung function impairment) as well as chronic obstructive pulmonary disease (COPD), organic dust toxic syndrome (ODTS), and hypersensitivity pneumonitis (HP). Recently, an HP case was found in a 52-year-old man that was attributed to routine exposure to bioaerosols in a composting plant (Lal et al., 2018). Furthermore, exposure to bioaerosols has been associated with an accelerated decline in forced vital capacity (FVC), possibly due to high concentrations of thermotolerant Actinomyces and filamentous fungi at composting plants (Bünger et al., 2007). Several modes of action have been proposed to explain the association between occupational exposure to bioaerosols and health, such as airway inflammation and oxidative stress promotion (Timm et al., 2009; Samake et al., 2017). Exposure to bioaerosols has also been associated with the risk of developing some specific cancers, such as lung cancer, liver cancer, pancreatic cancer, and brain cancer (Schlosser et al., 2009).
Endotoxin is a structural component of Gram-negative bacteria released through cell damage, including lipopolysaccharides (LPS) or lipooligosaccharides (LOS). Airborne endotoxin constitutes an important biological pollution parameter, and for example, the German BAuA proposed an updated national guideline for bioaerosol exposure control, suggesting such a biological indicator be included in the risk assessment for composting plants (Robertson et al., 2019).
Methods of Bioaerosol Characterization
Many bioaerosol sampling techniques are available, each presenting both advantages and disadvantages (Franchitti et al., 2020). For microbiological analysis, traditional culture-based methods, which employ selective liquid or solid culture media to grow target microorganisms, are mostly standardized methods to analyze bioaerosol samples (for instance, ISO methods). Nevertheless, these conventional techniques have some relevant limitations. They are laborious and time-consuming, and some microorganisms that are not cultivable under specific growth conditions could remain undetected (Pan et al., 2021). Moreover, the stress caused by aerosolization and the sampling methods could also reduce the cultivability of such microorganisms. To remedy such limitations, culture-independent techniques have been introduced. A combination of different methods could provide a better understanding of microbial composition, survival, dispersal of airborne microorganisms, and the biological effects of bioaerosols on human health. On the other hand, a simple and inexpensive evaluation for human risk assessment is still unavailable.
Aim
This work aimed to obtain data on bioaerosol contamination in different composting plants through multiple analytic methods, including new and innovative methods, and to identify indicators useful for assessing the occupational risk associated with bioaerosol exposure during the organic waste treatment process.
Materials and Methods
Composting Plants and Sampling
Two composting facilities among the main composting plants in Italy were chosen to carry out the sampling. An Italian composting plant overview preceded the selection (Anedda and Traversi, 2020). The included plants were technologically different but quite advanced. Therefore, they allow a broad representation of the residual risk still present despite optimal or suboptimal planning and management. The two included plants treated the same organic material (green waste, animal waste, and OFMSW): Plant A by aerobic treatment in biocells and Plant B by first anaerobic digestion and then aerobic treatment in composting trenches.
Environmental monitoring was carried out in the following areas during September and October 2019 in 8 sampling sessions: Plant A (reception/selection area, composting area, refinement area) and Plant B (selection area, methanization area, composting area, refinement area) (Figure 1). The sampling was performed during such a limited period for different reasons: 1) to limit the seasonal variation considering that many differences can be observed among the processes and the areas included; 2) the meteorological and climate conditions are still favorable for bioaerosol generation; and 3) the period is optimal for plant availability; it is important to take into account voluntary participation in the research project.
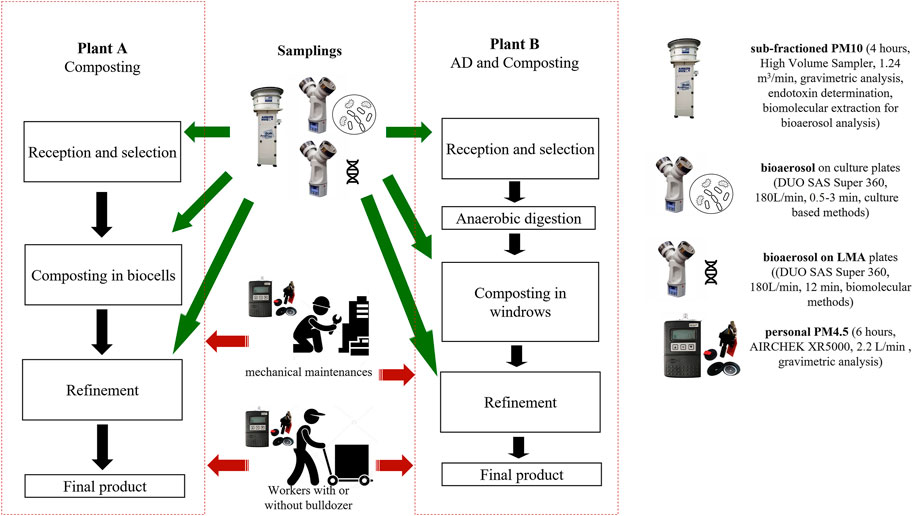
FIGURE 1. Scheme of the composting plants and samplings. On the right, the legend of the images is included for the identification of each sampling. The personal sampling involved two kinds of personnel: workers and mechanical maintenance. Their activities are not attributable to a specific plant area.
Sampling included subfractioned PM10, breathable personal PM4.5, bioaerosols on culture plates for microbiological culture-based analysis (Traversi et al., 2018), bioaerosols both on plates (with low melting agar, LMA) (Ziros et al., 2011), and PM filters for biomolecular analysis (Figure 1). The sampling duration is variable in relation to the involved sampling methods and in terms of the expected level of contamination. However, the sampling was performed during working hours, in the morning and/or in the afternoon.
PM and Endotoxin Determination
The PM10 sampler involved is a High Volume Sampler, AIRFLOW PM10 Analitica Strumenti, provided with a flow rate of 1.24 m3/min according to UNI-EN 12341 and Italian DM 60/2002. Sampled PM10 was divided during sampling into 6 subfractions: 10–7.2 µm, 7.2–3.0 µm, 3.0–1.5 µm, 1.5–0.95 µm, 0.95–0.49 µm and <0.49 µm. Every sampling of the environmental PM lasted at least 4 h. Two types of fiberglass filters were used: type A/E fissured filters (8″x10″, Gelman Sciences, MI, United States, named “A”) for the 10–0.49 fractions and A4 filters (203 × 254 mm, Pall Corporation, NY, United States, named “B”) for the finest fraction.
Alongside environmental sampling, personal monitoring was also performed. Fifteen persons (10 workers and five mechanical maintenance workers, chosen according to their shifts and tasks) were equipped with an AIRCHEK XR5000 portable sampler (5–5,000 ml/min, SKC United States) and a cyclone selector for PM4.5 with a fiberglass filter (25 mm diameter, Nupore Filtration Systems Pvt. Ltd., India). Personal sampling, with a settled flow rate of 2.2 L/min for at least 6 h (shift duration), allowed for the measurement of PM4.5 concentrations. All filters underwent a presampling and postsampling conditioning procedure to reduce the moisture interference with the filter weight by placing them in a dryer with silica gel for 48 h (Traversi et al., 2018).
All filters (10–7.2, 7.2–3.0, 3.0–1.5, 1.5–0.95, 0.95–0.49 µm subfractions, the <0.49 µm fraction and the personal filters) were weighed in triplicate before and after sampling by an analytical balance Sartorius. The PM10 concentration was calculated as the sum of the subfractions divided by m3 of sampled air.
Endotoxin Analysis
The method used for endotoxin extraction and determination was as reported in a previous study (Traversi et al., 2011). Briefly, a portion of each PM filter was extracted with RPMI 1640 and 0.025% Tween 20 in an ultrasonic water bath. The extract was centrifuged, and the supernatant was used for endotoxin determination using the endpoint chromogenic Limulus amebocyte lysate (LAL) method (QLC-1000 n 50–648U, Cambrex, Walkersville, MD, United States) at 37°C following the manufacturer’s instructions. The results are expressed as EU/mg of PM and EU per cubic meter of air collected. The detection limit is 0.01 EU/mL. The endotoxin concentration is expressed for each of the 6 PM subfractions.
Culture-based Analysis and LMA Plate Sampling
Bioaerosol sampling was realized using a DUO SAS Super 360 (International PBI). The included parameters in this study are displayed in Supplementary S1. In all of the culture media, except for fungi, cycloheximide 0.2 g/L was added to avoid fungal contamination. For each parameter, appropriate contact plates (55 mm RodacTM Contact Plates, VWR, United States) were prepared. The instrument was set on support approximately 1.5 m from the ground, to mimic the normal position of the worker’s head. The sampled volumes ranged between 0.05–2 m3. For each sampling point, at least four doses with technical triplicates were performed. The duration of the sampling varied in relation to the sampled volume, and the flow rate was constant (180 L/min). After sampling, the plates were placed in dedicated sterile bags and transported to the laboratory at a temperature <10°C. The plates were incubated at the appropriate temperature and then observed to count the CFU. The results were expressed after applying a correction factor, which takes into account the statistical probability that more than one particle can cross the same slit of the impactor. The probable count is expressed as Log(CFU) for m3 of sampled air.
DNA Extraction
Nucleic acid extraction was performed from filters collected from PM10 environmental sampling and sampled plates containing low melting agar (LMA, Ultra PureTM LMP Agarose 16520–050 Invitrogen, United States). The filter-sampling method favors mixture concentration; however, the high flow rate and the forced air impact on the filter may damage microorganisms and the organic matrix. All filters were stored at −80°C after sampling. LMA contained in the plates was defrosted and transferred to 50 ml centrifuge tubes for melting (microwave at 500 W for 30 s) and then the extraction was performed. The protocol provides for nucleic acid extraction through the kits Power-Viral Environmental RNA/DNA and Power Soil (Qiagen, United States) for both PM and LMA samples.
A total of 1/16 of the filter, approximately corresponding to a sampling of 14 m3 of air, was used for the extraction. The sampling does not mimic the real inhalation flow of the workers, but it allows for concentrating the sample, obtaining an eluate that is fairly similar to a worker’s daily air intake, while the LMA extract corresponds to 0.2 m3 of sampled air.
Finally, three DNA extracts were obtained for each sampling point: (a) DNA from filters on which PM < 0.49 µm was collected; (b) DNA from a pool of filters for the other subfractions (10–7.2, 7.2–3.0, 3.0–1.5, 1.5–0.95, and 0.95–0.49 µm); and (c) DNA from LMA.
The extracted dsDNA was then quantified with a Tecan Infinite® 200 PRO spectrophotometer and i-control software (1.10 version) through a 260 nm spectrophotometric reading using a Nano Quant Plate (Tecan Trading AG, Switzerland). The quality of the extracted nucleic acids was evaluated by gel electrophoresis.
Biomolecular Analysis
Several indicators of biological contamination were evaluated starting from both filters (PM < 0.49 µm and other pooled fractions) and LMA plates. Quantitative real-time PCR (qRT-PCR) assays were then performed with a CFX Touch Real-Time PCR Detection System (Bio–Rad-Hercules, CA, United States) and CFX Manager (3.1 Software) to quantify the following targets: Bacteroidetes, Firmicutes, Gammaproteobacteria, Clostridia, Bacillus spp., Legionella pneumophila, Saccharopolyspora, total fungi, Aspergillus spp., Aspergillus fumigatus, Thermomyces spp. and Adenovirus 4. Supplementary S2 shows the included genomic DNA and primers for each target (De Souza et al., 2003; Sugita et al., 2004; Guo et al., 2008; Dridi et al., 2009; Bacchetti De Gregoris et al., 2011; Ziros et al., 2011; Le Goff et al., 2012; Carducci et al., 2013; Madsen et al., 2015; Bibbò et al., 2017). Standard curves were obtained through five or six serial dilutions of the certified genomic DNA. The thermal protocol proposed in the reference was applied for each target using Sso Advanced SYBR Green Supermix (172–5,261, Bio-Rad) or IQ Multiplex PowerMix (Bio-Rad-Hercules, CA) and iQ-Check Quanti L. pneumophila kit (357–8,103, Bio-Rad). Starting from 2 µL of the extracted DNA, the following microbial targets were quantified by qRT-PCR. The primer efficiency ranged between 90 and 110%, as required for qPCR quality control.
Statistical Analysis
Statistical processing of the collected data was conducted using the SPSS Package, ver. 27.0 (IBM Corp., United States). We applied (I) a log 10 transformation to the non-normally distributed data, (II) Spearman’s correlation to assess relationships between variables, N− 2 degrees of freedom, (III) Mann–Whitney U nonparametric tests for independent samples to compare means and (IV) Kruskal- Wallis H test for multivariate analysis. Methanization data are included in selection data, resulting in three different comparable sets of data for areas, The mean differences and correlations were considered significant for p < 0.05 and highly significant for p < 0.01.
The Global Index of Microbial Contamination (GIMC), proposed by Dacarro et al. (Dacarro et al., 2000) for an assessment of environmental microbial contamination levels, was also calculated in all sampled areas for both the culture-based method (as Log CFU/m3) and the biomolecular method (assuming Log gene-copies/m3 has a similar meaning to Log CFU/m3, even if it does not have the same biological significance).
Results and Discussion
PM Results
The descriptive statistical analysis of the PM concentrations (6 subfractions, PM3, PM4.5, and PM10) is displayed in Table 1. The aggregated results exclude refinement without the treatment phase, which was considered separately in this analysis. It is characterized by extremely high levels of dust, clearly distinguishable from any other sampling. Such high levels are explainable because, during this phase, weekly routine cleaning of machinery occurs using air lances that remove the dust collected in the machinery and on the ground. These circumstances differ markedly from the usual exposure conditions. For this reason, such sampling was considered separately in the particulate matter evaluation.
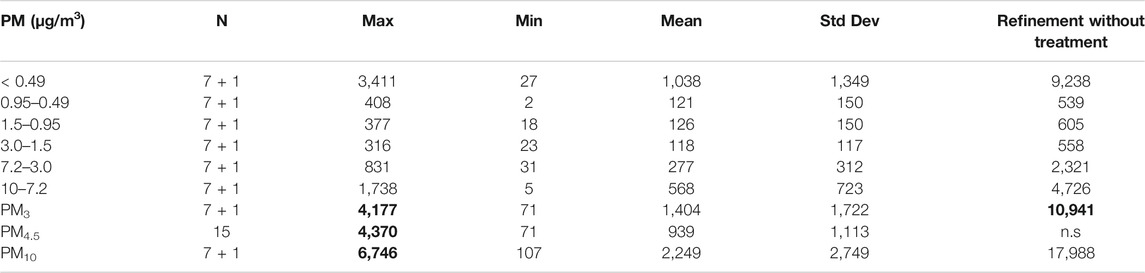
TABLE 1. Descriptive analysis of PM sampling results. Bold means values >3 mg/m3 (according to the levels proposed by ACGIH for the respirable fraction). n.s. = not sampled. 7 aggregated results +1 outliner in the refinement without treatment (see Section 3.3).
An evident and statistically significant difference (several orders of magnitude) between the PM levels of Plant A and Plant B was observed (for PM10 Mann–Whitney test, statistic 5.333, degrees of freedom 1, p < 0.05) (Figure 2A). Although a greater level of airborne particles was noticed in some sampling areas in both plants, no statistically significant difference was observed (for PM10 Kruskal–Wallis test, statistic 3.361, degrees of freedom 2, p > 0.05). This is probably due to the marked variation observed in both plants and the limited number of samplings (Figure 3A).
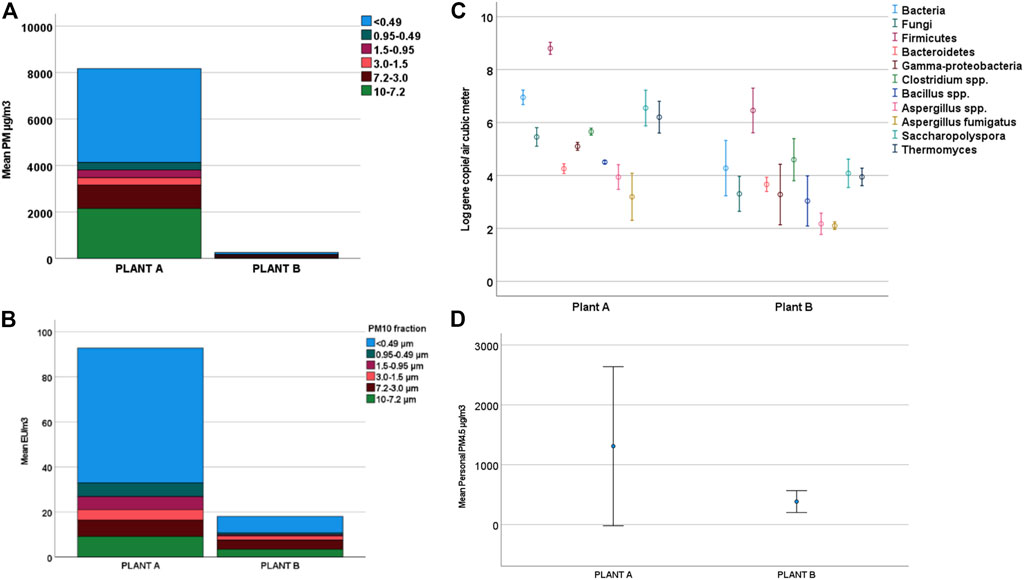
FIGURE 2. Results obtained for each involved plant. (A) Mean PM10 concentration, detailing the subfraction contribution. (B) Mean endotoxin concentration determined in PM10, detailing the subfraction contribution. (C) Microbial target Log(gene copies/m3), (D) personal PM4.5 levels.
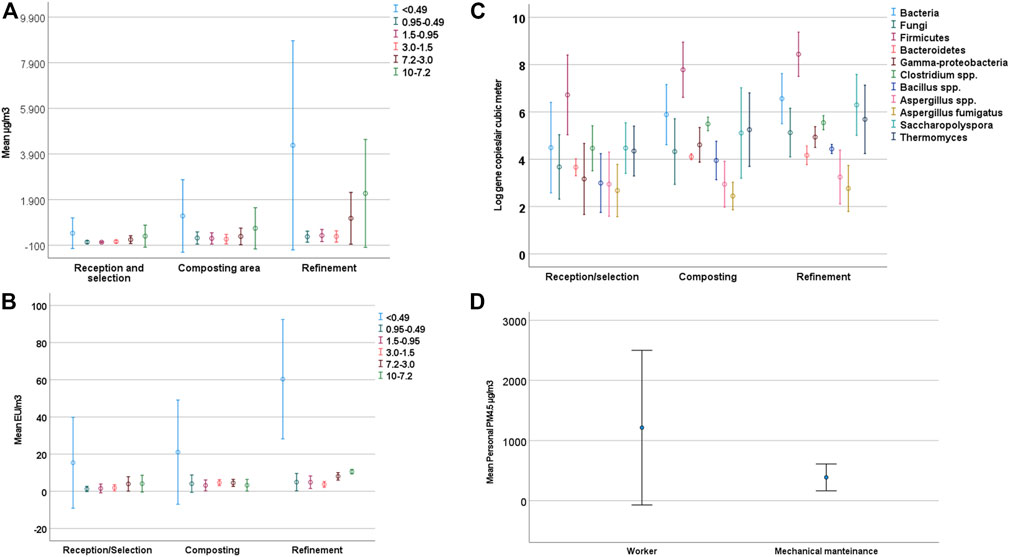
FIGURE 3. Results obtained for each sampling area. (A) Mean PM10 concentration, detailing the subfraction contribution. (B) Mean endotoxin concentration determined in PM10, detailing the subfraction contribution. (C) Microbial target Log(gene copies/m3). (D) Personal PM4.5 for workers and mechanical maintenance.
The levels of environmental PM, both breathable (PM3) and inhalable (PM10), were strictly and significantly correlated with the microbial targets evaluated through biomolecular methods. The same does not apply to culture-based methods since the main parameters exceeded the limit of quantification (LOQ). Spearman’s correlation coefficients between PM10 and the microbial targets were >0.950 (p < 0.01), except for Aspergillus spp. (Spearman’s correlation coefficient 0.738 and p > 0.05). These results indicate a need for a more frequent, rapid, and indirect evaluation of bioaerosol contamination levels through airborne PM measurements during operational control. Such an approach has also been previously proposed, which identified inhalable dust as a marker of exposure to airborne biological agents in composting facilities and stated that measurement of dust could efficiently assist decision-making about preventive measures against endotoxins and bacteria in composting plants (Schlosser et al., 2018).
In addition, personal PM sampling demonstrated a greater risk of exposure in Plant A (Figure 2D). Here, too, the difference proved to be statistically significant (Mann–Whitney test, standardized statistic—2.121, p = 0.036). Through personal PM sampling analysis, it was observed that workers that divide their work time between operating vehicles and performing duties on the ground seem more likely to be exposed (Kruskal–Wallis, test statistic −1.837, p = 0.075) (Figure 3D). Their more frequent presence in the most contaminated areas of the plants, namely, the treatment areas, could explain their greater exposure level.
The results aggregated by the mainly frequented areas do not show statistically significant differences. Finally, three workers were declared to be smokers and they displayed slightly higher breathable PM levels, albeit a statistically significant difference was not found compared to nonsmokers’ breathable PM levels. This outcome is unexpected because generally, a pronounced difference between smokers and nonsmokers can be detected; however, the 3 workers did not smoke during the sampling times.
Endotoxin Results
The endotoxin level included in the PM10 fraction ranged between 51 and 128 EU/m3. This overlapped with the last limit value published in Germany (2018), which is equal to 100 EU/m3 (ASGM-TRBA 400). Figure 2B shows the mean contribution of each PM10 subfraction. The highest level of contaminant was observed in the finest fraction from the sampled PM. Higher concentrations were observed in Plant A than in Plant B (5:1). The endotoxin level was particularly high in the refinement area during machinery cleaning operations (Figure 3B).
Culture-based Analysis Results
A descriptive analysis of the results obtained from the bioaerosol environmental monitoring conducted with culture-based methods is shown in Table 2. Culture-based analysis for 22°C, 37°C, and 55°C counts and Bacillus spp. showed values higher than the LOQ of the method, except for the methanization area for 22°C total bacteria count. In the majority of the sampling areas, microbial growth is confluent, preventing a real count of the overlapping CFU. The GIMC ranged between 15,450 CFU/m3 in the methanization area, and a value >65,350 was observed in the reception area and composting area (both plants). The overall contamination was high and widespread in all sampling areas. Significant differences were detected for (a) fungi, higher in the selection, tunnel, and composting area; (b) Pseudomonadaceae, in the selection area; (c) Clostridia and Gram-negative bacteria, in the reception area. There was a statistically significant correlation between Clostridia and Actinomycetes (Spearman’s rho = 0.842; p = 0.009). They were both more concentrated in Plant A, without an anaerobic step than in Plant B.
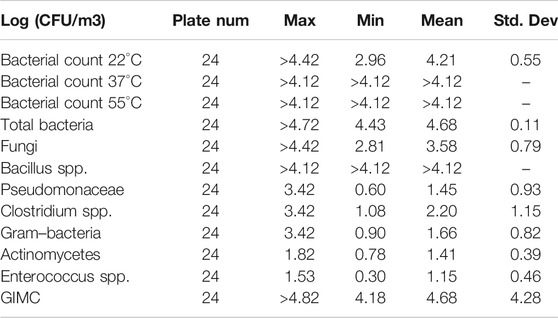
TABLE 2. Descriptive analysis of contamination levels evaluated at all the sites with culture-based methods. Bold means GIMC >4 Log(CFU/m3) as a level of concern.
Biomolecular Analysis Results
The extracted DNA ranged between 0.85 and 42.78 ng/μL with an average of 8.01 ng/μL. The extraction from LMA displayed very low DNA concentrations, in some cases even under the LOQ of the instrument, and significantly lower than the one extracted from PM < 0.49 and 0.49 < PM < 10 µm (Kruskal–Wallis, test statistic 14.393, degrees of freedom 2, p = 0.001). The A260/A280 ratios varied from 0.5 (filter pool) to 1.1 (<0.49 filter), while the A260/A230 ratios ranged from 0.2 (filter pool) to 0.4 (<0.49 filter).
The descriptive statistical biomolecular analysis is shown in Table 3, divided concerning the typology of the starting extract. Each target concentration was obtained starting from the different extracts (PM < 0.49, 0.49 < PM < 10 or LMA) was strongly correlated (Spearman’s correlation coefficient ranged from 0.778 for Firmicutes to 0.998 for total bacteria). For all microbial targets except for Aspergillus spp., Aspergillus fumigatus, and Thermomyces, the highest concentrations were observed from filters, indicating that this is probably the most effective sampling method (for total bacteria, for example, Kruskal–Wallis, test statistic 11.020, degrees of freedom 2, p = 0.04).
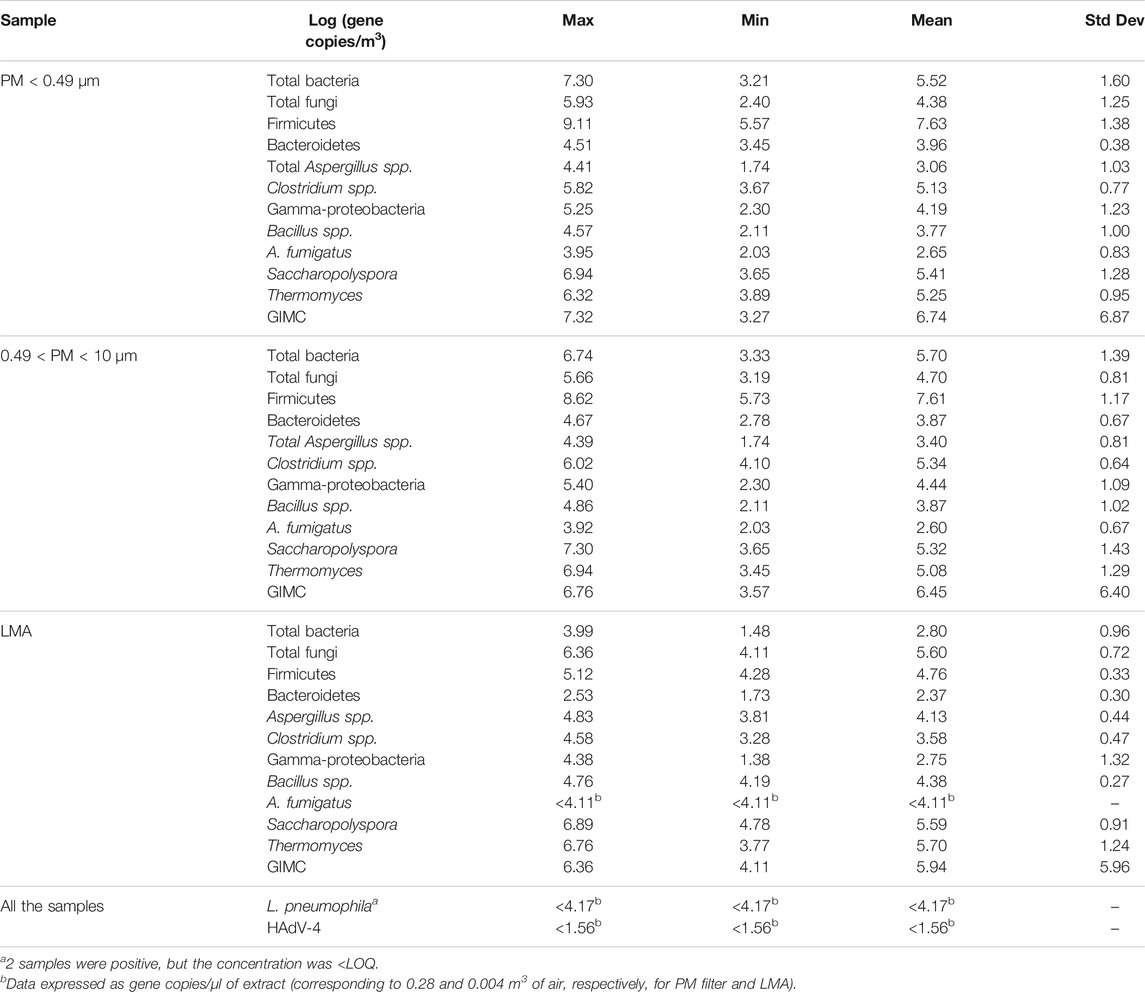
TABLE 3. Descriptive analysis of biomolecular results for each type of sample, including all of the sites and plants. Gray means GIMC >4 Log(gene copies/m3) as a level of concern, considering the same threshold limit proposed in the literature as CFU. The last lines report the parameters for all of the samples < at the LOQ.
The larger size of fungal cells, which can be found in coarse particulate matter (PM > 10 µm), could explain the different efficiency of the extraction methods. Only the LMA method includes coarse particles since the SAS sampler does not provide for a preselection according to particle size.
No statistically significant differences among the three sampling methods were found for thermophilic species, such as Saccharopolyspora and Themomyces. Such microorganisms are detectable and abundant (6-7 Log gene copies/m3) in the different starting samples.
Contamination levels derived from bioaerosols are significant, although GIMC, evaluated through biomolecular methods, is not usually calculated and could be overestimated both because nonviable cells are included and because the same cell could be considered more than once when there is more than one copy of the same gene in the bacterial genome.
Two of the analyzed extracts, specifically the PM0.49 samples in the receiving and handling areas in front of the biocells in Plant A and PM0.49-10 in the refinement area in Plant B, were positive but not quantifiable (<LOQ) for Legionella pneumophila. Legionella spp. are ubiquitous in natural and artificial water environments worldwide. The main Legionella reservoirs are ground-waters, seawater, lakes, and rivers; however, they have also been isolated from potting soils and compost. The Legionella pneumophila growth-limiting temperature is approximately 50°C, and it is destroyed almost instantly at temperatures above 70°C. Consequently, it is not possible to exclude its presence in composting material during treatment phases in composting plants (Casati et al., 2010). However, its presence is influenced by water quality and biofilm formation, which favors the growth and persistence of Legionella (Principe et al., 2017).
HAdV-4 was always detected under the LOQ of the methods in all of the collected samples. Few studies have reported detectable levels of such microorganisms in air samples; when sampling involves waste treatment plants, Adenovirus sample positivity is observed during the winter season (Carducci et al., 2013).
Statistically significant differences were also detected through biomolecular methods between the two plants (Figure 2C) and among the different areas (Figure 3C). In particular, Plant A displayed higher bioaerosol levels for all microbial targets (for total bacterial Mann–Whitney, statistic 5.333, degrees of freedom 1, test p = 0.021). For Bacteroidetes and Clostridium spp. such difference is less marked.
Notably, as expected, fungi correlated with Aspergillus spp. and Aspergillus fumigatus (Spearman’s rho >0.702, p < 0.01), and bacteria correlated with the main detected phyla.
Bacillus subtilis correlated with total bacteria, fungi, Gammaproteobacteria, and Aspergillus fumigatus. This last is a pathogenic thermophilic filamentous fungus, one of the most commonly enumerated airborne microorganism species. It has been frequently included in bioaerosol modeling and has also been selected as an indicator of bioaerosol exposure. Indeed, it is often found in elevated concentrations during specific activities in composting facilities, in which it is widely monitored (Douglas et al., 2017; Williams et al., 2019).
The potential of biomolecular methods lies in their greater sensitivity and wider limits of quantification (LOQs) than culture-based methods. On the other hand, biomolecular techniques are not able to discern between genetic material belonging to potentially viable microorganisms or nonviable microorganisms. This limitation could be overcome using some technical features, such as propidium monoazide and ethidium monoazide, but their efficiency in inhibiting the amplification of nucleic acids from nonviable microorganisms has been discussed, but few data are present in the literature about bioaerosols (Chang et al., 2017).
The included method in this study is a targeted approach and thus may underestimate diversity with respect to other biomolecular methods currently available, such as next-generation sequencing techniques, especially with a meta-genome approach; however, such techniques are still expensive, and the sequence data repository is not complete for environmental microorganisms.
Significant correlations between culture-based and biomolecular methods were also observed (for example, culture-based Clostridium and Actinomycetes vs. biomolecular total bacteria and Firmicutes, Spearman’s rho >0.8; p < 0.01). Even though culture-based techniques underestimate contamination levels compared to biomolecular methods, contamination levels tend to overestimate them. Hence, the real and potentially harmful contamination levels can probably be placed between culture-based and biomolecular results, being higher than predicted by culture-based methods and lower than displayed by biomolecular ones. For this reason, to date, the assessment of bioaerosol contamination levels should include both methods to guarantee the most accurate estimate.
Currently, there are neither quantitative dose-response estimates nor occupational exposure limits (OELs) for bioaerosols admitted at the international level to regulate bioaerosol emissions from composting facilities (Schlosser et al., 2018). Nonetheless, the United Kingdom, Germany, France, and several other countries have developed regulatory guidelines to evaluate risk and control exposures to workers and nearby residents. In England, according to the Environment Agency, acceptable levels of bioaerosols for composting facilities with “sensitive receptors” were defined (UK Environment Agency, 2018). Such regulation includes mainly endotoxin, fungi, and total bacteria counts, without the identification of microbial parameters for composting plants. Such analysis revealed bioaerosol concentrations greater than the occupational exposure limits (OELs) proposed by some European interpretations. The lowest observed effect level (LOEL) of 100,000 spores/m3 for nonpathogenic and non-mycotoxin-producing fungal species has been recommended in a criteria document based on inflammatory respiratory effects (Eduard et al., 2012). In Germany, a regulatory occupational limit of 50,000 CFU/m3 of mesophilic fungi is set for breathable air in the workplace, according to BAUA (Douglas et al., 2016). Such limits are not internationally approved for bioaerosol risk assessment. This is probably due to the bioaerosol complex composition (Duquenne, 2018). The parameters that seem to best describe contamination levels are (a) a 22°C total bacterial count, which can be analyzed to assess environmental contamination levels; (b) Bacillus spp. and spore-forming bacteria, which can be used as indicators of both Gram-positive bacteria and biofilm presence; (c) Enterococcus spp. and Escherichia coli, which are particularly useful to determine contamination levels when animal waste is also treated; (d) Clostridium spp., when anaerobic digestion is included; (e) fungi and yeasts, in particular, Aspergillus spp. and Aspergillus fumigatus, which have been selected as an indicator of bioaerosol exposure and have been used to model bioaerosol dispersion (Williams et al., 2019); (f) thermophilic microorganisms such as Saccharopolyspora, as a representative of Actinobacteria, and Thermomyces, as representative of fungi, are suggested.
Conclusion
In this study, the heterogeneity of bioaerosol composition was confirmed in both analyzed plants. Regarding sampling methods, biomolecular methods are more sensitive and provide much higher quantification capabilities than culture-based methods. Nevertheless, biomolecular techniques are not able to discern between genetic material belonging to a viable and infective microorganism or a nonviable microorganism, potentially leading to an overestimation. Moreover, it is important to highlight those different bioaerosol components, Not just those that are viable and/or capable of colonizing or infecting the host, can induce adverse effects on human health, such as inflammatory or allergic responses. Therefore, it has been proposed that combining both culture-based and biomolecular methods can better represent bioaerosol contamination levels.
Of course, even though the sampling time duration is used as a correction factor, the comparability between SAS and filter sampling is limited for the very different applied methods. On the other hand, quantitative evaluation comparison is necessary. This clearly showed a higher sensitivity estimation of the GIMC of the biomolecular methods [(PM < 0.49 µm) > (0.49 < PM < 10 µm) > (LMA)].
In our opinion, Bacillus spp., Saccarospolispora, and Themomyces seem to be the key indicators for such bioaerosol contamination. Of course, thermophilic microorganisms were previously discussed as potential indicators of composting bioaerosols (Le Goff et al., 2012); moreover, the proposed microorganisms were always detectable in this work (>LOQ) for every site and plant. The values detected are quite variable and are correlated with pollution by observing the other microbial parameters and PM subfractions.
Many aspects of bioaerosol exposure risk assessment remain uncertain and not fully characterized. Significant concerns about occupational health persist, and a reduction of bioaerosol exposure levels in composting plants remains a primary goal. More efforts are required both to validate new techniques for assessment and to develop novel technologically advanced protective equipment designing a consolidated scheme for characterization of the complex bioaerosol composition, its airborne dispersion, and its association with adverse health outcomes in both composting plant workers and nearby residents.
Data Availability Statement
The datasets for this study will be provided in response to reasonable request.
Author Contributions
Conceptualization, DT; methodology, DT; software, DT; validation, DT; sampling, EA, DT; extraction EA, EP; PM analysis EP, EA, NZ, microbiological analysis, EA, DT; biomolecular analysis EP, EF, and NZ; Legionella quantification SB, DT, and EA; resources, DT; data curation, DT; writing—original draft preparation, EP; writing—review and editing, DT. All authors have read and agreed to the submitted version of the manuscript.
Funding
This research was funded by the CIC (Consorzio Italiano Compostatori), grant number: TRADCTRIC_1701, and the University of Torino.
Conflict of Interest
The authors declare that the research was conducted in the absence of any commercial or financial relationships that could be construed as a potential conflict of interest.
Publisher’s Note
All claims expressed in this article are solely those of the authors and do not necessarily represent those of their affiliated organizations, or those of the publisher, the editors and the reviewers. Any product that may be evaluated in this article, or claim that may be made by its manufacturer, is not guaranteed or endorsed by the publisher.
Acknowledgments
Special acknowledgments are due to the involved plants for their participation in the project.
Supplementary Material
The Supplementary Material for this article can be found online at: https://www.frontiersin.org/articles/10.3389/fenvs.2022.777598/full#supplementary-material
References
Anedda, E., and Traversi, D. (2020). Bioaerosol in Composting Facilities: A Survey on Full-Scale Plants in Italy. Atmosphere 11, 398. doi:10.3390/atmos11040398
Bacchetti De Gregoris, T., Aldred, N., Clare, A. S., and Burgess, J. G. (2011). Improvement of Phylum- and Class-specific Primers for Real-Time PCR Quantification of Bacterial Taxa. J. Microbiol. Methods 86, 351–356. doi:10.1016/j.mimet.2011.06.010
Bibbò, S., Dore, M. P., Pes, G. M., Delitala, G., and Delitala, A. P. (2017). Is There a Role for Gut Microbiota in Type 1 Diabetes Pathogenesis. Ann. Med. 49, 11–22. doi:10.1080/07853890.2016.1222449
Bünger, J., Schappler-Scheele, B., Hilgers, R., and Hallier, E. (2007). A 5-year Follow-Up Study on Respiratory Disorders and Lung Function in Workers Exposed to Organic Dust from Composting Plants. Int. Arch. Occup. Environ. Health 80, 306–312. doi:10.1007/s00420-006-0135-2
Carballa, M., Regueiro, L., and Lema, J. M. (2015). Microbial Management of Anaerobic Digestion: Exploiting the Microbiome-Functionality Nexus. Curr. Opin. Biotechnol. 33, 103–111. doi:10.1016/j.copbio.2015.01.008
Carducci, A., Federigi, I., and Verani, M. (2013). Virus Occupational Exposure in Solid Waste Processing Facilities. Virus. Occup. Expo. Solid Waste Process. Facil. 57, 1115–1127. doi:10.1093/annhyg/met043
Casati, S., Conza, L., Bruin, J., and Gaia, V. (2010). Compost Facilities as a Reservoir of Legionella pneumophila and Other Legionella Species. Clin. Microbiol. Infect. 16, 945–947. doi:10.1111/j.1469-0691.2009.03009.x
Chang, C.-W., Hung, N.-T., and Chen, N.-T. (2017). Optimization and Application of Propidium Monoazide-Quantitative PCR Method for Viable Bacterial Bioaerosols. J. Aerosol Sci. 104, 90–99. doi:10.1016/j.jaerosci.2016.11.002
Dacarro, C., Grignani, E., Lodola, L., Grisoli, P., and Cottica, D. (2000). Proposed Microbiological Indexes for the Assessment of Air Quality in Buildings. G Ital. Med. Lav Erg 22, 229–235. Available at: http://www.ncbi.nlm.nih.gov/entrez/query.fcgi?cmd=Retrieve&db=PubMed&dopt=Citation&list_uids=11084879.
De Souza, J. T., Mazzola, M., and Raaijmakers, J. M. (2003). Conservation of the Response Regulator Gene gacA in Pseudomonas Species. Environ. Microbiol. 5, 1328–1340. doi:10.1046/j.1462-2920.2003.00438.x10.1111/j.1462-2920.2003.00438.x
Douglas, P., Bakolis, I., Fecht, D., Pearson, C., Leal Sanchez, M., Kinnersley, R., et al. (2016). Respiratory Hospital Admission Risk Near Large Composting Facilities. Int. J. Hyg. Environ. Health 219, 372–379. doi:10.1016/j.ijheh.2016.03.004
Douglas, P., Hayes, E. T., Williams, W. B., Tyrrel, S. F., Kinnersley, R. P., Walsh, K., et al. (2017). Use of Dispersion Modelling for Environmental Impact Assessment of Biological Air Pollution from Composting: Progress, Problems and Prospects. Waste Manag. 70, 22–29. doi:10.1016/j.wasman.2017.08.023
Douwes, J., Thorne, P., Pearce, N., and Heederik, D. (2003). Bioaerosol Health Effects and Exposure Assessment: Progress and Prospects. Ann. Occup. Hyg. 47, 187–200. doi:10.1093/annhyg/meg032
Dridi, B., Henry, M., El Khéchine, A., Raoult, D., Drancourt, M., El Khéchine, A., et al. (2009). High Prevalence of Methanobrevibacter Smithii and Methanosphaera Stadtmanae Detected in the Human Gut Using an Improved DNA Detection Protocol. PLoS One 4, e7063. doi:10.1371/journal.pone.0007063
Duquenne, P. (2018). On the Identification of Culturable Microorganisms for the Assessment of Biodiversity in Bioaerosols. Ann. Work Expo. Heal 62, 139–146. doi:10.1093/annweh/wxx096
Eduard, W., Heederik, D., Duchaine, C., and Green, B. J. (2012). Bioaerosol Exposure Assessment in the Workplace: the Past, Present and Recent Advances. J. Environ. Monit. 14, 334. doi:10.1039/c2em10717a
European Parliament and Council (2018). Directive (EU) 2018/850 of the European Parliament and of the Council of 30 May 2018 Amending Directive 1999/31/EC on the Landfill of Waste. Off. J. Eur. Union, 100–108.
Farling, S., Rogers, T., Knee, J. S., Tilley, E. A., Brown, J., and Deshusses, M. A. (2019). Bioaerosol Emissions Associated with Pit Latrine Emptying Operations. Sci. Total Environ. 648, 1082–1086. doi:10.1016/j.scitotenv.2018.08.147
Ferguson, R. M. W., Neath, C. E. E., Nasir, Z. A., Garcia-Alcega, S., Tyrrel, S., Coulon, F., et al. (2021). Size Fractionation of Bioaerosol Emissions from green-waste Composting. Environ. Int. 147, 106327. doi:10.1016/j.envint.2020.106327
Fernández-González, J. M., Díaz-López, C., Martín-Pascual, J., and Zamorano, M. (2020). Recycling Organic Fraction of Municipal Solid Waste: Systematic Literature Review and Bibliometric Analysis of Research Trends. Sustainability 12, 4798. doi:10.3390/su12114798
Franchitti, E., Pascale, E., Fea, E., Anedda, E., and Traversi, D. (2020). Methods for Bioaerosol Characterization: Limits and Perspectives for Human Health Risk Assessment in Organic Waste Treatment. Atmosphere 11, 452. doi:10.3390/ATMOS11050452
Guo, X., Xia, X., Tang, R., Zhou, J., Zhao, H., and Wang, K. (2008). Development of a Real-Time PCR Method forFirmicutesandBacteroidetesin Faeces and its Application to Quantify Intestinal Population of Obese and Lean Pigs. Lett. Appl. Microbiol. 47, 367–373. doi:10.1111/j.1472-765X.2008.02408.x
Istituto Nazionale per la Protezione e la Ricerca Ambientale (ISPRA). Rapporto Rifiuti Urbani. (2020). Rapporti 331/2020, ISBN 978-88-448-1030-6.
Kim, K.-H., Kabir, E., and Jahan, S. A. (2018). Airborne Bioaerosols and Their Impact on Human Health. J. Environ. Sci. 67, 23–35. doi:10.1016/j.jes.2017.08.027
Lal, A., Akhtar, J., Pinto, S., Grewal, H., and Martin, K. (2018). Recurrent Pulmonary Embolism and Hypersensitivity Pneumonitis Secondary to Aspergillus, in a Compost Plant Worker: Case Report and Review of Literature. Lung 196, 553–560. doi:10.1007/s00408-018-0142-6
Le Goff, O., Bru-Adan, V., Bacheley, H., Godon, J.-J., and Wery, N. (2010). The Microbial Signature of Aerosols Produced during the Thermophilic Phase of Composting. J. Appl. Microbiol. 108, 325–340. doi:10.1111/j.1365-2672.2009.04427.x
Le Goff, O., Godon, J.-J., Milferstedt, K., Bacheley, H., Steyer, J.-P., Wéry, N., et al. (2012). A New Combination of Microbial Indicators for Monitoring Composting Bioaerosols. Atmos. Environ. 61, 428–433. doi:10.1016/j.atmosenv.2012.07.081
Liang, G., and Bushman, F. D. (2021). The Human Virome: Assembly, Composition and Host Interactions. Nat. Rev. Microbiol. 19, 514–527. doi:10.1038/s41579-021-00536-5
Madsen, A. M., Zervas, A., Tendal, K., and Nielsen, J. L. (2015). Microbial Diversity in Bioaerosol Samples Causing ODTS Compared to Reference Bioaerosol Samples as Measured Using Illumina Sequencing and MALDI-TOF. Environ. Res. 140, 255–267. doi:10.1016/j.envres.2015.03.027
Pan, Y., Ren, Q., Chen, P., Wu, J., Wu, Z., and Zhang, G. (2021). Insight into Microbial Community Aerosols Associated with Electronic Waste Handling Facilities by Culture-dependent and Culture-independent Methods. Front. Public Health 9, 1–9. doi:10.3389/fpubh.2021.657784
Principe, L., Tomao, P., and Visca, P. (2017). Legionellosis in the Occupational Setting. Environ. Res. 152, 485–495. doi:10.1016/j.envres.2016.09.018
Prussin, A. J., Torres, P. J., Shimashita, J., Head, S. R., Kelley, S. T., and Marr, L. C. (2018). Seasonal Dynamics of DNA and RNA Viral Bioaerosol Communities in a Daycare Setting. 15th Conf. Int. Soc. Indoor Air Qual. Clim. INDOOR AIR, 7 1–14. 10.1111/1574-6968.12487.
Robertson, S., Douglas, P., Jarvis, D., and Marczylo, E. (2019). Bioaerosol Exposure from Composting Facilities and Health Outcomes in Workers and in the Community: A Systematic Review Update. Int. J. Hyg. Environ. Health 222, 364–386. doi:10.1016/j.ijheh.2019.02.006
Samake, A., Uzu, G., Martins, J. M. F., Calas, A., Vince, E., Parat, S., et al. (2017). The Unexpected Role of Bioaerosols in the Oxidative Potential of PM. Sci. Rep. 7, 1–10. doi:10.1038/s41598-017-11178-0
Schlegelmilc, M., Streese, J., Biedermann, W., Herold, T., and Stegmann, R. (2005). Odour Control at Biowaste Composting Facilities. Waste Management 25, 917–927. doi:10.1016/j.wasman.2005.07.011
Schlosser, O., Huyard, A., Cartnick, K., Yañez, A., Catalán, V., and Do Quang, Z. (2009). Bioaerosol in Composting Facilities: Occupational Health Risk Assessment. Water Environ. Res. 81, 866–877. doi:10.2175/106143009X407258
Schlosser, O., Robert, S., Debeaupuis, C., and Huyard, A. (2018). Inhalable Dust as a Marker of Exposure to Airborne Biological Agents in Composting Facilities. Waste Manag. 81, 78–87. doi:10.1016/j.wasman.2018.09.051
Sugita, C., Makimura, K., Uchida, K., Yamaguchi, H., and Nagai, A. (2004). PCR Identification System for the genusAspergillusand Three Major Pathogenic species:Aspergillus fumigatus,Aspergillus flavusandAspergillus niger. Med. Mycol. 42, 433–437. doi:10.1080/13693780310001656786
Timm, M., Madsen, A. M., Hansen, J. V., Moesby, L., and Hansen, E. W. (2009). Assessment of the Total Inflammatory Potential of Bioaerosols by Using a Granulocyte Assay. Appl. Environ. Microbiol. 75, 7655–7662. doi:10.1128/AEM.00928-09
Traversi, D., Alessandria, L., Schilirò, T., and Gilli, G. (2011). Size-fractionated PM10 Monitoring in Relation to the Contribution of Endotoxins in Different Polluted Areas. Atmos. Environ. 45, 3515–3521. doi:10.1016/j.atmosenv.2011.04.020
Traversi, D., Gorrasi, I., Pignata, C., Degan, R., Anedda, E., Carletto, G., et al. (2018). Aerosol Exposure and Risk Assessment for green Jobs Involved in Biomethanization. Environ. Int. 114, 202–211. doi:10.1016/j.envint.2018.02.046
UK Environment Agency (2018). Guidance Bioaerosol Monitoring at Regulated Facilities - Use of M9: RPS 209. Available at: https://www.gov.uk/government/publications/bioaerosol-monitoring-at-regulated-facilities-use-of-m9-rps-209/bioaerosol-monitoring-at-regulated-facilities-use-of-m9-rps-209 (Accessed January 23, 2018)
Wery, N. (2014). Bioaerosols from Composting Facilitiesâ€"a Review. Front. Cel. Infect. Microbiol. 4, 4. doi:10.3389/Fcimb.2014.00042
Williams, B., Douglas, P., Roca Barcelo, A., Hansell, A. L., and Hayes, E. (2019). Estimating Aspergillus fumigatus Exposure from Outdoor Composting Activities in England between 2005 and 14. Waste Manag. 84, 235–244. doi:10.1016/j.wasman.2018.11.044
Keywords: bioaerosol, PM10, qPCR, waste management, composting plant, biological risk assessment
Citation: Pascale E, Franchitti E, Zanchi N, Anedda E, Bonetta S and Traversi D (2022) Size-Fractionated PM10 and Bioaerosol Indicator Development by Different Methods in Composting Plants for Risk Assessment. Front. Environ. Sci. 10:777598. doi: 10.3389/fenvs.2022.777598
Received: 15 September 2021; Accepted: 10 January 2022;
Published: 14 February 2022.
Edited by:
Yunping Han, Research Center for Eco-environmental Sciences (CAS), ChinaReviewed by:
Robert MW Ferguson, University of Essex, United KingdomVijay Shridhar, Doon University, India
Guodi Zheng, Institute of Geographic Sciences and Natural Resources Research (CAS), China
Copyright © 2022 Pascale, Franchitti, Zanchi, Anedda, Bonetta and Traversi. This is an open-access article distributed under the terms of the Creative Commons Attribution License (CC BY). The use, distribution or reproduction in other forums is permitted, provided the original author(s) and the copyright owner(s) are credited and that the original publication in this journal is cited, in accordance with accepted academic practice. No use, distribution or reproduction is permitted which does not comply with these terms.
*Correspondence: Deborah Traversi, ZGVib3JhaC50cmF2ZXJzaUB1bml0by5pdA==