 Zhihan Yu
 Han Zhang2,3
 Qingshi Tu
- 1College of Economics and Management, Nanjing Forestry University, Nanjing, China
- 2Research Center for Economics and Trade in Forest Products of the State Forestry Administration (SINO-RCETFOR), Nanjing, China
- 3College of Economics and Management, Northwest A&F University, Xianyang, China
- 4Department of Wood Science, University of British Columbia, Vancouver, BC, Canada
- 5Center for the Yangtze River Delta’s Socioeconomic Development, Nanjing University, Nanjing, China
Harvested wood products (HWP) play an important role in global climate change mitigation. The Production Approach, an internationally accepted HWP carbon accounting approach by the Intergovernmental Panel on Climate Change (IPCC), has been revised several times to enhance the accuracy of the accounting results. This study compared the methodological differences in the Production Approach elaborated in the 2013 Revised Supplementary Methods and Good Practice Guidance Arising from the Kyoto Protocol (PA2013) and 2019 Refinement to the 2006 IPCC Guidelines for National Greenhouse Gas Inventories (PA2019). We used PA2019 to calculate the HWP carbon stock in China under different wood utilization scenarios. In terms of recycling and reusing of recovered paper, we found that PA2019 has a more accurate representation of the increasing proportion of paper and paperboard materials produced using recovered paper in the world. In 2019, the HWP carbon stock in China was 815.94 Mt (1 Mt = 106 t) using PA2019. In detail, the carbon stock of sawnwood, wood-based panels, and paper and paperboard were 208.52 Mt, 559.73 Mt, and 47.69 Mt, respectively. Scenario simulation results show that half-life was an important factor that affecting HWP carbon stock. China can improve HWP carbon stock by increasing the recovered paper utilization rate for paper products or increasing the utilization rate of HWP with long half-life in construction (structural material). The additional carbon stock obtained by changing the utilization structure of wood and improve the half-life of HWP will not be large until decades later but nonetheless important.
1 Introduction
According to the Sixth Assessment Report of the Intergovernmental Panel on Climate Change (IPCC) in 2021, the global average surface temperature had increased by approximately 1.09°C in 2011–2020 compared with 1850–1900 (IPCC, 2021). The carbon dioxide (CO2) emissions caused by human activities are a major contributor to climate change, which have been increasing from 1970 to 2010 at exponentially increasing rates (IPCC, 2014b). The IPCC special report Global Warming of 1.5°C points out that, compared with the level before the industrial revolution, the current average temperature has increased by about 1°C (IPCC, 2018). Therefore, society should strive to control the temperature rise to within 1.5°C in order to avoid a series of ecological and environmental problems.
Forests play an important role in the global carbon cycle, it is estimated that the carbon stock of forest accounts for more than 90% of the total carbon pool of vegetation (Woodwell et al., 1978). From 2006 to 2015, global forests absorbed more than a quarter of global carbon emissions, and carbon emissions caused by deforestation and forest degradation also accounted for one tenth of the world’s total carbon emissions (Quéré et al., 2016). Therefore, forests are an important part of the global carbon cycle system and can have a significant impact on the concentration of greenhouse gas in the atmosphere (Grassi et al., 2017). For example, forests can act as either carbon sources or carbon sinks depending on management strategies and natural disturbances (Pan et al., 2011; Harris et al., 2021).
The role of forestry in the earth’s carbon cycle is complex. On the one hand, trees absorb CO2 from the atmosphere through photosynthesis, convert it into biomass and store it in different parts of the plant. At the same time, forest carbon stock is constantly transferred among carbon pools (e.g., biomass, dead wood and soil). Natural disturbances (e.g., forest fires, pests, etc.), decay of dead wood, and forest respiration will release CO2 into the atmosphere (Pan et al., 2011). On the other hand, as an extension of forest resources utilization, harvested wood products (HWP) refer to the wood materials harvested from forests to produce daily necessities, such as furniture, plywood, and paper, or use as energy. HWP can effectively transfer the carbon stored by the forest through photosynthesis and keep it for 2–70 years, or even more than 100 years (Green et al., 2006; Geng et al., 2017; Head et al., 2019; Sato and Nojiri, 2019; Ludvig et al., 2021).
Existing studies have shown that the worldwide carbon stock of HWP is increasing, and HWP have become an indispensable carbon pool in climate change mitigation (Winjum et al., 1998; Hashimoto et al., 2002; Profft et al., 2009; Johnston and Radeloff, 2019). Indeed, the carbon stock of HWP has been listed as an important topic in the negotiation of the United Nations Framework Convention on Climate Change (UNFCCC). It will also serve as the main content of the national GHG inventories submitted by the reporting countries in the future (Tonosaki, 2009; Jasinevičius et al., 2016).
2 Literature Review
The 2006 IPCC Guidelines for National Greenhouse Gas Inventories (hereafter, 2006 IPCC Guidelines) provides several accounting approaches of HWP carbon storage: the Stock-Change Approach (SCA), Production Approach (PA), and Atmospheric-Flow Approach (AFA) (IPCC, 2006). Some scholars have compared the differences among the abovementioned carbon accounting approaches at the national level. These approaches are found to generate different distribution patterns of carbon stock and emissions between producing and consuming countries owing to different system boundaries, eventually resulting in differences in accounting results (Lim et al., 1999; Tonosaki, 2009; Yang and Zhang, 2016). However, PA may be a good way to eliminate double- and non-counting to achieve global HWP carbon accounting (Sato and Nojiri, 2019).
Many recent studies have used PA to analyze HWP carbon stock and emissions in countries and regions, including Canada (Chen et al., 2014), China (Ji et al., 2013; Ji et al., 2016; Yang and Zhang, 2016), the Czech Republic (Jasinevicius et al., 2018), the European community (Kohlmaier et al., 2007), Ireland (Green et al., 2006; Donlan et al., 2012; Donlan et al., 2013), Japan (Kayo et al., 2015), New Zealand (Wakelin et al., 2020), Portugal (Dias et al., 2007; Dias et al., 2012), Spain (Canals et al., 2014), and the United States (Skog, 2008; Stockmann et al., 2012). Table 1 shows the research methods and results of the above research.
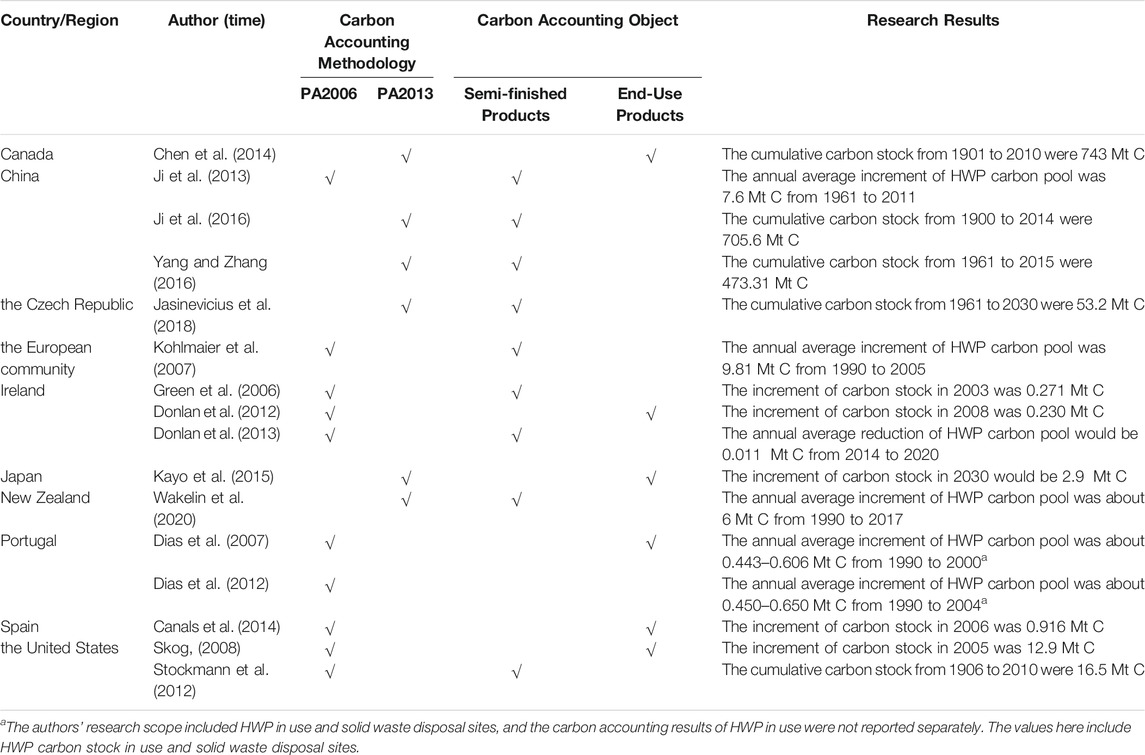
TABLE 1. Application of Production Approach in various countries/regions when quantifying the carbon stock of HWP in use.
The IPCC (2014a) also proposes the use of PA as the internationally accepted carbon accounting approach. In terms of international trade, HWP trade is not included in the accounting scope because PA only focuses on HWP produced from domestic harvests (IPCC, 2006). Therefore, the reasonable estimation of HWP from domestic harvest has been a controversial topic (Tonosaki, 2009; Yang and Zhang, 2016; Sato and Nojiri, 2019). For this reason, the 2013 Revised Supplementary Methods and Good Practice Guidance Arising from the Kyoto Protocol (hereafter, 2013 IPCC Guidelines) and 2019 Refinement to the 2006 IPCC Guidelines for National Greenhouse Gas Inventories (hereafter, 2019 IPCC Guidelines) have revised the estimation of the annual fraction of the domestically produced feedstock for the production of HWP originating from domestic harvest, respectively (IPCC, 2014a; IPCC, 2019).
At present, the classification method of the Food and Agriculture Organization of the United Nations (FAO) is widely used to classify HWP in the world. In the 2019 IPCC Guidelines, HWP have been divided into three categories: primary, semi-finished, and end-use products. The categories are in accordance with the forest–timber chain starting from forest harvesting to production, processing, and end use (IPCC, 2019). As the quantity of wood forest products flowing into various end use forms needs a lot of basic data support, IPCC defaults to semi-finished products as HWP carbon accounting objects, including sawnwood, wood-based panels, paper and paperboard (IPCC, 2019). In addition, some studies further divided solid wood products into construction materials, furniture and other end use forms (Skog, 2008; Dias et al., 2009; Donlan et al., 2012; Zhang et al., 2020), while most mainstream researches did not distinguish the end use forms of paper products (Dias et al., 2012; Chen et al., 2014; Brunet-Navarro et al., 2016).
China is both a major producer and a major consumer of HWP, as well as the largest GHG emitter in the world. The country will face emission reduction obligations in climate change negotiations in future (Yang and Zhang, 2016; Buongiorno et al., 2017). Researchers have shown that the HWP carbon pool has indeed become an important part of the national carbon pool in China (Lun et al., 2012). Hence, accurately evaluating the potential contribution of HWP to emission reduction, and then putting forward an effective carbon management strategy of HWP to reach that potential of carbon emission reduction is conducive to correctly determining China’s responsibility in global climate change and quantify the contribution of HWP to mitigating climate change.
There is ample room for improvement in utilization of HWP in China. First of all, the proportion of wood structure buildings in China’s construction industry is very low, and far lower than that in developed countries such as the United States where the ratio has reached more than 90% (Geng et al., 2019). Secondly, recovered paper is an important raw material in the production of paper and paperboard. In recent years, the production and consumption of paper and paperboard products with recycled paper as the main raw material have accounted for about 50% of the total production and consumption (China Technical Association of Paper Industry, 2019). However, a remarkable gap still exists in the utilization rate of recovered paper compared with developed countries (Zhang et al., 2018). Therefore, it is necessary to study how to improve the utilization mode of HWP under the latest IPCC framework, which is of positive significance to the construction of HWP carbon pool to deal with climate change in China.
Although some studies have quantified the HWP carbon stock of China using the IPCC framework, the majority of these studies have used SCA rather than PA. Among the studies using PA (Ji et al., 2013; Ji et al., 2016; Zhang et al., 2018), the 2006 IPCC Guidelines and 2013 IPCC Guidelines, rather than the 2019 IPCC Guidelines, were used. Moreover, these studies used the classification method of HWP semi-finished products recommended by IPCC, without considering the changes of HWP carbon pool when China increases the use of wood structure buildings in the future. In addition, recovered paper, as one of the important production raw materials of paper and paperboard, has not been included in the HWP carbon accounting of these studies. As a result, it is important that the latest international mainstream PA is applied and the changes in wood utilization structure and recovered paper utilization rate are considered when calculating the HWP carbon stock in China. Accordingly, comparing the results among using different versions of the IPCC Guidelines will help China improve and monitor its national GHG inventories.
The present study aimed to 1) compare the differences in PA elaborated in the 2013 IPCC Guidelines (hereafter, PA2013) and 2019 IPCC Guidelines (hereafter, PA2019), and 2) to use PA2019 to calculate the HWP carbon stock in China from 1961 to 2019, and then explore the future changes in China’s HWP carbon stock under different wood and recovered paper utilization scenarios from 2020 to 2050. We further aimed to explore the different impacts of PA2013 and PA2019 on HWP carbon accounting in China and provide suggestions for China to improve its HWP carbon stock contribution under the IPCC accounting framework.
3 Mathematical Explanations of Production Approach
PA requires all HWP produced by domestic logging along with the carbon released from their decay or oxidative decomposition to be reported by the producing country. This approach considers the time when the carbon stock changes of HWP occur, ignoring the location (Lim et al., 1999). Any carbon stock across the system boundary will not be transferred from one country to another, and international trade will not change a country’s HWP carbon stock. Therefore, the producer country must track the use of wood exported to the consumer country when using PA, as it is difficult for the consumer country to distinguish domestic wood from imported wood. For the purpose of simplification, the IPCC recommends the use of the scaling factor
where
Since the release of the 2006 IPCC Guidelines, the calculation of
In the 2006 IPCC Guidelines,
where
In the 2013 IPCC Guidelines,
where
In the 2019 IPCC Guidelines,
where
According to Eqs 4–9, PA2013 and PA2019 are consistent in estimating the
Yang and Zhang (2016) made a detailed comparison between the PA proposed by the 2006 IPCC Guidelines and that by the 2013 IPCC Guidelines. We mainly compared the differences between PA2013 and PA2019. The difference (
which can be simplified to:
Given that
4 Methods
Firstly, we obtained the production and trade data of HWP semi-finished products from FAO Statistics database (FAOSTATA) from 1961 to 2019. Secondly, we used the Global Forest Products Model (GFPM) to forecast China’s wood production and trade data from 2020 to 2050. Thirdly, combined with the existing research, we divided the end use of HWP semi-finished products into four categories, and set up three wood and recovered paper utilization scenarios according to China’s actual situation and future development plan (Skog, 2008; Dias et al., 2009; Donlan et al., 2012; Zhang et al., 2020). Finally, PA2019 and the decay model based on chi-square distribution were used to calculate the annual inflow and outflow of HWP carbon pool, respectively, and the results of HWP carbon accounting in China were obtained after subtraction. Figure 1 shows the research methods of this paper.
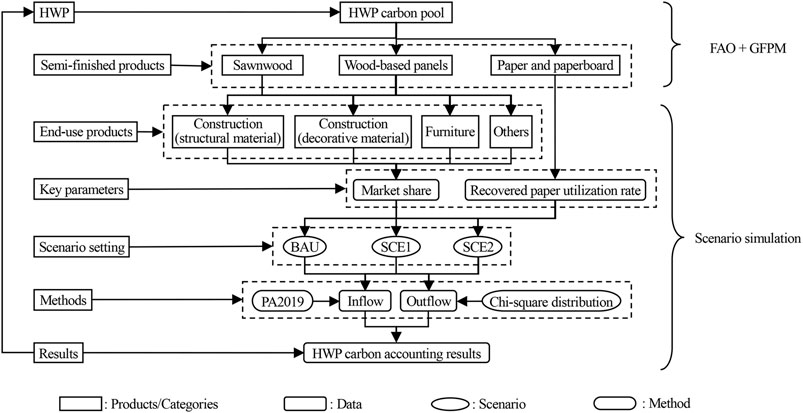
FIGURE 1. Flowchart of research methods. BAU, SCE1, and SCE2 represent business as usual, scenario 1, and scenario 2, respectively.
4.1 Production and Trade Data of Harvested Wood Products
GFPM is a global dynamic equilibrium model for the study of forest products that simulates the market equilibrium of 14 kinds of forest products in about 180 trading countries and regions (Buongiorno et al., 2003). It can reflect the development trend of global forest resources and the forest products market comprehensively and objectively. In the past 30 years, the model has been widely used in resources, environment, and climate change research (Buongiorno et al., 2011; Buongiorno, 2015; Nepal et al., 2016; Johnston and Radeloff, 2019).
It has been shown that the prediction accuracy of the GFPM model declines significantly, when the prediction period is set for too long. In most studies using GFPM, the prediction period was generally about 20 years, such as Buongiorno et al. (2011) and Zhang et al. (2012). And the longest prediction period did not exceed 50 years (Buongiorno and Johnston, 2018). In this study, we used GFPM to forecast China’s wood production and trade data from 2020 to 2050. Using data from the FAOSTATA, we also calculated the carbon stock of the HWP carbon pool in China from 1961 to 2050. In addition, we further analyzed the decay of this part of carbon stock between 2051 and 2100. Although we did not consider the inflow of HWP carbon pool from 2051 to 2100, we could eliminate the impact of HWP’s inflow by calculating the difference between the accounting results of different wood utilization scenarios, so as to further analyze the impact of HWP’s service life on carbon stock.
One of the core issues in GFPM is whether the wood supply is an endogenous variable determined by environmental Kuznets curve (Lantz, 2002; Zhang et al., 2012; Choumert et al., 2013). It should be noted that the Environmental Kuznets Curve itself is empirically derived from historical data with a global scope, hence cannot explain the steady growth of forest stock in China for 20 years (Zhang et al., 2012). Referring to the existing research, we assumed that the changes in forest resources in China and its main industrial roundwood import and export source countries were exogenous (Table 2), and maintained an endogenous assumption for the other countries. Table 2 summarizes the GFPM parameter settings of each country under the exogenous assumption of forest resource changes.
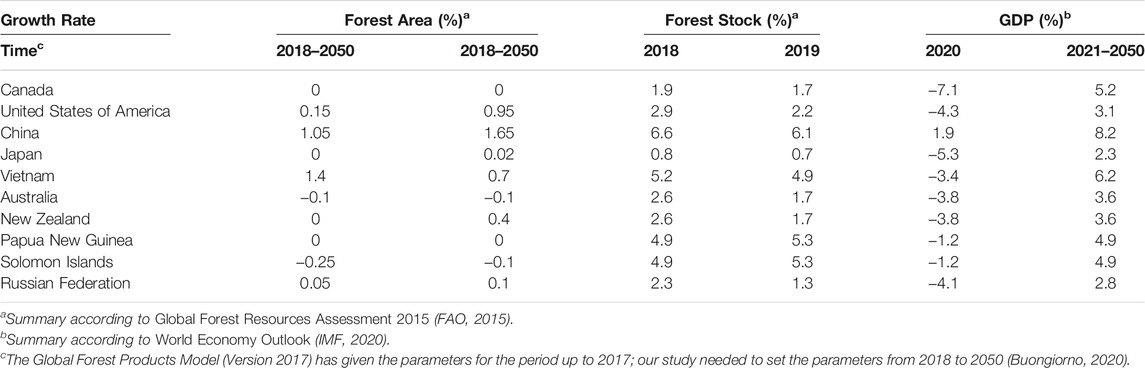
TABLE 2. GFPM parameter settings of each country under the exogenous assumption of forest resource changes.
4.2 Decay Model of Harvested Wood Products
Section 3 has given the accounting approach for carbon inflow into the HWP carbon pool per year (
which can be expressed in discrete form:
where
Figure 2 shows the decay modes of HWP with different kinds of half-life under the assumptions of exponential and chi-squared distribution. HWP with a shorter half-life (e.g., half-life
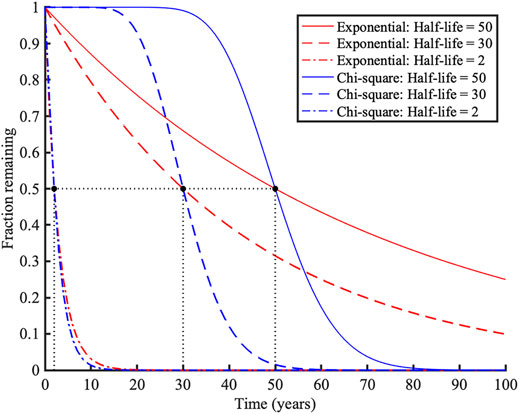
FIGURE 2. Decay modes of harvested wood products under different assumptions.
For the estimate of half-life
where
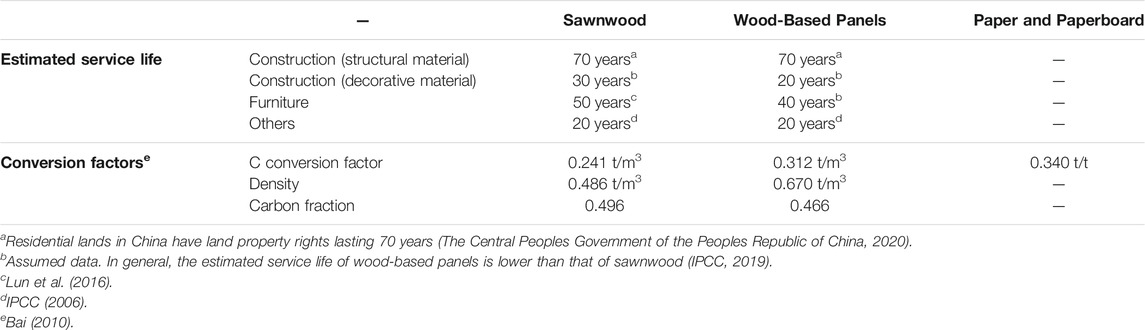
TABLE 3. Estimated service life and conversion factors of semi-finished harvested wood products.
4.3 Scenarios
Research has shown that the use of wood materials in the construction and furniture industries can effectively prolong the service life of HWP, delay the time of carbon emission to the atmosphere and improve carbon stock of HWP carbon pool (Kayo et al., 2015; Lun et al., 2016). We expect that the use of more solid wood products in the construction industry (especially structural wood) and furniture industries will increase HWP carbon stock. In addition, the carbon stock will also increase with the improvement of the recovered paper utilization rate according to Eqs 7–9. At present, the recovered paper utilization rate in China is high (about 0.7). In particular, the introduction of a series of policies on waste paper recycling and resource utilization has effectively promoted the standardization and integration of China’s waste paper recycling industry, and continuously improved China’s waste paper recycling volume, quality and utilization rate (China Technical Association of Paper Industry, 2019). Among them, most of the recycled paper consumed is used to produce cartons, packaging paper, newsprint, etc. Table 4 presents the utilization of recycled paper in China from 2006 to 2018.
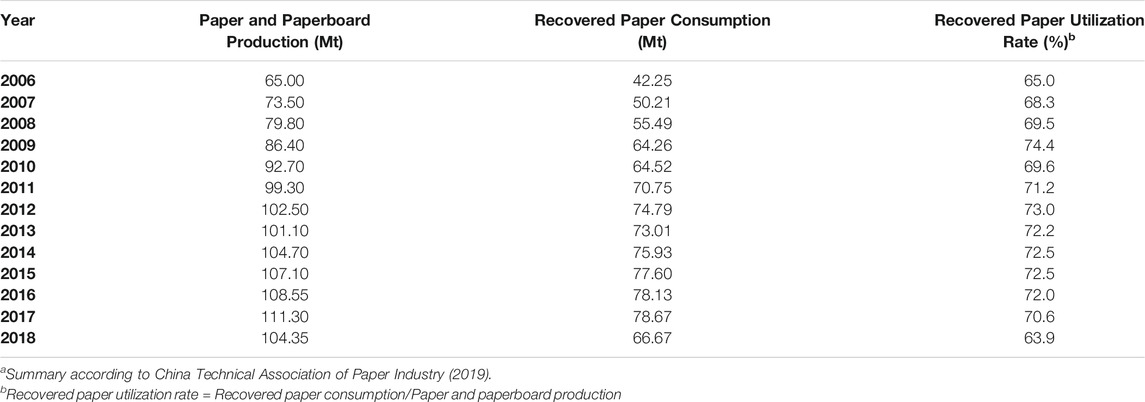
TABLE 4. Utilization of recycled paper in China from 2006 to 2018a.
Hence, three scenarios were considered for HWP utilization: business as usual (BAU), scenario 1 (SCE1), and scenario 2 (SCE2). Under the BAU scenario, the share of sawnwood and wood-based panels in the four markets and the recovered paper utilization rate were assumed to remain the current level in China throughout the modeling period. In China, sawnwood is mainly used in the furniture industry, and its half-life is generally longer than that of wood-based panels (IPCC, 2019). Under SCE1, we assumed that the market share of the furniture industry would gradually increase from 2021 to 2050 because of the rapid development of China’s furniture industry, whereas the market share of the construction industry would remain unchanged (Bai, 2010). Moreover, the recovered paper utilization rate would gradually increase from 0.7 to 0.8 until 2050. Under SCE2, the market share of the construction and furniture industries would both increase gradually from 2021 to 2050, considering the extensive application of timber structures in other countries. In addition, recovered paper utilization rate would gradually increase from 0.7 to 0.9 until 2050. The changes in different market shares of sawnwood and wood-based panels would have effects on product half-life, according to Eq. 14.
Table 5 presents the market shares of sawnwood and wood-based panels, and the recovered paper utilization rate under different wood utilization scenarios in 2050. The half-life of sawnwood under SCE1 and SCE2 gradually increased from 29.11 in 2020 to 32.23 and 35.14 in 2050, respectively. The half-life of wood-based panels under SCE1 and SCE2 gradually increased from 24.61 in 2020 to 25.30 and 26.89 in 2050, respectively.
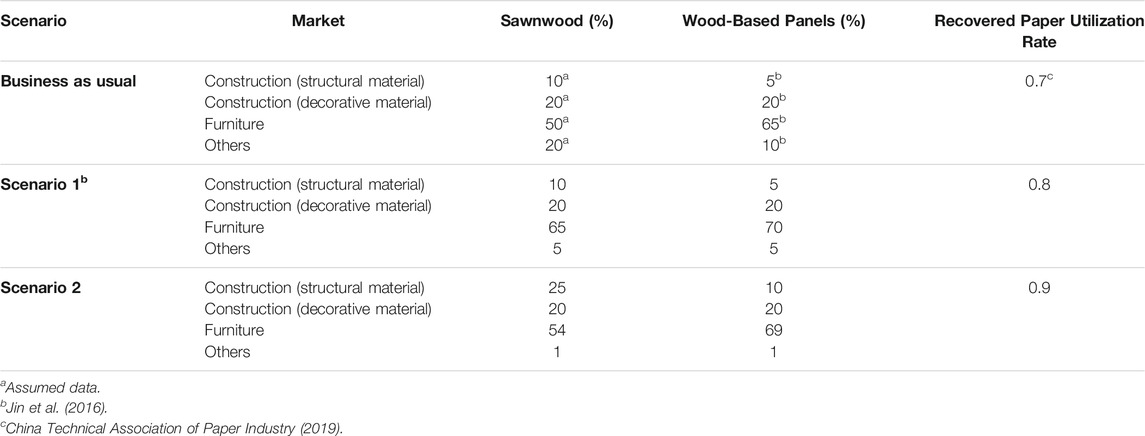
TABLE 5. Scenario setting.
5 Results
5.1 Carbon Stock of Harvested Wood Products in China
Figure 3A shows the changes in the carbon stock of HWP in China from 1961 to 2019. In 2019, the carbon stock of HWP in China was 815.94 Mt (1 Mt = 106 t) using PA2019. In detail, the carbon stock of sawnwood, wood-based panels, and paper and paperboard were 208.52 Mt, 559.73 Mt, and 47.69 Mt, respectively.
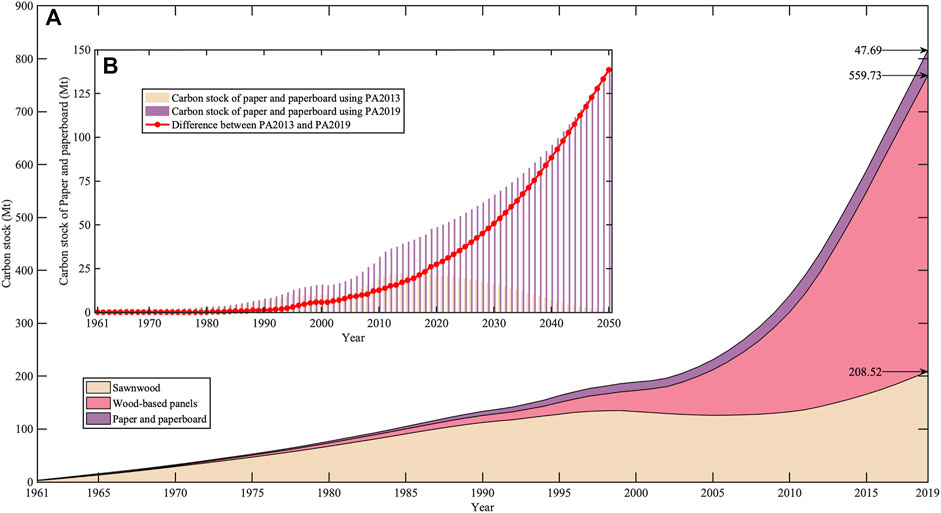
FIGURE 3. (A) Carbon stock of harvested wood products in China from 1961 to 2019 using PA2019. (B) Comparison of the carbon stock of paper and paperboard in China from 1961 to 2050 using PA2013 and PA2019. The three arrows and numbers on the right side of the figure represent the carbon stock of three HWP semi-finished products, respectively.
Figure 3B is a comparative depiction of the carbon stock of paper and paperboard in China from 1961 to 2050 using PA2013 and PA2019. The difference in carbon stock between the two accounting approaches was negligible before 1990. Subsequently, due to the improvement of the consumption and utilization rate of recovered paper, the gap began to expand gradually. The carbon stock of paper and paperboard in 2019 using PA2019 was more than twice of that using PA2013. Combined with production and trade data simulated by GFPM, the carbon stock of paper and paperboard under the two accounting approaches would show a completely opposite trend from 2021 to 2050. Ignoring the use of recovered paper in the production of paper and paperboard, the stock calculated by PA2013 would be 1.89 Mt, whereas the stock change would be 140.44 Mt, by PA2019.
5.3 Carbon Stock Under Different Wood Utilization Scenarios
Under the BAU scenario, the carbon stock of HWP in China would be 3,254.37 Mt by 2050. Further, the carbon stock of sawnwood, wood-based panels, and paper and paperboard were 584.93 Mt, 2,529.00 Mt, and 140.44 Mt. Figure 4 and Figure 6 show the changes and difference in HWP carbon stock under three wood utilization scenarios from 2020 to 2050 using PA2019. Although the half-lives of the three HWP semi-finished products were different in different situations, the overall variation trend was consistent between 2020 and 2100. In terms of absolute quantities, the carbon stock under SCE1 increased by 35.80 Mt compared with the BAU scenario in 2050, including 5.40 Mt from sawnwood, 10.61 Mt from wood-based panels, and 19.79 Mt from paper and paperboard. As for SCE2, the carbon stock increased by 82.51 Mt compared with the BAU scenario in 2050, including 9.66 Mt from sawnwood, 33.26 Mt from wood-based panels, and 39.58 Mt from paper and paperboard. In terms of comparative quantities, the carbon stock under SCE1 increased by 1.10% compared with the BAU scenario in 2050, including a 0.92% increase from sawnwood, 0.42% increase from wood-based panels, and 14.09% increase from paper and paperboard. As for SCE2, the carbon stock increased by 2.54% compared with the BAU scenario in 2050, including a 1.65% increase from sawnwood, 1.32% increase from wood-based panels, and 28.18% increase from paper and paperboard.
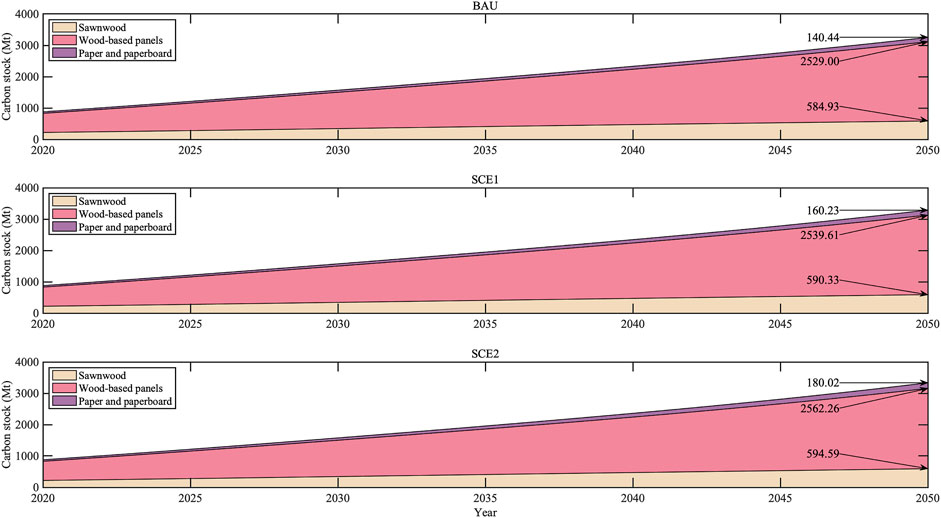
FIGURE 4. Carbon stock under different wood utilization scenarios from 2020 to 2050. The carbon stock here took into account both inflow and decay. The black arrows and numbers on the right side of the figure show the carbon stock of three HWP semi-finished products in 2050, respectively.
In addition to accounting China’s HWP carbon stock from 2020 to 2050 under different wood utilization scenarios, this study also examined the decay of this part of carbon stock in the next 50 years. With the passage of time, the difference of carbon stock caused by the difference of half-lives of three HWP semi-finished products began to appear gradually. As shown in Figure 5 and Figure 6, for sawnwood and wood-based panels, the difference in carbon stock between the BAU scenario and SCE1/SCE2 would continue to expand and peak at around 2070. Specifically, the largest difference in carbon stock of sawnwood relative to the BAU scenario would occur between 2070 and 2075. The difference would be 40.36 Mt for SCE1 in 2073, and 75.21 Mt for SCE2 in 2069, or equivalent to 24.67 and 51.37% of the BAU scenario, respectively. Furthermore, the largest difference in carbon stock of wood-based panels relative to the BAU scenario will occur between 2065 and 2070. The difference would be 50.21 Mt for SCE1 in 2068, and 165.58 Mt for SCE2 in 2074, equivalent to 5.48 and 20.20% of the BAU scenario, respectively. Nonetheless, the difference in carbon stock of paper and paperboard between the BAU scenario and SCE1/SCE2 would continue to shrink and reach zero in around 2060 owing to the short half-life of these materials.
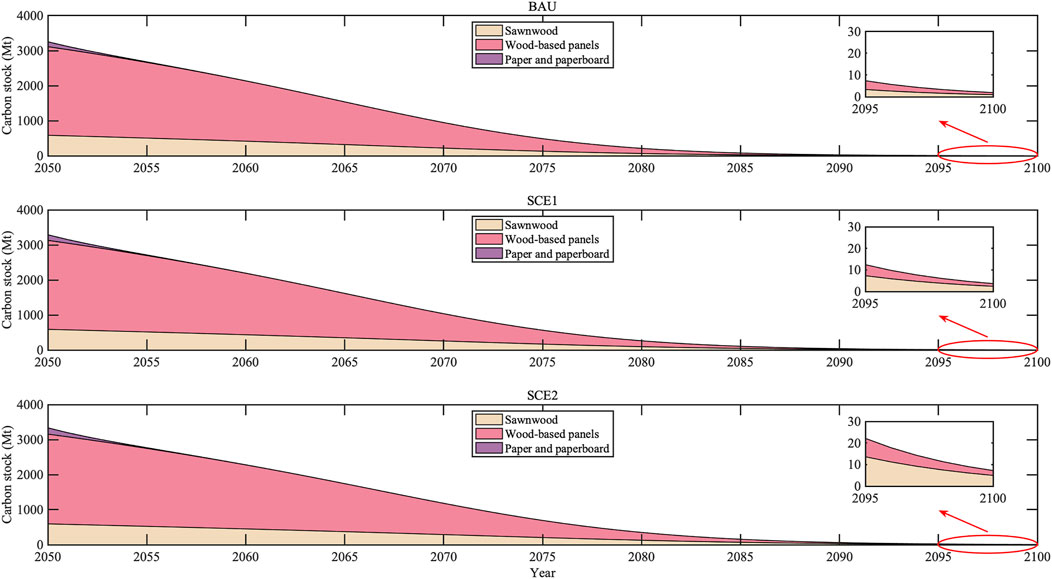
FIGURE 5. Decay of HWP carbon pool in China from 2050 to 2100.
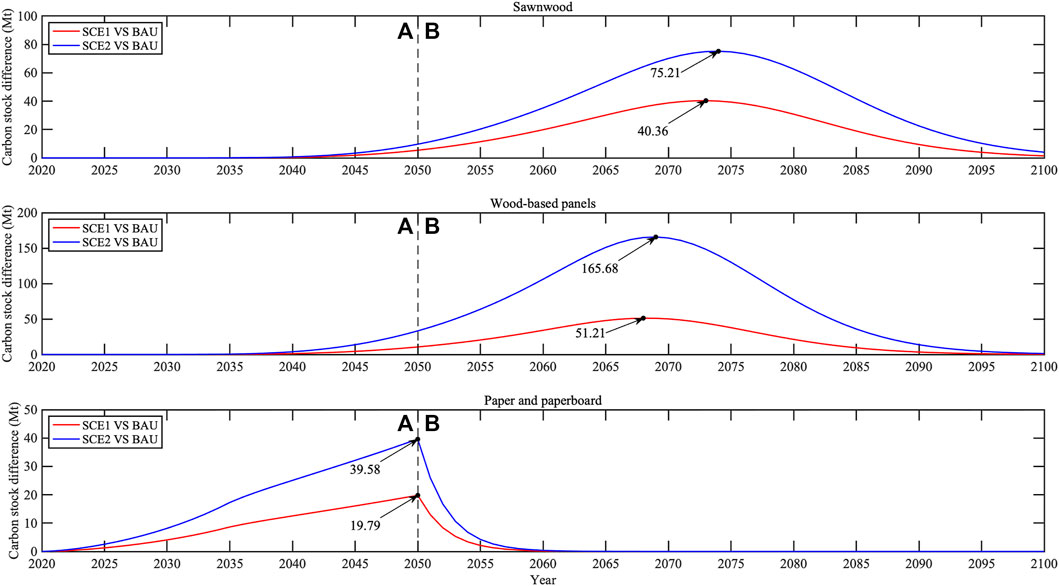
FIGURE 6. Carbon stock difference between different wood utilization scenarios. The carbon stock different in Part A (2020–2050) took into account both inflow and decay. The carbon stock different in Part B (2051–2100) only considered the decay of HWP carbon pool in China since 2051. The black arrows and numbers in the figure show the maximum difference of carbon stock of three HWP semi-finished products under different wood utilization scenarios.
6 Discussion
6.1 Impact of Methodology Improvement on Carbon Accounting for Harvested Wood Products
PA is internationally recognized as the mainstream HWP carbon accounting approach. In the past few decades, the amount of recycling and reusing of recovered paper in the paper and paperboard industry has increased worldwide (Miranda et al., 2010). Therefore, carbon accounting must consider the use of recovered paper apart from industrial roundwood and wood pulp in the production of paper and paperboard. PA2019 considers paper and paperboard produced from recovered paper through the term
According to FAO (2021) statistics, recovered paper accounts for half of the world’s fiber use in paper and paperboard production. Thus, the accounting difference between PA2013 and PA2019 will be positive because
Meanwhile, the effect of the recovered paper utilization rate q on the carbon stock of paper and paperboard is crucial. When q is 0.7, the carbon stock of paper and paperboard in 2050 can increase by 19.79 Mt for every 0.1 increase of q, which is equivalent to 14.09% of the BAU scenario (Figure 4 and Figure 6). In the short run, increasing the recovered paper utilization rate can greatly improve the HWP carbon accounting results.
6.2 Impact of Carbon Stock Under Different Wood Utilization Scenarios
According to the simulation results of scenarios SCE1 and SCE2, increasing the proportion of sawnwood and wood-based panels in the construction and furniture industries, especially the construction industry (structural material), can improve the HWP carbon stock. The difference in carbon stock under the three scenarios is not remarkable by 2050, if carbon accounting for HWP from 2020 to 2050 is considered alone. This is mainly because the half-life of sawnwood and wood-based panels in SCE1/SCE2 gradually increase between 2020 and 2050. By 2050, the service time of sawnwood and wood-based panels, which flow into the HWP carbon pool from 2020 to 2050, would be mostly less than their half-life (about 30 years). As shown in Figure 2, under the chi-squared distribution assumption, the proportion of decay of sawnwood and wood-based panels before their half-life is very small, resulting in the negligible difference in carbon accounting results between the SCE1/SCE2 and BAU scenarios (Figures 4, 6).
However, if the decay of this part of the carbon stock in the next 50 years continues to be considered, the difference between the SCE1/SCE2 and BAU scenarios will become evident. In around 2070, the service time of sawnwood and wood-based panels, which flow into the HWP carbon pool from 2020 to 2050, would be mostly longer than or near their half-life. At this point, the difference in carbon stock of sawnwood and wood-based panels with different half-life reaches the peak (Figures 5, 6. Compared with the BAU scenario, the carbon stock difference of sawnwood under SCE1 increases from 0.92% in 2050 to 24.67% in 2073, whereas that of wood-based panels increases from 0.42% in 2050 to 5.48% in 2068. By contrast, under SCE2, compared with the BAU scenario, the carbon stock difference of sawnwood increases from 1.65% in 2050 to 51.37% in 2074, whereas the difference of wood-based panels increases from 1.32% in 2050 to 20.20% in 2069. The main reason for the higher carbon stock under SCE2 compared with SCE1 is that more sawnwood and wood-based panels are used in the construction industry (structural material).
Thus, the extra carbon stock obtained by changing the utilization structure of sawnwood and wood-based panels will not show up until decades later. In China, undoubtedly, increasing the proportion of sawnwood and wood-based panels in the production process of products with long service life (e.g., structural material used for construction) can effectively increase the HWP carbon stock in the long run (Figure 6).
7 Conclusion
This study compared the methodological differences between PA2013 and PA2019, and then used PA2019 to calculate the HWP carbon stock in China under different wood utilization scenarios between 2020 and 2100. Considering the increasing proportion of paper and paperboard produced using recovered paper, PA2019 can reflect the carbon stock more accurately as well as produce greater HWP carbon accounting results compared with PA2013. In China, the carbon stock of HWP was 815.94 Mt using PA2019. In detail, the carbon stock of sawnwood, wood-based panels, and paper and paperboard were 208.52 Mt, 559.72 Mt, and 47.69 Mt, respectively. By 2050, with a consistent wood utilization structure, the carbon stock of HWP in China will be 3,254.37 Mt.
In addition to the benchmark scenarios, we have set up two other scenarios with different wood utilization structures, which can provide guidance for policy formulation to increase China’s HWP use to realize its emission reduction obligations. The result of scenario simulation showed that China can improve its HWP carbon stock by adjusting its wood utilization structure.
Although the carbon stock of paper and paperboard did not account for a large proportion in the HWP carbon pool, but in the short run (e.g., 2 years), increasing the recovered paper utilization rate is still an effective way to improve China’s HWP carbon accounting results. With the promulgation of the Environmental Protection Tax Law of the People’s Republic of China, papermaking enterprises must reduce the production of solid waste, and the use of recovered paper raw materials for pulp has become a preferred solution (The Central People’s Government of the People’s Republic of China, 2017). Although the recovered paper utilization rate in China has increased over the past years, its growth rate has been diminishing (Table 4). The 14th Five-Year Plan for National Economic and Social Development of the People’s Republic of China and the Outline of Long-Term Objectives for 2035 pointed out that China should comprehensively improve the level of environmental infrastructure and build a resource recycling system in the future (The Central People’s Government of the People’s Republic of China, 2021). Therefore, implementing the policy of recycling renewable resources in China and improving the infrastructure construction of the sorting recycling system of municipal solid waste may be the key measures to improve the recovered paper utilization rate and the carbon stock of HWP in the short term.
In the long run (e.g., 30 years), improving the proportion of sawnwood and wood-based panels for products with a long service life (e.g., structural material used for construction) can effectively increase the HWP carbon stock. The extra carbon stock obtained by changing the utilization structure of sawnwood and wood-based panels will not be large until decades later but will undoubtedly be important. The half-life is an important factor affecting the carbon stock of solid wood products in the long term. If the half-life of solid wood products can be extended by promoting wood for products with a long service life, the carbon stock of HWP will be effectively improved. In China, energy intensive materials such as steel, concrete and cement are widely used in the construction industry, which provides development space for wood structure buildings with solid wood products as the main building components. (Hong et al., 2016). In recent years, the proportion of wood structure buildings in China’s construction industry has increased (National Forestry Administration, 2017). In 2017, the 13th Five-Year Development Plan for Buildings put forward the development goals of building energy conservation and green buildings, which requires optimizing the industrial structure and promoting the development of modern wood structure buildings (Ministry of Housing and Urban-Rural Development of the People’s Republic of China, 2017). The policy drive of promoting the use of wood structure buildings and wood furniture in China is clear. Therefore, promoting the application of HWP in wood structure construction and wood furniture industry is an important measure to increase the carbon stock of HWP in China in the long term.
Our carbon accounting results were based on HWP semi-finished product production and trade data provided by FAO database. In fact, carbon stock should be quantified in the end-use products to achieve more accurate results. Considering that FAO database does not have statistics on the production and trade of end-use products, we only divide sawnwood and wood-based panels into selected end-use categories (including construction, furniture, and others) for simplicity based on existing research (Skog, 2008; Dias et al., 2009; Donlan et al., 2012; Zhang et al., 2020), which may contain some uncertainty. However, considering that the half-lives of sawnwood and wood-based panels recommended in the 2019 IPCC Guidelines are 35 and 25 years, respectively (the half-lives of sawnwood and wood-based panels in this paper are 29.11 and 24.61 years for BAU, 32.23 and 25.30 years for SCE1, and 35.14 and 26.89 years for SCE2, respectively), the uncertainty caused by this simplification is acceptable (IPCC, 2019). In order to accurately calculate the contribution of HWP to climate change mitigation, establishing a comprehensive carbon accounting, measurement and monitoring system and tracking the accurate flow direction of HWP end-use products may be an important research direction in the future.
Data Availability Statement
The original contributions presented in the study are included in the article/Supplementary Materials, further inquiries can be directed to the corresponding authors.
Author Contributions
ZY: Conceptualization, Methodology, Formal analysis, Writing—Original Draft; HZ: Methodology, Writing-Review and Editing; QT: Writing-Review and Editing; HY: Conceptualization, Writing—Review and Editing, Supervision.
Funding
This work was supported by the National Natural Science Foundation of China (Program No. 72073064), the National Natural Science Foundation of China Youth Science Fund Project (Program No. 71703069) the “333 distinguished Talents Project” Foundation of Jiangsu Province in China (Grant No. BRA2018070).
Conflict of Interest
The authors declare that the research was conducted in the absence of any commercial or financial relationships that could be construed as a potential conflict of interest.
Publisher’s Note
All claims expressed in this article are solely those of the authors and do not necessarily represent those of their affiliated organizations, or those of the publisher, the editors and the reviewers. Any product that may be evaluated in this article, or claim that may be made by its manufacturer, is not guaranteed or endorsed by the publisher.
Acknowledgments
The authors thank Jiaxin Chen (Ontario Forest Research Institute) and Xiaobiao Zhang (Research Center for Eco-Environmental Sciences, Chinese Academy of Sciences) for providing valuable suggestions to improve this manuscript.
References
Aryapratama, R., and Pauliuk, S. (2019). Estimating In-Use Wood-Based Materials Carbon Stocks in Indonesia: Towards a Contribution to the National Climate Mitigation Effort. Resour. Conserv. Recycl. 149, 301–311. doi:10.1016/j.resconrec.2019.06.010
Bai, Y. F. (2010). “Carbon Stocks of Harvested Wood Products in China. [dissertation]. Beijing: Chinese Academy of Forestry.
Bates, L., Jones, B., Marland, E., Marland, G., Ruseva, T., Kowalczyk, T., et al. (2017). Accounting for Harvested Wood Products in a Forest Offset Program: Lessons from California. J. For. Econ. 27, 50–59. doi:10.1016/j.jfe.2017.02.004
Brunet‐Navarro, P., Jochheim, H., and Muys, B. (2016). Modelling Carbon Stocks and Fluxes in the Wood Product Sector: A Comparative Review. Glob. Change Biol. 22, 2555–2569. doi:10.1111/gcb.13235
Buongiorno, J. (2015). Global Modelling to Predict Timber Production and Prices: The GFPM Approach. Forestry 88, 291–303. doi:10.1093/forestry/cpu047
Buongiorno, J., and Johnston, C. (2018). Effects of Parameter and Data Uncertainty on Long-Term Projections in a Model of the Global Forest Sector. For. Pol. Econ. 93, 10–17. doi:10.1016/j.forpol.2018.05.006
Buongiorno, J., Johnston, C., and Zhu, S. (2017). An Assessment of Gains and Losses from International Trade in the Forest Sector. For. Pol. Econ. 80, 209–217. doi:10.1016/j.forpol.2017.04.004
Buongiorno, J., Raunikar, R., and Zhu, S. (2011). Consequences of Increasing Bioenergy Demand on Wood and Forests: An Application of the Global Forest Products Model. J. For. Econ. 17, 214–229. doi:10.1016/j.jfe.2011.02.008
Buongiorno, J. (2020). The Global Forest Products Model. Available at: https://buongiorno.russell.wisc.edu/gfpm/(Accessed August 8, 2021).
Buongiorno, J., Zhu, S. S., Zhang, D., Turner, J. A., and Tomberlin, D. (2003). The Global Forest Products Model: Structure, Estimation and Applications. San Diego: Academic Press.
Canals, G. G., Valero, E., Picosi, J., and Voces, R. (2014). Carbon Storage in HWP. Accounting for Spanish Particleboard and Fiberboard. For. Syst 23, 225–235. doi:10.5424/fs/2014232-04046
Chen, J., Colombo, S. J., Ter-Mikaelian, M. T., and Heath, L. S. (2014). Carbon Profile of the Managed Forest Sector in Canada in the 20th Century: Sink or Source? Environ. Sci. Technol. 48, 9859–9866. doi:10.1021/es5005957
Cherubini, F., Guest, G., and Strømman, A. H. (2012). Application of Probability Distributions to the Modeling of Biogenic CO2 Fluxes in Life Cycle Assessment. Glob. Change Biol. Bioenergy 4, 784–798. doi:10.1111/j.1757-1707.2011.01156.x
China Technical Association of Paper Industry (2019). Almanac of China Paper Industry 2019. Beijing: China Light Industry Press.
Choumert, J., Combes Motel, P., and Dakpo, H. K. (2013). Is the Environmental Kuznets Curve for Deforestation a Threatened Theory? A Meta-Analysis of the Literature. Ecol. Econ. 90, 19–28. doi:10.1016/j.ecolecon.2013.02.016
Cláudia Dias, A., Louro, M., Arroja, L., and Capela, I. (2009). Comparison of Methods for Estimating Carbon in Harvested Wood Products. Biomass and Bioenergy 33, 213–222. doi:10.1016/j.biombioe.2008.07.004
Dias, A. C., Arroja, L., and Capela, I. (2012). Carbon Storage in Harvested Wood Products: Implications of Different Methodological Procedures and Input Data-A Case Study for Portugal. Eur. J. For. Res 131, 109–117. doi:10.1007/s10342-011-0515-3
Dias, A. C., Louro, M., Arroja, L., and Capela, I. (2007). Carbon Estimation in Harvested Wood Products Using a Country-Specific Method: Portugal as a Case Study. Environ. Sci. Pol. 10, 250–259. doi:10.1016/j.envsci.2007.01.002
Donlan, J., Black, K., Hendrick, E., O’Driscoll, E., and Byrne, K. (2013). Future Change in Carbon in Harvested Wood Products from Irish Forests Established Prior to 1990. Carbon Manage. 4, 377–386. doi:10.4155/Cmt.13.37
Donlan, J., Skog, K., and Byrne, K. A. (2012). Carbon Storage in Harvested wood Products for Ireland 1961-2009. Biomass and Bioenergy 46, 731–738. doi:10.1016/j.biombioe.2012.06.018
FAO (2021). Forestry Production and Trade. Available at: http://www.fao.org/faostat/en/#data/FO (Accessed September 19, 2021).
FAO (2015). Global Forest Resources Assessment 2015. Available at: http://www.fao.org/3/i4808e/i4808e.pdf (Accessed August 8, 2021).
Geng, A., Chen, J., and Yang, H. (2019). Assessing the Greenhouse Gas Mitigation Potential of Harvested Wood Products Substitution in China. Environ. Sci. Technol. 53, 1732–1740. doi:10.1021/acs.est.8b06510
Geng, A., Zhang, H., and Yang, H. (2017). Greenhouse Gas Reduction and Cost Efficiency of Using Wood Flooring as an Alternative to Ceramic Tile: A Case Study in China. J. Clean. Prod. 166, 438–448. doi:10.1016/j.jclepro.2017.08.058
Grassi, G., House, J., Dentener, F., Federici, S., den Elzen, M., and Penman, J. (2017). The Key Role of Forests in Meeting Climate Targets Requires Science for Credible Mitigation. Nat. Clim Change 7, 220–226. doi:10.1038/nclimate3227
Green, C., Avitabile, V., Farrell, E., and Byrne, K. (2006). Reporting Harvested Wood Products in National Greenhouse Gas Inventories: Implications for Ireland. Biomass and Bioenergy 30, 105–114. doi:10.1016/j.biombioe.2005.11.001
Harris, N. L., Gibbs, D. A., Baccini, A., Birdsey, R. A., de Bruin, S., Farina, M., et al. (2021). Global Maps of Twenty-First Century Forest Carbon Fluxes. Nat. Clim. Change 11, 234–240. doi:10.1038/s41558-020-00976-6
Hashimoto, S., Nose, M., Obara, T., and Moriguchi, Y. (2002). Wood Products: Potential Carbon Sequestration and Impact on Net Carbon Emissions of Industrialized Countries. Environ. Sci. Pol. 5, 183–193. doi:10.1016/s1462-9011(01)00045-4
Head, M., Bernier, P., Levasseur, A., Beauregard, R., and Margni, M. (2019). Forestry Carbon Budget Models to Improve Biogenic Carbon Accounting in Life Cycle Assessment. J. Clean. Prod. 213, 289–299. doi:10.1016/j.jclepro.2018.12.122
Hong, J., Shen, G. Q., Guo, S., Xue, F., and Zheng, W. (2016). Energy Use Embodied in China׳s Construction Industry: A Multi-Regional Input-Output Analysis. Renew. Sustain. Energ. Rev. 53, 1303–1312. doi:10.1016/j.rser.2015.09.068
IMF (2020). World Economy Outlook, October 2020: A Long and Difficult Ascent. Available at: https://www.imf.org/en/Publications/WEO/Issues/2020/09/30/world-economic-outlook-october-2020 (Accessed August 8, 2021).
Iordan, C.-M., Hu, X., Arvesen, A., Kauppi, P., and Cherubini, F. (2018). Contribution of Forest Wood Products to Negative Emissions: Historical Comparative Analysis from 1960 to 2015 in Norway, Sweden and Finland. Carbon Balance Manage 13, 12. doi:10.1186/s13021-018-0101-9
IPCC (2006). 2006 IPCC Guidelines for National Greenhouse Gas Inventories. Kanagawa: The Institute for Global Environmental Strategies (IGES) for the IPCC.
IPCC (2014a). 2013 Revised Supplementary Methods and Good Practice Guidance Arising from the Kyoto Protocol. Geneva: Intergovernmental Panel on Climate Change.
IPCC (2019). 2019 Refinement to the 2006 IPCC Guidelines for National Greenhouse Gas Inventories. Geneva: Intergovernmental Panel on Climate Change.
IPCC (2014b). Climate Change 2014: Mitigation of Climate Change. Cambridge: Cambridge University Press.
IPCC (2021). Climate Change 2021: The Physical Science Basis. Available at: https://www.ipcc.ch/report/ar6/wg1/(Accessed September 19, 2021).
Jasinevičius, G., Lindner, M., Cienciala, E., and Tykkyläinen, M. (2018). Carbon Accounting in Harvested Wood Products: Assessment Using Material Flow Analysis Resulting in Larger Pools Compared to the IPCC Default Method. J. Ind. Ecol. 22, 121–131. doi:10.1111/jiec.12538
Jasinevičius, G., Lindner, M., Pingoud, K., and Tykkylainen, M. (2016). Review of Models for Carbon Accounting in Harvested Wood Products. Int. Wood Prod. J. 6, 198–212. doi:10.1080/20426445.2015.1104078
Ji, C., Cao, W., Chen, Y., and Yang, H. (2016). Carbon Balance and Contribution of Harvested Wood Products in China Based on the Production Approach of the Intergovernmental Panel on Climate Change. Int. J. Environ. Res. Public Health 13, 1132. doi:10.3390/ijerph13111132
Ji, C., Yang, H., Nie, Y., and Hong, Y. (2013). Carbon Sequestration and Carbon Flow in Harvested Wood Products for China. Int. For. Rev. 15, 160–168. doi:10.1505/146554813806948530
Jin, J. W., Chen, S. G., and Wellwood, R. (2016). Oriented Strand Board: Opportunities and Potential Products in China. Bioresources 11, 10585–10603. doi:10.15376/biores.11.2.4319-4331
Johnston, C. M. T., and Radeloff, V. C. (2019). Global Mitigation Potential of Carbon Stored in Harvested Wood Products. Proc. Natl. Acad. Sci. U.S.A. 116, 14526–14531. doi:10.1073/pnas.1904231116
Kayo, C., Tsunetsugu, Y., and Tonosaki, M. (2015). Climate Change Mitigation Effect of Harvested Wood Products in Regions of Japan. Carbon Balance Manage 10, 24. doi:10.1186/s13021-015-0036-3
Kohlmaier, G., Kohlmaier, L., Fries, E., and Jaeschke, W. (2007). Application of the Stock Change and the Production Approach to Harvested Wood Products in the EU-15 Countries: A Comparative Analysis. Eur. J. For. Res 126, 209–223. doi:10.1007/s10342-006-0130-x
Lantz, V. (2002). Is There an Environmental Kuznets Curve for Clearcutting in Canadian Forests? J. For. Econ. 8, 199–212. doi:10.1078/1104-6899-00016
Lim, B., Brown, S., and Schlamadinger, B. (1999). Carbon Accounting for Forest Harvesting and Wood Products: Review and Evaluation of Different Approaches. Environ. Sci. Pol. 2, 207–216. doi:10.1016/s1462-9011(99)00031-3
Ludvig, A., Braun, M., Hesser, F., Ranacher, L., Fritz, D., Gschwantner, T., et al. (2021). Comparing Policy Options for Carbon Efficiency in the Wood Value Chain: Evidence from Austria. J. Clean. Prod. 292, 125985. doi:10.1016/j.jclepro.2021.125985
Lun, F., Li, W., and Liu, Y. (2012). Complete Forest Carbon Cycle and Budget in China, 1999-2008. For. Ecol. Manage. 264, 81–89. doi:10.1016/j.foreco.2011.10.004
Lun, F., Liu, M., Zhang, D., Li, W., and Liu, J. (2016). Life Cycle Analysis of Carbon Flow and Carbon Footprint of Harvested Wood Products of Larix Principis-Rupprechtii in China. Sustainability 8, 247. doi:10.3390/su8030247
Marland, E. S., Stellar, K., and Marland, G. H. (2010). A Distributed Approach to Accounting for Carbon in Wood Products. Mitig Adapt Strateg. Glob. Change 15, 71–91. doi:10.1007/s11027-009-9205-6
Ministry of Housing and Urban-Rural Development of the People’s Republic of China (2017). The 13th Five-Year Development Plan for Buildings. Available at: http://www.gov.cn/xinwen/2017-05/04/5190836/files/3ebd21600fa94ce3947d30f7ba9f47ab.pdf (Accessed January 13, 2022).
Miranda, R., Bobu, E., Grossmann, H., Stawicki, B., and Blanco, A. (2010). Factors Influencing a Higher Use of Recovered Paper in the European Paper Industry. Cellul. Chem. Technol. 44, 419–430.
National Forestry Administration (2017). China Forestry Development Report. Beijing: China Forestry Publishing House.
Nepal, P., Skog, K. E., McKeever, D. B., Bergman, R. D., Abt, K. L., and Abt, R. C. (2016). Carbon Mitigation Impacts of Increased Softwood Lumber and Structural Panel Use for Nonresidential Construction in the United States. For. Prod. J. 66, 77–87. doi:10.13073/FPJ-D-15-00019
Pan, Y., Birdsey, R. A., Fang, J., Houghton, R., Kauppi, P. E., Kurz, W. A., et al. (2011). A Large and Persistent Carbon Sink in the World's Forests. Science 333, 988–993. doi:10.1126/science.1201609
Pingoud, K., and Wagner, F. (2006). Methane Emissions from Landfills and Carbon Dynamics of Harvested Wood Products: The First-Order Decay Revisited. Mitig Adapt Strat Glob. Change 11, 961–978. doi:10.1007/s11027-006-9029-6
Profft, I., Mund, M., Weber, G.-E., Weller, E., and Schulze, E.-D. (2009). Forest Management and Carbon Sequestration in Wood Products. Eur. J. For. Res 128, 399–413. doi:10.1007/s10342-009-0283-5
Quéré, L. C., Andrew, R. M., Canadell, J. G., Sitch, S., Korsbakken, J. I., Peters, G. P., et al. (2016). Global Carbon Budget 2016. Earth Syst. Sci. Data 8, 605–649. doi:10.5194/essd-8-605-2016
Sato, A., and Nojiri, Y. (2019). Assessing the Contribution of Harvested Wood Products under Greenhouse Gas Estimation: Accounting under the Paris Agreement and the Potential for Double-Counting Among the Choice of Approaches. Carbon Balance Manage 14, 15. doi:10.1186/s13021-019-0129-5
Skog, K. E. (2008). Sequestration of Carbon in Harvested Wood Products for the United States. For. Prod. J. 58, 56–72. doi:10.1007/s10570-007-9194-0
Stockmann, K. D., Anderson, N. M., Skog, K. E., Healey, S. P., Loeffler, D. R., Jones, G., et al. (2012). Estimates of Carbon Stored in Harvested Wood Products from the United States Forest Service Northern Region, 1906-2010. Carbon Balance Manage 7, 1. doi:10.1186/1750-0680-7-1
The Central Peoples Government of the Peoples Republic of China (2020). Interim Regulations of the People’s Republic of China on the Assignment and Transfer of the Right to the Use of State-Owned Land in Cities and Towns. Available at: http://www.gov.cn/zhengce/2020-12/25/content_5574204.htm (Accessed August 8, 2021).
The Central People’s Government of the People’s Republic of China (2017). Regulations for the Implementation of the Environmental Protection Tax Law of the People’s Republic of China. Available at: http://www.gov.cn/zhengce/content/2017-12/30/content_5251797.htm (Accessed January 13, 2022).
The Central People’s Government of the People’s Republic of China (2021). The 14th Five-Year Plan for National Economic and Social Development of the People’s Republic of China and the Outline of Long-Term Objectives for 2035. Available at: http://www.gov.cn/xinwen/2021-03/13/content_5592681.htm?pc (Accessed January 13, 2022).
Tonosaki, M. (2009). Harvested Wood Products Accounting in the Post Kyoto Commitment Period. J. Wood Sci. 55, 390–394. doi:10.1007/s10086-009-1052-2
Wakelin, S. J., Searles, N., Lawrence, D., and Paul, T. S. H. (2020). Estimating New Zealand's Harvested wood Products Carbon Stocks and Stock Changes. Carbon Balance Manage 15, 10. doi:10.1186/s13021-020-00144-5
Winjum, J. K., Brown, S., and Schlamadinger, B. (1998). Forest Harvests and Wood Products: Sources and Sinks of Atmospheric Carbon Dioxide. For. Sci. 44, 272–284. doi:10.1093/forestscience/44.2.272
Woodwell, G. M., Whittaker, R. H., Reiners, W. A., Likens, G. E., Delwiche, C. C., and Botkin, D. B. (1978). The Biota and the World Carbon Budget. Science 199, 141–146. doi:10.1126/science.199.4325.141
Yang, H., and Zhang, X. (2016). A Rethinking of the Production Approach in IPCC: Its Objectiveness in China. Sustainability 8, 216. doi:10.3390/su8030216
Zhang, H., Buongiorno, J., and Zhu, S. (2012). Domestic and Foreign Consequences of China's Land Tenure Reform on Collective Forests. Int. Forest. Rev. 14, 349–362. doi:10.1505/146554812802646648
Zhang, X., Chen, J., Dias, A. C., and Yang, H. (2020). Improving Carbon Stock Estimates for In-Use Harvested Wood Products by Linking Production and Consumption-A Global Case Study. Environ. Sci. Technol. 54, 2565–2574. doi:10.1021/acs.est.9b05721
Keywords: climate change mitigation, harvested wood products, production approach, recovered paper, IPCC, carbon stock
Citation: Yu Z, Zhang H, Tu Q and Yang H (2022) Methodological Comparison of the Production Approach 2013 and 2019 for Quantifying the Carbon Stock in Harvested Wood Products in China. Front. Environ. Sci. 10:758857. doi: 10.3389/fenvs.2022.758857
Received: 15 August 2021; Accepted: 11 March 2022;
Published: 28 March 2022.
Edited by:
Hong Liao, Nanjing University of Information Science and Technology, ChinaReviewed by:
Rolf Müller, Helmholtz Association of German Research Centres (HZ), GermanySevda Kuşkaya, Erciyes University, Turkey
Copyright © 2022 Yu, Zhang, Tu and Yang. This is an open-access article distributed under the terms of the Creative Commons Attribution License (CC BY). The use, distribution or reproduction in other forums is permitted, provided the original author(s) and the copyright owner(s) are credited and that the original publication in this journal is cited, in accordance with accepted academic practice. No use, distribution or reproduction is permitted which does not comply with these terms.
*Correspondence: Qingshi Tu, cWluZ3NoaS50dUB1YmMuY2E=; Hongqiang Yang, eWhxbmZ1QGdtYWlsLmNvbQ==