 Harry West
 Nevil Quinn
 Michael Horswell
95% of researchers rate our articles as excellent or good
Learn more about the work of our research integrity team to safeguard the quality of each article we publish.
Find out more
ORIGINAL RESEARCH article
Front. Environ. Sci. , 17 March 2022
Sec. Interdisciplinary Climate Studies
Volume 10 - 2022 | https://doi.org/10.3389/fenvs.2022.754597
This article is part of the Research Topic Drought and Water Scarcity: Addressing Current and Future Challenges View all 19 articles
Drought events are influenced by a combination of both climatic and local catchment characteristics. In Great Britain the North Atlantic Oscillation (NAO) has long been recognised as the leading mode of climate variability, and studies have also noted the role of the East Atlantic Pattern (EA) as a secondary mode. This study aimed to develop an understanding of the combined influence of the NAO and EA on rainfall distribution and magnitude and the variable nature of meteorological to hydrological drought propagation. Initially, this study explores correlations between teleconnection indices and standardised precipitation and streamflow indices for 291 catchments across Great Britain, before focusing on nine case study catchments for further analysis. For each case study catchment, we use quantile regression and an analysis of drought frequency to explore the combined influence of the NAO and EA on drought conditions. Through a convergence of evidence from these analyses we make three observations. Firstly, in the winter months both the NAO and EA exert an influence on drought conditions, however there is spatial variability in the relative influence of the NAO and EA; the NAO has a stronger influence in the north-west, whilst the EA has a stronger influence in the southern and central regions. Secondly, in the summer months, less distinctive spatial differences were found, with higher probability of drought conditions under NAO+ phases, which however can be enhanced or moderated by the EA. Finally, as a result of catchment characteristics there is spatio-temporal variability in the propagation of meteorological to hydrological drought. Our findings suggest that by considering the NAO and EA in combination, we can better describe climate and drought variability. We conclude by noting the potential implications our study has on the role of monthly teleconnection forecasts in water management decision making in Great Britain, and acknowledge the current limitations associated with incorporating such understanding.
Drought is a significant hydrometeorological hazard which can have severe socio-economic and environmental impacts (Nagarajan, 2010). Recent work has continued to advance our understanding of drought events, their spatio-temporal propagation through the hydrological cycle, and their impacts (Barker et al., 2016; Parry et al., 2016; Van Loon et al., 2016, Barker et al., 2019; Parsons et al., 2019; Tanguy et al., 2021). Droughts are typically classified on the basis of underlying physical processes and environmental/socio-economic impacts. These include meteorological drought (low precipitation), soil moisture or agricultural drought (low soil moisture), hydrological drought (low discharge and groundwater), and socio-economic drought (where there is a substantial impact on water resources affecting society) (Wilhite and Glantz, 1985; Van Loon, 2015). Conceptually these “drought types” have a sequential progression over time from meteorological to hydrological (and socio-economic) drought.
The spatiality of drought events is complex in Britain, as is the propagation of rainfall to flows within catchments. Distinctive differences in both rainfall and flow regimes have been found between the north-western and south-eastern areas of the country which are related to a range of climatological and hydrological variables (Burt and Howden, 2013; Folland et al., 2015; Chiverton et al., 2015; Barker et al., 2016; Rust et al., 2018; West et al., 2019; West et al., 2022; Svensson and Hannaford, 2019). Tanguy et al. (2021) identify NW/SE differences in the characteristics of meteorological drought events in Britain (Figure 1 of Tanguy et al., 2021). Notably, when examined with short rainfall accumulation periods, shorter and less severe droughts were found in the north-western areas, whilst longer and more severe droughts were found in the south-eastern areas. Although it should be noted that using longer rainfall accumulation periods resulted in less distinctive differences between the NW and SE (Tanguy et al., 2021).
Spatial patterns in the propagation of meteorological to hydrological drought is further complicated as it is influenced by both climate and catchment characteristics (Van Loon and Laaha, 2015). Barker et al. (2016) found that streamflow in the NW is sensitive to short meteorological droughts, such as those identified by Tanguy et al. (2021), due to the highly responsive nature of catchments in this region (Chiverton et al., 2015). Meanwhile low flows in the southern and eastern parts of the country are more strongly related to rainfall deficits over longer time periods due to their catchment characteristics and baseflow dominance (Barker et al., 2016).
Droughts are inherently driven by climatic processes, and for Great Britain and most of northern and western Europe, the North Atlantic Oscillation (NAO) atmospheric-oceanic circulation has long been identified as the leading mode of climate variability (Sweeney and O’Hare, 1992; Hurrell and Van Loon, 1997; Rodwell et al., 1999). The NAO is defined by two meridional diploes—the Icelandic Low and Azores High/Anticyclone. When the sea level pressure (SLP) difference between these two locations is greater than average the NAO is said to be in a positive phase (NAO+), whilst a weaker than average SLP difference represents a negative phase (NAO−) (Hurrell et al., 2003). Significant correlations have been reported between North Atlantic Oscillation Indices (quantitative measures of the phase and magnitude of the NAO - NAOI) and rainfall in Britain. For example, significant positive correlations have been found in the north-west of the country during winter (Wilby et al., 1997; Fowler and Kilsby, 2002; Afzal et al., 2015; Rust et al., 2018) and West et al. (2019) report significant increases/decreases in winter rainfall (200–300 mm) in the north-west associated with NAO+/− phases, relative to when the NAO is in a weak neutral state (defined as half the standard deviation plus/minus the long term mean of the NAOI (Berton et al., 2017)). Generally, winter correlations are weaker, and there is greater variability in the NAO-rainfall response, in the southern and eastern areas (Rust et al., 2018; West et al., 2021a).
The influence of the NAO is typically reported as being weaker in the summer months compared to winter (Folland et al., 2009). However spatially consistent rainfall responses to the NAO have been observed in summer across Great Britain, although these correlations are typically negative and weaker (Folland et al., 2009; Hall and Hanna, 2018; West et al., 2019). It should be noted however that summer correlations between the NAO and rainfall can vary depending on the calculation method of the chosen NAOI (Pokorná and Huth, 2015; West et al., 2019).
The East Atlantic Pattern (EA) has also been acknowledged to have an impact on European climate and has been referred to as a southward shifted NAO-like pattern (Comas-Bru and McDermott, 2014; Mikhailova and Yurovsky, 2016). The EA is noted as having a well-defined monopole at approximately 55°N; 20–35°W (Barnston and Livezey, 1987; Moore and Renfrew 2012; Comas-Bru and McDermott, 2014; Mellado-Cano et al., 2019), the SLP conditions at which have the potential to influence the location and strength of the NAO dipoles (Moore et al., 2011). Studies have noted that the phase and magnitude of the EA also influences rainfall spatial distribution and volume across Europe, and consequently by using a combination of the NAO and EA we may be able to describe winter climate variability more accurately (Comas Bru and McDermott, 2014; Mellado-Cano et al., 2020). In Great Britain, positive correlations have been found between the EA and rainfall, which are typically stronger in the southern and central regions (Casanueva et al., 2014; Hall and Hanna, 2018; West et al., 2021b).
As described above, north-west/south-east differences have been reported when exploring drought characteristics and propagation in Britain (Barker et al., 2016; Tanguy et al., 2021). Similar NW/SE spatio-temporal patterns have been found when exploring the propagation of NAO-driven rainfall deviations to streamflow in catchments (Burt and Howden, 2013; Rust et al., 2021a). Catchments in the north-west are more sensitive to NAO-rainfall deviations, whilst catchments in the southern regions are less susceptible due to their geology, terrain and landcover characteristics which moderate flows (West et al., 2022). Spatially and temporally variable NAO signals have also been detected in groundwater levels across aquifers in Britain (Lavers et al., 2015; Rust et al., 2019) and fluvial water temperatures (Wilby and Johnson, 2020). As far as we are aware, no study has explored at similar large scales the propagation of EA-rainfall signatures.
The above discussion describes the complex interplay between climate and hydrological systems, which manifests in spatio-temporal variability in rainfall, flow responses, and subsequent drought characteristics and propagation, generally along a N/S or NW/SE gradient in Britain. This study aims to bring together understandings of the influence of the NAO and EA on rainfall distribution and magnitude, and the variable nature of meteorological to hydrological drought (i.e., rainfall-streamflow) propagation. In doing so we present new insights into the influence of these two teleconnections on drought in British catchments and how this varies in space and time.
Developing our understanding of the potential effect of the NAO on low rainfall conditions, and how these deficits propagate through catchments, may help us to improve water management decision making and prepare for potential drought events. Forecasting skill for the winter NAO has improved in recent years (Baker et al., 2018; Parker et al., 2019; Athanasiadis et al., 2020; Smith et al., 2020), and there is increasing potential to include the NAO as a factor in monthly streamflow forecasting/modelling (UK Hydrological Outlook, 2020; Donegan et al., 2021). However, we acknowledge further work is required to understand how teleconnection forecasting might be fully utilised given the spatio-temporal variability in NAO− rainfall responses (West et al., 2021a; Rust et al., 2021b), and we are unaware of any similar forecasting skill improvements having been reported for the EA.
Standardised indicators are commonly used for monitoring a range of different hydrometeorological/hydrological variables, such as precipitation, evapotranspiration, streamflow and groundwater (Bachmair et al., 2016). Standardised indicators are effective for hydrological monitoring as they are scaled in relation to local wetness/dryness (relative to a standard or baseline period) and can be calculated over a range of months (the accumulation period). For drought monitoring and assessment in particular, standardised indicators have been used in wide range of research and applications (Hannaford et al., 2011; Bachmair et al., 2016; Huang et al., 2017; Dhurmea et al., 2019; Parsons et al., 2019; Yeh, 2019; Mehr et al., 2020).
In this study we use two standardised indicators: The Standardised Precipitation Index (SPI) and Standardised Streamflow Index (SSI), both of which have been used in drought research in Great Britain (Barker et al., 2016; Barker et al., 2019). Both timeseries were downloaded from the United Kingdom Centre for Ecology and Hydrology (Tanguy et al., 2017; Barker et al., 2018) for the period January 1950-November 2015. The SPI and SSI datasets are calculated using interpolated historic rainfall (Met Office 5 km rainfall grids) and reconstructed streamflow datasets (UKCEH—Smith et al., 2018). The rainfall was fitted to a Gamma Distribution whilst a Tweedie Distribution was used for streamflow (Tanguy et al., 2017; Barker et al., 2018). Both have a common standard period of 1961–2010 and were calculated using a one-month accumulation period (SPI-1 and SSI-1). Positive SPI-1/SSI-1 values indicate higher mean monthly rainfall/flows relative to the 1961–2010 standard period, whilst negative values indicate lower mean monthly rainfall/flows. The SSI-1 data were downloaded for 291 catchments across Britain which vary in geography, size and physical characteristics. The SPI-1 data for each of these 291 catchments were derived by area-weighting the national 5 km gridded SPI-1 dataset.
The NOAA Climate Prediction Centre calculates monthly indices for a range of atmospheric-oceanic circulations, including the NAO and EA (NOAA, 2021). The CPC use a modelling approach based on a rotated principal component analysis (RCPA) to calculate their monthly teleconnection indices (after Barnston and Livezey, 1987), avoiding any limitations with using indices directly calculated using in-situ SLP measurements (Pokorná and Huth, 2015). The teleconnection indices from the CPC have been used in studies exploring the impact of atmospheric-circulations on low rainfall and drought conditions globally (Irannezhad et al., 2015; Huang et al., 2017; Abiy et al., 2019; Amini et al., 2020; Oñate-Valdivieso et al., 2020; Hassan and Nayak, 2021). Monthly NAO and EA indices were download for the period January 1950-November 2015 (NOAA, 2021).
The first analytical stage of this study (correlation and quantile regression) explores the relationship between each of the two teleconnections and meteorological/hydrological drought. In these initial analyses the NAO and EA are treated individually. Later analysis, quantifying the frequency of different drought severities, explores the interaction between the NAO and EA and the combined effect of different teleconnection phases.
The first stage of this research sought to examine the influence of the NAO and EA on catchment rainfall (quantified by the SPI-1) and streamflow (quantified by the SSI-1), and how their respective influence changes in space and time across the 291 catchments. Spearman correlation coefficients were calculated between the two teleconnection indices and SPI-1 and SSI-1 values for each catchment and calendar month, over the period January 1950-November 2015. Distinctive spatio-temporal differences were observed across the correlation results, representing the general influence of each of the two teleconnections.
To develop a more detailed understanding of the combined effect of the NAO and EA on meteorological drought, and how rainfall deficits propagate through to hydrological drought, nine case study catchments were selected for further analysis. One catchment from each of the Met Office Climate Districts was chosen to ensure a spatially representative sample across Great Britain. The Climate Districts represent areas of relatively homogeneous climate and have been used in similar research (Wilby et al., 1997; Simpson and Jones, 2014; West et al., 2019). The catchments were chosen as they vary not only geographically, but also represent a range of physical characteristics such as size, terrain and geology. The representativeness of the nine case study catchments was evaluated using a similarity analysis (described below). Figure 1 presents the nine case study catchments and Table 1 summarises their key physical and hydrological characteristics.
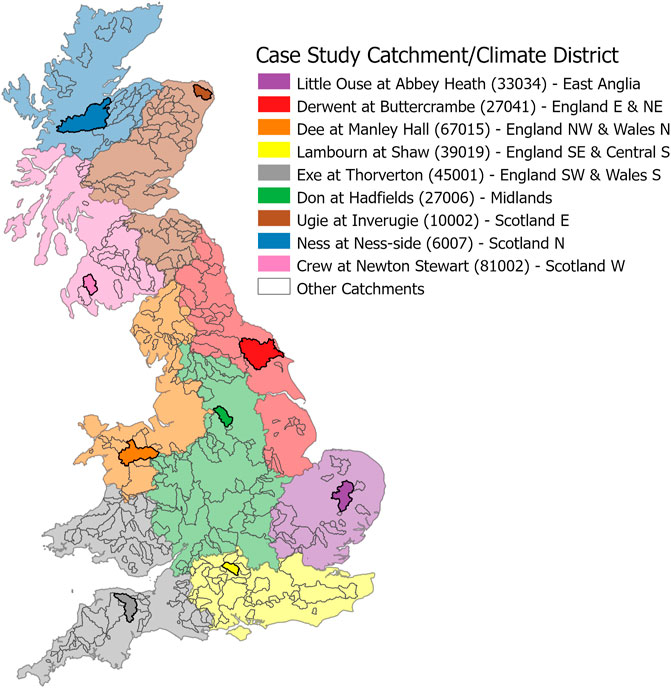
FIGURE 1. Location of the nine case study catchments. Shading indicates the Met Office Climate Districts for Great Britain. Numbers in brackets are the Catchment ID from the United Kingdom National River Flow Archive.
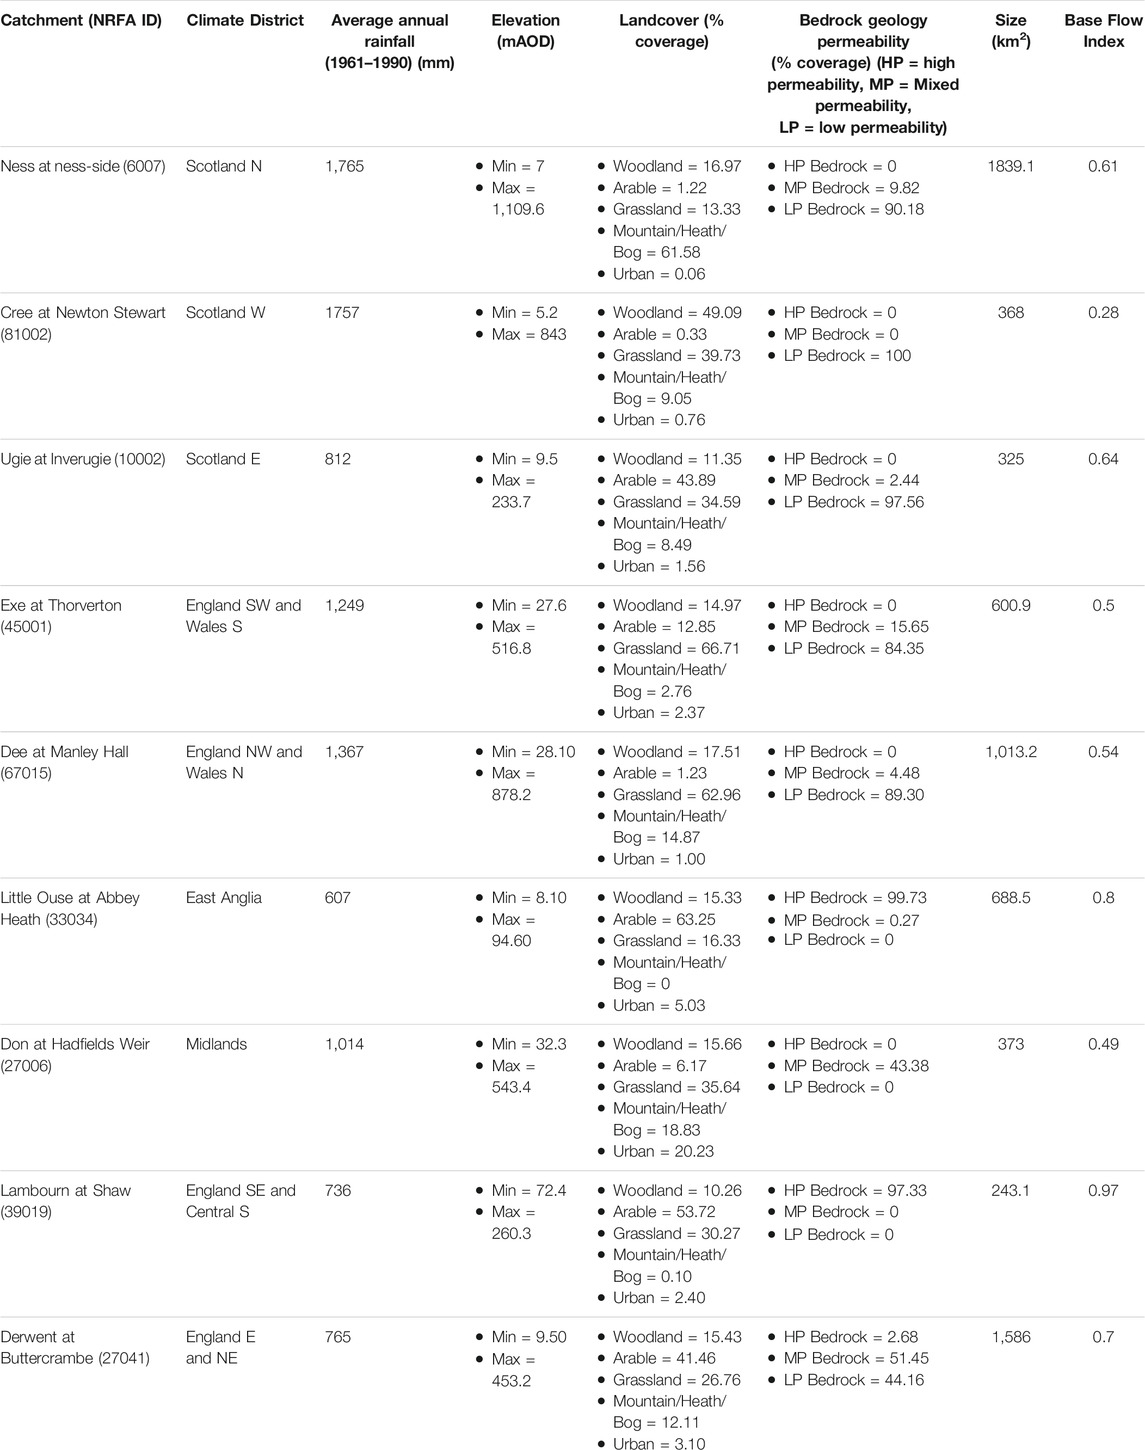
TABLE 1. Summary of case study catchment characteristics (data from the United Kingdom National River Flow Archive).
Similarity analysis (Esri, 2021a) was used to assess the representativeness of each of the nine case study catchments in terms of their rainfall and flow responses to the NAO and the EA. This analysis gives an indication of how similar their meteorological and hydrological drought characteristics might be to the other 290 catchments, both within and beyond their associated Climate District. The similarity analysis algorithm was first applied to the two NAO and EA SPI-1 correlation time series for each of the nine case study catchments, and secondly to the NAO and EA SSI-1 correlation time series. The algorithm first standardises the selected correlation coefficients for each catchment - this standardisation uses a z-score transformation where the mean of all of the coefficients is subtracted from each value and divided by the standard deviation. This standardised value is then subtracted from the coefficients of the case study catchment, the difference squared and totalled, creating a similarity index (Esri, 2021a). Using this index, the 290 catchments were ranked from most to least similar and mapped.
Spatial autocorrelation in the similarity rank values was assessed using the Global Morans I statistic. The Global Morans I evaluates whether the spatial distribution of similarity rank values across the 290 catchments (not including the case study catchment) is more clustered or dispersed than would be expected in a random spatial distribution of the same values (Esri 2021b). The Global Morans I statistic requires a conceptualisation of how each catchment is spatially related to its neighbours. Due to the variability in the size of each catchment (Esri 2021c), a fixed distance band threshold which maximises spatial autocorrelation within the similarity rank values was used (Esri 2021b; Esri 2021c). This was a distance of 50 km from the geometric centroid of each catchment.
We undertook two separate analyses to investigate the influences of the NAO and the EA individually on meteorological drought conditions, and how this propagates to hydrological drought within each of the nine case study catchments, firstly using quantile regression analysis, and secondly drought severity frequency analysis.
A standard generalised linear regression model would assume that the NAO or EA have an equal influence on both wet and dry conditions (high/low rainfall and flows). The use of a quantile regression model allows for an assessment of the relationship between each teleconnection index and low (negative) SPI-1/SSI-1 values at different quantile levels, allowing for a more complete understanding of the influence of the teleconnection on low rainfall and flow conditions in the case study catchments (Amini et al., 2020).
We performed quantile regression using 99 quantiles between the NAO and EA indices and the catchment SPI-1 and SSI-1 values. We extracted the quantile regression coefficients for SPI-1/SSI-1 quantiles below 0.2 (Amini et al., 2020), which equated to standardised index values <−1 in all cases. This analysis was undertaken for both winter (DJF) and summer months (JJA). This allowed for an assessment of the nature and strength of the winter/summer relationship between the two teleconnections and meteorological (low SPI-1) and hydrological (low SSI-1) drought in the case study catchments.
The second stage of this research moved beyond looking at the individual effect of the NAO and EA and explored their combined influence. A frequency analysis quantifying the relationship between the phase of the two teleconnections and low SPI-1 and SSI-1 values was undertaken, which compliments the correlation and quantile regression analyses above. For the winter (DJF) and summer months (JJA) we plotted the NAO and EA indices and examined the associated spatio-temporal patterns in low (negative) SPI-1 and SSI-1 values. We also calculated the frequency of mild (0 > index < −1), moderate (−1 > index < −1.5) and severe (index < −1.5) drought (Doesken and Kleist, 1993) under different combinations of NAO and EA phases.
As in previous research (e.g., Comas-Bru and McDermott; Berton et al., 2017; West et al., 2021a), the monthly teleconnection index values were classified. Months with teleconnection index values > 0.25 were classified as positive phases, whilst months with index values <−0.25 were classified as negative phases. Months with index values falling between these two thresholds were classified as neutral phases. This classification produces nine possible combinations of NAO and EA phases. Phase frequency analysis allowed us to then assess the influence of the combined teleconnections on drought conditions for each of the nine case study catchments, and to identify any associated seasonal and spatial trends.
The first stage of the research explored the individual effect of the NAO and EA on rainfall and flows using correlation and regression analyses. Figure 2 presents the analysis of monthly correlation between the NAO and SPI-1 and SSI-1 values for 291 catchments across Great Britain. The NAO has strong positive correlations between both the SPI-1 and SSI-1 in catchments in the north-western region during the winter months (DJF). In the southern and eastern catchments weaker correlations are found, although these catchments do show stronger negative NAO SPI-1/SS-1 correlations in the spring (MAM). During the summer months (JJA) more spatially consistent negative correlations are found, however differences in the SPI-1 and SSI-1 correlation time series are more pronounced. In the southern and eastern areas, catchments show stronger negative correlations between the NAO and SPI-1 than SSI-1. Autumn months (SON) are also marked by negative correlations and a transitioning back to the winter north-west/south-east pattern described above. The spatio-temporal correlation patterns indicate that in the winter months NAO− phases have an influence on meteorological drought conditions in the north-western catchments, which propagates through to hydrological drought in streamflow. In the summer months the effect of the phase of the NAO is reversed, with negative correlations indicating that NAO+ phases have a stronger meteorological drought control. However, the propagation of these negative NAO SPI-1 correlations to SSI-1 correlations varies spatially (West et al., 2022), indicating that the propagation of monthly NAO− driven meteorological drought to hydrological drought is more limited.
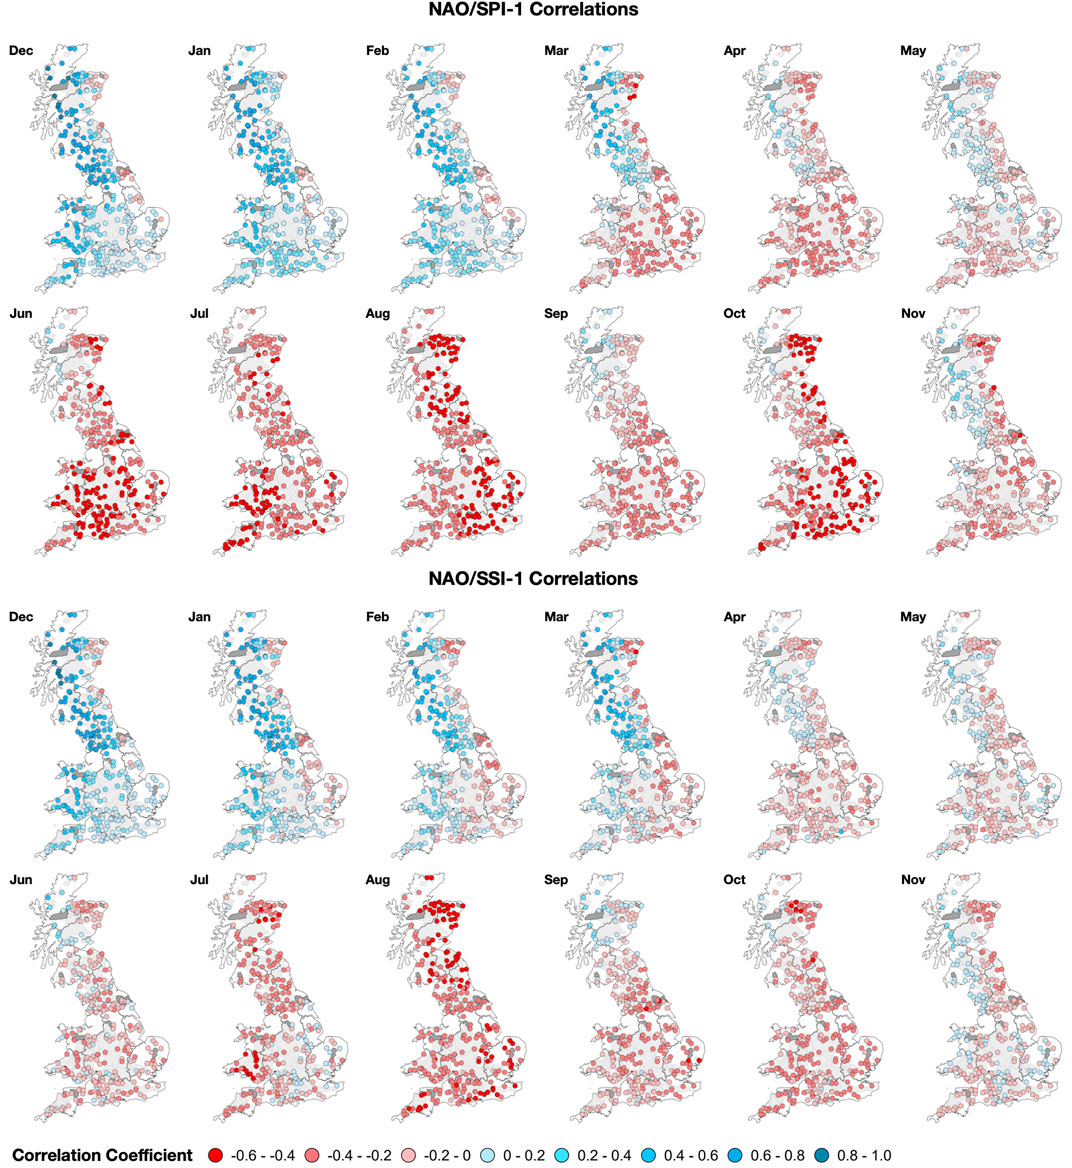
FIGURE 2. Monthly correlations between the NAO and SPI-1/SSI-1 for the 291 catchments across Great Britain. Note the difference between the significant positive correlations in the NW during winter (DJF), compared to the more spatially homogenous negative correlations in summer (JJA).
Figure 3 shows the comparable correlation monthly time series between the EA and catchment SPI-1 and SSI-1 values. Notable spatio-temporal differences between the monthly NAO time series (Figure 2) and the EA SPI-1/SSI-1 correlations were found. In the winter months (DJF) positive EA correlations are present across most of Great Britain, although coefficients generally strengthen from north to south. These positive correlations persist into the spring (MAM). The summer months (JJA) are also marked by mostly positive correlations, although of a weaker strength than in the winter months. The positive relationship of the EA index with catchment SPI-1 and SSI-1 values indicates that EA- phases are likely to be associated with meteorological drought conditions, which as with the NAO correlations, variably propagate to hydrological drought conditions.
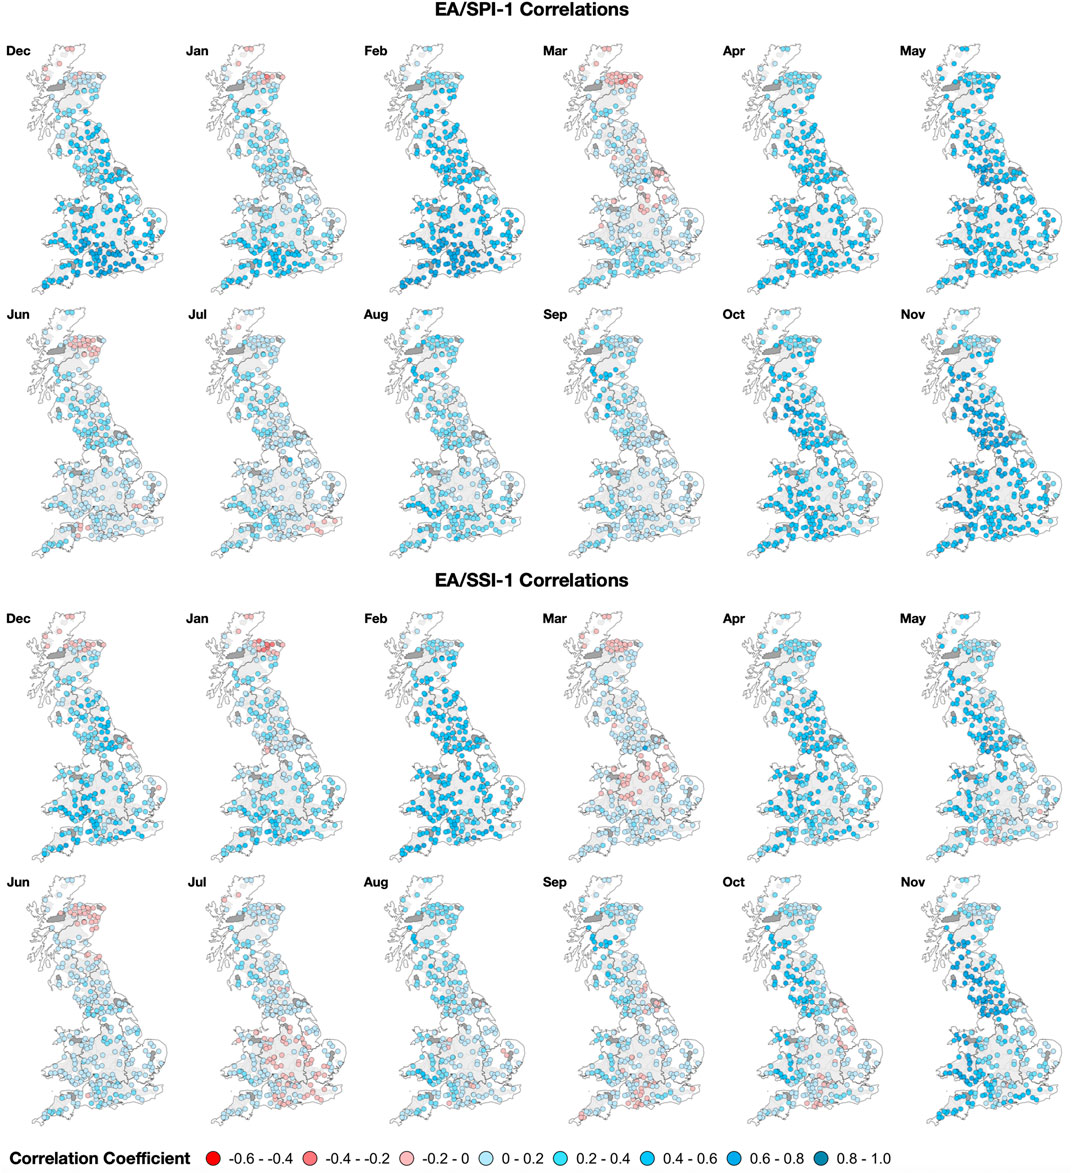
FIGURE 3. Monthly correlations between the EA and SPI-1/SSI-1 for the 291 catchments across Great Britain. Note the difference in strength between the positive correlations in the during winter (DJF) compared to the slightly weaker correlations in summer months (JJA).
Figure 4 presents the monthly correlation analyses in Figures 2, 3 for the nine case study catchments. The spatio-temporal patterns across the correlations in the case study catchments align with the above discussion. For example, in the winter months the Ness and Crew in the north-west show strong positive correlations between the NAO and SPI-1, whilst the Exe in the south has stronger winter correlations between the EA and SPI-1. As outlined above the NAO correlations are reversed in the summer months, with the majority of case study catchments showing negative correlations. Meanwhile the EA generally remains positively correlated with both SPI-1 and SSI-1 throughout the year. The moderation of rainfall-streamflow propagation is also exemplified in Figure 4 by the Lambourn catchment as it shows a stronger correlation between the EA and SPI-1 than the EA and SSI-1.
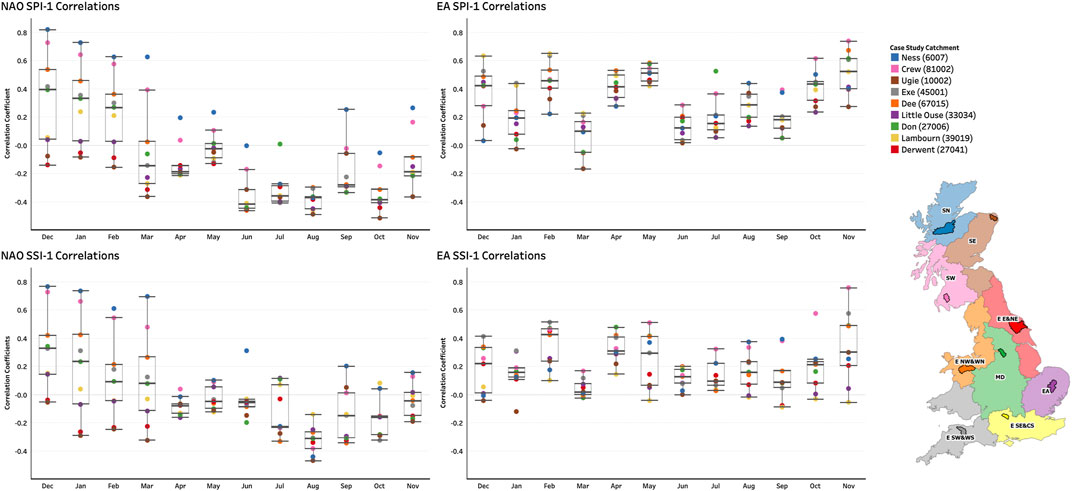
FIGURE 4. Monthly correlation analyses between the NAO/EA and catchment SPI-1 and SSI-1 values for the nine case study catchments.
Figures 5, 6 present the results of the similarity analysis between the various correlation time series for the case study catchments. In both figures the catchment is highlighted in yellow, with the remaining 290 catchments ranked from most similar to least similar. Catchments with lower values indicate those which have a greater similarity in their individual NAO and EA monthly correlation time series (mapped in full in Figures 2, 3) to those of the case study catchment. Catchments with higher values indicate those which have monthly correlation time series which are less similar to the case study catchment.
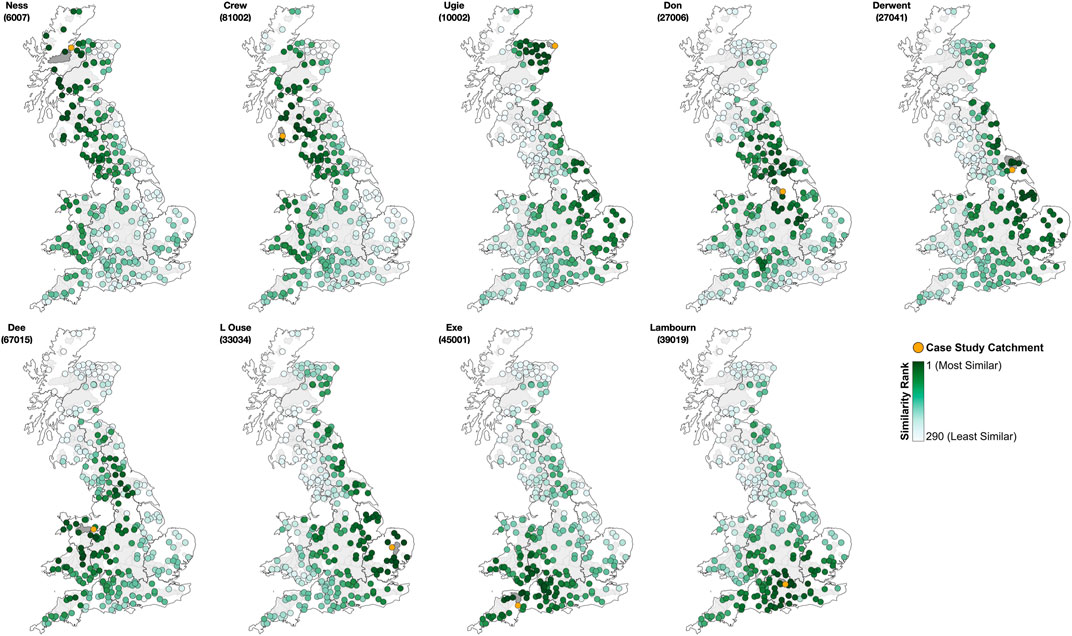
FIGURE 5. Similarity analysis results based on the NAO/EA SPI-1 correlation time series mapped in Figures 2, 3. The case study catchment is highlighted in yellow. Catchments with lower values indicate those which have greater similarity in their NAO/EA monthly correlations to those of the case study catchment. Catchments with higher values indicate those which have NAO/EA correlations which are less similar.
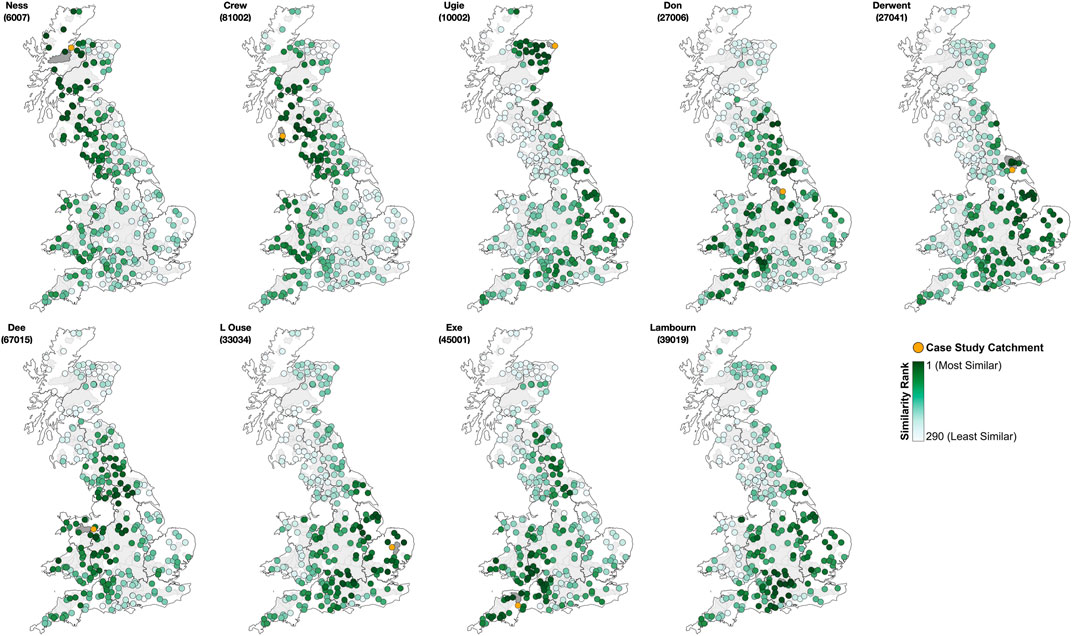
FIGURE 6. As per Figure 5, but showing the results of the similarity analysis based on the NAO/EA SSI-1 correlation time series.
Figures 5, 6 show that each case study catchment is generally well representative of its respective Climate District (Figure 1) in terms of the correlation between the two teleconnections and SPI-1 and SSI-1 values. For example, Figure 5 shows that the Ness and Crew catchments in Scotland North and Scotland West are generally representative of correlations between the two teleconnections and SPI-1 for catchments in the north-western area, and the Exe and Lambourn represent catchments in the south-west and central southern areas of Britain well.
Table 2 presents the results of the Global Morans I statistic for each of the similarity rank datasets mapped in Figures 5, 6; where the z-score is positive and p-value significant, the similarity rank values are more clustered than would be expected if the underlying spatial processes were random (Esri 2021b). Our results show that this is the case for all 18 (two per case study catchment) similarity rank value datasets. The Morans I Index provides an indication as to the strength of the spatial autocorrection, with higher values indicating greater clustering of similarity rank values.
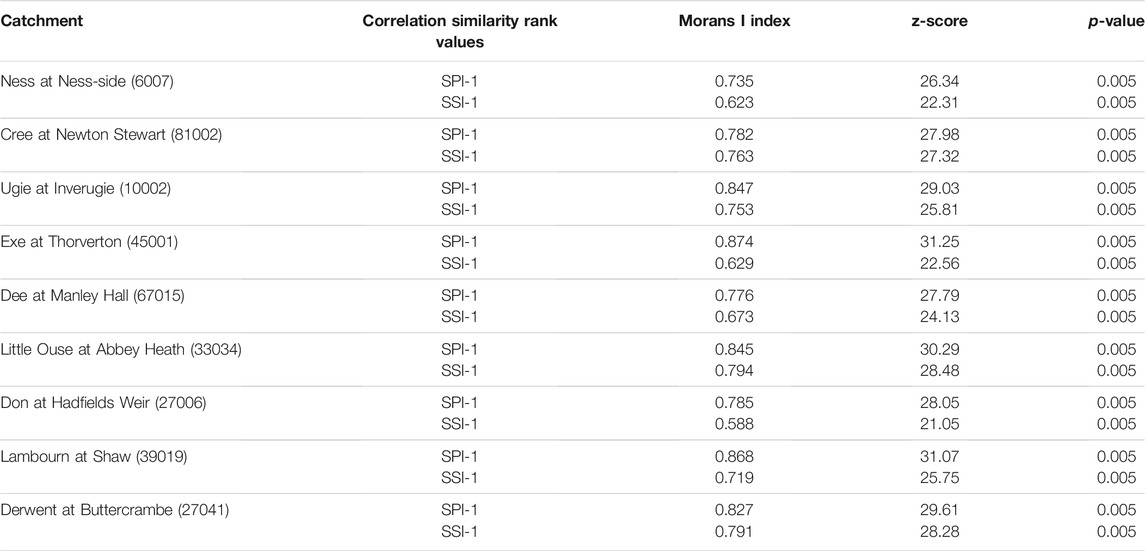
TABLE 2. Results of the Global Morans I statistical analysis for the similarity rank values mapped in Figures 5, 6. Where the z-score is positive and p-value significant then the similarity rank values are more clustered than would be expected if the underlying spatial processes were random. The Morans I Index indicates the strength of the similarity rank value clustering.
Across all nine case study catchments, the Morans I Index (Table 2) was found to be greater for the SPI-1 correlation similarity rank values than for the SSI-1 similarity rank values, although it should be noted that the SSI-1 values were still spatially autocorrelated, albeit with a weaker strength. For example, in Figure 5, for the Exe catchment we can see higher SPI-1 similarity rank values across the south-west and southern central areas, indicating more similar teleconnection SPI-1 correlations. Whilst in Figure 6 the similarity rank values for the SSI-1 correlations for the same area are more spatially variable. This is likely a result of the characteristics of catchments which may moderate rainfall-flow propagation, such as geology, terrain and landcover (Chiverton et al., 2015; Barker et al., 2016; West et al., 2022).
Figure 7 presents the results of the quantile regression analysis between the teleconnection indices and the SPI-1 and SSI-1 values for the nine case study catchments. Figure 7 shows the coefficients for quantiles <0.2. These results give an indication of the direction (sign) and strength of the statistical relationship between the NAO and EA indices and meteorological and hydrological drought conditions (i.e., low SPI-1 and SSI-1 values) in the case study catchments.
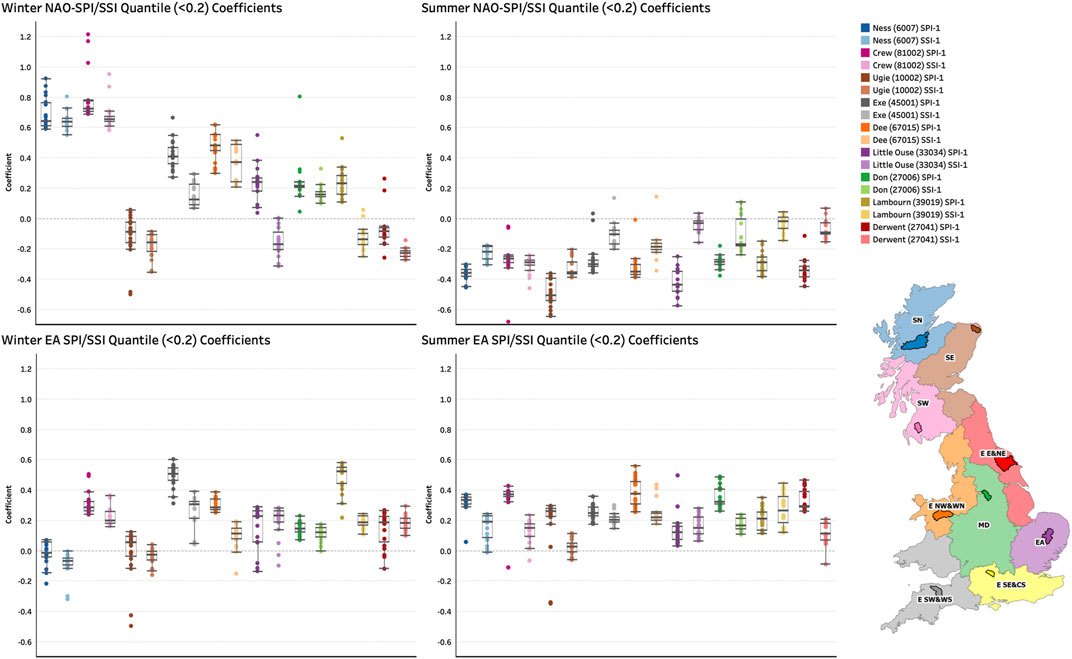
FIGURE 7. Extracted quantile coefficients between the NAO/EA indices and SPI-1/SSI-1 values. Coefficients were extracted for quantiles <0.2, the range of these quantile coefficients is represented in this figure as box plots.
As with the monthly correlation analyses (Figures 2, 3) the quantile regression coefficients for low SPI-1/SSI-1 values demonstrate the relative influences of the NAO and EA on drought conditions, which varies in space (across the country) and time (across the seasons). Catchments in the north-west (the Ness and Crew) have a very strong positive relationship between the NAO and low SPI-1 values, indicating that NAO− conditions result in meteorological droughts in these catchments. Similar relationships are observed in these catchments between the NAO and SSI-1 values. This highlights the responsive nature of catchments in this region; meteorological droughts propagate through the catchments resulting in hydrological drought. Case study catchments in the southern and central regions of Great Britain show weaker positive relationships between the NAO and drought conditions, however the EA has an equal, and in some cases such as the Exe stronger, positive EA-drought relationship.
As discussed in relation to the correlations in Figure 4, the quantile regression analysis evidences the moderating effect of catchment characteristics in limiting the propagation of meteorological to hydrological drought. For example, the Lambourn in the winter EA plot in Figure 7—where a moderately strong positive relationship between the EA and meteorological drought is not replicated with the comparable SSI-1 coefficients.
The extracted summer quantile coefficients further corroborate the monthly correlation analyses in Figure 4. The NAO has a weaker negative summer relationship with low SPI-1 values which is generally consistent across the case study catchments; suggesting that NAO+ phases, to an extent, influence summer meteorological drought. The EA retains its positive relationship, suggesting EA- phases may produce meteorological drought conditions in summer. For both teleconnections the propagation of summer meteorological to hydrological drought varies in space and time which we suggest is related to the characteristics of the catchment and the extent to which these moderate rainfall-flow propagation.
In this stage of the research, we moved beyond quantifying the individual effect of the two teleconnections to examine the combined influence of NAO and EA phases. Figure 8 shows seasonal plots for winter (DJF) and summer (JJA) of the NAO and EA indices for each case study catchment. Each point represents 1 month and is coloured based and the catchment SPI-1 value, and sized per the SSI-1 value. A large red point therefore indicates both meteorological (low SPI-1) and hydrological drought (low SSI-1) conditions, whilst a small red point suggests meteorological drought conditions, but less severe or no hydrological drought.
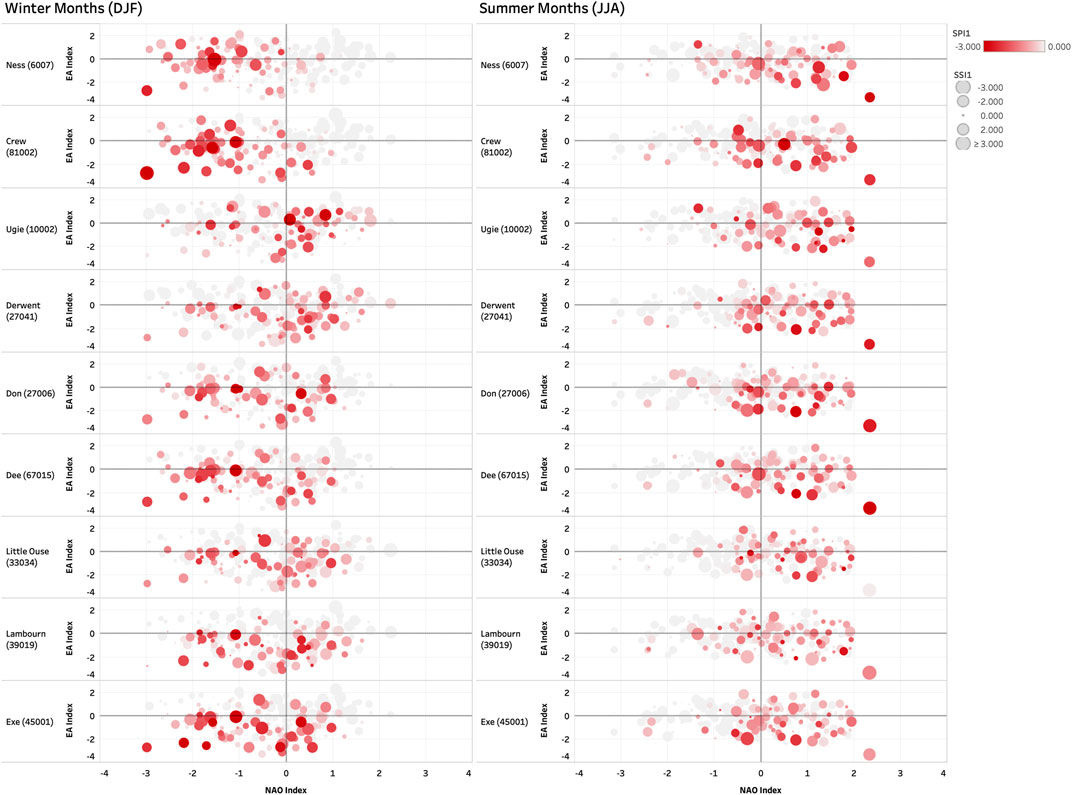
FIGURE 8. Seasonal teleconnection index plots for winter (DJF) and summer (JJA). The points are coloured by the catchment SPI-1 value, whilst the size represents the SSI-1 value. Large red points indicate both meteorological and hydrological drought, whilst a small red point suggests meteorological, but not hydrological, drought.
Figure 9 shows the percentage occurrence of dry/low flow conditions (negative SPI-1 and SSI-1 values) under each of the NAO/EA phase combinations for the winter and summer months. Figure 10 shows the distribution of these occurrences across mild, moderate and severe drought classes.
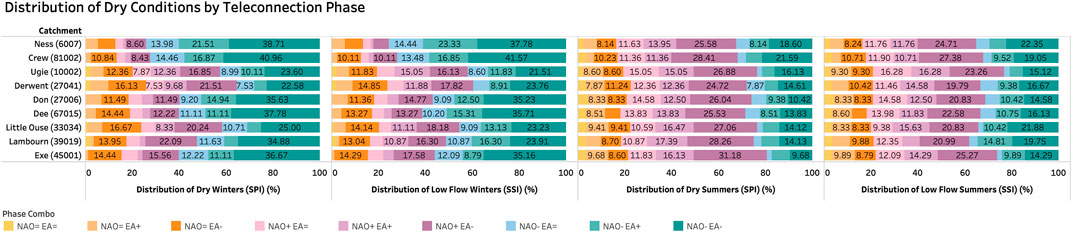
FIGURE 9. Distribution of dry events (negative SPI-1 and SSI-1 values) under different phase combinations of the NAO and EA for the winter and summer months. Values represent the percentage of time dry events occur under the different phase combinations.
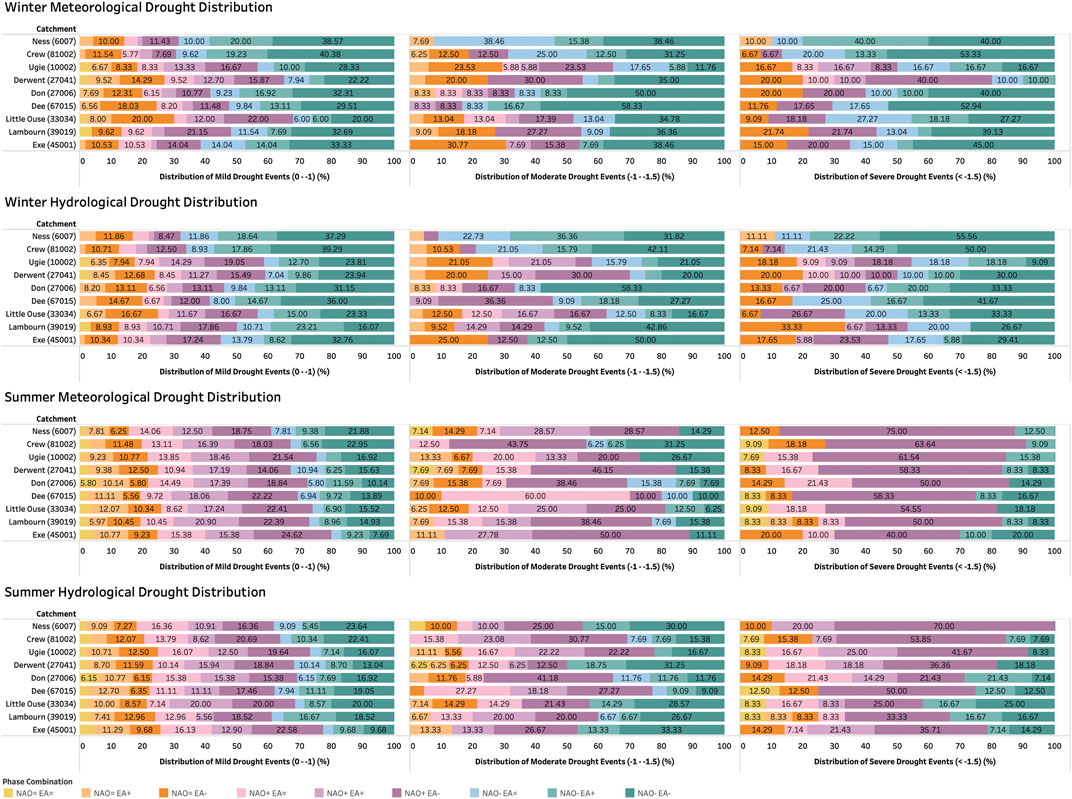
FIGURE 10. Distribution of mild (0 > index < −1), moderate (−1 > index < −1.5) and severe (index < −1.5) droughts under phases combinations of NAO and EA. Values represent the percentage of time drought events of different severities occur under the different phase combinations.
Analysis of the teleconnection indices (Figure 8) and drought severity frequency analysis (Figures 9, 10) support the correlation and regression analyses (Figures 4, 7), revealing distinctive spatio-temporal patterns in the relative influence of the NAO and EA on drought conditions in the case study catchments. Notably the occurrence of dry events when both the NAO and EA are in a weak neutral state is very low (Figure 9), highlighting the importance of the phases of the NAO and EA on the occurrence of drought in the case study catchments.
The climate districts of Scotland North and Scotland West are represented in this analysis by the Ness and Crew catchments. Figures 8–10 highlight the clear influence the NAO has on meteorological and hydrological drought conditions in these two catchments as explained by the quantile regression analysis, with NAO− phases being clearly associated with drought conditions. The effect of the EA during winter in these catchments, and north-western Scotland generally, appears to be limited. For example, in the Ness catchment during winter 68.57% of mild and 90% of severe meteorological droughts occur when the NAO is in a negative phase, independent of the phase of the EA (Figure 10). The occurrence of drought events in these catchments when the NAO is in a positive phase is minimal, with no severe meteorological droughts in the Ness associated with NAO+ phases. The occurrence of hydrological droughts in these two catchments also show a strong relationship with NAO− phases (Figures 9, 10).
In the summer months the direction of the relationship between the NAO and drought is reversed, with low rainfall/flow conditions being associated with NAO+ phases (Figure 9). Differences in the occurrences of the mild and severe drought severity classes under different phase combinations of the NAO and EA are more notable in the summer months (Figure 10). These differences are associated with the phase of the EA, suggesting that the teleconnection has a moderately stronger influence in the summer, relative to the winter months. Mild drought conditions can be associated with a larger range of NAO and EA phase combinations (Figure 10), possibly because of higher temperatures and other hydrometeorological factors/variables (Van Loon, 2015) not considered in this study. However severe meteorological drought conditions in the Ness catchment only occur when the EA is also in a negative phase, and 91% of severe droughts in the Crew are associated with EA-conditions (Figure 10). Similar relationships between the phase of the NAO and EA and hydrological drought occurrence are also observed in the Ness and Crew.
Less clear teleconnection-drought patterns are found in the Ugie catchment in Scotland East, however Figure 8 does suggest a weak relationship between drought conditions and NAO+ phases, but with greater variability than the influence of the NAO in Scotland North and Scotland West during winter as described above. Drought conditions have a similar frequency of occurrence under different NAO/EA phase combinations (Figures 9, 10). However as in the Ness and Crew catchments, in the summer months meteorological droughts have a higher frequency of occurrence when the NAO is in a positive phase, with severe meteorological droughts associated with a combination of NAO+ and EA- conditions.
The southern and central areas of Great Britain show notably different teleconnection-drought patterns to the northern/north-western catchments. The Exe catchment, representing the England South-West and Wales South Climate District, shows a stronger relationship between the EA and winter drought conditions than it does for the NAO. For example, 80% of severe meteorological droughts during winter in the Exe are associated with EA- phases (Figure 10). A very small proportion of severe meteorological droughts in the Exe are associated with a positive phase of the EA. In contrast, summer meteorological droughts have a higher rate of occurrence under NAO+ conditions. 70% of severe meteorological drought events in the Exe occur under NAO+ conditions, the majority of which are also associated with EA-phases (Figure 10).
Whilst in the Exe catchment the influence of the teleconnections on both meteorological and hydrological drought is relatively similar (Figure 9), the Lambourn catchment, representing the England South East and Central South Climate District, illustrates the role of catchment characteristics in moderating drought propagation. In terms of meteorological drought, the Lambourn has similar EA drought relationships to the Exe (demonstrated by the similarity analysis in Figure 5). However, there is a weaker teleconnection-drought relationship with flows (SSI-1). The occurrence of hydrological drought is more evenly distributed across the different phase combinations of the NAO and EA (Figures 9, 10), indicating that catchment characteristics, in the case of the Lambourn highly permeable bedrock (Table 1), limits the propagation of meteorological to hydrological drought.
Catchments in the eastern districts, the Little Ouse and Derwent, show teleconnection-drought relationships similar to the Exe and Lambourn. In the Little Ouse catchment, for example, meteorological droughts have a higher rate of occurrence under EA- conditions during winter, with 62% of dry events being associated with EA- phases (Figure 9). Summer drought relationships are also similar, for example 58.3% of severe summer meteorological droughts are associated with a combination of EA- and NAO+ phases in the Derwent (Figure 10).
Winter meteorological droughts in the Midlands and England North West and Wales North Climate Districts, represented by the Don and Dee catchments, are influenced more clearly through a combination of the NAO (which generally has a greater influence in the north-western areas) and the EA (which generally has a stronger southern influence). Winter meteorological droughts in these case study catchments are associated with both NAO− and EA- phases (Figures 8, 9). In the Dee for example, 83.34% of severe meteorological droughts in winter are associated with NAO− phases, however half of these are also associated with EA- conditions (Figure 10). Propagation to hydrological drought in the Dee is relatively clear, possibly due to low permeability bedrock and steep topography (Table 1). EA- phases have an association with droughts in these catchments during the summer months, in combination with NAO+ phases for the more severe drought classes (Figure 10).
This study aimed to explore the relative influence of the NAO and EA on meteorological drought in British catchments, and whether these rainfall deficits propagate to hydrological drought. We examine both the individual effect of the NAO and EA through correlation and regression analyses, and the frequency of drought events of varying severities under different NAO and EA phase combinations. Based on the convergence of evidence across the results of this study we make three main observations which will be discussed in turn.
The first observation relates to the variable influence of both the NAO and EA during the winter (DJF) months. Our analyses highlight that the NAO has a strong influence on meteorological drought conditions in the north-western catchments during winter, as found in previous correlation-based studies (Wilby et al., 1997; Rust et al., 2018; West et al., 2019). In these catchments NAO− phases are generally associated with meteorological droughts, shown by the Crew and Ness (Figures 8, 9). When the NAO is in a negative phase the SLP difference between the Icelandic Low and Azores High is weaker than normal resulting in a more northerly jet stream, which in turn limits the movement of low pressure systems north-westerly across the Atlantic region (Hurrell et al., 2003). This results in low rainfall over the north-western regions of Britain (West et al., 2019). In the southern, eastern and central areas the NAO has a less consistent influence on rainfall (West et al., 2021a), however strong positive correlations with the EA were found in these areas (Figures 3, 4). In the southern catchments, the Exe, Lambourn and Little Ouse, meteorological droughts are generally more associated with EA- conditions (Figures 8, 9). These findings suggest that NAO− and EA- conditions result in the driest winter conditions nationally with the NAO has a stronger meteorological drought influence in the north-western areas, whereas the EA has more influence in the southern and central areas. Moore et al. (2013) analysed the effect of the phase of the EA on the strength and location of the NAO dipoles, finding that NAO−/EA- phase combinations results in higher than average SLP at the Icelandic Low action point, and an extended area of high pressure in the region producing drier conditions.
Our second observation relates to the differences in the summer months (JJA) compared to the spatial variability described above for winter. In the summer, the NAO has a more spatially homogenous influence on rainfall in Great Britain and correlations are of the opposite sign to those in the north-west during winter (Hall and Hanna, 2018; West et al., 2019). NAO+ phases have been associated with drier summer conditions, as the North Atlantic storm track is shifted northerly, and easterly winds bring warm continental air from Europe (Folland et al., 2009). The correlation coefficients mapped in Figure 3 and quantile regression results in Figure 7 show that the effect of the EA during summer is weaker than during winter, however a positive relationship is still present for most of the 291 catchments. During the summer months there is a higher frequency of drought occurrence under NAO+ conditions across all nine case study catchments (Figure 9). However, differences in drought severity are associated with the phase of the EA, with severe meteorological droughts having a higher frequency of occurrence under a combination of NAO+ and EA-phases (Figure 10). This suggests that the phase of the EA can enhance (notably EA- conditions) or moderate drought conditions associated with summer NAO+ phases. As far as we are aware no study has yet mapped the influence of EA phases on the NAO dipoles and North Atlantic storm track during the summer months. However, if the NAO+/EA- phase combination during summer results in a similar strengthening of the Azores High as is the case in winter (Moore et al., 2013), then this may potentially explain the more extreme dry conditions found under this phase combination in this study.
Our final observation relates to the propagation of meteorological to hydrological drought, a process influenced by both climate and catchment characteristics (Van Loon and Laaha, 2015; Barker et al., 2016). Our analyses show spatio-temporal differences between the two teleconnections influence on meteorological and hydrological drought; we interpret these differences as being a function of the geography and characteristics of catchments, such as terrain, geology and landcover. In the winter in the north-west the rainfall deficits as a result of NAO− phases propagate to streamflow resulting in hydrological drought. Catchments in the north-west are responsive to rainfall due to topographic and geological characteristics (Chiverton et al., 2015) and so short meteorological droughts in this area (as identified by Tanguy et al., 2021) quickly propagate to low flows. Our analyses also identify cases where there is limited meteorological to hydrological drought propagation, particularly in catchments in the southern and central regions. For example, in the Lambourn catchment which is underlain with highly permeable bedrock (Table 1), a notably stronger EA-drought relationship was identified with rainfall than with flows (Figures 7, 9). We suggest that some catchments, depending on their geography and characteristics, are potentially more resilient to drought propagation, with the influence of the NAO and EA on both rainfall and streamflow varying in space and time due to catchment characteristics (West et al., 2022). However, we acknowledge that this observation is based on our interpretation of the difference in meteorological and hydrological drought occurrence in our analyses, and we have not undertaken an analysis explicitly quantifying the effect of catchment characteristics.
In recent years our ability to predict the NAO several months in advance has improved, especially during the winter months (Baker et al., 2018; Athanasiadis et al., 2020; Smith et al., 2020). This study demonstrates that this improved predictive ability might be useful in water resource management planning. For example, if several months in advance of winter the NAO was forecast to be in a strong negative phase, water authorities could prepare for a higher probability of meteorological and hydrological drought onset in the highly responsive catchments in the north-west.
However, NAO predictive skill has largely only improved during its stronger winter phases, and as far as we are aware, no improvements have been made in EA prediction. This has implications for regional forecasting and the inclusion of teleconnection indices in water management decision making. This is especially true in the southern, central and eastern regions where our analysis demonstrates the clear influence of the EA on meteorological and, more variably, hydrological drought conditions, particularly in the summer months where the phase of the EA can enhance or lessen drought severity associated with NAO+ phases. Our analysis therefore supports the findings of Hall and Hanna (2018), who suggest that even highly accurate NAO forecasts might have a limited role in water management decision making especially in the southern, central and eastern areas of Great Britain, and Comas-Bru and McDermott (2014), who suggest that a combination of both the NAO and EA may be able to explain (hydro)climatic variability more accurately.
In this study we have used relatively new long-term historic datasets for rainfall and flows (Tanguy et al., 2017; Barker et al., 2018) to explore associations between the NAO and EA on monthly drought conditions in British catchments. There is scope to utilise these datasets and the analytical approaches used in this study to explore how the NAO/EA-drought relationship has changed over time and might change in the future with climate change, especially given the positive EA index trend identified in studies (Mikhailova and Yurovsky, 2016). Further in this study we have explored a specific monthly drought scenario relating to the monthly teleconnection indices (NOAA, 2021). As the SPI/SSI datasets used in this study have indices published over longer accumulation periods (representing different drought duration/severity) there is potential to explore the association between teleconnections and rainfall/flows over different periods of time. Future research might also explore the association of drought conditions in catchments with other atmospheric-oceanic circulations such as the Scandinavian Pattern and East Atlantic/West Russia Pattern for which monthly indices are modelled by NOAA (NOAA, 2021) and rainfall correlations have been found across the North Atlantic and European region (Krichak and Alpert, 2005; Comas-Bru and McDermott, 2014).
This study aimed to explore the influence of the NAO and EA North Atlantic teleconnections on meteorological drought in British catchments, and the extent to which these rainfall deficits propagate through catchments resulting in hydrological drought. Based on evidence from our analyses we highlight three main observations from this study:
1) During the winter months there is spatial variability in the relative influence of the NAO and EA on drought conditions, with NAO− phases resulting in higher drought probability in the north-western areas (regardless of EA phase), and EA- phases being associated with higher drought probability in the southern and central areas.
2) There is less spatial variation in the relative influence of the NAO and EA during the summer months, with drought conditions associated with NAO+ phases across most catchments. Although we find that the phase of the EA can moderate or enhance this, with severe meteorological droughts being associated with a combination of NAO+ and EA- phases.
3) There is spatio-temporal variability in the propagation of meteorological to hydrological drought, with streamflow in catchments in the north-west typically being more responsive to rainfall deficits, whilst catchments in the southern and central regions have higher hydrological drought resilience.
Our study has implications relating to the role of monthly teleconnection forecasts in water management decision making in Great Britain, however, we acknowledge the current limitations associated with incorporating such understanding.
Publicly available datasets were analyzed in this study. This data can be found here: SPI Data: https://catalogue.ceh.ac.uk/documents/233090b2-1d14-4eb9-9f9c-3923ea2350ff. SSI Data: https://catalogue.ceh.ac.uk/documents/58ef13a9-539f-46e5-88ad-c89274191ff9. NAO/EA Data: https://www.cpc.ncep.noaa.gov/data/teledoc/telecontents.shtml.
HW, NQ, and MH contributed to the conception and design of this research. HW completed the data generation, analysis, and presentation of the results. Initial findings were shared by HW and refined amongst all authors. HW led on the writing of the manuscript, with commentary and feedback from all authors throughout the writing process. All authors agreed the submitted version of the manuscript.
The authors declare that the research was conducted in the absence of any commercial or financial relationships that could be construed as a potential conflict of interest.
All claims expressed in this article are solely those of the authors and do not necessarily represent those of their affiliated organizations, or those of the publisher, the editors and the reviewers. Any product that may be evaluated in this article, or claim that may be made by its manufacturer, is not guaranteed or endorsed by the publisher.
Abiy, A. Z., Melesse, A. M., and Abtew, W. (2019). Teleconnection of Regional Drought to ENSO, PDO, and AMO: Southern Florida and the Everglades. Atmosphere 10 (6), 295. doi:10.3390/atmos10060295
Afzal, M., Gagnon, A. S., and Mansell, M. G. (2015). Changes in the Variability and Periodicity of Precipitation in Scotland. Theor. Appl. Climatol 119, 135–159. doi:10.1007/s00704-014-1094-2
Amini, M., Ghadami, M., Fathian, F., and Modarres, R. (2020). Teleconnections between Oceanic-Atmospheric Indices and Drought over Iran Using Quantile Regressions. Hydrological Sci. J. 65 (13), 2286–2295. doi:10.1080/02626667.2020.1802029
Athanasiadis, P. J., Yeager, S., Kwon, Y.-O., Bellucci, A., Smith, D. W., and Tibaldi, S. (2020). Decadal Predictability of North Atlantic Blocking and the NAO. Npj Clim. Atmos. Sci. 3, 20. doi:10.1038/s41612-020-0120-6
Bachmair, S., Stahl, K., Collins, K., Hannaford, J., Acreman, M., Svoboda, M., et al. (2016). Drought Indicators Revisited: The Need for a Wider Consideration of Environment and Society. WIREs Water 3, 516–536. doi:10.1002/wat2.1154
Baker, L. H., Shaffrey, L. C., and Scaife, A. A. (2018). Improved Seasonal Prediction of UK Regional Precipitation Using Atmospheric Circulation. Int. J. Climatology 38, 437–453. doi:10.1002/joc.5382
Barker, L. J., Hannaford, J., Chiverton, A., and Svensson, C. (2016). From Meteorological to Hydrological Drought Using Standardised Indicators. Hydrol. Earth Syst. Sci. 20, 2483–2505. doi:10.5194/hess-20-2483-2016
Barker, L. J., Hannaford, J., Parry, S., Smith, K. A., Tanguy, M., and Prudhomme, C. (2019). Historic Hydrological Droughts 1891-2015: Systematic Characterisation for a Diverse Set of Catchments across the UK. Hydrol. Earth Syst. Sci. 23, 4583–4602. doi:10.5194/hess-23-4583-2019
Barker, L. J., Smith, K. A., Svensson, C., Tanguy, M., and Hannaford, J. (2018). Historic Standardised Streamflow Index (SSI) Using Tweedie Distribution with Standard Period 1961-2010 for 303 UK Catchments (1891-2015). NERC Environmental Information Data Centre. doi:10.5285/58ef13a9-539f-46e5-88ad-c89274191ff9
Barnston, A. G., and Livezey, R. E. (1987). Classification, Seasonality and Persistence of Low-Frequency Atmospheric Circulation Patterns. Mon. Wea. Rev. 115, 1083–1126. doi:10.1175/1520-0493(1987)115<1083:csapol>2.0.co;2
Berton, R., Driscoll, C. T., and Adamowski, J. F. (2017). The Near-Term Prediction of Drought and Flooding Conditions in the Northeastern United States Based on Extreme Phases of AMO and NAO. J. Hydrol. 553, 130–141. doi:10.1016/j.jhydrol.2017.07.041
Burt, T. P., and Howden, N. J. K. (2013). North Atlantic Oscillation Amplifies Orographic Precipitation and River Flow in upland Britain. Water Resour. Res. 49, 3504–3515. doi:10.1002/wrcr.20297
Casanueva, A., Rodríguez-Puebla, C., Frías, M. D., and González-Reviriego, N. (2014). Variability of Extreme Precipitation over Europe and its Relationships with Teleconnection Patterns. Hydrol. Earth Syst. Sci. 18, 709–725. doi:10.5194/hess-18-709-2014
Chiverton, A., Hannaford, J., Holman, I., Corstanje, R., Prudhomme, C., Bloomfield, J., et al. (2015). Which Catchment Characteristics Control the Temporal Dependence Structure of Daily River Flows? Hydrol. Process. 29 (6), 1353–1369. doi:10.1002/hyp.10252
Comas-Bru, L., and McDermott, F. (2014). Impacts of the EA and SCA Patterns on the European Twentieth century NAO-winter Climate Relationship. Q.J.R. Meteorol. Soc. 140679, 354–363. doi:10.1002/qj.2158
Dhurmea, K. R., Boojhawon, R., and Rughooputh, S. D. D. V. (2019). A Drought Climatology for Mauritius Using the Standardized Precipitation index. Hydrological Sci. J. 64 (2), 227–240. doi:10.1080/02626667.2019.1570209
Doesken, N. J., and Kleist, J. (1993). “The Relationship of Drought Frequency and Duration to Time Scales,” in Proceedings of the 8th Conference on Applied Climatology, Anaheim, California, 17-22 January 1993, 17, 179–183.
Donegan, S., Murphy, C., Harrigan, S., Broderick, C., Foran Quinn, D., Golian, S., et al. (2021). Conditioning Ensemble Streamflow Prediction with the North Atlantic Oscillation Improves Skill at Longer lead Times. Hydrol. Earth Syst. Sci. 25, 4159–4183. doi:10.5194/hess-25-4159-2021
Esri (2021c). Modeling Spatial Relationships. [ONLINE]. Available at: https://pro.arcgis.com/en/pro-app/latest/tool-reference/spatial-statistics/modeling-spatial-relationships.htm#GUID-729B3B01-6911-41E9-AA99-8A4CF74EEE27 (Accessed 07 24, 2021).
Esri (2021a). Similarity Search. [ONLINE]. Available at: https://pro.arcgis.com/en/pro-app/latest/tool-reference/spatial-statistics/similarity-search.htm (Accessed 05 07, 2021).
Esri (2021b). Spatial Autocorrelation (Global Morans I). [ONLINE]. Available at: https://pro.arcgis.com/en/pro-app/latest/tool-reference/spatial-statistics/spatial-autocorrelation.htm (Accessed 05 11, 2021).
Folland, C. K., Hannaford, J., Bloomfield, J. P., Kendon, M., Svensson, C., Marchant, B. P., et al. (2015). Multi-annual Droughts in the English Lowlands: a Review of Their Characteristics and Climate Drivers in the winter Half-Year. Hydrol. Earth Syst. Sci. 19, 2353–2375. doi:10.5194/hess-19-2353-2015
Folland, C. K., Knight, J., Linderholm, H. W., FeredayIneson, D. S., Ineson, S., and Hurrell, J. W. (2009). The Summer North Atlantic Oscillation: Past, Present, and Future. J. Clim. 22, 1082–1103. doi:10.1175/2008jcli2459.1
Fowler, H. J., and Kilsby, C. G. (2002). Precipitation and the North Atlantic Oscillation: a Study of Climatic Variability in Northern England. Int. J. Climatol. 22, 843–866. doi:10.1002/joc.765
Hall, R. J., and Hanna, E. (2018). North Atlantic Circulation Indices: Links with Summer and winter Temperature and Precipitation and Implications for Seasonal Forecasting. Int. J. Climatology 38 (S1), 660–677. doi:10.1002/joc.5398
Hannaford, J., Lloyd-Hughes, B., Keef, C., Parry, S., and Prudhomme, C. (2011). Examining the Large-Scale Spatial Coherence of European Drought Using Regional Indicators of Precipitation and Streamflow Deficit. Hydrol. Process. 25, 1146–1162. doi:10.1002/hyp.7725
Hassan, W. U., and Nayak, M. A. (2021). Global Teleconnections in Droughts Caused by Oceanic and Atmospheric Circulation Patterns. Environ. Res. Lett. 16, 014007.
Huang, S., Li, P., Huang, Q., Leng, G., Hou, B., and Ma, L. (2017). The Propagation from Meteorological to Hydrological Drought and its Potential Influence Factors. J. Hydrol. 547, 184–195. doi:10.1016/j.jhydrol.2017.01.041
Hurrell, J. W., Kushnir, Y., Ottersen, G., and Visbeck, M. (2003). “An Overview of the North Atlantic Oscillation,” in The North Atlantic Oscillation: Climate Significance and Environmental Impact. Editors J. W. Hurrell, Y. G. KushnirIttersen, and M. Visbeck (Washington D.C: AGU Geophysical Monograph Series), 134. doi:10.1029/134gm01
Hurrell, J. W., and Van Loon, H. (1997). Decadal Variations in Climate Associated with the North Atlantic Oscillation. Climatic Change 36 (3-4), 301–326. doi:10.1007/978-94-015-8905-5_4
Irannezhad, M., Torabi Haghighi, A., Chen, D., and Kløve, B. (2015). Variability in Dryness and Wetness in central Finland and the Role of Teleconnection Patterns. Theor. Appl. Climatol 122, 471–486. doi:10.1007/s00704-014-1305-x
Krichak, S. O., and Alpert, P. (2005). Decadal Trends in the East Atlantic-West Russia Pattern and Mediterranean Precipitation. Int. J. Climatol. 25, 183–192. doi:10.1002/joc.1124
Lavers, D. A., Hannah, D. M., and Bradley, C. (2015). Connecting Large-Scale Atmospheric Circulation, River Flow and Groundwater Levels in a Chalk Catchment in Southern England. J. Hydrol. 523, 179–189. doi:10.1016/j.jhydrol.2015.01.060
Mehr, A. D., Sorman, A. U., Kahya, E., and Hesami Afshar, M. (2020). Climate Change Impacts on Meteorological Drought Using SPI and SPEI: Case Study of Ankara, Turkey. Hydrological Sci. J. 65 (2), 254–268. doi:10.1080/02626667.2019.1691218
Mellado-Cano, J., Barriopedro, D., García-Herrera, R., Trigo, R. M., and Hernández, A. (2019). Examining the North Atlantic Oscillation, East Atlantic Pattern, and Jet Variability since 1685. J. Clim. 32, 6285–6298. doi:10.1175/jcli-d-19-0135.1
Mellado-Cano, J., Barriopedro, D., García-Herrera, R., and Trigo, R. M. (2020). New Observational Insights into the Atmospheric Circulation over the Euro-Atlantic Sector since 1685. Clim. Dyn. 54, 823–841. doi:10.1007/s00382-019-05029-z
Mikhailova, N. V., and Yurovsky, A. V. (20162016). The East Atlantic Oscillation: Mechanism and Impact on the European Climate in Winter. PhO 4, 25–33. doi:10.22449/1573-160X-2016-4-25-33
Moore, G. W. K., Pickart, R. S., and Renfrew, I. A. (2011). Complexities in the Climate of the Subpolar North Atlantic: A Case Study from the winter of 2007. Q.J.R. Meteorol. Soc. 137, 757–767. doi:10.1002/qj.778
Moore, G. W. K., and Renfrew, I. A. (2012). Cold European winters: Interplay between the NAO and the East Atlantic Mode. Atmosph. Sci. Lett. 13 (1), 1–8. doi:10.1002/asl.356
Moore, G. W. K., Renfrew, I. A., and Pickart, R. S. (2013). Multidecadal Mobility of the North Atlantic Oscillation. J. Clim. 26, 2453–2466. doi:10.1175/jcli-d-12-00023.1
NOAA (2021). East Atlantic Pattern. [ONLINE]. Availabble at: https://www.cpc.ncep.noaa.gov/data/teledoc/ea.shtml (Accessed 03 17, 2021).
Oñate-Valdivieso, F., UchuariOnate-Paladines, V. A., and Oñate-Paladines, A. (2020). Large-Scale Climate Variability Patterns and Drought: A Case of Study in South - America. Water Resour. Manage. 34, 2061–2079. doi:10.1007/s11269-020-02549-w
Parker, T., Woollings, T., Weisheimer, A., O'Reilly, C., Baker, L., and Shaffrey, L. (2019). Seasonal Predictability of the winter North Atlantic Oscillation from a Jet Stream Perspective. Geophys. Res. Lett. 46 (16), 10159–10167. doi:10.1029/2019gl084402
Parry, S., Wilby, R. L., Prudhomme, C., and Wood, P. J. (2016). A Systematic Assessment of Drought Termination in the United Kingdom. Hydrol. Earth Syst. Sci. 20, 4265–4281. doi:10.5194/hess-20-4265-2016
Parsons, D. J., Rey, D., Tanguy, M., and Holman, I. P. (2019). Regional Variations in the Link between Drought Indices and Reported Agricultural Impacts of Drought. Agric. Syst. 173, 119–129. doi:10.1016/j.agsy.2019.02.015
Pokorná, L., and Huth, R. (2015). Climate Impacts of the NAO Are Sensitive to How the NAO Is Defined. Theor. Appl. Climatology 119 (3-4), 639–652. doi:10.1007/s00704-014-1116-0
Rodwell, M. J., Rowell, D. P., and Folland, C. K. (1999). Oceanic Forcing of the Wintertime North Atlantic Oscillation and European Climate. Nature 398, 320–323. doi:10.1038/18648
Rust, W., Bloomfield, J. P., Cuthbert, M., Corstanje, R., and Holman, I. P. (2021b). Non-stationary Control of the NAO on European Rainfall and its Implications for Water Resources Management. Hydrological Process. 35 (3), e14099. doi:10.1002/hyp.14099
Rust, W., Cuthbert, M., Bloomfield, J., Corstanje, R., Howden, N., and Holman, I. (2021a). Exploring the Role of Hydrological Pathways in Modulating Multi-Annual Climate Teleconnection Periodicities from UK Rainfall to Streamflow. Hydrol. Earth Syst. Sci. 25, 2223–2237. doi:10.5194/hess-25-2223-2021
Rust, W., Holman, I., Bloomfield, J., Cuthbert, M., and Corstanje, R. (2019). Understanding the Potential of Climate Teleconnections to Project Future Groundwater Drought. Hydrol. Earth Syst. Sci. 23, 3233–3245. doi:10.5194/hess-23-3233-2019
Rust, W., Holman, I., Corstanje, R., Bloomfield, J., and Cuthbert, M. (2018). A Conceptual Model for Climatic Teleconnection Signal Control on Groundwater Variability in Europe. Earth-Science Rev. 177, 164–174. doi:10.1016/j.earscirev.2017.09.017
Simpson, I. R., and Jones, P. D. (2014). Analysis of UK Precipitation Extremes Derived from Met Office Gridded Data. Int. J. Climatol. 34, 2438–2449. doi:10.1002/joc.3850
Smith, D. M., Scaife, A. A., Eade, R., Athanasiadis, P., Bellucci, A., Bethke, I., et al. (2020). North Atlantic Climate Far More Predictable Than Models Imply. Nature 583, 796–800. doi:10.1038/s41586-020-2525-0
Smith, K. A., Tanguy, M., Hannaford, J., and Prudhomme, C. (2018). Historic Reconstructions of Daily River Flow for 303 UK Catchments (1891-2015). NERC Environmental Information Data Centre. doi:10.5285/f710bed1-e564-47bf-b82c-4c2a2fe2810e
Svensson, C., and Hannaford, J. (2019). Oceanic Conditions Associated with Euro-Atlantic High Pressure and UK Drought. Environ. Res. Commun. 1, 101001. doi:10.1088/2515-7620/ab42f7
Sweeney, J. C., and O'Hare, G. P. (1992). Geographical Variations in Precipitation Yields and Circulation Types in Britain and Ireland. Trans. Inst. Br. Geogr. 17 (4), 448–463. doi:10.2307/622710
Tanguy, M., Fry, M., Svensson, C., and Hannaford, J. (2017). Historic Gridded Standardised Precipitation Index for the United Kingdom 1862-2015 (Generated Using Gamma Distribution with Standard Period 1961-2010) V4. NERC Environmental Information Data Centre. doi:10.5285/233090b2-1d14-4eb9-9f9c-3923ea2350ff
Tanguy, M., Haslinger, K., Svensson, C., Parry, S., Barker, L. J., Hannaford, J., et al. (2021). Regional Differences in Spatiotemporal Drought Characteristics in Great Britain. Front. Environ. Sci. 9, 639649. doi:10.3389/fenvs.2021.639649
UK Hydrological Outlook (2020). UK Hydrological Outlook December 2020. [ONLINE]Available at: http://www.hydoutuk.net/files/2816/0743/4122/2020_12_HO_Complete.pdf (Accessed 1412, 2020).
Van Loon, A. F. (2015). Hydrological Drought Explained. WIREs Water 2 (4), 359–392. doi:10.1002/wat2.1085
Van Loon, A. F., and Laaha, G. (2015). Hydrological Drought Severity Explained by Climate and Catchment Characteristics. J. Hydrol. 526, 3–14. doi:10.1016/j.jhydrol.2014.10.059
Van Loon, A. F., Stahl, K., Di Baldassarre, G., Clark, J., Rangecroft, S., Wanders, N., et al. (2016). Drought in a Human-Modified World: Reframing Drought Definitions, Understanding, and Analysis Approaches. Hydrol. Earth Syst. Sci. 20, 3631–3650. doi:10.5194/hess-20-3631-2016
West, H., Quinn, N., and Horswell, M. (2021b). Monthly Rainfall Signatures of the North Atlantic Oscillation and East Atlantic Pattern in Great Britain. Atmosphere 1211, 1533. doi:10.3390/atmos12111533
West, H., Quinn, N., and Horswell, M. (2019). Regional Rainfall Response to the North Atlantic Oscillation (NAO) across Great Britain. Hydrol. Res. 50 (6), 1549–1563. doi:10.2166/nh.2019.015
West, H., Quinn, N., and Horswell, M. (2022). Spatio-Temporal Propagation of North Atlantic Oscillation (NAO) Rainfall Deviations to Streamflow in British Catchments. Hydrological Sci. J.. Accepted – Awaiting. doi:10.1080/02626667.2022.2038791
West, H., Quinn, N., and Horswell, M. (2021a). Spatio-Temporal Variability in North Atlantic Oscillation Monthly Rainfall Signatures in Great Britain. Atmosphere 126, 763. doi:10.3390/atmos12060763
Wilby, R. L., and Johnson, M. F. (2020). Climate Variability and Implications for Keeping Rivers Cool in England. Clim. Risk Manage. 30, 100259. doi:10.1016/j.crm.2020.100259
Wilby, R. L., O'Hare, G., and Barnsley, N. (1997). The North Atlantic Oscillation and British Isles Climate Variability, 1865-1996. Weather 52 (9), 266–276. doi:10.1002/j.1477-8696.1997.tb06323.x
Wilhite, D. A., and Glantz, M. H. (1985). Understanding: the Drought Phenomenon: The Role of Definitions. Water Int. 103, 111–120. doi:10.1080/02508068508686328
Keywords: drought, North Atlantic Oscillation, East Atlantic Pattern, climate, teleconnections, hydrology
Citation: West H, Quinn N and Horswell M (2022) The Influence of the North Atlantic Oscillation and East Atlantic Pattern on Drought in British Catchments. Front. Environ. Sci. 10:754597. doi: 10.3389/fenvs.2022.754597
Received: 06 August 2021; Accepted: 23 February 2022;
Published: 17 March 2022.
Edited by:
Zoe Courville, Cold Regions Research and Engineering Laboratory, United StatesReviewed by:
Lenin Campozano, Escuela Politécnica Nacional, EcuadorCopyright © 2022 West, Quinn and Horswell. This is an open-access article distributed under the terms of the Creative Commons Attribution License (CC BY). The use, distribution or reproduction in other forums is permitted, provided the original author(s) and the copyright owner(s) are credited and that the original publication in this journal is cited, in accordance with accepted academic practice. No use, distribution or reproduction is permitted which does not comply with these terms.
*Correspondence: Harry West, aGFycnkud2VzdEB1d2UuYWMudWs=
Disclaimer: All claims expressed in this article are solely those of the authors and do not necessarily represent those of their affiliated organizations, or those of the publisher, the editors and the reviewers. Any product that may be evaluated in this article or claim that may be made by its manufacturer is not guaranteed or endorsed by the publisher.
Research integrity at Frontiers
Learn more about the work of our research integrity team to safeguard the quality of each article we publish.