 Elisa Maria Christovam1
 Jefferson Honorio Franco2*
 Guilherme Julião Zocolo3
 Ana Marisa Fusco Almeida4Monica Yonashiro Marcelino4
 Danielle Palma de Oliveira5Maria Valnice Boldrin Zanoni1
- 1Institute of Chemistry, State University “Julio de Mesquita Filho”—UNESP—Avenida Professor Francisco Degni, Araraquara, Brazil
- 2Department of Chemistry, Faculty of Philosophy Sciences and Letters at Ribeirão Preto, University of São Paulo, Ribeirão Preto, Brazil
- 3Embrapa Agroindústria Tropical, Fortaleza, Brazil
- 4Departamento de Análises Clínicas, Faculdade de Ciências Farmacêuticas, State University “Julio de Mesquita Filho”—UNESP—Rua Expecionários Do Brasil, Araraquara, Brazil
- 5Faculdade de Ciências Farmacêuticas, University of São Paulo, São Paulo, Brazil
The present work investigates the occurrence of the Acid Black 210 (AB210) dye and its subproducts in the tannery industry by analytical techniques. The AB210 is an important dye characterized by three azo groups as a chromophore and is one of the most used azo dyes in the tannery industry. The stability of AB210 in front of chlorination, sunlight exposition, and ambient conditions was investigated, as well as its occurrence and degradation products in the tannery wastewater. The stability study of AB210 showed a decrease in dye concentration of up to 45% after 14 days at room temperature. The exposure of the AB 210 by a solar simulator for 3 h showed discoloration of the dye. Furthermore, the chlorination of the AB210 caused a reduction of 25% in the intensity of the absorption band at the visible region after 300 s of treatment with sodium hypochlorite (NaClO). Studies based on high-performance liquid chromatography (HPLC-DAD), liquid chromatography-mass spectrometry (LC-MS/MS), and nuclear magnetic resonance (NMR) have indicated the occurrence of several harmful compounds such as benzene, cresol, naphthalene, phenol, 2-naphthylamine, and phenylacetic acid, and three aromatic amines, 2-naphthylamine, 2,6-dimethylaniline and 4-nitroaniline from the tannery industry. The cytotoxicity assay showed toxicity for the samples stored for a long period. Thus, the immortalized human keratinocyte (HaCAT) and 3T3 cells assays for the AB210 stored for 14 days showed 70% cell death in both strains evaluated. Our results demonstrated that the AB210 degradation is a great environmental concern due to increased toxicity for the body of living beings, especially for humans, as their biotransformation produces harmful compounds such as amines, which have been widely condemned by the International Agency for Research on Cancer.
1 Introduction
The tanyard process is one of the most important system involved in the leather industry (Bień et al., 2017). Although the production of leather is one of the oldest procedures in the world, tannery wastewaters raise great concern due to the occurrence of high amounts of chemical additives used in regular processes, as: acids, chromium, dyes, salts, surfactants, and many others (Ortega et al., 2005) (Oral et al., 2007) (Paschoal et al., 2009) (Kurade et al., 2017) (Kurade et al., 2019). Among them, dyes presented in tannery wastewaters constitute a substantial source of pollution, as they can be related to ecotoxicity, high chemical oxygen demand, and strong color content, which interferes with the aquatic biota.
The use of acid dyes bearing azo groups is very popular in the leather industry as they are easily fixed on leather by ionic forces between an anionic dye (negative charge) and a cationic protein from collagens colloids with positive charge in acid conditions. All chemicals and unbouded dyes constitute a very complex effluent that can reach superficial waters if not conveniently treated (Rocha et al., 2017).
Acid Black 210 (C.I.300285) belongs to the trisazo class of dyes, which are widely used to color leather, wool, silk, polyamide fiber, and printing (Venkata Mohan et al., 2007). Literature (Rocha et al., 2017) reports that AB210 is a safe product with low mutagenic potency in assays based on the Ames test with the Salmonella typhimurium TA98 strain. Electrochemical oxidation (Costa et al., 2009) and sonochemical decolorization (Li et al., 2008) are some examples of physico-chemical methods that promote the oxidation of AB 210. In addition, the AB210 can also be metabolized by several microorganisms: consortium SV5 (Mathew and Madamwar, 2004), Cladosporium cladosporioides (Vijaykumar et al., 2006), Bacillus thuriengiensis, Providencia sp (Dave and Dave, 2009), Providencia sp. SRS82 (Agrawal et al., 2014), and by advanced oxidative processes, such as O3 and O3/UV (Bonfante de Carvalho et al., 2018). However, there is no indication regarding the subproducts generated in all these processes and there is an ecotoxicological concern about the possible products generated after the degradation of AB210.
Similarly to other dyes (de Aragão Umbuzeiro et al., 2005b) (de Aragão Umbuzeiro et al., 2005a) it is quite possible that AB210 when exposed to solar radiation, chlorination, or photolysis reactions, generates subproducts from the cleavage of trisazo groups and aromatic amines (Bafana et al., 2011). Thus, after ineffective treatments, dyes and their degradation products can end up in effluents (Ogugbue and Sawidis, 2011) and even at very low concentrations, can induce mutagenic or carcinogenic effects on aquatic organisms and humans (de Aragão Umbuzeiro et al., 2005b) (de Aragão Umbuzeiro et al., 2005a). Therefore, it should be necessary to monitor not only the original dye occurrence but the likely products generated under the mimic biota conditions.
In the last years, different authors have studied the risk assessment of different wastewaters. Tigini et al. (Tigini et al., 2011) performed a battery of bio tests in effluents and pointed out that the interaction effect between dyes (including AB210) and salts resulted in a synergistic effect of toxicity. Among the few studies obtained for toxicity of the AB210, Rocha et al. (Rocha et al., 2017) reported that AB210 presented no genotoxic effects on the HepG2 cells at concentrations between 0.5 and 5,000 μg/ml by comet assay.
The available ecotoxicological risk assessment data in the literature for AB 210 are insufficient or non-existent (Bruschweiler et al., 2014) (Agrawal et al., 2014), but has been quoted as a non-regulated dye with toxicological concern, since it could generate carcinogenic aromatic amines (Rocha et al., 2017). Previous studies have pointed out that cleavage of AB210 can produce 4-nitroaniline, which is classified as a human carcinogen (Venkata Mohan et al., 2007) (Bruschweiler et al., 2014). Moreover, the biotransformation of AB 210 and the identification of degradation intermediates and/or products have not been reported by analytical techniques. Therefore, it is highly relevant to develop new analytical methods for the detection of AB 210 in environmental samples from effluent discharge from a tannery industry.
In order to mimetize the behavior of the AB210 when released in effluents and reaching the aquatic biota, the present work aims to assess the main products from the degradation of AB210 aqueous solution. The AB210 half-lifetime when exposed to room temperature and several conditions, such as chlorination and sunlight conditions were also evaluated. The AB210 and their degradation products were evaluated by analytical techniques such as UV-Vis spectrophotometry, HPLC-DAD, LC-MS/MS, NMR, and cytotoxicity by human immortalized keratinocytes (HaCaT) and BALB/c 3T3 fibroblasts (3T3 clone A31 cells). The non-occurrence of some dyes in their original form in wastewater often hides the problem related to the degradation of these compounds. The work shows results never reported in the literature, in addition to the use of important analytical techniques, such as NMR, which has never been used to better understand the behavior of the AB 210 in effluents, as well as in the detection of its possible harmful subproduct.
2 Materials and Methods
2.1 Chemicals and Materials
The water was obtained from a Milli-Q system (Millipore, São Paulo, Brazil). Commercial grade trisazo AB210 (CAS #99576-15-5; 4-amino-6-((4-(((4-((2,4-diaminophenyl)azo)phenyl)amino)sulphonyl)phenyl)azo)-5-hydroxy-3-((4-nitrophenyl)azo)-2,7-naphthalenedisulphonic) (Figure 1) was generously provided by Eco Vita Indústrias Química LTDA (Franca, São Paulo, Brazil). Methanol and acetonitrile (HPLC grade) were purchased from JT Baker (Center Valley, PA, United States). High glucose (Dulbecco’s Modified Eagle’s Medium, DMEM), Phosphate-buffered saline (PBS); methyl methanesulfonate; trypan blue dye, antibiotic antimycotic solution for cell culture, and sulforhodamine B (SRB) assay were purchased from Sigma-Aldrich (St. Louis, MO, United States). Gibco ™ trypsin-EDTA (0.05%) was purchased from Thermo Fisher Scientific and fetal bovine serum - FBS from Vitrocell®.
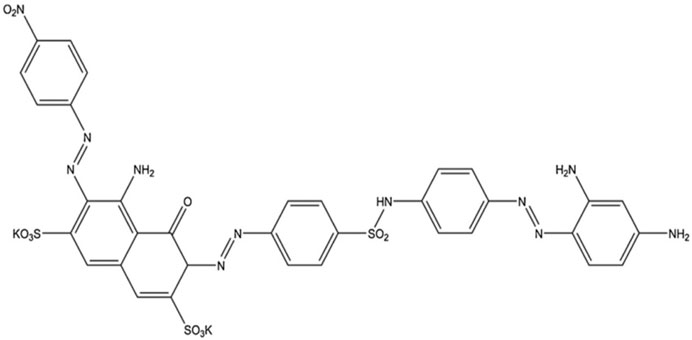
FIGURE 1. Chemical structure of the AB210.
2.2 Sampling
Samples 1 and 2 (untreated and treated effluent by the biological system, respectively) were collected from a tannery industry located in São Sebastião do Paraíso, Minas Gerais State, Brazil, which routinely uses AB210. Samples 3 and 4 were collected from the upstream and downstream river sample receiving of the disposal site, corresponding to surface water samples in which tannery effluent is discarded. The collection of samples was performed as described in Standard Methods for the Examination of Water and Wastewater (APHA, 1998).
The collected sample was submitted to a clean-up process using a solid-phase Strata-X cartridge and to pre-concentrate the analyte in the sample. The cartridge was conditioned with 6 ml of methanol and then 6 ml of deionized water. Then, 100 ml of the sample collected in the tannery was added. For the eluent phase, 6 ml of methanol was used. Subsequently, this solution was dried in nitrogen and the dye was resuspended in 500 uL of a methanol: water mixture (1:4, v/v). Solid-phase extraction was performed using a Manifold (Vacuum Manifold Processing Station) and Strata-X cartridge 33U polymeric reverse phase with a dimension of 200 mg/3 ml (Phenomenex, United States).
2.3 Instrumentation
The spectrophotometric measurements in the UV-Vis region were carried out on a spectrophotometer, Hewlett Packard (HP) model 8,453, from 200 to 800 nm, using a 5 ml quartz cuvette (Hellma) with an optical path length of 1.0 cm. The absorbance spectra in the UV-Vis region were also obtained from the selection of the peaks in the chromatogram itself, in the hydrodynamic mode.
2.4 HPLC-DAD and LC-MS/MS Analysis
High-performance liquid chromatography (HPLC) coupled to diode array detector (HPLC-DAD) measurements were carried out using a chromatograph (Shimadzu, model LC-10AT) equipped with two pumps and an automatic injector (injection volume of 20 μL) coupled to a diode array detector (model SPD-M10AVP). Kinetex C18 5 μm column (150 × 4.6 mm) (Phenomenex, Torrance, CA, United States) was used in an Agilent 1,200 Autosampler HPLC and a pump (Agilent Technologies, United States). Before the analysis, all the solutions were filtered through a 0.45-µm PTFE filter. A gradient elution system with 0.1% formic acid in water (solvent A) and acetonitrile (solvent B) was employed under the following conditions: 0.00–3.00 min (10% B), 3.00–13.00 min (10–100% B), 13.00–14.00 min (100% B), 14.00–15.00 min (100-10% B), and 15.00–20.00 min (10% B). The analysis time was 20 min. The sample injection volume was 20 μL, and the flow rate 0.5 ml min−1. All the analyses were carried out in triplicate. UV-Vis spectra in the hydrodynamic mode were also recorded for each peak of the chromatograms. The detection of possible aromatic amines generated from the degradation of AB210 was performed by the method proposed by Harris (Harris, 2005).
LC-MS/MS experiments were carried out using the 1,200 Agilent Technologies HPLC (Palo Alto, CA, United States) coupled to a 3200 QTRAP mass spectrometer (Linear Ion Trap Quadrupole Mass Spectrometer, AB SCIEX (Framingham, MA, United States) operating in positive ion mode with a TurboIon Spray ionization source. Chromatographic analysis was performed using a Kinetix C18 5 μm column (150 × 4.6 mm) (Phenomenex, Torrance, CA, United States). Water with ammonium acetate 5 mmol L−1/Methanol mixture (1:1; v/v) containing 0.1% formic acid at a flow rate of 0.7 ml min−1 was used as the mobile phase in the gradient mode. The injection volume and the column temperature were 10 μL and 25°C, respectively. The analysis lasted 20 min. All measurements were performed in triplicate (n = 3). MS data acquisition was performed in full scan mode (EMS, enhanced mass scan—using the linear ion trap mass analyzer). The QTRAP was operated under the following conditions: capillary potential 5500 V, dry gas temperature 550°C, Gas 1 (nebulizing nitrogen gas) 50 psi, Gas 2 (drying nitrogen gas) 50 psi, and curtain gas 15 psi. Declustering potential (DP) and entrance potential (EP) were −80 V and −5.5 V, respectively. Fragment ion experiments (EPI, enhanced product ion) were conducted for additional structural information of the possible products formed during the biotransformation assay. The collision energy for these experiments ranged from 20—50 V. LC-MS/MS analyses were carried out in order to investigate the presence of aromatic amines and other compounds as a by-product of dye degradation. Water/acetonitrile mixture (1:1; v/v) containing 0.1% formic acid at a flow rate of 1.5 ml min−1 was used as the mobile phase in the gradient mode. The injection volume and the column temperature were 10 μL and 25°C, respectively. The analysis lasted 30 min. All measurements were performed in triplicate (n = 3).
The detection of aromatic amines and degradation products of the AB210 were performed by using a Phenomenex Kinetex PFP 5 μm (4.6 × 150 mm) column, an Agilent 1,200 autosampler, and an Agilent 1200 HPLC pump (Agilent Technologies). The solvents used were water and acetonitrile with both containing 0.1% formic acid in the gradient mode. The total analysis time was 30 min. The injection volume was 20 uL, the flow was 1.5 ml min−1 and the column temperature was kept at 40°C. Supplementary Table S1 shows the experimental conditions for detecting amines.
The mass spectrometer was operated under the following conditions: Ion Spray (IS) 5000 V; Gas 1 and Gas 2 were 45 psi and curtain gas 15 psi. The ionization temperature was 600ºC. The developed method was based primarily on the total mass scanning using the ion trap (EMS—Enhanced Mass Spectrometry) and subsequent fragment ion experiments (EPI, enhanced product ion) for structural elucidation purposes.
Given that the total ion chromatogram covers a wide mass range and shows a high background, which undermines the visual detection of new peaks in the chromatogram, the approach of using background subtraction was applied to all sample analyses. Thus, the solutions of the 23 standard aromatic amines were prepared and analyzed by LC-MS/MS, as described in the experimental section. Supplementary Table S2 shows the respective retention time and fragments of each aromatic amine evaluated.
2.5 AB210 Degradation Reactions
The stability of AB210 was evaluated by testing 50 mg L−1 of fresh solution and the same solution stored in a closed container in the dark under constant temperature of 25°C for 14 days. The products formed were analyzed by UV-Vis spectrophotometry, HPLC-DAD, and LC-MS/MS techniques under conditions previously defined in Sections 2.3, 2.4, respectively.
The solar simulator experiments were performed to evaluate the effect of sunlight on the stability of AB210. Thus, 50 ml of the dye solution at a concentration of 50 mg L−1 was transferred to a 100 ml beaker radiated on top by using a light emitting diode (LED) solar simulator (Newport, model 6,700 (EUA), operating under stirring of 200 rpm in batch mode. The process was stopped after a controlled predetermined time and analyzed by UV-Vis spectrophotometry, HPLC-DAD, and LC-MS/MS techniques.
The effect of chlorination was also tested by using 10 ml of 40 mg L−1 AB210 solution chlorinated with chlorine gas, at similar conditions applied by a conventional drinking water treatment plant (DWTP) (Oliveira et al., 2010). Gas was bubbled in the solution by a tube connecting the reaction from hydrochloric acid and potassium permanganate using a Kipp apparatus. Free chlorine dissolved in solution was determined by the DPD (N,N,- diethyl-p- phenylenediamine) colorimetric method (Chehab et al., 2020) with a limit of detection of 0.010 mg L−1 of chlorine. The concentration of chlorine (in mg L−1) in solution was determined using a calibration curve prepared previously with potassium permanganate solution as recommended Osugi et al. (Osugi et al., 2009). The solution of AB210 was treated with free chlorine and stoped at different reaction times from 0 to 300 s and analyzed by UV-Vis spectrophotometry, HPLC-DAD, and LC-MS/MS.
2.6 NMR Analysis
The NMR experiments were performed in collaboration with the researcher Dr. Guilherme Julião Zocolo from Embrapa, Fortaleza, Ceará, Brazil. Samples of dyes and collected samples were submitted to a clean-up process using solid-phase Strata-X following the previous conditions of Section 2.4, dried and resuspended in trideuteroacetonitrile (CD3CN) for NMR studies. The analysis was performed on an Agilent 600 MHz spectrometer equipped with a 5 mm (HF/15N-31P) inverse detection OneProbe ™ with actively shielded Z-gradient. 1H NMR spectra were performed using the Pre-SAT pulse sequence for non-deuterated water suppression (δ 4.87).
The data were recorded with the RF calibrated pulses (p1); 32 scans, 64 k of time-domain points, a spectral window of 14 mg L−1, the acquisition time of 4.0 s, and a relaxation delay of 2.0 s. The spectra were calibrated externally to TMSP-d4 resonance (δ 0.0). 13C spectra were recorded with spectral widths of 250 mg L−1 using 32 k data points at 40 k scans, acquisition time 0.87 s, and a relaxation delay of 1.0 s. However, only the 1H NMR spectrum from treated wastewater was obtained with 512 scans due to the low amount of organic matter extracted.
Two-dimensional (2D) NMR experiments were performed using the standard pulse sequence library. The 1H-1H COSY experiments were obtained with a spectral width of 18,028.1 Hz in both dimensions; 1,442 × 200 data matrix; 16 scans per t1 increment, and a relaxation delay of 1.0 s.
The 1H-13C HSQC experiments were acquired with an evolution delay of 1.7 ms for an average 1J (C, H) of 145 Hz; 1,442 × 200 data matrix; 32 scans per t1 increment; spectral widths of 9,615.4 Hz at f2 and 30.165.9 Hz at f1 delay, and a relaxation delay of 1.0 s. Long-range 1H-13C HMBC experiments were recorded with an evolution delay of 50.0 ms for LRJ (C, H) of 10 Hz; 1,442 × 200 data matrix; 64 scans per t1 increment; spectral widths of 9,615.4 Hz at f2 and 30.165.9 Hz at f1 delay, and a relaxation delay of 1.0 s.
2.7 Cytotoxicity Analysis of AB210
The cytotoxicity of AB210 in solution was tested by human immortalized keratinocytes (HaCaT) and BALB/c 3T3 fibroblasts (3T3 clone A31 cells. The human keratinocyte line, HaCaT, and BALB/3T3 clone A31 (embryo fibroblasts) were obtained from the Cell Bank of Rio de Janeiro. The cells were grown in culture bottles at a concentration of 1 × 10⁴ cells/cm2 in the presence of DMEM—High Glucose ((Dulbecco’s Modified Eagle’s Medium - Sigma-Aldrich®) medium supplemented with 10% fetal bovine serum—FBS (Vitrocell®) and 1% antibiotic and antimycotic solution (Sigma -Aldrich®) and incubated in static conditions at 37°C and 5% CO2.
The exchanges of the culture médium were performed every 48 h and the cells were dissociated with the use of 0.05% trypsin-EDTA (Gibco®) on reaching 60–80% confluency. Assays were performed with 1 × 10⁴ cells/mL seeded in a 96-well microplate and incubated for 24 h at 37°C with 5% CO2. The cells were exposed for 24 h to the AB210 standard (Vichai and Kirtikara, 2006), which was prepared in two ways: on the day of analysis and stored for 8 months in the refrigerator, both at the following concentrations (1.562; 3.125; 6.250; 12.50; 25.0; 50.0; 100.0, and 200.0 mg L−1).
After this step, the degree of cytotoxicity of the dye and degraded solution were submitted to the Sulforhodamine B assay (SRB - Catalog Number S2902). This method consists of the colorimetric quantification of the cellular protein (total biomass) in cell cultures stained with SRB purple dye. First, 50 μL of 50% trichloroacetic acid (TCA) was added at 4°C for 1 h with subsequent washing with distilled water to remove the TCA solution and drying at room temperature for about 1 h. The 0.4% SRB solution was added in sufficient quantity to cover the culture surface area (∼50 μL) and incubated for 30 min. After this time, the cells were washed with 1% acetic acid to remove excess dye and dried for about 1 h. The incorporated dye was then solubilized in a volume of 100 μL of Sulforhodamine B assay solution (10 mmol L−1 Tris) and spectrophotometric read at 565 nm on Epoch 2, microplate reader (BioteK-United States).
3 Results and Discussion
3.1 Stability Evaluation of AB210 Standard Dye
First of all, the experiments were performed with the AB210 standard dye (99% of purity). The three azo groups acting as chromophore centers presented UV-Vis spectra marked for three bands of maximum absorbance at 403, 458, and 612 nm for 50 mg L−1 of AB210 in aqueous solution, as shown in Figure 2A (black line). The sample was kept at room temperature for 14 days (Figure 2A, red line). The results showed a decrease in the absorbance from 0.66 to 0.43 after 14 days, which represents a decrease in dye concentration up to 34% in the band intensity at 612 nm as shown in Figure 2A (red line).
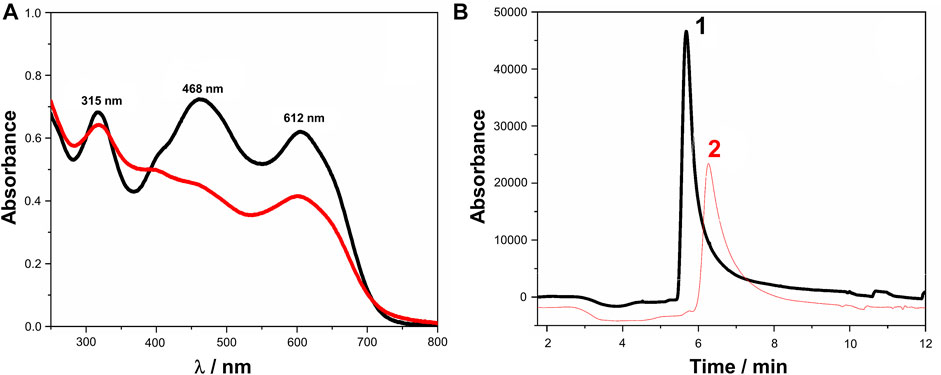
FIGURE 2. (A) UV-Vis spectra and (B) HPLC-DAD chromatograms obtained for 50 mg L−1 of AB210 fresh solution (black line) and exposed to room ambient for 14 days (red line), respectively. Mobile phase: ACN/H2O (1:1, v/v). T = 30°C, flow rate = 0.5 ml min−1. Detection: λ = 612 nm.
The results were confirmed by HPLC-DAD at optimized conditions (Section 2.5) as shown in Figure 2B. A well-defined peak at a retention time of 5.8 min was obtained for AB210, chosen after comparison of retention constant factor (k), selectivity, and resolution between peaks (r), as shown in peak 1 of Figure 2B. The peak area presented a linear relationship from 10 to 150 mg L−1, and limit of detection and quantification were 7.4 mg L−1 and 22 mg L−1. In order to use the method for dye determination, the recovery was tested using water spiked to 25 mg L−1 of the dye (n = 3). The results obtained from the calibration curve presented values from 95 to 110%, which attested to the accuracy of the chromatographic method. When AB210 sample was kept at room temperature for 14 days the peak area reduced from 46,200 to 24,500, indicating a decrease of 45%. Besides that, the retention time shifted to 6.3 min (peak 2), confirming that the original dye decomposes in an aqueous solution at a longer time of exposition and compromises its detection in the original form in the wastewater. The chromatographic peak shift after 14 days probably indicates the presence of degradations products, such as aromatic amines, changing the composition of the solution, and thus interfering with the interaction of the dye with the mobile phase/column.
3.2 Evaluation of Solar Simulator on AB210
To accelerate the degradation dye process, studies were conducted with 50 mg L−1 of AB210 in solution by exposure by a solar simulator for 3 h. The experiments aimed to mimic the possible sunlight effect on dye degradation in the aquatic biota. The characteristic absorption bands of AB 210 before the experiment were 315, 468, and 612 nm. The results presented by UV-Vis were similar to those shown in Figure 2A. Remarkably, it is worth pointing out that the values of the absorption bands of AB 210 decreased after exposure to the sunlight, indicating a lower contribution of the azo group of the dye, and consequently its discoloration (Solomons and Fryhle, 2009; Rosu et al., 2017; Jaiswal et al., 2021). In other words, the results indicate that the action of sunlight reduced or cleavage the azo group of the dye, referring to a new product generated.
3.3 Chlorination of AB210
The wastewater treatment by using chlorine has been widely used as a complementary method able to reduce color and to promote the disinfection process in DWTP. However, for a dye easily discolored under ambient conditions, this discoloration could be very rapid, and therefore eventually produce disinfection by-products (Oliveira et al., 2010). To monitor the chlorination of the AB210, the solution of 50 mg L−1 was treated using the methodology described in Section 2.3 and analyzed by UV-Vis spectrophotometry (Oliveira et al., 2010).
Figure 3A shows the UV-Vis spectra obtained before and each 25 s of chlorination of AB210. Reduction in intensity of the absorption peak at λmax = 612 nm and λmax = 468 nm was observed after 300 s reaction. The spectra data indicated a fast decrease in the value of the absorbance band at the visible region. Concomitantly, there is a slight increase of the peak at the UV region, indicating the formation of unsaturated systems.
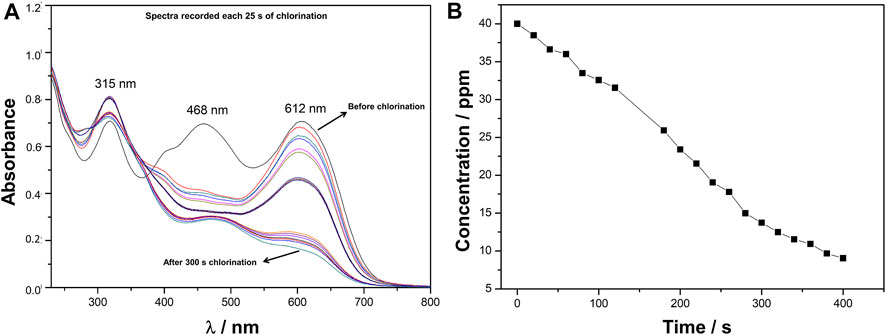
FIGURE 3. (A) UV-Vis absorption spectra for chlorination of 50 mg L−1 of AB210 solution submitted to chlorination from 0 to 300 s. Time of exposition to chlorine gas: black line = 0 s and green line = 300 s. Spectra recorded each 25 s from 0 to 300 s of chlorination. (B) Discoloration of the AB210 at 612 nm in relation to the reaction time with active chlorine.
The data corresponding to the decreasing in the absorbance at 612 nm was plotted as a function of time as shown in Figure 3B. Through the results presented in Figure 3B, 25% discolouration of AB210 after 300 s of treatment with sodium hypochlorite (NaClO) was observed, confirming the action of the active chlorine in the structure of the dye.
The discoloration kinetics of the reaction was studied. The velocity constant was calculated by linear regression of ln{[dye]/[initial dye]} with R = 0.9772, indicating a pseudo-first order mechanism for this degradation (Supplementary Figure S1). The value of the velocity constant (K) was 0.078 s−1 (Supplementary Figure S1). Thus, it was possible to calculate the half-life of the Acid Black 210 in the degradation, as indicated in the calculations below.
The oxidation analyzes indicate that Acid Black 210 reacts rapidly with sodium hypochlorite, degrading 50% in just 18 s. These results are indicative that the chance to identify the original dye in the drinking water after being submitted to a water treatment plant is insignificant. However, this does not mean that the dye has been eliminated (Vacchi et al., 2013). Therefore, new tests must be performed to diagnose the occurrence of by-products generated during the chlorination process (de Oliveira et al., 2012). These products may be more toxic and/or mutagenic than the original dye. The diagnosis of the products is of paramount importance, as it can generate organochlorines, which are extremely harmful to humans and other living organisms.
3.4 Detection of AB210 and Degradation Products by LC-MS/MS
To improve the method sensitivity for AB210 detection, the sample was also analyzed by LC-MS/MS spectrometry, as defined in the experimental section. The LC-MS chromatographic profile obtained for AB210 standard dye (0.010 mg L−1) in EMS mode showed the elution of AB210 at 9.41 min with m/z 860 (Figure 4), which corresponded to the protonated molecule [M + H]+ (Figure 4B) and its fragmentation pattern (Figure 4C).
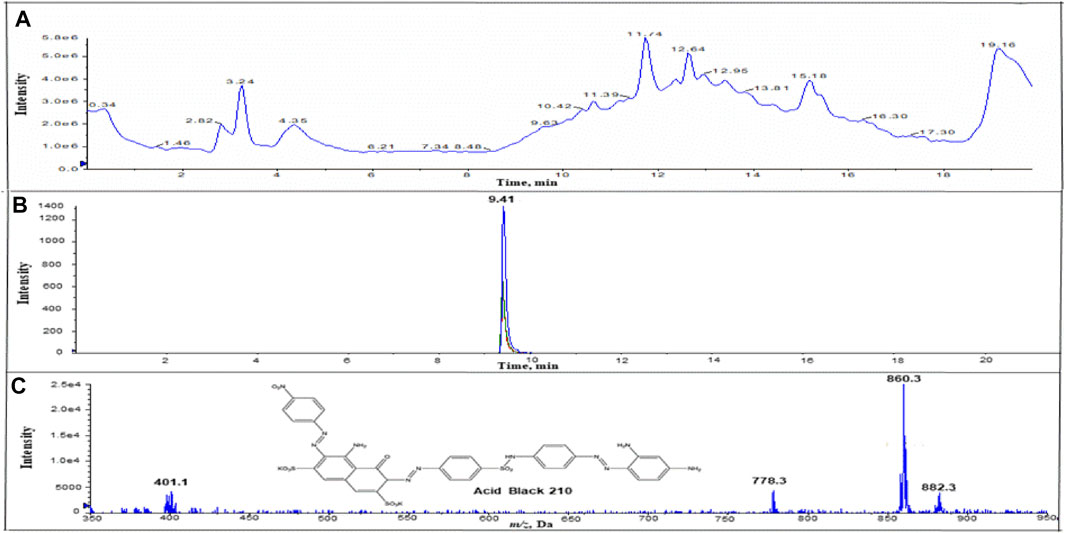
FIGURE 4. (A) Chromatograms of total ions (TIC) (B) Chromatogram of extracted ion (XIC) of m/z 860.2 and (C) Mass spectra for the peak at retention time 9.41 min corresponding to the injection of 0.010 mg L−1 AB210.
Considering that degradation products of AB 210 can be generated by processes as sunlight exposure, chlorination, or long ambient conditions exposition, the LC-MS/MS technique was conducted to obtain more information about the degradation products.
The identification of potential degradation products was carried out by the comparison of total ion chromatograms and mass spectra obtained for the control samples (t = 0) and after exposure to sunlight or chlorination reaction. Detected target ions, which were not present in the control samples, were regarded as potential products. The presence of amines in the standard dye samples was investigated by using the data shown in Section 2.4 HPLC-DAD and LC-MS/MS analysis. For this, two types of studies were carried out: with the dye solution prepared on the same day of analysis and a solution stored for 14 days. This study aimed to confirm the degradation of the dye after a long time stored, to mimic their behavior in effluent water. No amine was detected for the AB210 standard prepared on the same day of the analysis. However, the sample corresponding to the standard AB210 stored for 14 days in the laboratory showed a peak at a retention time of 9.51 min assigned to 4-nitroaniline, with precursor ion (m/z) 139.1 (Supplementary Figure S2).
To mimic processes routinely present in aquatic biota, such as azo dyes in effluents, the AB210 was subjected to solar simulator reactions, aiming to investigate the possible products generated by the interference of sunlight (which comprises infrared, visible, and ultraviolet light) in the structure of the dye. The effect of the sunlight was analyzed by comparison of the LC-MS/MS chromatographic profile obtained for the AB210 standard dye. Supplementary Figure S3 shows the extracted ion chromatogram profile obtained by LC-MS for the AB210 after 3 h of sunlight exposure. A potential metabolite (1) with m/z 742 ([M + H]+) was observed at 8.6 min, by comparing the chromatograms obtained for degradation (t = 3 h) and control samples (t = 0), indicating the degradation of AB210 by the action of sunlight, responsible for the cleavage of one of the azo groups present in the dye, forming an aromatic amine. In addition to the metabolite (1), another chromatographic peak from the degradation of AB210 was also detected, which was not observed in any of the control samples (t = 0). This peak was detected at 9.7 min and showed m/z 876 [M + H]+ (Supplementary Figure S4). The mass difference indicated the addition of a hydroxyl group to the aromatic ring, resulting the hydroxylation of the AB210. Investigations into the possible metabolites (3) formed from AB210 after 3 h of sunlight exposure (Supplementary Figure S5) were performed and careful analysis of the degradation sample demonstrated the presence of a peak m/z 139 ([M + H]+) at 9.6 min, which corresponds to 4-nitroaniline.
On the other hand, when AB210 was chlorinated the LC-MS/MS chromatograms presented a chromatographic peak at 9.41 min and a peak m/z 139 ([M + H]+) attributed to the formation of 4-nitroaniline but disappeared at longer chlorination process. Other peaks were detected, but there was no confirmation of chemical structure.
These results showed that the AB210 produces three degradation products after sunlight action. One product was formed after chlorination and long time storage. Remarkably, 4-nitroaniline was the major product formed for all the degradation processes and also the most mutagenic product (Franco et al., 2018); (Duc, 2019). That is, in a water treatment plant, the dye would probably not be detected, because sunlight and chlorination promote its degradation drastically. However, this does not mean that the dye has been eliminated.
These degradation products can be more toxic and/or mutagenic than the original dye and extremely harmful to humans and other living organisms. Remarkably, it is extremely important to evaluate the toxicological effects of AB210 in living beings.
Table 1 displays the products formed after long time storage, sunlight radiation, and chlorination reaction for AB210.
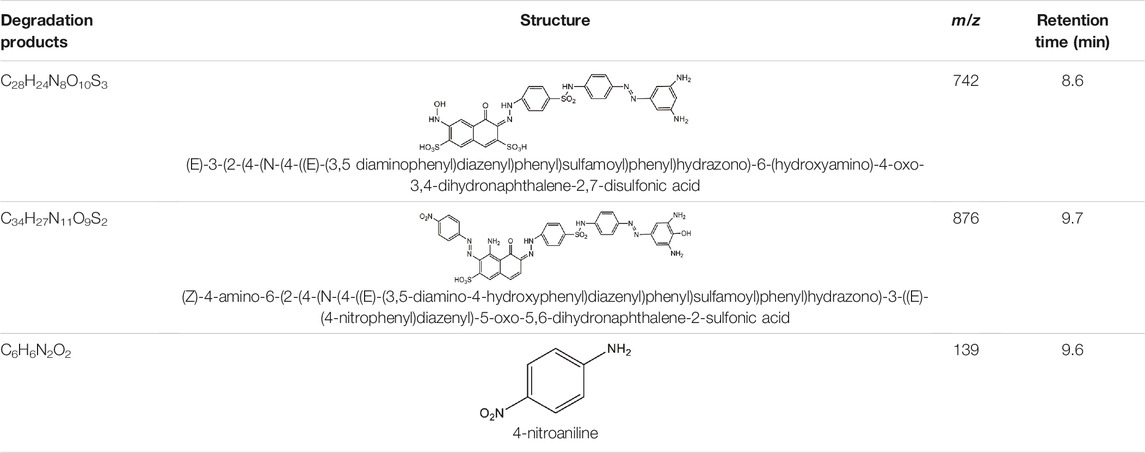
TABLE 1. Degradation products of AB210 generated after long time estorage, sunlight action for 3 h and chlorination reaction for 300 s.
3.5 Detection of AB210 and Degradation Products in Environmental Samples
The analysis of AB210 in the collected samples 1 and 2 (untreated and treated effluent, respectively) from tannery industry and samples 3 and 4 collected from the upstream and downstream of the river sample receiving disposal site, corresponding to surface water samples in which tannery effluent was discarded and analyzed by HPLC-DAD and LC-MS/MS. All the samples were submitted to the previous extraction step and there was no indication of a detectable amount of AB210 in any effluent sample analyzed by HPLC-DAD and LC-MS/MS.
The real samples are more complex and require a detailed, sensitive, and efficient method to detect low concentrations of the dye as well as degradation products. Thus, further experiments were carried out with samples 1, 2, 3, and 4 to optimize the LC-MS/MS in the SRM mode for detection of amines compounds, aiming to detect the target compounds with higher sensitivity and selectivity. Even using the SRM mode, the results showed no peaks for AB 210 in any effluent sample analyzed. Furthermore, the sample collected at the upstream (3) and downstream (4) river sample receiving disposal site does not show any interest in amine occurrence.
As demonstrated previously, no detection of AB210 in real samples was achieved. Considering the great environmental concern with the presence of by-products from the degradation of AB210, the presence of aromatic amines in the samples collected from the tannery was investigated by LC-MS/MS-SRM as shown in Figure 5.
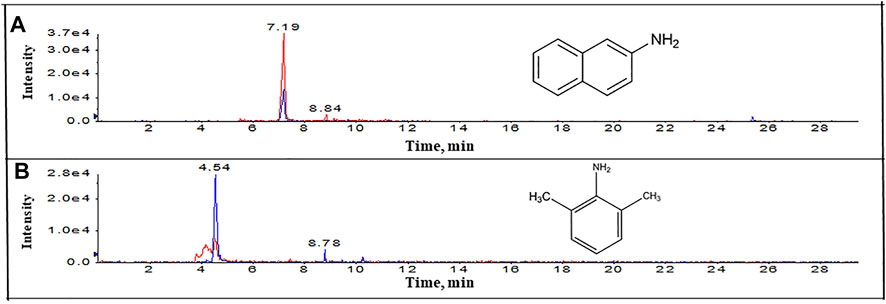
FIGURE 5. Extracted ion chromatogram (XIC) of the two transitions to (A) 4-nitroaniline and (B) 2-naphthylamine in the collected sample 1 (untreated effluent) by LC-MS/MS-SRM.
Figure 5 illustrates the chromatogram with mass detection obtained for sample 1 (untreated effluent sample). The XIC indicated the occurrence of two peaks at a retention time of 7.19 min with m/z 144 ([M + H]+) and 4.54 min with m/z 122 attributed to the 2-naftilamina and 2,6-dimetilanilina, respectively.
The sample extracted from the treated effluent (sample 2) presented the occurrence of three compounds. A peak attributed to 4-nitroaniline, with m/z 139, was found at 9.50 min (Figure 6A). A peak with m/z 144 ([M + H]+) was observed at 7.24 min (Figure 6B), indicating the presence of a metabolite obtained by degradation of AB210 was attributed to 2-naphthylamine. Another peak found at 4.64 min with m/z 122 was assigned to 2,6-dimethylaniline and confirmed by the SRM mode (Figure 6C).
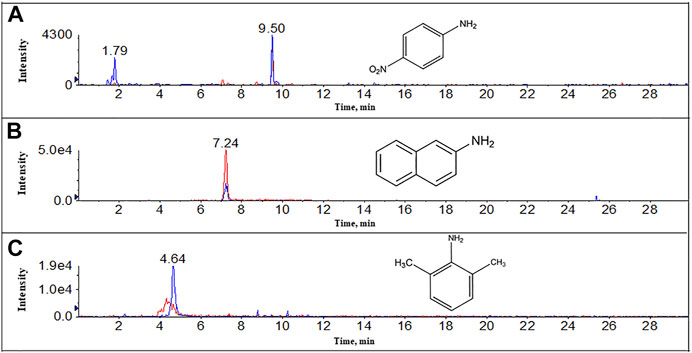
FIGURE 6. Extracted ion chromatogram (XIC) of the two transitions to (A) 4-nitroaniline (B) 2-naphthylamine, and (C) 2,6-dimethylaniline in the collected sample 2 (treated effluent) by LC-MS/MS-SRM.
Table 2 summarizes the degradation products obtained for AB210 by LC-MS/MS-SRM in the collected samples 1 and 2 (untreated and treated effluent, respectively) from a tannery industry.
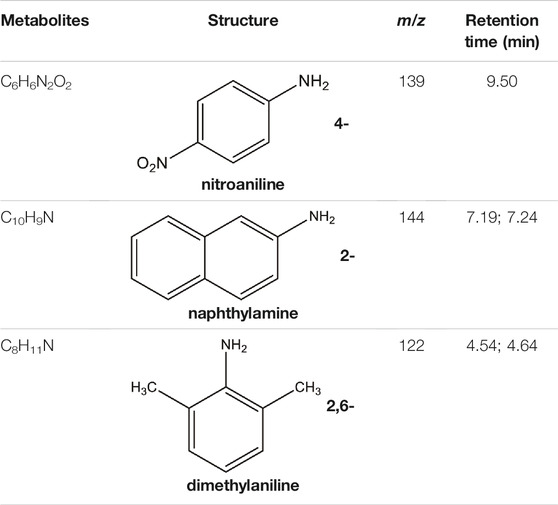
TABLE 2. Degradation products of AB210 in samples collected from the tannery industry.
Based on previous studies for degradation of azo dyes in effluents, it is possible to confirm the action of microorganisms, such as bacteria (Pandey et al., 2007) (Saratale et al., 2011), in the degradation of AB 210, producing the aromatic amines, 2-naphthylamine, 2,6-dimethylaniline, and 4-nitroaniline.
3.6 Analysis of the AB 210 Products Degradation in the Water Samples by NMR
To improve the detection of degradation products in the wastewater from tannery, the collected samples were submitted by NMR spectroscopy analysis, as described in Section 2.6. Figure 7 shows the respective 1H NMR spectra obtained for collected wastewater samples at 1 and 2 (untreated and treated effluent by the biological system, respectively) from tannery industry sites and sample 3 collected from the upstream disposal site, corresponding to surface water samples in which tannery effluent is discarded.
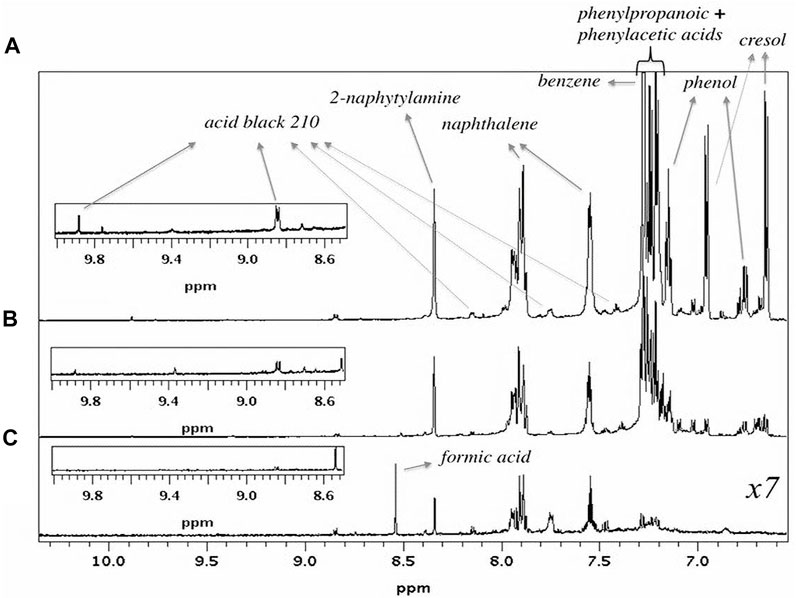
FIGURE 7. 1H NMR analysis obtained for the sample collected from (A) untreated and (B) treated effluent by the biological system and (C) sample of river receiving discard from the tannery industry.
The respective spectra obtained for the AB210 presented as the main character of the peaks in detachment of δ1H = 8.8 and 9.9. Supplementary Table S3 presents the respective chemical shifts and the full assignments of 1H and 13C through HMBC and 13C NMR analysis recorded for collected samples.
The comparison of the 1H NMR spectra showed that the sample collected after biological treatment of the tannery industry promoted a high decrease in the dye concentration, as shown in the extended spectrum in the region corresponding to the AB210. In addition, a decrease in the concentration of the organic matter present in the water collected before and after the treatment was observed. Nevertheless, according to Supplementary Table S3, it is possible to verify several organic compounds formed by the observed shifts, which indicates the formation of phenolic compounds, treated benzoic compounds, as well as small organic molecules, such as acetic acids, formic acid, and other degradation products.
After the treatment, the complete removal of signs with the chemical shift at δ = 8.84 and δ = 9.89 attributed to the AB210 was achieved, as well as the reduction of surface-active agents widely used in tanneries and other dyehouses. However, the formation of the 2-naphthalimine, cresol, phenol, phenylpropanoic acid, phenylacetic acid, formic acid, and acetic acid was also verified, as shown in Supplementary Table S3.
To achieve more information about the samples, the LC-MS/MS-SRM was performed to detect the presence of phenylacetic acid, phenylpropanoic acid, phenol, and cresol, since these compounds were detected by NMR in all samples collected from untreated wastewater (sample 1), treated sample by biological method (sample 2), and downstream river (sample 3). Remarkably, sample 2 showed a higher concentration of the compounds of interest when compared with the results obtained from sample 1 and 3, being the chosen sample for the LC-MS/MS-SRM experiments.
The sample 2 presented the occurrence of two compounds as illustrated in Figure 8. A peak attributed to phenylacetic acid, with m/z 135, was found at 3.28 min (Figure 8A). A peak with m/z 149 ([M + H]+) was observed at 4.86 min (Figure 8B), indicating the presence of the phenylpropanoic acid. However, the presence of numerous chromatographic bands for the phenol and cresol hindered the detection of these compounds by LC-MS/MS-SRM. The detailed analysis of the mass spectra confirmed the absence of cresol and the presence of phenol, since the spectrum does not present the expected fragmentation for this compound. Therefore, a peak at 2.03 min with m/z 149 ([M + H]+) was attributed to phenol as shown in Figure 8C.
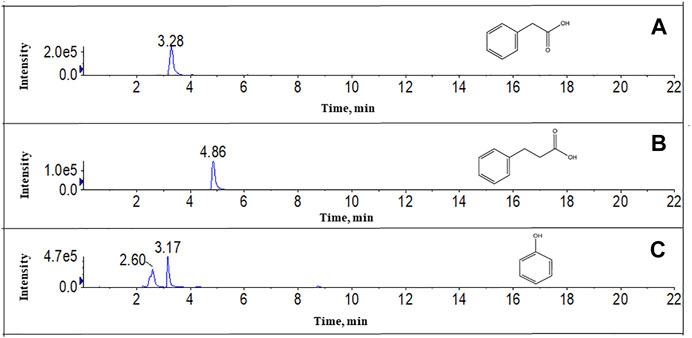
FIGURE 8. Extracted ion chromatogram (XIC) of the two transitions to (A) phenylacetic acid, (B) phenylpropanoic acid, and (C) phenol in the collected sample 2 (treated effluent) by LC-MS/MS-SRM.
Noticeably, although the dye is not present in the effluent, phenolic compounds and aromatic amines from the degradation of the dye were detected, representing a risk to the environment and population (Brüschweiler and Merlot, 2017). Thus, our findings indicate that the tannery effluent is a very complex sample, where the original dye can be degraded in several other products very rapidly when treated with conventional methods (Muz et al., 2017).
3.7 Cytotoxicity Assay of the AB210 by Sulforhodamine B colorimetric assay in Immortalized Human Skin Keratinocytes (HaCaT) and 3T3 Clone A31 Cells
The cytotoxicity assays aim to quantify cell viability and to verify the toxicity potential of AB210 in HaCat cells (immortalized human keratinocytes) and 3T3 clone A31 cells. The standard dye was evaluated in two ways: prepared at the time of analysis and stored for 14 days at concentrations of: 3.125; 6,250; 12.50; 25.0; 50.0; 100.0, and 200.0 mg L−1.
3.7.1 HaCAT and 3T3 Clone A31 Cells Assays
Figures 9A,B shows the effect of AB210 on human skin keratinocytes (HaCAT) and 3T3 clone A31 cells, respectively, in two situations: prepared on the day of analysis (black line) and stored for 14 days (red line).
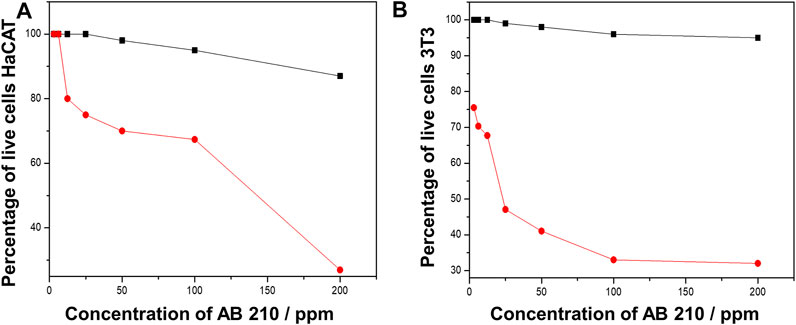
FIGURE 9. (A) Percentage of live cells HaCAT vs concentration of AB210 prepared on the day of analysis (black line) and stored at 2–4°C for 14 days (red line). (B) Percentage of live cells 3T3 clone A31 vs concentration of AB210 prepared on the day of analysis (black line) and stored at 2–4°C for 14 days (red line).
The results described in Figure 9 presented similar behavior, highlighting the decrease in the percentage of live cells while the concentration of the AB210 increases.
The dye sample prepared 14 days later had much higher cytotoxicity than the dye sample prepared on the day of analysis for both types of live cells. The concentration of 200 mg L−1 was considered the most deleterious and toxic, leading to the death of about 70% of HaCAT (Figure 9A) and 3T3 cells (Figure 9B). The percentage of live cells in the dye sample prepared for 14 days is lower in relation to the dye sample prepared on the day of analysis. This result is explained by the degradation of AB210 into toxic aromatic amines, such as 4-nitroaniline, as evidenced by the results of Section 3.2.
In the case of the 3T3 cell assay, the decrease in viability also occurs at low concentrations of dye, which does not happen with the HaCAT lineage. This fact shows that balb/c fibroblast cells (3T3) are more sensitive to the aromatic amines formed by the degradation of the dye. This result is alarming since fibroblasts are precursor cells of collagen cells, elastin, as well as a major constituent responsible for the formation of fibers and amorphous intercellular material (Vichai and Kirtikara, 2006).
Thus, the immortalized human keratinocyte (HaCAT) and 3T3 cells assays for the AB210 stored for 14 days showed high potential for cytotoxicity.
4 Conclusion
Our results prove that the 4-nitroaniline is the main product formed by the degradation of the AB210 stored for a long period and chlorination reaction. The exposure to sunlight by a solar simulator performed with AB210 generated three degradation products, with 4-nitroaniline being the major and most mutagenic product. 2-naphthylamine, 2,6-dimethylaniline, and 4-nitroaniline were the products identified in the effluents from sample 2, confirming the degradation of the dye. Nevertheless, a deeper analysis of the sample collected in the wastewater has indicated that several harmful compounds such as benzene, cresol, naphthalene, phenol, 2-naphthylamine, and phenylacetic acid are present. Therefore, monitoring only the main dye does not mean that other more dangerous compounds, as degradation products, are not present in the tailings, requiring more rigid legislation and better treatment methods for the application of the AB 210 in the tannery industry, as well as its disposal in effluents.
Data Availability Statement
The original contributions presented in the study are included in the article/Supplementary Material, further inquiries can be directed to the corresponding author.
Author Contributions
EC performed all the experiments of the AB210 by photolysis, chlorination, UV-Vis, HPLC-DAD, LC-MSMS, and human skin keratinocytes. JF supported EMC in all the experiments, mainly in the photolysis, chlorination, UV-Vis, HPLC-DAD, and LC-MSMS. Also, JF wrote the first draft, the Supplementary Material, and the final version of the manuscript with the revisor of MB. JF and MB also organized the database GC performed all the experiments of the AB210 by NMR. AA, MM, and DO contributed to the biological experiments, especially the Cytotoxicity assay of the AB210 by Sulforhodamine B colorimetric assay in immortalized human skin keratinocytes (HaCaT) and 3T3 clone A31 cells. MVB was responsible for the conception and design of the study. MB contributed to the organization of the database, as well as supervised all the scientific steps of the present work. All authors contributed to manuscript revision, read, and approved the submitted version.
Funding
INCT-DATREN (CNPq process 465571/2014–0, FAPESP process 2014/ 50945–4), CAPES process: 88887.136426/2017/00.
Conflict of Interest
The authors declare that the research was conducted in the absence of any commercial or financial relationships that could be construed as a potential conflict of interest.
Publisher’s Note
All claims expressed in this article are solely those of the authors and do not necessarily represent those of their affiliated organizations, or those of the publisher, the editors and the reviewers. Any product that may be evaluated in this article, or claim that may be made by its manufacturer, is not guaranteed or endorsed by the publisher.
Acknowledgments
The authors are grateful to the National Institute for Alternative Technologies of Detection, Toxicological Evaluation and Removal of Micropollutants and Radioactivies.
Supplementary Material
The Supplementary Material for this article can be found online at: https://www.frontiersin.org/articles/10.3389/fenvs.2022.750647/full#supplementary-material
References
Agrawal, S., Tipre, D., Patel, B., and Dave, S. (2014). Optimization of Triazo Acid Black 210 Dye Degradation by Providencia Sp. SRS82 and Elucidation of Degradation Pathway. Process Biochem. 49, 110–119. doi:10.1016/j.procbio.2013.10.006
Bafana, A., Devi, S. S., and Chakrabarti, T. (2011). Azo Dyes: Past, Present and the Future. Environ. Rev. 19, 350–371. doi:10.1139/a11-018
Bień, J., Celary, P., and Wystalska, K. (2017). The Problems in Achieving Sustainable Development in the Tannery Industry in Regard to Sewage Sludge Management. J. Ecol. Eng. 18, 13–20. doi:10.12911/22998993/76901
Bonfante de Carvalho, C., Espina de Franco, M., Souza, F. S., and Féris, L. A. (2018). Degradation of Acid Black 210 by Advanced Oxidative Processes: O3 and O3/UV. Ozone: Sci. Eng. 40, 372–376. doi:10.1080/01919512.2018.1435258
Brüschweiler, B. J., Küng, S., Bürgi, D., Muralt, L., and Nyfeler, E. (2014). Identification of Non-regulated Aromatic Amines of Toxicological Concern Which Can Be Cleaved from Azo Dyes Used in Clothing Textiles. Regul. Toxicol. Pharmacol. 69, 263–272. doi:10.1016/j.yrtph.2014.04.011
Brüschweiler, B. J., and Merlot, C. (2017). Azo Dyes in Clothing Textiles Can Be Cleaved into a Series of Mutagenic Aromatic Amines Which Are Not Regulated yet. Regul. Toxicol. Pharmacol. 88, 214–226. doi:10.1016/j.yrtph.2017.06.012
Chehab, R., Coulomb, B., Boudenne, J.-L., and Robert-Peillard, F. (2020). Development of an Automated System for the Analysis of Inorganic Chloramines in Swimming Pools via Multi-Syringe Chromatography and Photometric Detection with ABTS. Talanta 207, 120322. doi:10.1016/j.talanta.2019.120322
Costa, C. R., Montilla, F., Morallón, E., and Olivi, P. (2009). Electrochemical Oxidation of Acid Black 210 Dye on the boron-doped diamond Electrode in the Presence of Phosphate Ions: Effect of Current Density, pH, and Chloride Ions. Electrochimica Acta 54, 7048–7055. doi:10.1016/j.electacta.2009.07.027
Dave, S. R., and Dave, R. H. (2009). Isolation and Characterization of Bacillus Thuringiensis for Acid Red 119 Dye Decolourisation. Bioresour. Technol. 100, 249–253. doi:10.1016/j.biortech.2008.05.019
de Aragão Umbuzeiro, G., Freeman, H. S., Warren, S. H., de Oliveira, D. P., Terao, Y., Watanabe, T., et al. (2005a). The Contribution of Azo Dyes to the Mutagenic Activity of the Cristais River. Chemosphere 60, 55–64. doi:10.1016/j.chemosphere.2004.11.100
de Aragão Umbuzeiro, G., Freeman, H., Warren, S. H., Kummrow, F., and Claxton, L. D. (2005b). Mutagenicity Evaluation of the Commercial Product CI Disperse Blue 291 Using Different Protocols of the Salmonella Assay. Food Chem. Toxicol. 43, 49–56. doi:10.1016/j.fct.2004.08.011
de Oliveira, R. L., Anderson, M. A., Umbuzeiro, G. d. A., Zocolo, G. J., and Zanoni, M. V. B. (2012). Assessment of By-Products of Chlorination and Photoelectrocatalytic Chlorination of an Azo Dye. J. Hazard. Mater. 205-206, 1–9. doi:10.1016/j.jhazmat.2011.10.060
Duc, H. D. (2019). Anaerobic Degradation of 2-Chloro-4-Nitroaniline by Geobacter Sp. KT7 and Thauera Aromatica KT9. FEMS Microbiol. Lett. 366. doi:10.1093/femsle/fnz174
Franco, J. H., da Silva, B. F., Dias, E. F. G., de Castro, A. A., Ramalho, T. C., and Zanoni, M. V. B. (2018). Influence of Auxochrome Group in Disperse Dyes Bearing Azo Groups as Chromophore center in the Biotransformation and Molecular Docking Prediction by Reductase Enzyme: Implications and Assessment for Environmental Toxicity of Xenobiotics. Ecotoxicology Environ. Saf. 160, 114–126. doi:10.1016/j.ecoenv.2018.04.066
Jaiswal, K. K., Dutta, S., Pohrmen, C. B., Verma, R., Kumar, A., and Ramaswamy, A. P. (2021). Bio-waste Chicken Eggshell-Derived Calcium Oxide for Photocatalytic Application in Methylene Blue Dye Degradation under Natural Sunlight Irradiation. Inorg. Nano-Metal Chem. 51, 995–1004. doi:10.1080/24701556.2020.1813769
Kurade, M. B., Waghmode, T. R., Patil, S. M., Jeon, B.-H., and Govindwar, S. P. (2017). Monitoring the Gradual Biodegradation of Dyes in a Simulated Textile Effluent and Development of a Novel Triple Layered Fixed Bed Reactor Using a Bacterium-Yeast Consortium. Chem. Eng. J. 307, 1026–1036. doi:10.1016/j.cej.2016.09.028
Kurade, M. B., Waghmode, T. R., Xiong, J.-Q., Govindwar, S. P., and Jeon, B.-H. (2019). Decolorization of Textile Industry Effluent Using Immobilized Consortium Cells in Upflow Fixed Bed Reactor. J. Clean. Prod. 213, 884–891. doi:10.1016/j.jclepro.2018.12.218
Li, M., Li, J.-T., and Sun, H.-W. (2008). Sonochemical Decolorization of Acid Black 210 in the Presence of Exfoliated Graphite. Ultrason. Sonochem. 15, 37–42. doi:10.1016/j.ultsonch.2007.01.004
Mathew, S., and Madamwar, D. (2004). Decolorization of Ranocid Fast Blue Dye by Bacterial Consortium SV5. Abab 118, 371–382. doi:10.1385/ABAB:118:1-3:371
Muz, M., Dann, J. P., Jäger, F., Brack, W., and Krauss, M. (2017). Identification of Mutagenic Aromatic Amines in River Samples with Industrial Wastewater Impact. Environ. Sci. Technol. 51, 4681–4688. doi:10.1021/acs.est.7b00426
Ogugbue, C. J., and Sawidis, T. (2011). Bioremediation and Detoxification of Synthetic Wastewater Containing Triarylmethane Dyes by Aeromonas Hydrophila Isolated from Industrial Effluent. Biotechnol. Res. Int. 2011, 1–11. doi:10.4061/2011/967925
Oliveira, G. A. R., Ferraz, E. R. A., Chequer, F. M. D., Grando, M. D., Angeli, J. P. F., Tsuboy, M. S., et al. (2010). Chlorination Treatment of Aqueous Samples Reduces, but Does Not Eliminate, the Mutagenic Effect of the Azo Dyes Disperse Red 1, Disperse Red 13 and Disperse Orange 1. Mutat. Research/Genetic Toxicol. Environ. Mutagenesis 703, 200–208. doi:10.1016/j.mrgentox.2010.09.001
Oral, R., Meriç, S., De Nicola, E., Petruzzelli, D., Della Rocca, C., and Pagano, G. (2007). Multi-species Toxicity Evaluation of a Chromium-Based Leather Tannery Wastewater. Desalination 211, 48–57. doi:10.1016/j.desal.2006.02.084
Ortega, L. M., Lebrun, R., Noël, I. M., and Hausler, R. (2005). Application of Nanofiltration in the Recovery of Chromium (III) from Tannery Effluents. Sep. Purif. Tech. 44, 45–52. doi:10.1016/j.seppur.2004.12.002
Osugi, M. E., Rajeshwar, K., Ferraz, E. R. A., de Oliveira, D. P., Araújo, Â. R., and Zanoni, M. V. B. (2009). Comparison of Oxidation Efficiency of Disperse Dyes by Chemical and Photoelectrocatalytic Chlorination and Removal of Mutagenic Activity. Electrochimica Acta 54, 2086–2093. doi:10.1016/j.electacta.2008.07.015
Pandey, A., Singh, P., and Iyengar, L. (2007). Bacterial Decolorization and Degradation of Azo Dyes. Int. Biodeterioration Biodegradation 59, 73–84. doi:10.1016/j.ibiod.2006.08.006
Paschoal, F. M. M., Anderson, M. A., and Zanoni, M. V. B. (2009). Simultaneous Removal of Chromium and Leather Dye from Simulated Tannery Effluent by Photoelectrochemistry. J. Hazard. Mater. 166, 531–537. doi:10.1016/j.jhazmat.2008.11.058
Rocha, O. P., Cesila, C. A., Christovam, E. M., Barros, S. B. d. M., Zanoni, M. V. B., and de Oliveira, D. P. (2017). Ecotoxicological Risk Assessment of the "Acid Black 210" Dye. Toxicology 376, 113–119. doi:10.1016/j.tox.2016.04.002
Rosu, M.-C., Coros, M., Pogacean, F., Magerusan, L., Socaci, C., Turza, A., et al. (2017). Azo Dyes Degradation Using TiO2-Pt/graphene Oxide and TiO2-Pt/reduced Graphene Oxide Photocatalysts under UV and Natural Sunlight Irradiation. Solid State. Sci. 70, 13–20. doi:10.1016/j.solidstatesciences.2017.05.013
Saratale, R. G., Saratale, G. D., Chang, J. S., and Govindwar, S. P. (2011). Bacterial Decolorization and Degradation of Azo Dyes: A Review. J. Taiwan Inst. Chem. Eng. 42, 138–157. doi:10.1016/j.jtice.2010.06.006
Tigini, V., Giansanti, P., Mangiavillano, A., Pannocchia, A., and Varese, G. C. (2011). Evaluation of Toxicity, Genotoxicity and Environmental Risk of Simulated Textile and Tannery Wastewaters with a Battery of Biotests. Ecotoxicology Environ. Saf. 74, 866–873. doi:10.1016/j.ecoenv.2010.12.001
Vacchi, F. I., Albuquerque, A. F., Vendemiatti, J. A., Morales, D. A., Ormond, A. B., Freeman, H. S., et al. (2013). Chlorine Disinfection of Dye Wastewater: Implications for a Commercial Azo Dye Mixture. Sci. Total Environ. 442, 302–309. doi:10.1016/j.scitotenv.2012.10.019
Venkata Mohan, S., Rao, N. C., and Sarma, P. N. (2007). Simulated Acid Azo Dye (Acid Black 210) Wastewater Treatment by Periodic Discontinuous Batch Mode Operation under Anoxic-Aerobic-Anoxic Microenvironment Conditions. Ecol. Eng. 31, 242–250. doi:10.1016/j.ecoleng.2007.07.003
Vichai, V., and Kirtikara, K. (2006). Sulforhodamine B Colorimetric Assay for Cytotoxicity Screening. Nat. Protoc. 1, 1112–1116. doi:10.1038/nprot.2006.179
Keywords: acid black 210 dye, analysis of tannery industry wastewater, degradation of leather dye, evaluation of tannery effluent, detection of degradation products
Citation: Christovam EM, Franco JH, Zocolo GJ, Fusco Almeida AM, Marcelino MY, de Oliveira DP and Boldrin Zanoni MV (2022) Stability of Acid Black 210 dye in Tannery Industry Effluent in Aqueous Solution Is Limited and Generates Harmful Subproducts. Front. Environ. Sci. 10:750647. doi: 10.3389/fenvs.2022.750647
Received: 30 July 2021; Accepted: 31 January 2022;
Published: 25 February 2022.
Edited by:
Kun-Yi Andrew Lin, National Chung Hsing University, TaiwanReviewed by:
Thomas Wi-Afedzi, University of Mines and Technology, GhanaRam Naresh Bharagava, Babasaheb Bhimrao Ambedkar University, India
Copyright © 2022 Christovam, Franco, Zocolo, Fusco Almeida, Marcelino, de Oliveira and Boldrin Zanoni. This is an open-access article distributed under the terms of the Creative Commons Attribution License (CC BY). The use, distribution or reproduction in other forums is permitted, provided the original author(s) and the copyright owner(s) are credited and that the original publication in this journal is cited, in accordance with accepted academic practice. No use, distribution or reproduction is permitted which does not comply with these terms.
*Correspondence: Jefferson Honorio Franco, amVmZmVyc29uaGZyYW5jb0BnbWFpbC5jb20=