
94% of researchers rate our articles as excellent or good
Learn more about the work of our research integrity team to safeguard the quality of each article we publish.
Find out more
ORIGINAL RESEARCH article
Front. Environ. Sci., 28 November 2022
Sec. Land Use Dynamics
Volume 10 - 2022 | https://doi.org/10.3389/fenvs.2022.689844
This article is part of the Research TopicLandscapes, Land-Use Change and Ecosystem Services in Colombia's Orinoquia Region: Recent Change and Future ProspectsView all 9 articles
 Rodrigo Jimenez1*
 Andres V. Ardila1
 Angela C. Vargas-Burbano1
 Andrea J. Hernandez1
 Elizabeth Leon-Velasquez2
The Colombian Orinoco savannas (254 thousand km2), also known as Orinoquia or Llanos, have been steadily transformed into pastures for more than a century, and since the 1990s, into commodity crop intensified production. The cropland area expanded at 12% yr−1 during the 2007–2018 period (65% larger than in 1996–2007). Yet, we estimate that cattle ranching occupied ten times more area (34%) than cropland (3.2%) in 2018. The rest of Orinoquia, including indigenous reservations and protected areas, was in a semi-natural state, although also exposed to seasonal fire. The three main crops, oil palm, corn, and rice (72% of the sown area in 2017), accounted for 68% of the expansion, with permanent crops expanding two times faster (18% yr−1) than short-cycle crops. An extrapolation of trends indicates that the cultivated area will double by 2040 (reaching 20 thousand km2), with oil palm as the dominant crop. Satellite measurements show that 7% of Orinoquia burned every year during the 1997–2016 period, yet with large spatial and interannual variations (±26%), and significant decrease trends (up to −4% yr−1). Up to 40% of the burned area (BA) interannual variability was linked to irregular rainfall and drought. The areas with the larger fractional BA were also those with the least fractional cropland cover. A model developed to describe this coupling, along with rainfall and other effects, successfully explained most of Orinoquia’s BA variability (r2 = 0.93). The fitted model indicates that each sown hectare reduced the BA by 0.17 ha. This model predicts that the combination of cropland expansion and independent BA decline will lead to a fourfold reduction of Orinoquia’s BA by 2040 referred to 1997. Orinoquia’s crop production generated 3 Gg of PM10 (particulate matter <10 µm) in 2016, mostly from short-cycle crops, while biomass burning generated 57 Gg, i.e., 95% of the combined emissions. These are expected to halve during the 2017–2040 period, despite an 83% increase in crop production emissions, as total and seasonal emissions will remain controlled by biomass burning. Such a large pollution burden reduction should have tremendous positive impacts on public health in Orinoquia and the Andes.
The increase in population, per capita income and consumption, and the market economy, along with the search for energy independence through the production of biofuels, has inevitably led to the incorporation of new lands into agriculture and its intensification (Lark et al., 2015). In the current globalized economy, these land use changes, particularly in developing countries, are frequently aimed at the supply of global demands, often driven by urbanization and economic expansion. Many countries, particularly in Southeast Asia, the Middle East and North Africa, some of them densely populated and rapidly industrializing, have practically run out of new arable land. FAO (2018) estimates that harvested areas will globally increase by 238 million hectares [Mha] between 2012 and 2050, mostly in Latin America and the Caribbean (20% increase) and Sub-Saharan Africa (62% increase). South America has been the region with the largest land use change for commodity production during the last decades. Pasture, cropland and tree plantation areas increased by 13%, 10% and 288%, respectively, from 1985 to 2018 (Zalles et al., 2021). Based on legal, institutional and economic reforms, infrastructure development, and better agricultural practices, including the use of agricultural inputs, Brazil, Argentina and other South American countries have dramatically increased their agricultural production since the 1990s (Schnepf et al., 2001; Graesser et al., 2018). Brazil, Argentina, Paraguay and Bolivia are currently the second, third, sixth and eighth largest soy producers in the world, respectively. These four countries jointly produced more than half of the 333 million tons of soybean consumed worldwide in 2019 (https://www.fao.org/faostat/en/#data/QCL). One very concerning factor is the flattening of the agricultural yield increase rate, which in 1985–2005 was only one third of that achieved in 1965–1985 (Foley et al., 2011). Moreover, global temperature increase and regional climate change are expected to reduce crop productivity and increase plant pathogen virulence and infection rates, further reducing crop yield (Anderson et al., 2020). This could hamper the reach of agriculture intensification.
Similar intensive agriculture development processes are taking place in the Colombian Orinoco River basin, also known as the Colombian Orinoquia or Llanos, whose agricultural transformation processes (García Durán, 2009; Etter et al., 2010) are similar to those carried out in the Brazilian Cerrado since the 1960s (Schnepf et al., 2001; Klink and Moreira, 2002), particularly the transformation of pastures for extensive cattle ranching into intensive agriculture (Quezada et al., 2022).
The clearing of savannas and forests for pastures and the replacement of pastures by crops (Quezada et al., 2022), along with other land use changes and the ensuing agricultural activities, cause multidimensional environmental impacts (Foley et al., 2011). These include biodiversity reduction and loss of habitats, unsustainable and conflicting water use, contamination of water and soils, including eutrophication (Tilman, 2001), changes in albedo, evapotranspiration, carbon inventories in soils, and emissions of greenhouse gases (GHG) (Silva et al., 2011) and air pollutants, including particulate matter (PM) (Aneja et al., 2008, Aneja et al., 2009; Zhang et al., 2008). Lumped together, agriculture (6.2 ± 1.4 Pg CO2eq year−1) and land use change and forestry (5.8 ± 2.6 Pg CO2eq yr−1) emitted a quarter of the anthropogenic long-lived GHGs between 2007 and 2016 (IPCC, 2019).
Here we estimate and analyze atmospheric emissions from agricultural activities and burning of savannas, and explore their coupling. We focus on emissions of PM10, i.e., of suspended particulate matter with aerodynamic diameter lower than 10 µm that can pass the larynx and reach the lungs. Agricultural emissions occur infrequently upon land use change and recurrently once crop production is established (Sharratt and Auvermann, 2014; Maffia et al., 2020). We focus on operational emissions from crop production, disregarding those from cattle production for reasons that are explained below. Routine emissions are proportional to either sown or harvested area, but depend heavily on several factors, including land preparation practices and harvest frequency.
Land clearing, preparation, tillage and harvesting emit dust (Sharratt and Auvermann, 2014; Sharratt and Van Pelt, 2020), i.e., crustal (soil) particles, that are mostly coarse (>2.5 µm). These and other pollutant emissions depend strongly on agricultural practices, soil humidity, edaphological factors, crop type and weather conditions. Emissions from dry soil traditional tillage (up to ∼35 kg PM10 ha−1) can be three orders of magnitude higher than on wet soils (Wang et al., 2010). These aerosol flux levels are comparable to those in polluted urban (Pachón et al., 2018) or industrial areas. Finer particles, usually measured as PM2.5 (aerodynamic diameter <2.5 µm), are also emitted by operations on soils, diesel combustion for mechanization, and burning of biomass, including for land preparation and pre-harvest and crop residue management practices (Mateus-Fontecha et al., 2022). Diesel and biomass burning particles are mostly carbonaceous (soot and organic) and frequently toxic.
Agriculture intensification generally requires increased inputs per unit area, e.g., capital, agrochemicals, and energy (including mechanization), compared to traditional agriculture. This implies that also pesticides, nitrogen oxides (NOx), ammonia (NH3), reduced sulfur compounds (e.g., H2S) and odors (e.g., organic acids) are released to the atmosphere (Tilman, 2001). Some of these primary pollutants are also precursors of secondary pollution, e.g., secondary inorganic PM2.5 can form from NH3. The estimation of these emissions and the resulting generation of secondary inorganic and organic aerosols (SIA and SOA, respectively) are beyond the scope of this paper.
Orinoquia, which a few decades ago was mainly an extensive cattle ranching region, is today experiencing rapid agricultural expansion and intensification. The cultivated area and agricultural production increased by more than 50% between 1996 and 2007 (Viloria de la Hoz, 2009). At the beginning of the 2010s, agricultural and industrial investors acquired over 2,000 km2 (200 thousand hectares [kha]) and invested more than 1.4 billion dollars in intensive agriculture projects aimed at commodity crop production, including oil palm and sugarcane as biofuel feedstocks and corn and soybean for pig and poultry farming (Dinero, 2011). The characteristics of the region and the Colombian public policy that promotes the development of Orinoquia’s High Plains (DNP, 2014) and the production of biofuels (DNP, 2008), suggest that this rapid transformation pace will be sustained in the decades to come.
Romero-Ruiz et al. (2010) estimated that 18.9% of the area transformed to livestock and agriculture in the High Plains in 2007 was from forest ecosystems. Also, Etter et al. (2010) estimated that the rate of transformation of native savannas into pastures, tree plantations and crops would reach 2% per year in the 2020s (equivalent to >2,000 km2 yr−1). Unless riparian forests and savannas are effectively conserved and agriculture conservation practices are implemented (Quezada et al., 2022), these transformations will turn Orinoquia from a small GHG sink into a significant source (Etter et al., 2010; Morales-Rincon et al., 2021). Similarly, air pollutant emissions are expected to significantly increase but the information on emissions and air quality is very limited (Hernandez et al., 2019). Also, no projection has been made so far on changes in air pollutant emissions due to land use changes and intensive agriculture in Orinoquia. Although our focus is on atmospheric impacts, it must be stressed that land use and land use changes cause multidimensional impacts, including on Orinoquia’s mega-biodiversity (Lasso et al., 2010).
In a previous investigation, we found that biomass burning (BB) was by far the largest PM10 emission source in the Colombian Orinoquia (Hernandez et al., 2019). At the peak of the dry season, the transport of BB aerosols from Venezuela and within Colombia triggered multi-day pollution episodes with very high PM10 concentrations in two Orinoquia cities (Hernandez et al., 2019; Rodríguez-Gómez et al., 2021). Likewise, it has been demonstrated that these BB plumes were frequently transported to the Colombian Andes Eastern Cordillera (see Figure 1), also causing episodes in Bogota (Mendez-Espinosa et al., 2019; Ballesteros-González et al., 2020; Rincón-Riveros et al., 2020) and other Andean cities.
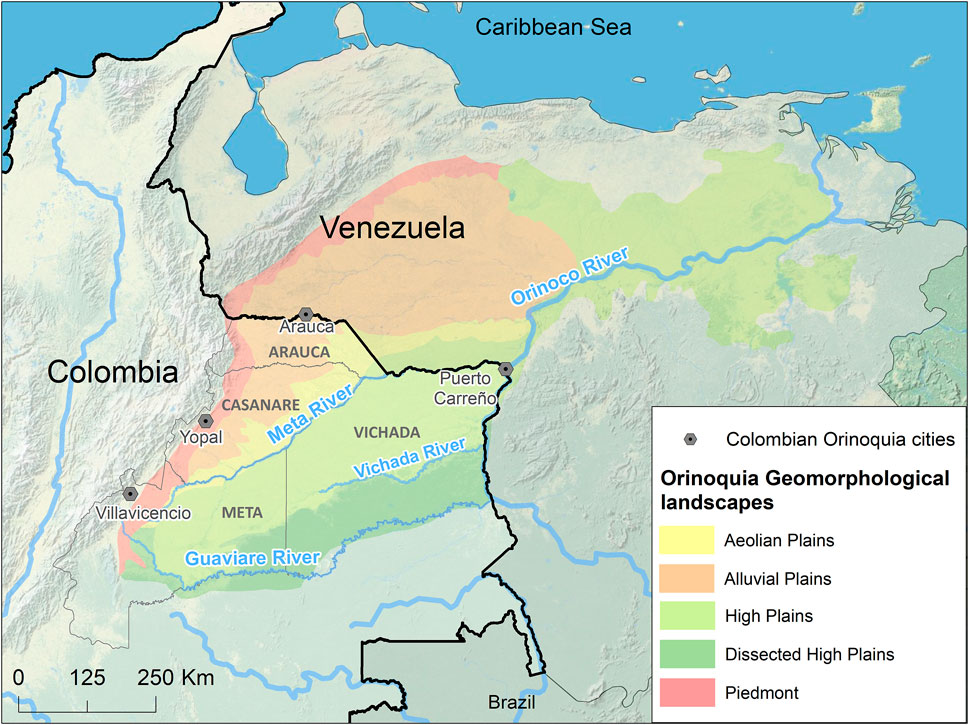
FIGURE 1. A map of the Orinoco River savannas, also known as Orinoquia or Llanos, depicting landscapes, provinces and cities (in Colombia only). Roughly, the Meta River splits the Colombian Orinoquia into the High Plains to the south and a seasonally floodable region to the north.
Etter et al. (2010) hypothesized that agriculture expansion in Orinoquia would cause “reduction in fire frequency”. Based on satellite-derived products and after correcting for precipitation variation effects, Andela et al. (2017) reported that the number, mean area of fires and the aggregated burned area (BA) were decreasing worldwide, mainly due to agriculture expansion and increasing population densities. The estimated reduction trend for South America ranged from −1.4% yr−1 to −2.7% yr−1, depending on the satellite product (from −0.5% yr−1 to −1.8% yr−1 after adjusting for precipitation variability effects). They proposed a conceptual model that accounted for the agriculture-fire coupling complexity, in which BB increases or decreases depending on the level of sophistication and investment in agriculture. Thus, cropland expansion could have contradictory effects on PM emissions: while crop production PM10 emissions are relatively small compared to those of BB, the rapid expansion of intensified agriculture might suppress BB. Subsequent studies have confirmed the BB trend, its beneficial impact on carbon uptake (Arora and Melton, 2018), and shown progress towards BB area prediction using mechanistic (Pechony and Shindell, 2009; Knorr et al., 2016; Lasslop and Kloster, 2017; Rabin et al., 2017; Venevsky et al., 2019) and neural networks (Joshi and Sukumar, 2021) models. Here we use the available data to estimate the coupling and combined emissions scenarios.
Using time series of sown and harvested areas, precipitation and BA, we aimed at answering the following research questions: What are the sown area trends and their variability in the Colombian Orinoquia, disaggregated by crop and region? How time and spatially variable and dependent on precipitation are the burned areas? How to tell apart the effects of cropland expansion on BB from those of other drivers in the Colombian Orinoquia? What are the combined effects of crop production and BB on PM emissions when their coupling is considered? For this purpose, we estimated and extrapolated the cropland expansion, implemented a detailed emission model, and estimated the resulting cropland PM emissions. Then, we developed a model that enlightens the agriculture-BB coupling, looked for and analyzed precipitation-BA and then sown-burned areas relationships, and calculated BA and emissions scenarios for the Colombian Orinoquia based on variations of the coupling coefficient. It should be noted that, in the tropics, the same physical area can be sown over 2-3 cycles per year. The available information is not detailed enough for precise discrimination between physical and sown area, nor does it allow determining what percentage of cropland expansion is due to displacement of the agricultural frontier, i.e., of the interface between agricultural areas and areas with no direct economic purpose, typically native savanna or riparian forests. Also, available data on livestock production land use are currently not accurate enough so they were not explicitly included in our analyses.
The total area available and suitable in a region for sowing a given crop is limited. This includes areas already used for agriculture and “new” land suitable for use change, e.g., from degraded or improved pastures to commercial crops (Castiblanco et al., 2013; Quezada et al., 2022). The limitation is also determined by meteorological variables, particularly rainfall and photosynthetic active radiation (Morales-Rincon et al., 2021), soil and terrain characteristics, location and infrastructure (Etter et al., 2010; Castiblanco et al., 2013), technology and security. If the maximum area that can be sown (i.e., the area asymptotic or saturation limit, also known as “carrying capacity”) is large, as it is in Orinoquia, the initial expansion rate is expected to be slow and linear, then faster around the expansion mid-point (exponential phase), and afterwards again slow as the sown area approaches its carrying capacity. This sown area (
where
Fitting sown area to the logistic model at the beginning of the expansion process, when only a small fraction of the carrying capacity has been developed, is likely to produce misleading, highly biased parameter estimations and forecasts, particularly if sown areas are highly variable. In the initial expansion phase, a more robust representation and forecast can be obtained by fitting a simple normalized linear model,
where
We included only direct crop production emissions in our inventory, i.e., only those directly attributable to crop production in the sown area. This excluded, e.g., emissions due to transportation of crop inputs and harvest products to and from farms. The full crop lifecycle was considered in the calculations to account for both recurring and infrequent emissions. Three activity groups were included: A) Land preparation and sowing (infrequent for permanent crops; rather recurrent for short-cycle (SC) crops); B) Harvesting (recurrent—only after long maturation periods for some permanent crops); and C) Machinery (diesel and aerial spraying aviation gasoline combustion emissions—recurrent). Land preparation emissions were thus “diluted” over their lifecycle, which, e.g., for oil palm, implies diluting month-long emissions over ∼25 years. Each activity group was further disaggregated into their constituting processes, e.g., land preparation and sowing included land planning, subsoiling, discing, harrowing, weeding, and mechanized sowing operations, the emissions of which depended on the number of passes applied. We first calculated process-based emission factors (EFs) for each of the 69 crops, and then, based on their similarity, we grouped similar crops and calculated weighted crop-group equivalent EFs. For this, we prepared a binary matrix that described the activities required by each crop. The information on crop-dependent practices and their frequency was obtained from crop production professionals and practitioners with experience in Orinoquia. The activities in the groups A and B mainly generate dust, i.e., mostly coarse mode crustal particles (>2.5 µm). The machinery group mainly generates fine mode (<2.5 µm) carbonaceous particles. Further details are provided in the Supplementary Material. The resulting crop group EFs are presented in Table 1.
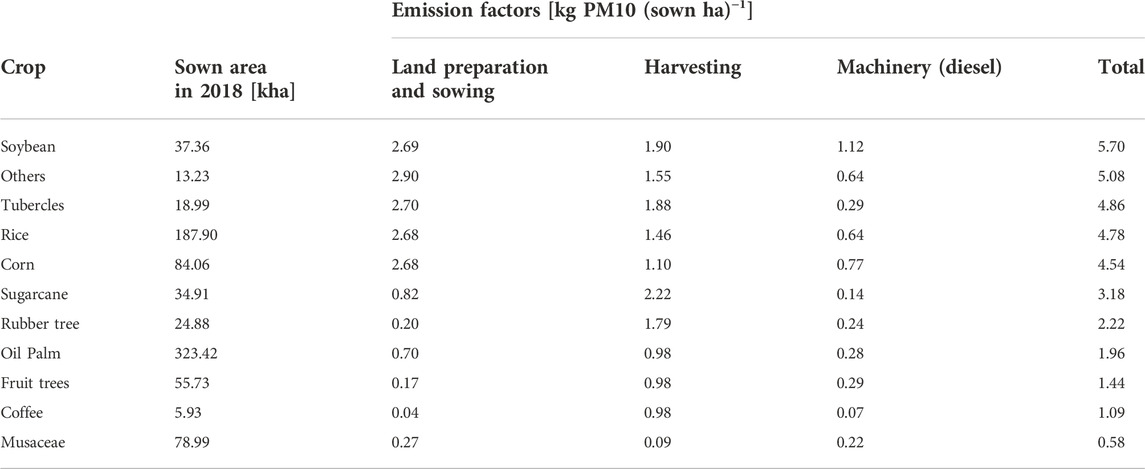
TABLE 1. Crop production emission factors disaggregated by activity and crop group.
Biomass burning emissions were bottom-up calculated by multiplying the mass-based particulate matter (PM) emission factor by the biomass burned. This last one was estimated as the product of burned area, biomass density, and combustion efficiency. Mass-based emission factors, biomass density and combustion efficiency, all depend on the type of vegetation burned. For Orinoquia savannas, the biomass density (“fuel load”) ranges from 6 to 7 metric tons (ton) per hectare (ha) and the combustion efficiency from 0.70 to 0.85 (Etter et al., 2010). In their compilation of emission factors, Akagi et al. (2011) report a savanna burning PM emission factor of 7.17 ± 3.14 g (kg dry matter)−1. This paper also indicates that most of the BB emissions are in the fine mode, i.e., BB PM2.5 and PM10 emissions are nearly identical. The resulting area-based emission factor (EF) for PM10 is 36.12 kg (burned ha)−1.
Vegetation fires require fuel and ignition, and once set, they can spread or be suppressed. Most fire predictive models (Rabin et al., 2017) estimate fractional BA (e.g., Knorr et al., 2016) (or number of ignitions per unit area—Venevsky et al., 2019) by non-linear factoring available vegetation, flammability, and human population density. Some models use adjoint biogeochemical models to estimate available biomass. As modeled, anthropogenic fire frequency peaks at mid population densities as ignitions are infrequent with sparse populations and fire is actively suppressed near urban and suburban settlements. Despite their complexity, only a few models explicitly incorporate cropland fraction as a strong fire suppression factor, most notably JSBACH-SPITFIRE (Lasslop and Kloster, 2017). The conceptual model below was developed to better understand the linkages between land use, land-use heterogeneity, and BB, rather than for vegetation fire mechanistic prediction.
Orinoquia’s traditional cattle ranchers have viewed burning as a native pasture “renovation” practice (López-Hernández et al., 2005; García Durán, 2009; Etter et al., 2010). As this is a common practice, and cattle occupies a large fraction of Orinoquia, it is reasonable to assume that a significant portion of the cattle grazing native pastures are burned on a regular basis. Unfortunately, there are presently no statistics available on this practice. On the other hand, due to the perceived high value of commercial crops and the soils that sustain them, particularly if conservation practices are in place, areas sown with improved pastures or commercial crops are expected to be less susceptible to burning than other areas, e.g., those dedicated to extensive cattle ranching or native savanna. We thus hypothesize that the net effect of cropland expansion in Orinoquia has been a reduction of the burned area (variable
As per the considerations above, only three lumped land uses were included in the model: 1) cropland (subscript S, which stands for sown); 2) livestock production (subscript L), mainly extensive cattle ranching with low stocking rates; and 3) areas mainly in a near natural state, protected or not, including indigenous people reservations (subscript 0). The total area,
The high value of crops and soils also implies that farmers actively suppress fire not just on their farms but also around them. This perimeter fire suppression notion is based on various conversations, including with a representative of the agricultural community fire brigade at Puerto López (Meta, Colombia). The brigade, which started with just four people, is currently about 60 strong and supported by local and national authorities, including the Civil Defense and Emergency Committees. Besides setting 4–6 m wide buffer land strips (firebreaks) around their croplands, brigade farmers communicate and suppress any proximity fires. Moreover, some farmers now deploy ISO water tanks near their farm fields and own water tankers. Overall, this suggests that cropland fire suppression spreads to neighboring areas, i.e., livestock and “natural” areas near cropland areas are less likely to burn than their inland counterparts. Therefore,
It seems reasonable to assume that the normalized burning rates of livestock and “natural” areas near the cropland perimeter are similar, i.e.,
where
where
As per its assumptions, this equation describes the effect on BA of replacing cattle grazing areas by croplands. The first term to the right describes the replacement direct effect owing to the change in normalized burning rate upon land use change. The rightmost term describes the perimeter fire suppression second order effect due to change in cropland perimeter.
We know that currently in the Colombian Orinoquia
The Orinoco River basin (ORIB) is the 8th largest watershed in area and the 3rd highest in water discharge to the ocean in the world. Its total area of 981,446 km2 is shared by Venezuela (65%) and Colombia (35%, i.e., 343,506 km2). This investigation is about the Colombian Orinoquia, or Colombian Llanos, i.e., the Colombian share of the mostly-savanna fraction of ORIB. There are several definitions of Orinoquia, and hence its boundaries and areas vary (Hernández Villamizar, 2019). Here we use the definition of Trujillo González et al. (2010), which equates the Colombian Orinoquia to the provinces of Arauca, Casanare, Meta, and Vichada. These 4 provinces add up to 254,271 km2 (25.4 Mha) of mostly savannas (Supplementary Table S1). The remaining 26% of the Colombian ORIB is made up of transition zones with neighboring basins and regions (Andes, Amazonia, and Guayana Shield).
The Colombian Orinoquia is a complex set of 5 geomorphological landscapes (Piedmont, Alluvial Plains, Eolian Plains, High Plains, and Dissected High Plains), covering 22.3% of the Colombian continental territory, with altitudes between 80 and 500 m above the sea level, and ecological gradients between the Colombian Andes (Eastern Cordillera) and Amazonia. Their soils are mostly of low fertility, acidic, with low organic carbon content and toxic levels of iron and aluminum (Viloria de la Hoz, 2009). Among other factors, this is the result of seasonal exposure to floods, droughts, burning, and high winds. Because they are not subject to seasonal flooding, and due to their topographic characteristics, the flat High Plains (Altillanura in Spanish) are being rapidly transformed into mechanized agriculture. DNP (2014) estimated that 28 thousand km2 of the 42 thousand km2 of the High Plains had potential for crop and cattle production, and forestry.
The Colombian Orinoquia is distributed among the provinces (Departmentos) of Arauca (23,818 km2), Casanare (44,640 km2), Meta (85,635 km2), and Vichada (105,947 km2). Officially, it also includes smaller areas of the provinces of Guaviare, Guainía, Boyacá and Cundinamarca (Viloria de la Hoz, 2009). The four main provinces were home to 1.3 million inhabitants (Mhab) in 2018 (57% in Meta and 23% in Casanare). Although Orinoquia is one of the least populated regions of Colombia, its population grew 30% faster than Colombia’s during the 1985–2015 period, mainly due to internal migration. During the same period, the fraction of rural population in the Colombian Orinoquia decreased from 43% to 30% (https://microdatos.dane.gov.co/index.php/home).
Publicly available information on land use in the Colombian Orinoquia is currently deficient. There are accurate data on 1) indigenous peoples’ reservations (40,759 km2—Díaz Lemus et al., 2017), and 2) national parks and other public and private protected areas (24,897 km2—https://www.parquesnacionales.gov.co/portal/es/sirap-orinoquia/areas-protegidas-del-sirap-orinoquia/). Based on detailed permanent and SC crop sown area (see below), and assuming that SC crops are harvested 2 times a year and undergo fallow every 4 years, and that infrastructure (e.g., internal roads and storage facilities) occupies 10% of the cropland area, we reckoned the 3) cropland physical area at ∼8,192 km2 in 2018, i.e., 95% of the reported total sown area. Based on cattle statistics (https://www.fedegan.org.co/estadisticas/inventario-ganadero) and stocking rate estimations per province (∼0.36 animal units—adults—per ha, weighted average), and information on calf share (41.4%), we gauge the 4) livestock area at ∼86,058 km2 (see Supplementary Table S1 for details and references). The remainder ∼94,365 km2 out of the 254,271 km2 of the Colombian Orinoquia are likely non-official “natural” areas, as defined by the coupling model above. Thus, we estimate that “natural”, livestock, and cropland areas used 63%, 34% and 3.2%, respectively, of the Colombian Orinoquia in 2018, which is consistent with Etter et al. (2010) estimation of savanna clearing (37%) by 2020. The number of cattle in the Colombian Orinoquia increased almost linearly by ∼60% during the 2001–2021 period (https://www.fedegan.org.co/estadisticas/inventario-ganadero). If this trend continues and stocking rates are not improved, ∼1,886 km2 yr−1 will most certainly be incorporated for livestock in the years to come, likely by subtraction from “natural” areas.
We retrieved the Colombian Orinoquia sown and harvested areas [ha yr−1], and their production [ton yr−1] and yields [ton ha−1] from the Colombian Ministry of Agriculture (MinAgricultura) AGRONET database (https://www.agronet.gov.co). The available, most recent dataset covers the 2007–2018 period at annual resolution, with 69 crops disaggregated by 59 municipalities in the 4 provinces. We further reaggregated the crops into 11 groups and by province for simplicity. After considering the characteristics of the crops, the primary criterion for crop grouping was the similarity of their effective emission factors. Oil palm was not clustered with any other crop considering its relevance and emissions characteristics. The crop groups were the following (in descending order according to sown area in 2017): oil palm, rice (upland and paddy), corn, soybean, musaceae (banana plantain included), fruit trees (cocoa included), sugarcane, rubber tree, tubercles (and root crops, cassava included), others, and coffee. “Others” is a rather heterogeneous group, but with a very small aggregated sown area. Unfortunately, there is no information on the area sown with improved (“exotic”) pastures as these are not officially accounted as crops.
We analyzed the cropland expansion by crop and by province using the logistic and linear models above. Many permanent crops take years to reach maturity so they can be harvested. Due to the implicit value of these long payback periods, one would expect them to be more actively protected from fire than SC crops. Moreover, SC crops generate more PM10 emissions than permanent crops (Table 1). Therefore, we also analyzed the trends of the permanent (oil palm, musaceae, fruit trees, sugarcane, rubber tree, coffee) and short-cycle (rice, corn, soybean, tubercles) crop categories.
We obtained the BA time series for the polygon-defined areas of the 4 Colombian Orinoquia provinces for the longest, most recently available time period (1997–2016), from the Global Fire Emissions Database (GFED4, Giglio et al., 2013) site (http://globalfiredata.org/pages/data/). Although GFED data has been extensively validated, it is well known that GFED and other satellite products systematically miss small fires (Ramo et al., 2021). As Orinoquia savanna fires are predominantly small (Hernandez et al., 2019; Hernández Villamizar, 2019), GFED’s burned areas are likely underestimated yet suitable for the purposes of this paper. BA linear trends were estimated using Eq. 2.
Vegetation fires require biomass to accumulate over time and then to dry enough to burn. The accumulation process is complex and non-linearly controlled mainly by water availability and solar radiation (Morales-Rincon et al., 2021). Also, nominal drought conditions must persist for several days for biomass to be set on fire. These two processes are thus mainly ruled by precipitation. Therefore, the BA is expected to be significantly, although probably also non-linearly, correlated with precipitation, particularly under severe drought conditions, e.g., due to El Niño (ENSO) events (drought in Orinoquia). Our research showed that the monthly and daily precipitation levels played a more important controlling role in the Orinoco savannas’ growth than the accumulated annual precipitation (Morales-Rincon et al., 2021).
For correlation purposes and to ensure full spatial coverage, we used reanalysis ERA5 (Hersbach et al., 2019) monthly precipitation data, spatially averaged for the 4 Colombian Orinoquia provinces. These data were retrieved from the Copernicus Climate Data Store (CDS) (https://cds.climate.copernicus.eu/cdsapp#!/dataset/reanalysis-era5-single-levels-monthly-means?tab=form). We validated the reanalysis data by comparison with IDEAM’s (Colombian Institute of Hydrology, Meteorology and Environmental Studies) raingauge network measurements (http://dhime.ideam.gov.co/), which are unevenly distributed and scant in a large portion of Orinoquia. See Supplementary Figure S2. We also analyzed the 40-year monthly precipitation reanalysis time series, particularly for trend detection using simple linear regression and a LOESS (locally estimated scatterplot smoothing)-based seasonal trend decomposition procedure (STL; Cleveland et al., 1990).
We correlated annual province burned area and its anomaly (burned area residual after linear trend removal) with statistical descriptors of province annual precipitation level (monthly mean, maximum precipitation, annual sum of monthly positive anomalies), annual variability (annual range, monthly standard deviation), and annual drought (monthly minimum precipitation, annual sum of monthly negative anomalies), and linear, exponential and logarithmic combinations of non-covariant descriptors. We selected a correlation function based on goodness of fitting, simplicity and plausibility.
Satellite measurements show that BB is decreasing worldwide for reasons that are not fully understood (Knorr et al., 2016; Andela et al., 2017; Joshi and Sukumar, 2021). In many regions of the world, including Orinoquia, the declining trend is blurred by high time and spatially variability. BB in Orinoquia is a very complex phenomenon, mostly anthropogenic (Hernández Villamizar, 2019), but strongly modulated by meteorological conditions. Our fitting and scenario calculation model assumes that the BA can be reasonably explained by the linear combination of the following four terms: A) A constant term equal to the BA at zero relative time corrected for rainfall variability and cropland coupling effects; B) A rainfall-dependent term expected to explain most of the BA interannual variability as sown area changes slowly over time; C) A cropland area—BA coupling term; and D) A time-decreasing trend term intended to explain BA decline unrelated to cropland expansion, e.g., due to increasing landscape fragmentation and woody fraction (at least partially attributed to CO2 fertilization—Rosan et al., 2019). Orinoquia’s sown area is currently much smaller than its BA. Thus, one would expect the term “C” to be comparatively smaller than the terms “B” and “D”. For this reason, we obtained sequential, least-squares approximations to the model and fitting coefficients per province and Orinoquia’s as follows: 1) BA linear trend estimates (terms “A” and “D”); 2) Rain descriptors and trends as explanatory variables (terms “A”, “B”, and “D”); 3) Full model.
The agricultural PM10 emissions per crop group and province were calculated using the sown area based effective emission factors presented in Table 1. These emissions were also aggregated by province and crop type (permanent or SC). BB emissions were estimated using the effective emission factor as discussed in Section 2.2.
PM10 emissions due to crop production in Orinoquia are much lower, less variable and have a much clearer trend than BB emissions. Thus, for building emission scenarios to year 2040, we disregarded the uncertainty in the sown area trends, and instead focused on the BA uncertainty. Various studies indicate that climate change could shift the current anthropogenic-driven fire regime to a temperature-driven regime from the mid-21st century on (Pechony and Shindell, 2010; Knorr et al., 2016). Incorporating climatic and meteorological trends or shifts into the Orinoquia BA scenarios is beyond the scope of this paper. Therefore, we based the province-level and Orinoquia-aggregated BA scenarios on the coupling coefficient uncertainty. Besides the mean scenario, i.e., projected province and Orinoquia-aggregated burned areas calculated with a least-squares coupling coefficient (
The time-dependent logistic model in Eq. 1 severely underestimated the cropland expansion in Orinoquia. Moreover, in the case of Meta, the logistic model was unreliable, as evidenced by the large discrepancy between forecasts that included or excluded the last data point (Supplementary Figure S3). These undesirable features were associated with the sown area high variability and reduced number of data points, and the fact that the cropland area is currently quite far from its “carrying capacity” level. Cropland currently occupies only ∼10 thousand km2 out of the 254 thousand km2 of the Colombian Orinoquia. Using improved pastures and integrated crop-cattle production systems, cattle raising could significantly decrease its footprint. A 30% increase in stocking rates could “free” ∼20 thousand km2, which is twice as much as the “new” cropland area required by 2040. It must be mentioned that the resource-regulated logistic models applied to Orinoquia by other investigators (Etter et al., 2010; Castiblanco et al., 2013) apparently do not suffer from the problems reported here.
The Colombian Orinoquia sown area increased by 494 ± 47 km2 (49 ± 5 kha; plus/minus is 1-sigma) on average every year during the 2007–2018 period. See Figure 2. This is ∼65% faster in relative terms than during the 1996–2007 period (Viloria de la Hoz, 2009). Almost all (86%) of this expansion took place in Meta (275 km2 yr−2) and Casanare (148 km2 yr−2), the provinces with the largest cropland areas (6,172 km2 yr−1 and 2,707 km2 yr−1, respectively, out of the 10,028 km2 yr−1 sown in 2017). Arauca and Vichada had much smaller cropland areas but comparable or much larger expansion rates in relative terms (10 ± 3% yr−1 and 152 ± 43% yr−1, respectively). Vichada, a 100 thousand km2 province, i.e., slightly larger than Hungary, had less than 500 km2 of crops during the 2010s, yet this was a ∼20-fold increase compared to the sown area in 2007 (22 km2). Agriculture has been rapidly but also irregularly expanding in Vichada, the province with the most fragile soils in Orinoquia. Also, it is likely that a significant fraction of the cropland expansion in Vichada has occurred at the agricultural frontier, i.e., involving clearing of native savannas.
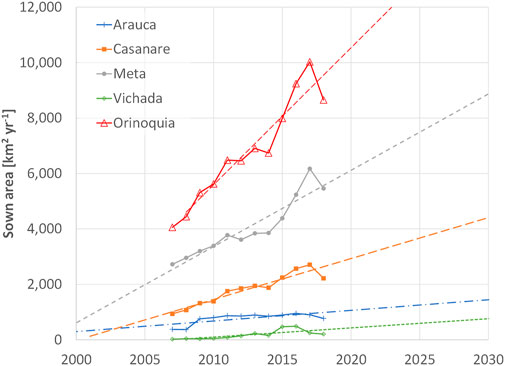
FIGURE 2. Sown area in Colombia’s Orinoquia, broken down by province. The dashed lines are the extrapolated linear fits (Eq. 2) for the provinces and their aggregate for Orinoquia.
A large fraction of the sown area growth came from the sustained expansion of oil palm (207 km2 yr−2) and corn (66 km2 yr−2), and the much variable growth of rice (62 km2 yr−2). See Figure 3. Moreover, crops that were minor in 2007, particularly sugarcane and rubber tree, grew at staggering rates of 46 ± 8% yr−1 and 89 ± 3% yr−1, respectively (Supplementary Figure S4). In relative terms, permanent crops have expanded more than twice faster and more steadily (18 ± 1% yr−1) than short-cycle crops (7 ± 2% yr−1). The steady growth of permanent crops is to some extent tied to their more stable nature and likely to their higher market stability and lower price volatility. On the opposite side, the impact of higher volatility is evident for rice, which still is the second most important crop in Orinoquia but with a comparatively lower and highly variable growth rate (4 ± 2% yr−1).

FIGURE 3. Sown areas and their growth rates in Colombia’s Orinoquia, broken down by crop group.
GFED estimated that 16,806 ± 4,328 km2 (1.68 ± 0.43 Mha) burned annually in Orinoquia during the 1997–2016 period. This means that 6.6% of Orinoquia burned annually, with large differences among provinces, from 3% in Casanare to 9% in Vichada. This is a large burned area, both in absolute and relative terms (a factor ∼2 larger than the cultivated area in Orinoquia and just a factor ∼2 smaller than the area burned annually by wildfires in the United States, a country that is ∼40 times larger than Orinoquia). See Supplementary Figure S5. Half of the burned area occurred in Vichada and another ∼30% in Meta. The provinces with the larger fractional burned areas (9% in Vichada and 6% in Arauca) were also the provinces with the least fractional cropland cover. Moreover, an analysis of the normalized BA revealed that despite the large absolute differences in BA among the provinces, the detrended normalized BA anomalies (BA minus trend) are significantly and positively correlated, particularly between Vichada and Casanare (r2 = 0.62), and to a lesser extent, between Meta and Arauca (r2 = 0.28). See Figure 4. This suggests that the burned area is strongly modulated by weather effects. For instance, the 2014–2016 regional BB peaking periods (positive anomalies) might be linked to a strong El Niño (ENSO) episode (Navarro-Monterroza et al., 2019). Also, significant BA decreasing trends were observed in Meta (−3.7 ± 1.1% yr−1), Vichada (−1.3 ± 1.1% yr−1), and Arauca (−1.0 ± 1.0% yr−1). These are comparable to the South America trends reported by Andela et al. (2017). Casanare’s BA trend (−0.2 ± 0.8% yr−1) was indistinguishable from its variability. Meta, the province with the largest permanent (3,451 km2 yr−1 in 2017) and SC (2,578 km2 yr−1 in 2017) crop areas, showed the largest decreasing trend. On the other hand, with less than ∼500 km2 of crops, the decreasing trend in Vichada cannot be explained by cropland “inhibition” alone.
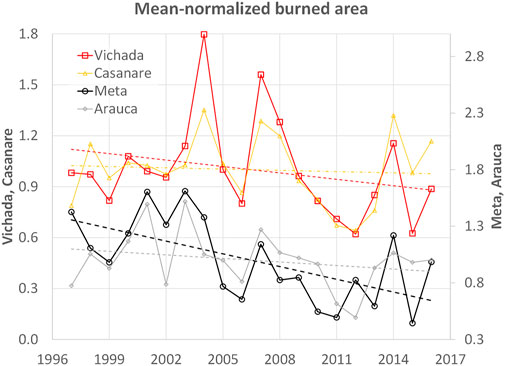
FIGURE 4. Mean-normalized burned areas in Colombia’s Orinoquia, disaggregated by province. Dashed lines are linear fits (Eq. 2).
The raingauge-validated, 40-year long ERA5 precipitation dataset (Supplementary Figure S2) showed that the annual rainfall in the High Plains provinces of Vichada (2760 ± 195 mm yr−1) and Meta (2630 ± 225 mm yr−1) was climatologically ∼10% higher than in the seasonally flooded provinces of Arauca (2557 ± 296 mm yr−1) and Casanare (2357 ± 264 mm yr−1). Although all of these represent comparatively high precipitation levels, it must be stressed that Orinoquia’s annual precipitation cycle encompasses a ∼3-month long dry season, which can be severe enough to provide conditions for a large number of fires. The dry season severity was higher in the seasonally flooded provinces.
Both linear regression and STL revealed quite concerning long-term precipitation decrease trends in the four provinces, particularly from the beginning of the 1990s on (Supplementary Figure S6). On average, the annual rainfall in Arauca, Casanare, Meta, and Vichada decreased by 17, 16, 10, and 7 mm per year, respectively, during the 1979–2019 period. The much larger decreasing trend in the seasonally flooded provinces has accumulated over time, so annual rainfall was 18% lower in Arauca and Casanare compared to the High Plains provinces during the 2016–2019 period. Although biomass accumulates less if rainfall diminishes, a standing reduction in precipitation likely implies that the fire frequency and possibly also the burned area per fire event will increase over time. Instead, the burned area has diminished in most of Orinoquia, which suggest that effects other than climatological have played a controlling role in BB (Figure 5). These might include landscape fragmentation, woody vegetation encroachment, and cropland expansion. Explicit modeling of the first two effects is beyond the scope of this paper, so we simply modeled them as a weather-uncorrelated time trend.
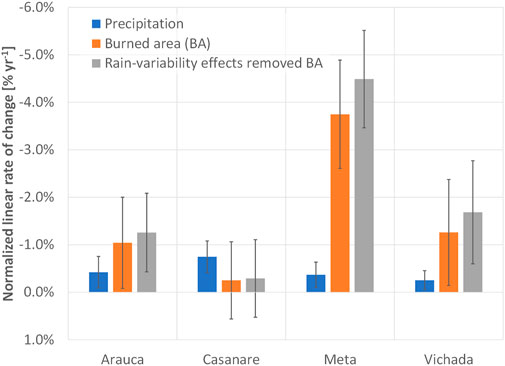
FIGURE 5. Normalized linear trends for rainfall, burned area, and burned area corrected for rainfall variability during the 1997–2016 period.
The function we found that described with the highest statistical significance the burned area-rain relation was the logarithm of the ratio of rainfall annual standard deviation to rainfall minimum (“rainfall function” hereafter). This was also a biogeochemically sound function as BA is expected to increase during severe dry seasons or drought periods and when rainfall becomes very irregular. The BA normalized trend and the rainfall function were simultaneously fitted for each province using the following model,
where
As explained in Section 3.4, we adopted a sequential fitting approach (plain trends → rainfall effects → coupling coefficient) given the fact that the cropland area in Orinoquia is still relatively small. The province-level BA full model thus incorporates rainfall, cropland fire suppression and unidentified trend effects as follows,
All parameters but the coupling coefficient,
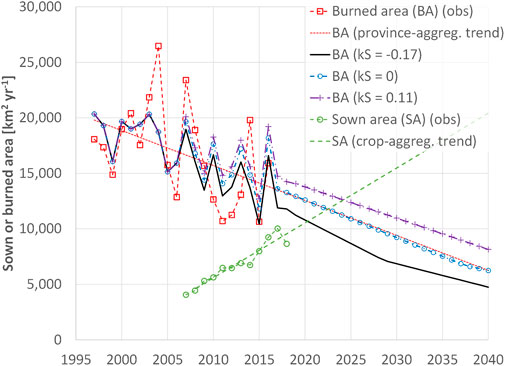
FIGURE 6. Observed and projected aggregated sown and burned areas in Orinoquia from 1997 to 2040. The projection included the following three scenarios: coupling as least-squares fitted (KS = −0.17), no coupling (KS = 0), and highly-positive coupling (KS = 0.11).
The cropland area was projected by aggregating the estimations based on both the province and the crop-group trends (Eq. 2), reaching perfect agreement. Both estimate that the sown area will double by 2040, reaching 20,425 km2 yr−1 (2.04 Mha yr−1). See Figures 2, 6. The linear trends predict that oil palm will become the dominant crop in Orinoquia with 39% of the sown area by 2040, compared to 32% in 2017. Most of oil palm’s gained share is estimated to come from rice, the participation of which is estimated to drop from 28% in 2017 to 18% by 2040. Estimated changes in participation for other crops are minor. Also, Casanare’s and Vichada’s participation will increase, at the expense of Meta’s, from 27% to 2% in 2017 to 29% and 5% in 2040, respectively. It is worth emphasizing that these simple linear models disregard crop prices, market trends, meteorological factors, and public policies, which likely account for most of the sown area change and variability.
The full model (Eq. 8) with the least-squares fitted coupling coefficient (
Our emission factor (EF) calculations show that SC crops emitted a factor ∼3 more PM10 per sown hectare than permanent crops (Table 1). Short-cycle crops require more land preparation (∼7 times higher EFs), for which they use more diesel machinery (∼3 times higher EFs) than permanent crops. This is further amplified by the fact that SC crops may be harvested up to three times per year (accounted for as sown area). In turn, the sown area weighted crop production EF, 3.3 kg PM10 (sown ha)−1 in 2016 (3 kg PM10 (sown ha)−1 in 2018), was an order of magnitude smaller than the biomass burning EF.
We estimate that crop production in Orinoquia generated 3 Gg (kton) of PM10 in 2016, 71% of which came from SC crops (Figure 7). In turn, biomass burning generated 57.5 Gg of PM10 that same year, i.e., 95% of the combined emissions. The BB emissions were not just ∼20 times larger but also significantly more toxic. We predict that the sown area will increase by a factor of 2 by 2040 referred to 2017. In turn, crop emissions will increase only by 83%, due to the faster expansion of oil palm compared to SC crops. In contrast, the BB emissions (with
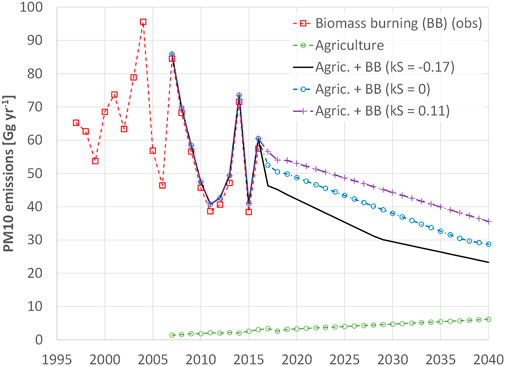
FIGURE 7. Observed and projected crop production, biomass burning, and combined PM10 emissions until 2040. The projection included the same three coupling scenarios as in the previous figure.
The combined BB and crop production annual PM10 emissions in the Colombian Orinoquia in 2016 (60.5 Gg yr−1) were very similar to the total PM10 emissions in Bogota (68.2 Gg yr−1—Pachón et al., 2018), a 9.3 Mhab metropolitan area. The main difference between two is their timing: 95% of Orinoquia’s emissions are due to BB, most of which occurs during the 3-month dry season (Hernandez et al., 2019). Thus, PM10 fluxes from the Colombian Orinoquia are seasonally ∼4 times larger than Bogota’s urban fluxes. These emissions are transported to Bogota and other Andean cities causing major air pollution episodes (Mendez-Espinosa et al., 2019; Ballesteros-González et al., 2020; Rincón-Riveros et al., 2020). If the uncorrelated component of Orinoquia’s BA decline trend holds, a sustained BA decrease in Orinoquia will have major positive impacts on air quality and public health, both in Orinoquia (1.3 Mhab) and the Colombian Andes (>10 Mhab).
We estimate that 34% of Orinoquia’s 254 thousand km2 (25.4 Mha) was used for cattle ranching (mainly extensive) in 2018, which, based on cattle statistics and stocking rate data, expands at 2% yr−1 (1,886 km2 yr−1). Indigenous reservations, national parks (and other protected areas), and crops occupied 16%, 9.8%, and 3.2% of Orinoquia’s, respectively. The remaining 37% of the region is likely still in a semi-natural state, including fire-susceptible native savanna at risk of incorporation into agriculture, particularly at the agricultural frontier.
Colombia’s Orinoquia cropland area (10 thousand km2 in 2017) has been rapidly and steadily expanding since the 1990s. The current (2007–2018) area-averaged linear expansion rate (12% yr−1) is 65% larger than that observed during the 1996–2007 period, which indicates that cropland expansion in Orinoquia has been long-term accelerating. Most (86%) of the cropland expansion in the 2007–2018 period took place in the Meta and Casanare provinces, which share 89% of sown area. Although oil palm, corn, and rice accounted for 68% of the sown area growth rate (494 km2 y−2), permanent crops expanded more than twice as fast (18% yr−1) and more steadily than short-cycle (SC) crops.
According to GFED, on average 7% of Orinoquia (17 thousand km2; 1.7 Mha) burned every year during the 1997–2016 period, although with large differences among provinces and significant interannual variability (±26%). This is a large burned area (BA), both in absolute and relative terms. Up to 40% of the BA interannual variability was linked to irregular rainfall conditions and seasonal drought, as modeled by the “rainfall function”,
A BA model incorporating rainfall effects and uncorrelated decline, along with a linear BA (
We estimate that the sown area in Orinoquia will double during the 2017–2040 period, with a much more rapid expansion of oil palm compared to rice. The BA full model predicts that this expansion coupling effect, combined with the uncorrelated BA decline, will cause a factor 2.5 reduction in Orinoquia’s mean burned area by 2040 compared to 2017. The largest sources of uncertainty in this prediction are the uncorrelated BA decline trends, i.e., those not explained by weather or cropland expansion, and expected climate change effects.
We calculate that crop production in Orinoquia generated 3 Gg of PM10 in 2016 (71% from short-cycle crops), while biomass burning generated 57 Gg, i.e., 95% of the combined emissions that year. Due to the increasing share and lower emissions of oil palm compared to short-cycle crops, the aggregated crop production emissions are expected to increase by a factor of 1.8 during the 2017–2040 period. This increase is small considering the factor 2.5 decrease in biomass burning emissions during the same period, resulting in a factor two drop in the combined emissions (23 Gg of PM10 by 2040). A pollution burden reduction of this magnitude would have tremendous positive effects on public health, not just in Orinoquia (1.3 Mhab) but also in its direct outflow region, the Colombian Andes (>10 Mhab).
The data used in this publication will be made available on request.
RJ and EL-V conceived and managed the project. AH, AA, AV-B, and RJ reviewed the literature, obtained and analyzed the data, and implemented the emission models. RJ developed the rainfall and coupling models and prepared the manuscript with significant contributions from all the authors.
This research was funded by Colciencias (Colombian Administrative Department of Science, Technology and Innovation), through grant number 1101-569-35161 for the project “Atmospheric emissions and impact of land use change and intensive agriculture on air quality in the Colombian Orinoquia,” and by Universidad EAN.
We gratefully acknowledge the information on agricultural and fire suppression practices provided by colleagues and crop production professionals and practitioners. We are also thankful to Glenn Hyman and two reviewers for their detailed and insightful revision of the manuscript.
The authors declare that the research was conducted in the absence of any commercial or financial relationships that could be construed as a potential conflict of interest.
All claims expressed in this article are solely those of the authors and do not necessarily represent those of their affiliated organizations, or those of the publisher, the editors and the reviewers. Any product that may be evaluated in this article, or claim that may be made by its manufacturer, is not guaranteed or endorsed by the publisher.
The Supplementary Material for this article can be found online at: https://www.frontiersin.org/articles/10.3389/fenvs.2022.689844/full#supplementary-material
Akagi, S. K., Yokelson, R. J., Wiedinmyer, C., Alvarado, M. J., Reid, J. S., Karl, T., et al. (2011). Emission factors for open and domestic biomass burning for use in atmospheric models. Atmos. Chem. Phys. 11, 4039–4072. doi:10.5194/acp-11-4039-2011
Andela, N., Morton, D. C., Giglio, L., Chen, Y., Van Der Werf, G. R., Kasibhatla, P. S., et al. (2017). A human-driven decline in global burned area. Science 356, 1356–1362. doi:10.1126/science.aal4108Available at: http://science.sciencemag.org/content/356/6345/1356.abstract.
Anderson, R., Bayer, P. E., and Edwards, D. (2020). Climate change and the need for agricultural adaptation. Curr. Opin. Plant Biol. 56, 197–202. doi:10.1016/j.pbi.2019.12.006
Aneja, V. P., Schlesinger, W. H., and Erisman, J. W. (2009). Effects of agriculture upon the air quality and climate: Research, policy, and regulations. Environ. Sci. Technol. 43, 4234–4240. doi:10.1021/es8024403
Aneja, V. P., Schlesinger, W. H., and Erisman, J. W. (2008). Farming pollution. Nat. Geosci. 1, 409–411. doi:10.1038/ngeo236
Armenteras, D., Schneider, L., and Dávalos, L. M. (2019). Fires in protected areas reveal unforeseen costs of Colombian peace. Nat. Ecol. Evol. 3, 20–23. doi:10.1038/s41559-018-0727-8
Arora, V. K., and Melton, J. R. (2018). Reduction in global area burned and wildfire emissions since 1930s enhances carbon uptake by land. Nat. Commun. 9, 1326. doi:10.1038/s41467-018-03838-0
Ballesteros-González, K., Sullivan, A. P., and Morales-Betancourt, R. (2020). Estimating the air quality and health impacts of biomass burning in northern South America using a chemical transport model. Sci. Total Environ. 739, 139755. doi:10.1016/j.scitotenv.2020.139755
Blanco Jorge, L. A., and Garcia, G. J. (1997). A study of habitat fragmentation in Southeastern Brazil using remote sensing and geographic information systems (GIS). For. Ecol. Manage. 98, 35–47. doi:10.1016/S0378-1127(97)00072-8
Carrillo, M., and González, J. M. (2002). A new approach to modelling sigmoidal curves. Technol. Forecast. Soc. Change 69, 233–241. doi:10.1016/S0040-1625(01)00150-0
Castiblanco, C., Etter, A., and Aide, T. M. (2013). Oil palm plantations in Colombia: A model of future expansion. Environ. Sci. Policy 27, 172–183. doi:10.1016/j.envsci.2013.01.003
Castiblanco, C. (2014). Scenarios of the future expansion of oil palm in Colombia: Impacts generated by the biofuels sector. Bogota (Colombia): Pontificia Universidad Javeriana. Doctoral dissertation. Available at:https://repository.javeriana.edu.co/handle/10554/15737 (Accessed November 19, 2022).
Cleveland, R. B., Cleveland, W. S., McRae, J. E., and Terpenning, I. (1990). Stl: A seasonal-trend decomposition procedure based on loess. J. Off. Stat. 6, 3–73.
Díaz Lemus, E., Moreno Gaviria, O., Urango Petro, Á., and Castro Sabbagh, C. I. (2017). Los recursos de la Asignación Especial del SGP para Resguardos y el reto para los pueblos indígenas en el ejercicio de la función pública. Bogotá: Contraloría General de la República. Available at: https://www.contraloria.gov.co/.
Dinero (2011). Los nuevos llaneros. Rev. Dinero (February 21) (367). Available at: https://www.semana.com/caratula/edicion-impresa/articulo/los-nuevos-llaneros/113492/.
DNP (2008). Lineamientos de política para promover la producción sostenible de biocombustibles en Colombia. Bogotá: Contraloría General de la República. Available at: https://colaboracion.dnp.gov.co/CDT/Conpes/Económicos/3510.pdf.
DNP (2014). Política para el desarrollo integral de la Orinoquia: Altillanura – fase I. Bogotá: Contraloría General de la República. Available at: https://colaboracion.dnp.gov.co/CDT/Conpes/Económicos/3797.pdf.
García Durán, O. (2009). Carimagua: La investigación y el desarrollo en ecosistemas de baja fertilidad. Rev. Colomb. Ciencias Pecu. 22, 74–78.
Etter, A., Sarmiento, A., and Romero, M. H. (2010). “Land use changes (1970–2020) and carbon emissions in the Colombian Llanos,” in Ecosystem function in savannas. Editors M. J. Hill, and N. P. Hanan (Boca Raton: CRC Press). doi:10.1201/b10275
FAO (2018). The future of food and agriculture – alternative pathways to 2050. Available at: http://www.fao.org/3/I8429EN/i8429en.pdf (Accessed November 19, 2022).
Foley, J. A., Ramankutty, N., Brauman, K. A., Cassidy, E. S., Gerber, J. S., Johnston, M., et al. (2011). Solutions for a cultivated planet. Nature 478, 337–342. doi:10.1038/nature10452
Furumo, P. R., and Aide, T. M. (2017). Characterizing commercial oil palm expansion in Latin America: Land use change and trade. Environ. Res. Lett. 12, 024008. doi:10.1088/1748-9326/aa5892
Giglio, L., Randerson, J. T., and van der Werf, G. R. (2013). Analysis of daily, monthly, and annual burned area using the fourth-generation global fire emissions database (GFED4). J. Geophys. Res. Biogeosci. 118, 317–328. doi:10.1002/jgrg.20042
Graesser, J., Ramankutty, N., and Coomes, O. T. (2018). Increasing expansion of large-scale crop production onto deforested land in sub-Andean South America. Environ. Res. Lett. 13, 084021. doi:10.1088/1748-9326/aad5bf
Hernandez, A. J., Morales-Rincon, L. A., Wu, D., Mallia, D., Lin, J. C., and Jimenez, R. (2019). Transboundary transport of biomass burning aerosols and photochemical pollution in the Orinoco River Basin. Atmos. Environ. X. 205, 1–8. doi:10.1016/j.atmosenv.2019.01.051
Hernández Villamizar, A. J. (2019). Assessment of the impact of biomass burning on air quality in the Colombian Orinoco River Basin. Bogota (Colombia): Universidad Nacional de Colombia. Doctoral dissertation. Available at: https://repositorio.unal.edu.co/handle/unal/76979.
Hersbach, H., Bell, B., Berrisford, P., Biavati, G., Horányi, A., Muñoz Sabater, J., et al. (2019). ERA5 monthly averaged data on single levels from 1979 to present. Copernic. Clim. Chang. Serv. Clim. Data Store. Data repository. doi:10.24381/cds.f17050d7
Joshi, J., and Sukumar, R. (2021). Improving prediction and assessment of global fires using multilayer neural networks. Sci. Rep. 11, 3295–3314. doi:10.1038/s41598-021-81233-4
Klink, C. A., and Moreira, A. G. (2002). “Past and current human occupation, and land use,” in The Cerrados of Brazil ecology and natural history of a neotropical savanna. Editors P. S. Oliveira, and R. J. Marquis (New York, United States: Columbia University Press), 69–88. doi:10.7312/oliv12042.8
Knorr, W., Arneth, A., and Jiang, L. (2016). Demographic controls of future global fire risk. Nat. Clim. Chang. 6, 781–785. doi:10.1038/nclimate2999
Lark, T. J., Meghan Salmon, J., and Gibbs, H. K. (2015). Cropland expansion outpaces agricultural and biofuel policies in the United States. Environ. Res. Lett. 10, 044003. doi:10.1088/1748-9326/10/4/044003
Lasslop, G., and Kloster, S. (2017). Human impact on wildfires varies between regions and with vegetation productivity. Environ. Res. Lett. 12, 115011. doi:10.1088/1748-9326/aa8c82
Lasso, C. A., Usma, J. S., Trujillo, F., and Rial, B., A. (2010). Biodiversidad de la cuenca del Orinoco: Bases científicas para la identificación de áreas prioritarias para la conservación y uso sostenible de la biodiversidad. Bogotá (Colombia):Instituto de Investigación de Recursos Biológicos Alexander von Humboldt, WWF Colombia, Fundación Omacha, Fundación La Salle e Instituto de Estudios de la Orinoquia Universidad Nacional de Colombia. Available at http://repository.humboldt.org.co/handle/20.500.11761/34982 (Accessed November 19, 2022).
López-Hernández, D., Hernández-Hernández, R. M., and Brossard, M. (2005). Historia del uso reciente de tierras de las sabanas de américa del sur. Estudios de casos en sabanas del orinoco. Interciencia 30, 623–630. Available at: http://ve.scielo.org/scielo.php?script=sci_arttext&pid=S0378-18442005001000008.
Maffia, J., Dinuccio, E., Amon, B., and Balsari, P. (2020). PM emissions from open field crop management: Emission factors, assessment methods and mitigation measures – a review. Atmos. Environ. X. 226, 117381. doi:10.1016/j.atmosenv.2020.117381
Mateus-Fontecha, L., Vargas-Burbano, A., Jimenez, R., Rojas, N. Y., Rueda-Saa, G., et al. (2022). Understanding aerosol composition in a tropical inter-Andean valley impacted by agro-industrial and urban emissions. Atmos. Chem. Phys. 22, 8473–8495. doi:10.5194/acp-22-8473-2022
Mendez-Espinosa, J. F., Belalcazar, L. C., and Morales Betancourt, R. (2019). Regional air quality impact of northern South America biomass burning emissions. Atmos. Environ. X. 203, 131–140. doi:10.1016/j.atmosenv.2019.01.042
Morales-Rincon, L. A., Hernandez, A. J., Rodriguez-Hernandez, N. S., and Jimenez, R. (2021). Carbon exchange and accumulation in an orinoco high plains native savanna ecosystem as measured by eddy covariance. Front. Environ. Sci. 9, 1–14. doi:10.3389/fenvs.2021.673932
Navarro-Monterroza, E., Arias, P. A., and Vieira, S. C. (2019). El Niño-Oscilación del Sur, fase Modoki, y sus efectos en la variabilidad espacio-temporal de la precipitación en Colombia. Rev. Acad. Colomb. Cienc. Exactas Fis. Nat. 43, 120. doi:10.18257/raccefyn.704
Pachón, J., Galvis, B., Lombana, O., Carmona, L., Fajardo, S., Rincón, A., et al. (2018). Development and evaluation of a comprehensive atmospheric emission inventory for air quality modeling in the megacity of bogotá. Atmos. (Basel). 9, 49. doi:10.3390/atmos9020049
Pechony, O., and Shindell, D. T. (2010). Driving forces of global wildfires over the past millennium and the forthcoming century. Proc. Natl. Acad. Sci. U. S. A. 107, 19167–19170. doi:10.1073/pnas.1003669107
Pechony, O., and Shindell, D. T. (2009). Fire parameterization on a global scale. J. Geophys. Res. 114, D16115. doi:10.1029/2009JD011927
Quezada, J. C., Guillaume, T., Poeplau, C., Ghazoul, J., and Buttler, A. (2022). Deforestation-free land-use change and organic matter-centered management improve the C footprint of oil palm expansion. Glob. Chang. Biol. 28, 2476–2490. doi:10.1111/gcb.16069
Rabin, S. S., Melton, J. R., Lasslop, G., Bachelet, D., Forrest, M., Hantson, S., et al. (2017). The Fire Modeling Intercomparison Project (FireMIP), phase 1: Experimental and analytical protocols with detailed model descriptions. Geosci. Model Dev. 10, 1175–1197. doi:10.5194/gmd-10-1175-2017
Ramo, R., Roteta, E., Bistinas, I., van Wees, D., Bastarrika, A., Chuvieco, E., et al. (2021). African burned area and fire carbon emissions are strongly impacted by small fires undetected by coarse resolution satellite data. Proc. Natl. Acad. Sci. U. S. A. 118 (9), 1–7 (e2011160118). doi:10.1073/pnas.2011160118
Rincón-Riveros, J. M., Rincón-Caro, M. A., Sullivan, A. P., Mendez-Espinosa, J. F., Belalcazar, L. C., Quirama Aguilar, M., et al. (2020). Long-term Brown carbon and smoke tracer observations in bogotá, Colombia: Association with medium-range transport of biomass burning plumes. Atmos. Chem. Phys. 20, 7459–7472. doi:10.5194/acp-20-7459-2020
Rodríguez-Gómez, C., Echeverry, G., Jaramillo, A., and Ladino, L. A. (2021). The negative impact of biomass burning and the orinoco low-level jet on the air quality of the Orinoco River basin. Atmósfera 35 (3), 497–520. doi:10.20937/atm.52979
Romero-Ruiz, M., Etter, A., Sarmiento, A., and Tansey, K. (2010). Spatial and temporal variability of fires in relation to ecosystems, land tenure and rainfall in savannas of northern South America. Glob. Chang. Biol. 16, 2013–2023. doi:10.1111/j.1365-2486.2009.02081.x
Rosan, T. M., Aragão, L. E. O. C., Oliveras, I., Phillips, O. L., Malhi, Y., Gloor, E., et al. (2019). Extensive 21st-century woody encroachment in south America’s savanna. Geophys. Res. Lett. 46, 6594–6603. doi:10.1029/2019GL082327
Schnepf, R. D., Dohlman, E., and Bolling, C. (2001). Agriculture in Brazil and Argentina: Developments and prospects for major field crops. Washington, DC: U.S. Department of Agriculture, Market and Trade Economics Division, Economic Research Service, Agriculture and Trade Report WRS-01-3. Available at: https://www.ers.usda.gov/webdocs/outlooks/40339/15081_wrs013_1_.pdf?v=7292 (Accessed November 19, 2022)
Sharratt, B., and Auvermann, B. (2014). “Dust pollution from agriculture,” in Encyclopedia of agriculture and food systems (Amsterdam, Netherlands: Elsevier), 487–504. doi:10.1016/B978-0-444-52512-3.00089-9
Sharratt, B. S., and Van Pelt, R. S. (2020). “Erosion by wind: Source, measurement, prediction, and control” in Managing Soils and Terrestrial Systems. Editor B. D. Fath, and S. E. Jorgensen (Boca Raton (FL): CRC Press). Chapter 37, 321–341. doi:10.1201/9780429346255-41
IPCC (2019). Climate change and land: An IPCC special report on climate change, desertification, land degradation, sustainable land management, food security, and greenhouse gas fluxes in terrestrial ecosystems. Editors J. M. P. R. Shukla, J. Skea, E. Calvo Buendia, V. Masson-Delmotte, H.-O. Pörtner, D. C. Robertset al. (Geneva, Switzerland: Intergovernmental Panel on Climate Change). Available at: https://www.ipcc.ch/srccl/.
Silva, J. M. N., Carreiras, J. M. B., Rosa, I., and Pereira, J. M. C. (2011). Greenhouse gas emissions from shifting cultivation in the tropics, including uncertainty and sensitivity analysis. J. Geophys. Res. 116, D20304–D20321. doi:10.1029/2011JD016056
Tilman, D., Fargione, J., Wolff, B., D'Antonio, C., Dobson, A., Howarth, R., et al. (2001). Forecasting agriculturally driven global environmental change. Sci. (80-.) 292, 281–284. doi:10.1126/science.1057544
Trujillo González, F., Beltrán Gutiérrez, M., Diaz-Pulido, A., Ferrer Pérez, A., and Payan Garrido, E. (2010). “Mamíferos,” in Biodiversidad de la cuenca del Orinoco: Bases científicas para la identificación de áreas prioritarias para la conservación y uso sostenible de la biodiversidad. Editors C. A. Lasso, J. S. Usma, F. Trujillo, and A. Rial (Bogota (Colombia): Instituto de Investigación de Recursos Biológicos Alexander von Humboldt, WWF Colombia, Fundación Omacha, Fundación La Salle, Instituto de Estudios de la Orinoquia Universidad Nacional de Colombia), 311–336. Available at: http://repository.humboldt.org.co/handle/20.500.11761/34982 (Accessed November 19, 2022).
Venevsky, S., Le Page, Y., Pereira, J. M. C., and Wu, C. (2019). Analysis fire patterns and drivers with a global SEVER-FIRE v1.0 model incorporated into dynamic global vegetation model and satellite and on-ground observations. Geosci. Model Dev. 12, 89–110. doi:10.5194/gmd-12-89-2019
Wang, J., Miller, D. R., Sammis, T. W., Hiscox, A. L., Yang, W., and Holmén, B. A. (2010). Local dust emission factors for agricultural tilling operations. Soil Sci. 175 (4), 194–200. doi:10.1097/SS.0b013e3181dae283
Zalles, V., Hansen, M. C., Potapov, P. V., Parker, D., Stehman, S. V., Pickens, A. H., et al. (2021). Rapid expansion of human impact on natural land in South America since 1985. Sci. Adv. 7, eabg1620–12. doi:10.1126/sciadv.abg1620
Keywords: Orinoco savannas, agriculture expansion and intensification, biomass burning, biomass burning rainfall dependence, biomass burning-agriculture coupling model, particulate matter emissions, emission factors, emissions scenarios
Citation: Jimenez R, Ardila AV, Vargas-Burbano AC, Hernandez AJ and Leon-Velasquez E (2022) Biomass burning-agriculture coupling in the Orinoco savannas—Particulate matter emission scenarios. Front. Environ. Sci. 10:689844. doi: 10.3389/fenvs.2022.689844
Received: 01 April 2021; Accepted: 16 November 2022;
Published: 28 November 2022.
Edited by:
Glenn Hyman, Self-employed, ColombiaReviewed by:
Lyndon Estes, Clark University, United StatesCopyright © 2022 Jimenez, Ardila, Vargas-Burbano, Hernandez and Leon-Velasquez. This is an open-access article distributed under the terms of the Creative Commons Attribution License (CC BY). The use, distribution or reproduction in other forums is permitted, provided the original author(s) and the copyright owner(s) are credited and that the original publication in this journal is cited, in accordance with accepted academic practice. No use, distribution or reproduction is permitted which does not comply with these terms.
*Correspondence: Rodrigo Jimenez, cmppbWVuZXpwQHVuYWwuZWR1LmNv
Disclaimer: All claims expressed in this article are solely those of the authors and do not necessarily represent those of their affiliated organizations, or those of the publisher, the editors and the reviewers. Any product that may be evaluated in this article or claim that may be made by its manufacturer is not guaranteed or endorsed by the publisher.
Research integrity at Frontiers
Learn more about the work of our research integrity team to safeguard the quality of each article we publish.