 Yanyu Yue1
 Lin Xu
 Yue Zhou
94% of researchers rate our articles as excellent or good
Learn more about the work of our research integrity team to safeguard the quality of each article we publish.
Find out more
ORIGINAL RESEARCH article
Front. Environ. Sci., 12 January 2023
Sec. Atmosphere and Climate
Volume 10 - 2022 | https://doi.org/10.3389/fenvs.2022.1118316
This article is part of the Research TopicAir Pollution Remote Sensing and the Subsequent Interactions with Ecology on Regional Scales - Volume IIView all 10 articles
Affected by stagnant and transmission air pollution, Regional pollution day (RPD) frequently occurs in Twain-Hu Basin. In the winter halfaear of 2015–2021 (November to March of following year), the Regional pollution days reached 331 days. A variety of weather systems together lead to regional air pollution. Based on the observation data of PM2.5 concentration and multi-source meteorological elements during the study period, the weather types of Regional pollution days in Twain-Hu Basin can be divided into four types by using the T-model (T-PCA) classification method, namely, uniform pressure field (42 days), front of cold high-pressure bottom (180 days), back of high-pressure (81 days), and low pressure with an inverted trough field (28 days). Under the influence of uniform pressure field and front of cold high-pressure bottom, it shows the meteorological characteristics of static pollution and transmission pollution, respectively. A stable index (STI) is constructed to describe the PM2.5 pollution caused by the stagnant weather, and a transport index (TRI) is constructed to describe the PM2.5 pollution caused by the transport weather. They have a satisfactory evaluation effect on PM2.5 pollution under the influence of uniform pressure field and front of cold high-pressure bottom, respectively. Interestingly, the correlation coefficients between the pollution index (A stable index + transport index) and PM2.5 concentration could increase obviously to 0.48–0.71 when A stable index and transport index are considered comprehensively. Furthermore, the validation in the winter halfaear of 2021/2022 show that the correlation coefficient of most stations is above 0.70. Therefore, satisfactory performance in validation suggests that this index construction method can be well applied to regional pollution assessment in Twain-Hu Basin.
With the development of the main areas of the Yangtze River Economic Belt, regional atmospheric environmental problems have become increasingly prominent. Heavy pollution incidents frequently occur in the Twain-Hu Basin (THB) including the Hubei and Hunan provinces in the middle reaches of the Yangtze River, which has become a new area with a high incidence of air pollution (Bai et al., 2018; Shen et al., 2020; Yu et al., 2020). The pollution problem with particulate matter and ozone as the primary pollutants have seriously affected people’s health and sustainable economic development. Weather pollution is jointly influenced by emission sources, meteorological conditions and chemical reactions (Zhang et al., 2019). Changes in meteorological elements can explain the pollution process of nearly 70% haze weather (Zhang et al., 2014). Pollution episodes are generally ascribed to the accumulation of air pollutants under stagnant meteorological conditions (Gao et al., 2016; Zhang et al., 2016). Local meteorological conditions, such as weak wind, strong inversion layer and low mixing layer height, are important reasons for the formation and maintenance of air pollution in static and stable weather (Zhao et al., 2013; Xu et al., 2016). A stable weather index can fully reflect PM2.5 pollution in North China Plain (Feng et al., 2018). The source contributions and transboundary transport of fine particles (PM2.5) in pollution episodes are closely related to large-scale or synoptic-scale atmospheric circulation (Yan et al., 2021).
The transit of cold front drives pollutants from the upper wind to the lower reaches, leading to regional polluted weather, which is also an essential meteorological reason for heavily polluted weather (Kang et al., 2019; Hu et al., 2022). Simulation results show that PM2.5 in central and eastern China contributes 60.3% to particulate matter pollution in the THB (Shen et al., 2022). Therefore, scholars have developed related indexes to characterize the impact of meteorological conditions on pollution development. Based on the pollution data of Beijing, Hua et al. (2016) developed a index to characterize the transport intensity of pollutants in Beijing by using the HYSPLIT model, and found that the correlation between the value of index and PM2.5 concentration reached 0.37. Zhu et al. (2001) developed the air pollution potential index (PPI). Yang et al. (2016) selected sensitive meteorological elements to establish the parameter linking aerosol-pollution and meteorology (PLAM) index, indicating the favorable or unfavorable intensity and orientation of pollutant transportation from surrounding areas to Beijing.
The THB is located in the middle reaches of the Yangtze River. The topography of the “sub-basin”, abundant water network underlying the surface and diverse ecosystems increase the complexity of surface dynamic and thermal conditions in these regions. The analysis of meteorological contributing factors and pollutant transportation of heavy pollution processes in Hubei and Hunan provinces used to focus on heavy pollution cases in stable weather or transmission processes. However, the influence of static stability and transmission is seldom considered (Bai et al., 2018; Zhou et al., 2019). With the implementation of China’s air control action plan, the air quality of the THB has been improved to a certain extent. However, the heavy pollution events (HPEs) did not decrease significantly in the winter of 2016–2019 (Shen et al., 2021), which challenges phased and seasonal air pollution prevention. Therefore, a comprehensive index is needed to quantitatively describe whether meteorological conditions are conducive to the formation of pollution weather, thus affecting the variations of pollutant concentration.
In this study, eight stations located in the core area of THB were selected as the study area, namely, Xiangyang (Xiangy), Jingmen (Jingm), Jingzhou (Jingz) and Wuhan (Wuh) in Hubei province, and Yueyang (Yuey), Changde (Changd), Yiyang (Yiy) and Changsha (Changs) in Hunan province (Figure 1). Since the PM2.5 data in Hubei and Hunan areas has been gradually complete since 2015, this study discusses the hourly PM2.5 concentration observations in November, December, January, February and March that are significantly affected by air pollution from 2015 to 2021. Meanwhile, the hourly PM2.5 concentration observations of 1572 ambient air quality monitoring stations in China were used to calculate the transport index (TRI). The hourly PM2.5 data are derived from the Air Quality Realtime Publishing Platform of China National Environmental Monitoring Centre (http://106.37.208.233:20035/).
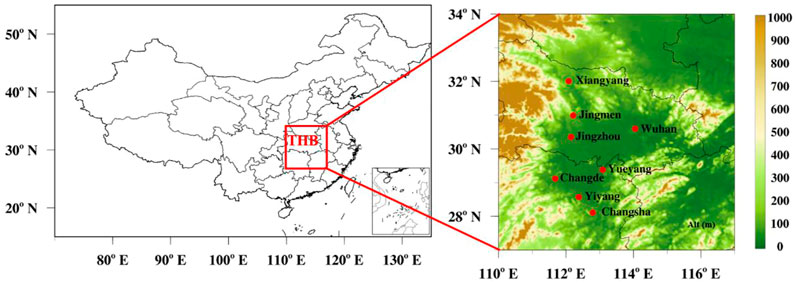
FIGURE 1. Location of Xiangy, Jingm, Jingz, Wuh, Yuey, Changd, Yiy, and Changs stations (red dot) in the THB over China with topographical height (colour contours, m, a. s l).
The meteorological data of the corresponding period mainly includes the following three parts: (1) Meteorological elements such as pressure, temperature, relative humidity and wind speed at eight national meteorological stations. (2) The reanalysis data in the horizontal resolutions of 1° × 1° obtained from National Center for Environmental Prediction (NCEP) (https://rda.ucar.edu/datasets/ds083.2/). The reanalysis data were interpolated to eight stations by the principle of proximity. The two parts data are used to analyze the meteorological conditions of the regional pollution and calculate the stable index (STI). (3) The Final Reanalysis Data derived from NCEP’s Global Data Assimilation System (GDAS) with 6-h intervals. This data is used in the Hybrid Single Particle Lagrangian Integrated Trajectory model (HYSPLIT-4) to calculate the TRI in the case of regional pollution.
According to the standard of the Ministry of Environmental Protection (GB 3095–2012), when the daily average concentration of PM2.5 is greater than 75 μg/m3, indicating that it is a pollution day. Furthermore, when there are more than four pollution days at eight stations, it shows that there is a regional pollution day (RPD) in the THB.
We used the obliquely rotated principal component analysis in the T-model (T-PCA) classification of the cost733-class software package (http://cost733.met.no) to classify synoptic patterns (Huth, 2000; 2010). Again, the sea level pressure fields and the wind at 10 m above ground level of regional pollution day are used for the classification.
The STI is obtained by selecting the meteorological elements that reflect the pollution most obviously under stable weather and combining the calculation of sub-index (Zhang et al., 2017). Since the uniform pressure field is the most representative weather system of stable weather, we build a STI based on the RPDs under the influence of uniform pressure field. We selected the 74 physical quantities of multi-level meteorological elements in eight stations, such as air temperature, air pressure, relative humidity, wind speed, 24-h temperature change, vorticity, divergence and vertical velocity at the surface, 925 hPa, 850 hPa, 700 hPa, 500 hPa and 400 hPa, the difference of meteorological elements between different height layers, and the boundary layer height. The daily average values of these elements were used in the establish of stable index. Firstly, the multiple of the occurrence probability of pollution days relative to the total number of days in different numerical intervals of each statistical element is taken as a sub-index. Then, the sub-index is sorted according to the ratio of the maximum value and the minimum value of the sub-index. The calculation of the sub-index is shown in Formula 1. Finally, the meteorological elements with vital indicative significance for the polluted weather under the influence of the uniform pressure field in the regional pollution process are obtained. As the meteorological elements are not independent, we choose the ten meteorological factors with correlation coefficient less than 0.4, and the large sub-index ratio, including the main dynamic factors are vertical speed at 500 hPa, divergence at 400 hPa, vertical speed at 925 hPa, 24-h surface pressure change, wind speed, wind speed at 700 hPa, and wind speed difference between 500 hPa and 400 hPa. And the main thermodynamic factors are relative humidity at 1000 hPa, air temperature at 400 hPa, the temperature difference between 1000 hPa and 925 hPa, and humidity difference between 925 hPa and 850 hPa. The STI is obtained by summing the sub-indexes of these 10 elements with Formula (2).
The sub-index of a meteorological factor
Where
Where the STI is the pollution index of stable weather, and
The TRI is calculated from the results of the HYSPLIT-4 trajectory model (https://ready.arl.noaa.gov/HYSPLIT.php). HYSPLIT-4 is widely used in the calculation of air mass trajectory, especially in the quantitative analysis of pollutant transport and diffusion characteristics in the study of air pollution. In this study, the TRI is established is established based on the combination of observed PM2.5 upstream before 24–36 h and the transport filed. It is because when the backward trajectory is used to simulate the trajectory for more than 36 h, the pollution source will be in the north with few observation stations or even outside the domain of China. Besides, when the backward trajectory is less than 24 h, the transmission characteristics of the index are not prominent. The 48 h backward trajectory hour by hour for each day that ended at the eight stations during the study period at the height of 500 m is calculated by the HYSPLIT model. Based on the hourly data of PM2.5 in China, the grid field of PM2.5 in China and its surrounding areas with the resolution of 0.1 ° × 0.1 ° is interpolated by the inverse distance weight method. Then, the TRI is calculated by combining the trajectory path with PM2.5 at the location of the trajectory point, as shown in Formula (3).
Where R (i, j) is the residence time of the point on the track path in the grid coordinate (i, j). E (i, j, t) is the concentration value of PM2.5 at the corresponding time in the grid (i, j), and t is the time for selecting the backward trajectory path.
Through the method proposed in the above section, we found 331 RPDs in the 30 months from 2015 to 2021 (November and December of the year and January, February and March of the following year) in THB. On average, more than one-third of the days in a month would have regional pollution. Therefore, it is imperative to study the temporal and spatial distribution of RPDs. Figure 2 shows the variation of RPDs and the differential distributions of pollution stations during RPDs. Overall, the RPDs show a decreasing trend, but the rate of decrease is slow and small. December and January are the months with the most RPDs, but they do not show a noticeable reduction. In addition, the occurrence time of RPDs is becoming more and more concentrated. RPDs in December and January account for more than 85% of the total RPDs from November 2020 to March 2021. Besides, RPDs show a minimum value in March, with the pronounced reduction trend. Specifically, the RPDs in March 2018–2021 are less than 3 days.
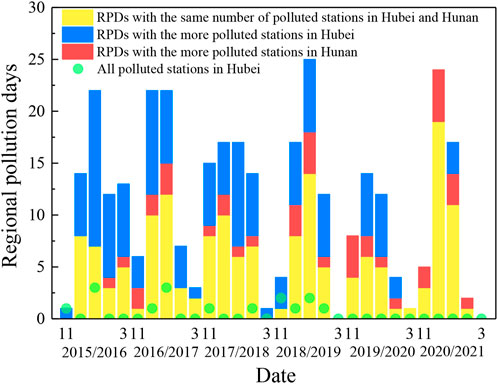
FIGURE 2. Variation of RPDs and the differential distributions of pollution stations during RPDs in Hubei and Hunan. The greed dots show all the pollution stations located in Hubei during RPDs.
From the perspective of spatial distribution, the distribution of stations with regional pollution over the THB shows interesting characteristics, which can be divided into three stages. Firstly, in the winter halfaear of 2015/2016, the number of polluted stations during RPDs is usually more in Hubei than in Hunan, and only two RPDs show more stations in Hunan. Secondly, in the winter halfaear of 2016–2019, the number of polluted stations in Hubei decreased significantly, and those in Hunan increased gradually. Thirdly, in the winter halfaear of 2019/2021, Hunan has as many polluted stations as Hubei in most RPDs. Especially in 2020/2021, there were only 5 days in which the polluted stations in Hubei were more than those in Hunan, and there was no RPD in which all the polluted stations were in Hubei. It shows that the dispersion of the spatial distribution of RPDs increased significantly, and the polluted stations tend to concentrate in Hunan.
Figure 3 shows the proportion of polluted weather at eight stations and the consistency characteristics among stations during the RPDs. It can be seen that the proportion of polluted weather at four stations in Hubei is significantly higher than that in Hunan. Specifically, the proportion of polluted weather in Xiangy is over 95%. That’s because Xiangy is located in the gap of the northern part of the THB, which provides a natural channel for the regional transport of air pollutants from the North China Plain. As a result, the contribution rate of regional transport of PM2.5 in this area has reached over 70% (Hu et al., 2021). It is also the area most affected by meteorological conditions (Sun et al., 2022a). In addition, Changd is the city with the highest proportion of polluted weather in Hunan, accounting for 75.8%. Because of its geographical location and meteorological conditions, it is more vulnerable to the impact of pollutant transmission (Dai et al., 2019).
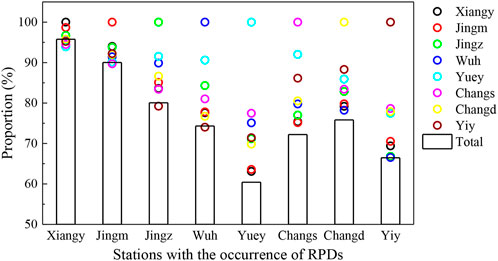
FIGURE 3. Proportions of pollution days of eight stations to the total RPDs and consistency occurrence of pollution days of each station.
Moreover, when polluted weather occurs, there is a strong correlation among stations, that is, there is a high probability that adjacent areas will have polluted weather at the same time. For instance, when polluted weather occurs in Xiangy, Changd will also have polluted weather 79% of the time. When there is polluted weather in Xiangy and Jingm, the probability of polluted weather in the other six stations is over 90%. On the contrary, when polluted weather occurs at four stations in Hunan, the probability of polluted weather in Xiangy and Jingm is relatively small. Especially in Yuey, the probability of polluted weather in Xiangy and Jingm is only about 63%. It shows that the polluted weather in certain regions of Hunan is weakly affected by the typical transportation pollution. Interestingly, Yuey has a good consistency with other four stations except for Xiangy and Jingm. When polluted weather occurs in these stations, Yuey is most likely to be polluted, indicating that although Yuey has the smallest number of RPDs, the regional polluted weather in the middle and south of the THB often covers Yuey area.
The synoptic patterns of 331 RPDs (the primary pollutant is PM2.5) in the THB from 2015 to 2021 were divided into four types (Figure 4).
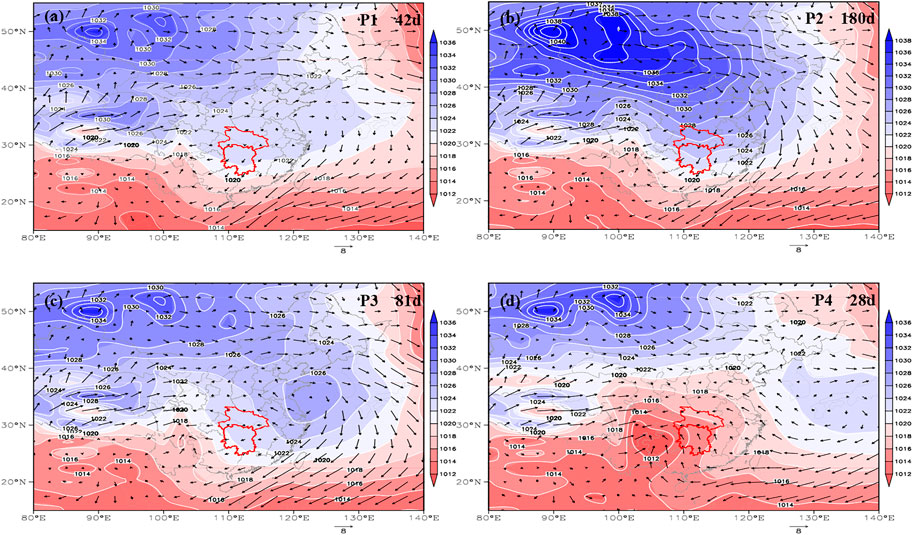
FIGURE 4. The average daily sea level pressure (SLP) (white lines; hPa) and 10-m wind vectors (m/s) in the four synoptic circulation patterns for the RPDs in the Twain-Hu Basin (THB) (outlined with red lines). (A) Uniform pressure field (P1), (B) front of cold high-pressure bottom (P2), (C) back of high-pressure (P3), and (D) low pressure with an inverted trough field (P4).
The first type is uniform pressure field (P1). The high-pressure center primarily controls it after the cold high-pressure moves southward. The pressure gradient is small, the ground wind is weak, the wind direction is uncertain (Figure 4A), and the pollution transmission is weak. The atmospheric circulation is often in a static and stable state, with poor diffusion capacity. The long-distance transported pollutants brought by the high-pressure going south are not easy to diffuse and output, and the local accumulation of pollutants is significant. The frequency of P1 type is low (42 days), accounting for 12.7% of the total, and the pollution is mainly caused by local pollution accumulation.
The second type is front of cold high-pressure bottom (P2). In high latitude Mongolia, cold high-pressure often develops strongly and spreads southward (the central intensity reaches 1042 hPa). The high-pressure gradient area in front of the high-pressure bottom is often accompanied by the northerly wind of about 2∼7 m/s (Figure 4B), which spreads from north to south and affects the THB. The strong wind carries pollutants from the north to the south when the cold front goes to the south. Affected by the cold front, the pollution concentration in the THB increases significantly, and the long-distance transportation of pollution is evident. The frequency of P2 type is the highest (180 days), accounting for more than half (54.3%) of the total number. It mainly occurs in autumn and winter. The northerly wind brings strong long-distance input of pollutants when the emission of pollution sources in the north increases.
The third type is the back of high-pressure (P3). Mongolia high-pressure often moves eastward into the sea, and it is easy to form severe pollution in North China and East China in the process of moving eastward and southward. After the high-pressure enters the sea, the THB is at the rear of the high pressure. Affected by the return transportation of weak easterly air flow (2–4 m/s) (Figure 4C), the pollutants in the east are transported westward to the THB, causing pollution growth in this area. However, the frequency of this type is low, accounting for only 24.5% (81 days), and the short distance backflow of the pollutants in the east of the upstream mainly transports it.
The fourth type is low pressure with an inverted trough field (P4). The low level is characterized by the development of warm low-pressure in the southwest region (the central intensity is 1012 hPa), and the THB is at the top of the low-pressure trough. The convergence of easterly and southerly flows is conducive to the horizontal accumulation of pollutants (Figure 4D). Moreover, the southerly air flow (2–6 m/s) guides the water vapor in the southern coastal area to the north, and the humidity in the THB increases. The high humidity and air flow convergence are conducive to the local accumulation of particulate matter and the secondary heterogeneous chemical generation. P4 type has the least occurrence (28 days), accounting for only 8.5%. The upstream pollution of this type is light, and the input is weak. Therefore, it is dominated by the wet growth and accumulation of local pollution sources.
PM2.5 concentration is a direct reflection of the degree of air pollution, and the height of the boundary layer, relative humidity and wind speed are the meteorological factors that significant impact air pollution (Ding et al., 2016; Dong et al., 2017; Huang et al., 2018). Figure 5 shows the distribution characteristics of PM2.5 concentration, the boundary layer height, relative humidity and wind speed in four types of regional pollution processes. It can be seen that different from the heavy pollution weather caused by the P1 type in North China and the Yangtze River Delta (He et al., 2018; Dai et al., 2020), the average PM2.5 concentration caused by the P1 type is the lowest among the four weather types during the regional pollution process in the THB. In addition, the average value of PM2.5 concentration in Hubei is the highest under the control of the P2 type, while that in Hunan is the highest under the P4 type. It is closely related to the different geographical locations of Hubei and Hunan, which are located in different locations of the weather system, and the stations in Hubei are located in the main channels of pollutant regional transmission (Bai et al., 2022; Wang et al., 2022). The average concentration of PM2.5 under the influence of P3 type is lower than that of P2 type and P4 type, but higher than that of P1 type, showing a consistent feature at each station.
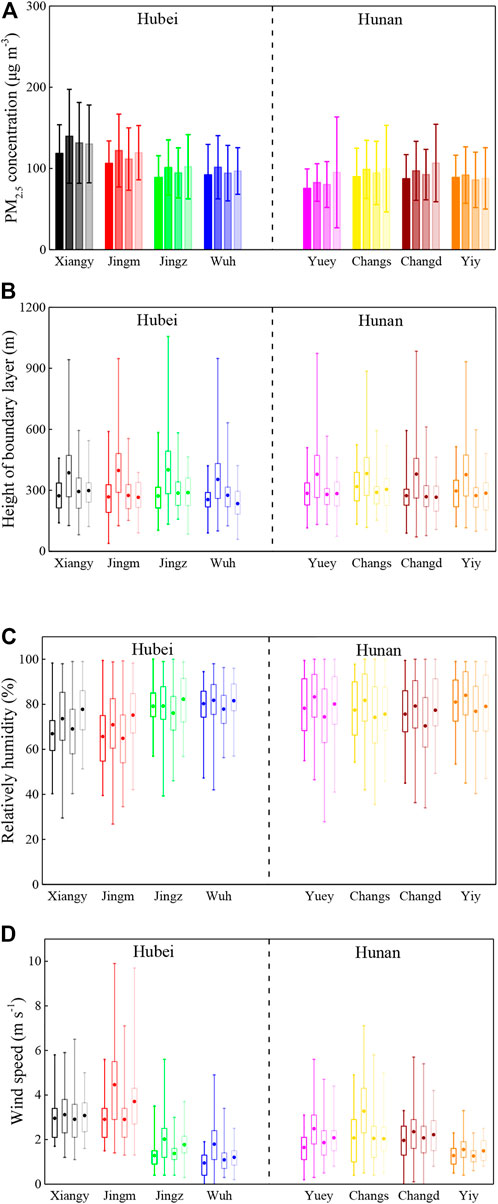
FIGURE 5. RPDs distribution of (A) PM2.5 concentration, (B) boundary layer height, (C) relative humidity and (D) wind speed at eight stations in Hubei and Hunan under four weather types. The central box represents the values from the lower to upper quartiles (25th to 75th percentiles), and the vertical line extends from the minimum to the maximum. The middle solid dot represents the mean value.
The atmospheric boundary layer is the atmosphere below the discontinuous interface with turbulent characteristics. The height of the boundary layer affects the vertical diffusion of pollutants (Liu et al., 2018; Li et al., 2019). The average and maximum values of the boundary layer height on the regional pollution day under the influence of P2 type are significantly higher than those under other weather types. For example, the average height of the boundary layer in Xiangy, Jingm and Jingz is about 400 m, while that in the other five stations is about 380 m, and the maximum value basically exceeds 900 m. The boundary layer heights of the other three weather types are similar, with an average height of about 280 m and a maximum value of less than 600 m. The low height of the boundary layer and the weak atmospheric diffusion capacity are conducive to the accumulation of pollutants, which are typical characteristics of stagnant air pollution, while the typical transmission air pollution has a high boundary layer height (Bai et al., 2018; Zhou et al., 2022).
The relative humidity reflects the formation of secondary organic aerosol in air pollution to a certain extent. The higher relative humidity is easy to generate the secondary organic aerosol, and even under the background of significantly reduced emissions, the generation of secondary organic aerosol will dominate the occurrence of polluted weather (Huang et al., 2021). In general, the relative humidity of the RPDs in Xiangy and Jingm is relatively small, while that in other six stations is similar. The highest daily relative humidity of regional pollution in Hubei is under the influence of P4 type, while that in Hunan is under the influence of P3 type. The confrontation between the cold and warm air mass in Hunan makes it easier to have a higher relative humidity (Bai et al., 2022).
The surface wind speed can directly reflect the horizontal diffusion conditions. The maximum average wind speed occurs at all eight stations under the influence of P2 type, while the minimum average wind speed occurs under the influence of P1 type. It can be clearly seen that the average wind speed in Xiangy and Jingm under four weather types is significantly higher than that in other stations. Specifically, the average wind speed in Jingm is close to 5 m/s under the influence of P2 type, while the maximum wind speed can reach about 10 m/s, which is the result of the joint action of special terrain features and atmospheric circulation (Sun et al., 2022b).
The above analysis shows the circulation background, pollution characteristics and meteorological conditions under four weather types. In this section, we will discuss the performance of STI and TPI during these four-types pollution. The pollution indices are built based on the observation data during the winter halfaear of 2015–2021 (November of the year to March of the following year). The index model is then validated using the observation data in November to December 2021 and January to March 2022.
Our study analyzes the variations of meteorological elements in polluted weather under a uniform pressure field. Then establishes a unified stable index model covering eight stations in the THB to characterize the impact of meteorological conditions on PM2.5 concentration under static and stable weather. Figure 6 shows the correlation characteristics between STI and PM2.5 concentration at eight stations under four weather types. The correlation coefficients (R) between STI and PM2.5 are 0.25–0.63 for P1, 0.05–0.16 for P2, 0.04–0.3 for P3 and 0.10–0.41 for P4, respectively. These values are significantly smaller than those of Beijing-Tianjin-Hebei (Xu et al., 2020) and the Yangtze River Delta (Liu et al., 2021), which indicates that the stable air pollution in these two areas is significantly more potent than that in the THB.
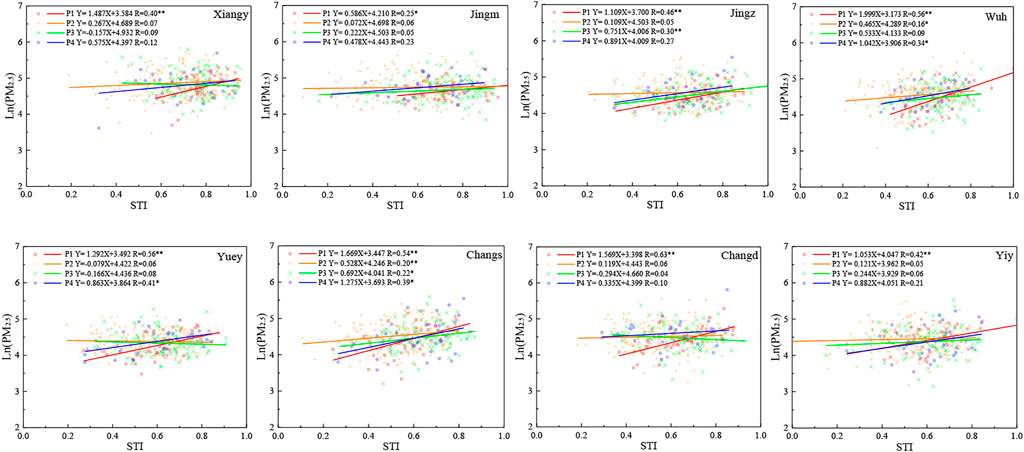
FIGURE 6. PM2.5 Scatter plots of the STI and Ln (PM2.5) in Xiangy, Jingm, Jingz, Wuh, Yuey, Changs, Changd, and Yiy during the RPDs of pollution months over 2015–2021. The solid red square, orange plus, green cross, and blue circle represent the STI and Ln (PM2.5) for the P1, P2, P3 and P4 types at the eight stations, respectively. The red, orange, green, and blue lines are the corresponding linear fittings. * * represents that it passed the 0.01 significance test, * represents that it passed the 0.05 significance test.
Further analyzing the different characteristics of correlation coefficients under the influence of four weather types, we can see that P1 type, the primary weather system dominating stable weather, has the most significant correlation coefficient between STI and PM2.5, and both have passed the significance test of 0.01. However, as the primary weather system of transmission pollution, the P2 type has the weakest correlation between STI and PM2.5. The correlation coefficient of STI and PM2.5 under the influence of the P4 type is only smaller than that of the P1 type. This is because air pollution under the influence of low-pressure trough is dominated by the wet growth and accumulation of local pollution sources, with the stable weather characteristics. To sum up, the STI cannot fully reflect the variation characteristics of PM2.5 concentration in the THB. The THB is significantly affected by transmission pollution (Bai et al., 2022; Hu et al., 2022), so the construction of the TRI is also significant. The combination of STI and TRI can better interpret the regional air pollution process in the THB.
TRI is the normalized value obtained by comprehensively calculating the PM2.5 concentration at different grid points of the backward trajectory of air masses at eight stations in the THB for 24–36 h. Figure 7 shows the correlation characteristics between TRI and PM2.5 concentration at eight stations under four weather types. The correlation coefficients (R) between TRI and PM2.5 are 0.18–0.54 for P1 type, 0.35–0.72 for P2 type, 0.18–0.66 for P3 type and 0.27–0.53 for P4 type, respectively. The correlation between the TRI and observed PM2.5 concentration calculated from PM2.5 concentration in upwind area is better than the STI. Especially for Xiangy and Jingm, with a significant impact of transport type pollution, the correlation of TRI and PM2.5 concentrations under the influence of four weather types are generally better than that of the other six stations, and the correlation coefficients under the influence of cold high-pressure even reach 0.72 and 0.62 respectively.
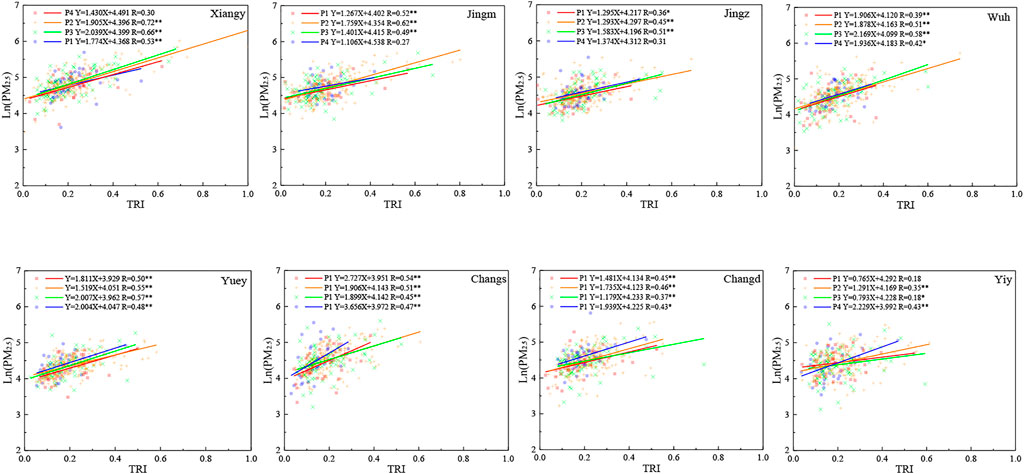
FIGURE 7. Scatter plots of the TRI and Ln (PM2.5) in Xiangy, Jingm, Jingz, Wuh, Yuey, Changs, Changd, and Yiy during the RPDs of pollution months over 2015–2021. The solid red square, orange plus, green cross, and blue circle represent the STI and Ln (PM2.5) for the P1, P2, P3 and P4 types at the eight stations, respectively. The red, orange, green, and blue lines are the corresponding linear fittings. * * represents that it passed the 0.01 significance test, * represents that it passed the 0.05 significance test.
Further comparing the correlation characteristics under the influence of different weather types, contrary to the static stability index, the correlation between TRI and PM2.5 concentration under the influence of the P2 type and P3 type is better than that under the influence of the P1 type and P4 type.
Through the above analysis, we found that when the RPDs are affected by different weather systems, the correlation characteristics of STI and TRI with PM2.5 concentration are pretty different. STI has a good application in estimating the concentration of PM2.5 when the THB is affected by P1 and P4 types, which easily cause static weather. However, TRI has a good indication in estimating the concentration of PM2.5 when the THB is affected by the P2 and P3 types, which easily lead to transmission pollution. Therefore, by the combination of STI and TRI, a regression analysis approach is used to evaluate the PM2.5 concentration at eight stations. The regression equations are shown in Table 1. It can be seen that the correlation between the comprehensive index and the daily PM2.5 concentration of regional air pollution has been significantly improved, and the correlation coefficients of eight stations are basically greater than 0.5, among which the correlation coefficients in Xiangy are over 0.7. Combining the STI and TRI improved the evaluation results of PM2.5 concentration. Besides, the coefficients and intercepts of the regression equation are 0.099–0.644, 1.167–2.017 and 3.753–4.289, respectively, with slight variation. It shows that the regression equation has specific universal characteristics for eight stations in the THB, and the combination of STI and TRI can reasonably evaluate the change of PM2.5 concentration in the regional air pollution process in this region.
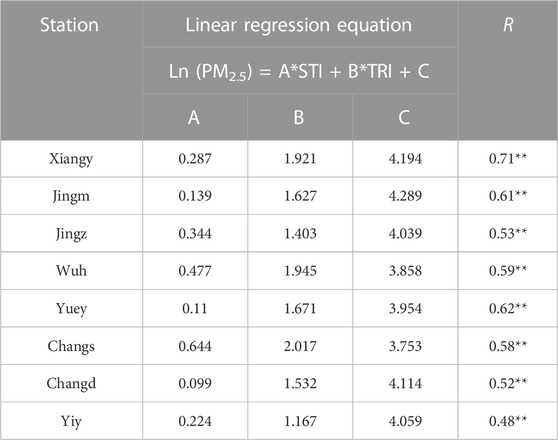
TABLE 1. Correlation coefficient and multifactor linear regression equation with PM2.5.
Furthermore, We used the observation data from November 2021 to March 2022 to analyze the effect of the pollution index with a combination of STI and TRI on the assessment of PM2.5 on RPDs (Figure 8). It can be seen that the correlation between the pollution index and PM2.5 concentration is above 0.5, and the correlation coefficient of most stations is above 0.7, reaching 0.98 in Wuh. This evaluation result shows that the STI and TRI can estimate the PM2.5 concentration better than the single index. In the THB, where transport and steady pollution cannot be ignored, this method of constructing pollution index can be better applied to the potential forecasting of PM2.5 concentration in major cities.
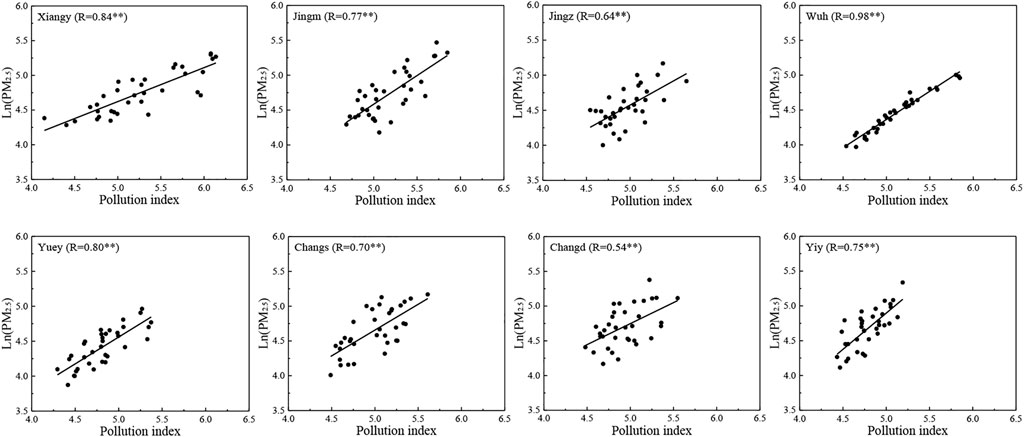
FIGURE 8. Scatter plots of the Pollution index (STI + TRI) and Ln (PM2.5) in Xiangy, Jingm, Jingz, Wuh, Yuey, Changs, Changd, and Yiy during the RPDs of pollution months over 2021–2022. * * represent that it passed the 0.01 significance test.
The THB is strongly affected by the regional transport of pollutants. With the cold air moving southward, the heavily polluted air mass affects this region, bringing about a large-scale explosive growth of pollutant concentration. What’s more, the cumulative pollution caused by steady weather is more likely to lead to the long-term maintenance of high pollutant concentrations in the THB. Hence, based on the observation of PM2.5 concentration and multi-source meteorological elements in the winter halfaear of 2015–2021, the regional polluted weather in the THB was classified. The STI and TRI models based on the stable type and transmission type regional pollution are established, and further verified by the observation from November 2021 to March 2022. The main results are as follows.
1) There were 331 days of regional pollution weather from 2015 to 2021 (November of the year to March of the following year), showing a general decreasing trend, but the decline rate was slow and small. Specifically, December and January are the months with the most regional pollution days, while March has the least regional pollution days. The spatial distribution shows that in the first stage (2015–2016), there are most RPDs in Hubei, then in the second stage (2016–2019), there is almost the same number of RPDs in Hubei and Hunan, and in the third stage (2020–2021), RPDs are primarily developed in Hunan. In the process of regional pollution, the number of stations with polluted weather in Hubei is higher than that in Hunan. Xiangyang and Changde are the stations with the most polluted days in Hubei and Hunan, accounting for 95.8% and 75.8% of the total number of polluted days, respectively. In addition, when polluted weather occurs in Xiangyang and Jingmen, the probability of polluted weather in other six stations is over 90%.
2) The weather types of regional pollution days in the THB can be divided into four types: uniform pressure field type (42 days), front of cold high-pressure bottom type (180 days), back of high-pressure type (81 days) and low pressure with an inverted trough field type (28 days). Specifically, stable pollution weather is most likely to occur under the influence of uniform pressure field type, and transmission-type polluted weather is most likely to occur under the influence of front of cold high-pressure bottom type. The front of cold high-pressure bottom front type in Hubei easily leads to the highest average PM2.5 concentration, while the low pressure with an inverted trough field type in Hunan is prone to the highest average PM2.5 concentration. The meteorological characteristics of transmission-type polluted weather under the influence of front of cold high-pressure bottom type are the maximum boundary layer height and the maximum wind speed. The relative humidity in Hubei is the highest under the influence of low pressure with an inverted trough field type, while that in Hunan is the highest under the influence of front of cold high-pressure bottom type.
3) Based on 10 selected meteorological factors, the STI model is constructed. Under the influence of the uniform pressure field type, the physical factors have the best correlation with the PM2.5 concentration, the correlation coefficient of eight stations is between 0.25–0.63, and the correlation under the influence of the front of cold high-pressure bottom type is the worst. The PM2.5 concentration constructs the TRI model at different grids of the backward trajectory from 24 to 36 h. Its correlation characteristics with PM2.5 concentration in different weather types contradict the stable index. The correlation under the influence of front of cold high-pressure bottom type is the best, which is 0.35–0.72, while the correlation under the influence of uniform pressure field type is the worst, which is 0.18–0.54. The pollution index combined with STI and TRI constructed by multiple regression equation can well reflect the variable of PM2.5 concentration under the influence of different weather types, and the correlation coefficient reaches 0.48–0.71. The validation results in the winter harfaear of 2021–2022 further verify that the STI + TRI method can effectively improve the evaluation effect of PM2.5 concentration on RPDs.
The original contributions presented in the study are included in the article/supplementary material, further inquiries can be directed to the corresponding authors.
YZ, and LX conducted the study design. YB, YZ, and YY provided the observational data. YY, XC, and HH assisted with data processing. YY wrote the paper with the help of XC, TZ, and ZT. LX, YB, and HH were involved in the scientific interpretation and discussion. All authors provided commentary on the paper.
This research was funded by the National Natural Science Foundation of China (Grant Nos. 41875170, 42075186 and 41830965), and the Science and Technology Development Fund of Hubei Meteorological Bureau (2021Z05).
The authors declare that the research was conducted in the absence of any commercial or financial relationships that could be construed as a potential conflict of interest.
All claims expressed in this article are solely those of the authors and do not necessarily represent those of their affiliated organizations, or those of the publisher, the editors and the reviewers. Any product that may be evaluated in this article, or claim that may be made by its manufacturer, is not guaranteed or endorsed by the publisher.
Bai, Y., Qi, H., Zhao, T., Yang, H., Liu, L., and Cui, C. (2018). Analysis of meteorological conditions and diurnal variation characteristics of PM2.5 heavy pollution episodes in the winter of 2015 in Hubei Province (in Chinese). Acta Meteorol. Sin. 76, 803–815. doi:10.11676/qxxb2018.029
Bai, Y., Zhao, T., Hu, W., Zhou, Y., Xiong, J., Wang, Y., et al. (2022). Meteorological mechanism of regional PM2.5 transport building a receptor region for heavy air pollution over Central China. Sci. Total Environ. 808, 151951. doi:10.1016/j.scitotenv.2021.151951
Dai, C., Huang, S., Peng, H., Yi, K., Zhou, Y., and Qin, P. (2019). Particulate pollution status and its characteristics during 2015–2016 in Hunan, China. Atmos. Pollut. Res. 10, 739–748. doi:10.1016/j.apr.2018.12.001
Dai, Z., Liu, D., Yu, K., Cao, L., and Jiang, Y. (2020). Meteorological variables and synoptic patterns associated with air pollutions in eastern China during 2013–2018. Int. J. Environ. Res. Public Health 17, 2528. doi:10.3390/ijerph17072528
Ding, A., Huang, X., Nie, W., Sun, J., Kerminen, V., Petäjä, T., et al. (2016). Enhanced haze pollution by black carbon in megacities in China. Geophys. Res. Lett. 43, 2873–2879. doi:10.1002/2016gl067745
Dong, Z., Li, Z., Yu, X., Cribb, M., Li, X., and Dai, J. (2017). Opposite long-term trends in aerosols between low and high altitudes: A testimony to the aerosol–PBL feedback. Atmos. Chem. Phys. 17, 7997–8009. doi:10.5194/acp-17-7997-2017
Feng, J., Quan, J., Liao, H., Li, Y., and Zhao, X. (2018). An air stagnation index to qualify extreme haze events in northern China. J. Atmos. Sci. 75, 3489–3505. doi:10.1175/jas-d-17-0354.1
Gao, M., Carmichael, G. R., Wang, Y., Saide, P. E., Yu, M., Xin, J., et al. (2016). Modeling study of the 2010 regional haze event in the North China Plain. Atmos. Chem. Phys. 16, 1673–1691. doi:10.5194/acp-16-1673-2016
He, J., Gong, S., Zhou, C., Lu, S., Wu, L., Chen, Y., et al. (2018). Analyses of winter circulation types and their impacts on haze pollution in Beijing. Atmos. Environ. 192, 94–103. doi:10.1016/j.atmosenv.2018.08.060
Hu, W., Zhao, T., Bai, Y., Kong, S., Shen, L., Xiong, J., et al. (2022). Regulation of synoptic circulation in regional PM2.5 transport for heavy air pollution: Study of 5-year observation over central China. J. Geophys. Res. Atmos. 127, e2021JD035937. doi:10.1029/2021jd035937
Hu, W., Zhao, T., Bai, Y., Kong, S., Xiong, J., Sun, X., et al. (2021). Importance of regional PM2.5 transport and precipitation washout in heavy air pollution in the Twain-Hu Basin over Central China: Observational analysis and WRF-Chem simulation. Sci. Total Environ. 758, 143710. doi:10.1016/j.scitotenv.2020.143710
Hua, C., Zhang, H., and Zhang, B. (2016). Analysis on advective transport condition for heavy air pollution processes in Beijing during the 2013-2014 winter months and design of transmission weather index (in Chinese). Meteorol. Mon. 42, 314–321. doi:10.7519/j.issn.1000-0526.2016.3.006
Huang, X., Ding, A., Gao, J., Zheng, B., Zhou, D., Qi, X., et al. (2021). Enhanced secondary pollution offset reduction of primary emissions during COVID-19 lockdown in China. Natl. Sci. Rev. 8, nwaa137–54. doi:10.1093/nsr/nwaa137
Huang, X., Wang, Z., and Ding, A. (2018). Impact of aerosol-PBL interaction on haze pollution: Multiyear observational evidences in North China. Geophys. Res. Lett. 45, 8596–8603. doi:10.1029/2018gl079239
Huth, R. (2000). A circulation classification scheme applicable in GCM studies. Theor. Appl. Climatol. 67, 1–18. doi:10.1007/s007040070012
Huth, R. (2010). Synoptic-climatological applicability of circulation classifications from the COST733 collection: First results. Phys. Chem. Earth, Parts A/B/C 35, 388–394. doi:10.1016/j.pce.2009.11.013
Kang, H., Zhu, B., Gao, J., He, Y., Wang, H., Su, J., et al. (2019). Potential impacts of cold frontal passage on air quality over the Yangtze River Delta, China. Atmos. Chem. Phys. 19, 3673–3685. doi:10.5194/acp-19-3673-2019
Li, X., Hu, X.-M., Ma, Y., Wang, Y., Li, L., and Zhao, Z. (2019). Impact of planetary boundary layer structure on the formation and evolution of air-pollution episodes in Shenyang, Northeast China. Atmos. Environ. 214, 116850. doi:10.1016/j.atmosenv.2019.116850
Liu, D., Yan, W., Kang, Z., Liu, A., and Zhu, Y. (2018). Boundary-layer features and regional transport process of an extreme haze pollution event in Nanjing, China. Atmos. Pollut. Res. 9, 1088–1099. doi:10.1016/j.apr.2018.04.009
Liu, X., Zhu, B., Kang, H., Hou, X., Gao, J., Kuang, X., et al. (2021). Stable and transport indices applied to winter air pollution over the Yangtze River Delta, China. Environ. Pollut. 272, 115954. doi:10.1016/j.envpol.2020.115954
Shen, L., Hu, W., Zhao, T., Bai, Y., Wang, H., Kong, S., et al. (2021). Changes in the distribution pattern of PM2.5 pollution over central China. Remote Sens. 13, 4855. doi:10.3390/rs13234855
Shen, L., Wang, H., Zhao, T., Liu, J., Bai, Y., Kong, S., et al. (2020). Characterizing regional aerosol pollution in Central China based on 19 years of MODIS data: Spatiotemporal variation and aerosol type discrimination. Environ. Pollut. 263, 114556. doi:10.1016/j.envpol.2020.114556
Shen, L., Zhao, T., Liu, J., Wang, H., Bai, Y., Kong, S., et al. (2022). Regional transport patterns for heavy PM2.5 pollution driven by strong cold airflows in Twain-Hu Basin, Central China. Atmos. Environ. 269, 118847. doi:10.1016/j.atmosenv.2021.118847
Sun, X., Zhao, T., Bai, Y., Kong, S., Zheng, H., Hu, W., et al. (2022a). Meteorology impact on PM<sub>2.5</sub> change over a receptor region in the regional transport of air pollutants: Observational study of recent emission reductions in central China. Atmos. Chem. Phys. 22, 3579–3593. doi:10.5194/acp-22-3579-2022
Sun, X., Zhou, Y., Zhao, T., Bai, Y., Huo, T., Leng, L., et al. (2022b). Effect of vertical wind shear on PM2.5 changes over a receptor region in Central China. Remote Sens. 14, 3333. doi:10.3390/rs14143333
Wang, Y., Bai, Y., Zhi, X., Wu, K., Zhao, T., Zhou, Y., et al. (2022). Two typical patterns of regional PM2.5 transport for heavy air pollution over Central China: Rapid transit transport and stationary accumulation transport. Front. Environ. Sci. 10, 890514. doi:10.3389/fenvs.2022.890514
Xu, J., Chang, L., Qu, Y., Yan, F., Wang, F., and Fu, Q. (2016). The meteorological modulation on PM2.5 interannual oscillation during 2013 to 2015 in Shanghai, China. Sci. Total Environ. 572, 1138–1149. doi:10.1016/j.scitotenv.2016.08.024
Xu, Y., Xue, W., Lei, Y., Huang, Q., Zhao, Y., Cheng, S., et al. (2020). Spatiotemporal variation in the impact of meteorological conditions on PM2.5 pollution in China from 2000 to 2017. Atmos. Environ. 223, 117215. doi:10.1016/j.atmosenv.2019.117215
Yan, Y., Zhou, Y., Kong, S., Lin, J., Wu, J., Zheng, H., et al. (2021). Effectiveness of emission control in reducing PM<sub>2.5</sub> pollution in central China during winter haze episodes under various potential synoptic controls. Atmos. Chem. Phys. 21, 3143–3162. doi:10.5194/acp-21-3143-2021
Yang, Y., Wang, J., Gong, S., Zhang, X., Wang, H., Wang, Y., et al. (2016). PLAM-a meteorological pollution index for air quality and its applications in fog-haze forecasts in North China. Atmos. Chem. Phys. 16, 1353–1364. doi:10.5194/acp-16-1353-2016
Yu, C., Zhao, T., Bai, Y., Zhang, L., Kong, S., Yu, X., et al. (2020). Heavy air pollution with a unique “non-stagnant” atmospheric boundary layer in the Yangtze River middle basin aggravated by regional transport of PM2.5 over China. Atmos. Chem. Phys. 20, 7217–7230. doi:10.5194/acp-20-7217-2020
Zhang, H., Zhang, B., Lv, M., and An, L. (2017). Development and application of stable weather index of Beijing in environmental meteorology (in Chinese). Meteorol. Mon. 43, 998–1004. doi:10.7519/j.issn.1000-0526.2017.08.010
Zhang, R., Li, Q., and Zhang, R. (2014). Meteorological conditions for the persistent severe fog and haze event over eastern China in January 2013. Sci. China Earth Sci. 57, 26–35. doi:10.1007/s11430-013-4774-3
Zhang, X., Xu, X., Ding, Y., Liu, Y., Zhang, H., Wang, Y., et al. (2019). The impact of meteorological changes from 2013 to 2017 on PM2.5 mass reduction in key regions in China. Sci. China Earth Sci. 62, 1885–1902. doi:10.1007/s11430-019-9343-3
Zhang, Y., Ding, A., Mao, H., Nie, W., Zhou, D., Liu, L., et al. (2016). Impact of synoptic weather patterns and inter-decadal climate variability on air quality in the North China Plain during 1980–2013. Atmos. Chem. Phys. 124, 119–128. doi:10.1016/j.atmosenv.2015.05.063
Zhao, X., Zhao, P., Xu, J., Meng, W., Pu, W., Dong, F., et al. (2013). Analysis of a winter regional haze event and its formation mechanism in the North China Plain. Atmos. Chem. Phys. 13, 5685–5696. doi:10.5194/acp-13-5685-2013
Zhou, Y., Bai, Y., Yue, Y., Lü, J., Chen, S., and Xiao, H. (2019). Characteristics of the factors influencing transportation and accumulation processes during a persistent pollution event in the middle reaches of the Yangtze River, China. Atmos. Pollut. Res. 10, 1420–1434. doi:10.1016/j.apr.2019.03.014
Zhou, Y., Guo, J., Zhao, T., Lv, J., Bai, Y., Wang, C., et al. (2022). Roles of atmospheric turbulence and stratification in a regional pollution transport event in the middle reaches of the Yangtze River. Earth Space Sci. 9, e2021EA002062. doi:10.1029/2021ea002062
Keywords: meteorological conditions, regional pollution day, stable pollution index, transport pollution index, Twain-Hu Basin
Citation: Yue Y, Bai Y, He H, Xu L, Chen X, Zhou Y, Tang Z and Zhan T (2023) Application of stable index and transport index for regional air pollution over Twain-Hu Basin. Front. Environ. Sci. 10:1118316. doi: 10.3389/fenvs.2022.1118316
Received: 07 December 2022; Accepted: 28 December 2022;
Published: 12 January 2023.
Edited by:
Honglei Wang, Nanjing University of Information Science and Technology, ChinaReviewed by:
Pengguo Zhao, Chengdu University of Information Technology, ChinaCopyright © 2023 Yue, Bai, He, Xu, Chen, Zhou, Tang and Zhan. This is an open-access article distributed under the terms of the Creative Commons Attribution License (CC BY). The use, distribution or reproduction in other forums is permitted, provided the original author(s) and the copyright owner(s) are credited and that the original publication in this journal is cited, in accordance with accepted academic practice. No use, distribution or reproduction is permitted which does not comply with these terms.
*Correspondence: Lin Xu, eHVsaW4wMDAwQG91dGxvb2suY29t; Yue Zhou, emhvdXl1ZUB3aGloci5jb20uY24=
Disclaimer: All claims expressed in this article are solely those of the authors and do not necessarily represent those of their affiliated organizations, or those of the publisher, the editors and the reviewers. Any product that may be evaluated in this article or claim that may be made by its manufacturer is not guaranteed or endorsed by the publisher.
Research integrity at Frontiers
Learn more about the work of our research integrity team to safeguard the quality of each article we publish.