 Fengyi Chang
 Jiandong Li
 Nan Li
 Hong Liao
- Jiangsu Key Laboratory of Atmospheric Environment Monitoring and Pollution Control, Jiangsu Collaborative Innovation Center of Atmospheric Environment and Equipment Technology, School of Environmental Science and Engineering, Nanjing University of Information Science and Technology, Nanjing, China
Stratospheric intrusion (SI) is an important source of tropospheric ozone (O3). Here, we used the online coupled Weather Research and Forecasting-Chemistry (WRF-Chem) model to simulate a typical SI event that occurred over eastern China on 15–19 July 2016 and investigate the impacts of SI on near-surface O3 pollution. The results show that the large-scale circulation of SI was characterized by a deep trough over central China and South Asia high and Western Pacific Subtropical high located to the east and west of the deep trough, respectively. With the evolution of the deep trough, the strong downdrafts behind the trough lead to O3-rich air injected into the lower troposphere across eastern China. By using a tracer tagging method in WRF-Chem, we quantified the SI contributed up to 6.5 ppb to the surface O3 concentration. According to the integrated process rate analyses, which were employed to quantify the contribution of different physical/chemical processes to O3, the advection process dominated variations in troposphere O3 with positive contribution ranging from 0.1 to 13.8 ppb h−1. As altitude decreases, the contribution of advection diminishes as the intensity of the SI gradually weakens. Although the vertical advection contributed limited O3 that directly reached the ground, we revealed that the SI has significant impact on near-surface O3 over a large territory of eastern China through regional transport by horizontal advection process. Below 691 m, the positive contribution of horizontal advection to O3 ranges from 1.6 to 13.4 ppb h−1. This study highlights the natural effect of SI on summertime O3 pollution in eastern China and will help the development of a future O3 pollution alert system.
1 Introduction
High concentrations of surface ozone (O3) are detrimental to human health (Lelieveld et al., 2015; Fleming et al., 2018; Xu et al., 2020) and crop yields (Mills et al., 2018). O3 pollution has increased recently in China, surpassing PM2.5 as a major pollutant that deteriorates urban air quality (Li et al., 2019a; Li et al., 2019b; Zhai et al., 2019; Li et al., 2020). Near-surface O3 is produced via photochemical reactions involving nitrogen oxides and volatile organic compounds (Finlayson-Pitts, 1997; Wang et al., 2017). In addition to anthropogenic and biogenic emissions, stratospheric intrusion (SI), which is characterized by O3-rich air in the mid-troposphere with high potential vorticity (PV) and low relative humidity (RH) (Ganguly, 2012; Greenslade et al., 2017), can contribute to elevated O3 concentrations (Davies and Schuepbach, 1994; Stohl et al., 2003a). Such a natural process complicates the development of emission-reduction strategies. The dynamical mechanism underlying SI are complex. Previous studies have revealed that SI are mainly related to weather processes such as cut-off lows and tropopause folding (Langford et al., 1996; Nieto et al., 2005; Li et al., 2015; Chen et al., 2021).
Direct observation of O3 pollution caused by SI is challenging because of the large dynamic variability of the tropopause and the lack of high-resolution spatial and temporal measurements. Hocking et al. (2007) detected stratospheric O3 intrusion events using wind profiler radar and illustrated that wind profile data could be used to predict the probability of O3 intrusion. By using the MERRA-2 reanalysis in combination with surface O3 and satellite observations and GEOS-5 simulated carbon monoxide and a stratospheric tracer, Knowland et al. (2017) found that SI events are associated with the tropopause folding under the jet stream and subsequent isentropic descent of dry, O3-rich stratospheric air toward the surface. Huang et al. (2022) used Be7 as a tracer for stratosphere–troposphere exchange to diagnose SI events. Ou-Yang et al. (2022) use thresholds for surface O3, carbon monoxide, and RH to detect SI episodes at Lulin Atmospheric Background Station, a high-altitude site in East Asia.
SIs have also been extensively investigated in modelling studies. Based on the GFDL AM3 model, Lin et al. (2015) highlighted that SI can frequently occur during spring when the polar jet stream is abnormally contorted to conflict with the attainment of the national ambient air quality standard at high-elevation western US regions. Through the use of the ECHAM5/MESSy Atmospheric Chemistry model simulations, Akritidis et al. (2016) found a high correlation between interannual variability of near-surface O3 and tropopause folding in the Eastern Mediterranean. During selected intrusion events, the air masses moved in a southeasterly direction. Using WACCM6 model simulations, Wang X. et al. (2020) found a significant 18% average contribution of SI to O3 extreme events in the western United States. The weather research and forecasting coupled with chemistry (WRF-Chem) was utilized by Zhao et al. (2021a) to investigate a SI that occurred in Hong Kong in spring. They found that the subtropical high-level jet stream was the primary driver of this SI. Zhao et al. (2021b) used the process analysis technique in WRF-Chem to examine the occurrence of SI and concluded that vertical advection is the predominant cause of the increase in O3 in the lower troposphere. Based on observations and model simulation, Zhang et al. (2022) estimated the mean magnitude of SI contribution was 1.5–10 ppb in the North China Plain. Meng et al. (2022) used reanalysis data, observations and LaGrange models to investigated the effect of SI on summer O3 in the North China Plain. The results showed that the contribution of SI to surface O3 was estimated to be 5.7%–18.8% and it is closely related to the high-altitude westerly circulation over the Asian region. These findings suggested an important role of SI in O3 enhancement episodes, and more observations are needed to properly constrain and quantify its impacts.
Eastern China is one of the most developed regions in China and has become an economic center in recent years. However, the fast economic development also resulted in a substantial rise in air pollutant emissions, leading to severe photochemical pollution (Dang and Liao, 2019; Tang et al., 2022). Some studies have revealed transportation can induce O3 pollution in the eastern China (Gong et al., 2020; Dai et al., 2021; Dang et al., 2021; Qian et al., 2022), but few have linked wide-spread transportation to SI. Here we used air quality observations and the WRF-Chem model to simulate a SI event in eastern China in summer and explore its dynamical processes. The integrated process analysis was used to quantify the contribution of SI to surface O3 concentration.
2 Data and methods
2.1 Observational data
Near-surface O3 observations were obtained from the China National Environmental Monitoring Center (CNEMC,http://106.37.208.233:20035/). The days with maximum daily 8-h average (MDA8) O3 concentrations exceeding 82 ppb were defined as O3 pollution episodes based on the National Ambient Air Quality Standard (GB 3095–2012) Grade Ⅱ issued by the Ministry of Ecology and Environment of China. Surface meteorological observations, including temperature, RH and wind vectors are downloaded from http://www.Meteomanz.com/.
2.2 Model configurations
WRF-Chem (v3.9.1) is an open-source regional chemical transport model developed by the US National Center for Atmospheric Research (NCAR). WRF-Chem is capable of simulating air quality with fully coupled meteorology and chemistry (Grell et al., 2005). Initial and boundary meteorological conditions were derived from FNL reanalysis data (https://rda.ucar.edu/datasets/ds083.2/) by the National Centers for Environmental Prediction (NCEP). The anthropogenic emissions were obtained from the Multi-resolution Emission Inventory for China (MEIC, http://meicmodel.org/), which was developed by Tsinghua University (Li et al., 2017). Online biogenic and real-time biomass burning emissions were calculated from the Model of Emissions of Gases and Aerosols from Nature (MEGAN, v2.1) tool (A. Guenther et al., 2006) and Fire INventory from NCAR (FINN, https://www2.acom.ucar.edu/modeling/finn-fire-inventory-ncar) (Wiedinmyer et al., 2011) respectively. The initial and boundary conditions of chemical specials were provided by the global chemical transport model MOZART (L. K. Emmons et al., 2010). Meanwhile, the Statewide Air Pollution Research Center (SAPRC99) mechanism was utilized for the gas phase reaction scheme in our study (Carter, 2000). For aerosols, we applied the Model for Simulating Aerosol Interactions and Chemistry (MOSAIC) as the aerosol parameterization (Zaveri et al., 2008).
Following Barth et al. (2012), we added the upper boundary condition scheme to overcome WRF-Chem’s inability to simulate O3 in the stratosphere. This scheme adjusts key chemical species (i.e., O3, nitrogen oxides, nitric acid, methane, monoxide carbon, Nitrous Oxide, nitrogen oxide) concentrations to climatological averages based on the out of a global atmospheric chemical model. The idealized chemical profile from 50 hPa down to the tropopause are replaced with these values. The temperature from WACCM is used to calculate tropopause height, which subsequently serves as the upper boundary condition in WRF-Chem (Barth et al., 2012; Lamarque et al., 2012). This upper boundary condition scheme will enable WRF-Chem to accurately simulate the stratosphere-troposphere exchanges and quantify the impact of SI on the concentration of chemical species in the troposphere.
The simulation ran from July 13 to 19 July 2016, with the first 48 h saved as the spin-up period. The WRF-Chem domain covers the whole of China, with a horizontal resolution of 27 × 27 km and 43 vertical layers from the surface to 50 hPa. Table 1 presented the physical parameterization for subgrid processes, such as radiation, microphysics, and the surface layer.
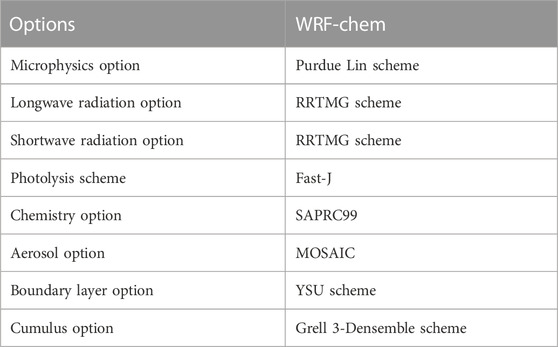
TABLE 1. Parameterizations used in the WRF-Chem model.
2.3 Statistical methods for comparisons
To statistically quantify the model performance, we used three indicators, i.e., the index of agreement (IOA), the normalized mean bias (NMB) and the correlation coefficient R). IOA measures the degree of agreement between the model and observations and ranges from 0 to 1, with one indicating perfect agreement. The sign of NMB reveals whether the modeled mean underestimates or overestimates the observed mean, whilethe values of NMB indicates the magnitude of the underestimation or overestimation (Jr and Yu, 2012). Generally, model performance is excellent if NMB is close to 0. R describes the degree of association between two variables (Asuero et al., 2007). In model studies, R greater than 0.7 between simulations and observations is considered to be a good correlation.
where SIMi, OBSi, are the hourly observed and simulated data and N is the total number of hours, and
2.4 Tracer method
To track stratospheric air, one tracer was included. In the WRF-Chem, the stratospheric tracer is defined as a value of one from the height of the tropopause to the top of the model. The stratospheric tracer in the model was physically transported during the WRF-Chem simulation. The stratospheric O3 (O3S) is calculated by multiplying the stratospheric tracer by the tropopause O3 concentration. The percentage of stratospheric O3 (O3P) is calculated by the ratio of O3S and surface O3 concentration (Barth et al., 2012; Ni et al., 2019).
2.5 Integrated process rate analysis
The integrated process rate (IPR) analysis has been widely used to quantify the contributions of different processes to O3 variations (Gonçalves et al., 2009; Gao et al., 2016; Gao et al., 2018). In this study, five processes are considered, including vertical mixing (VMIX), sub-grid convection (CONV), net chemical production (CHEM), horizontal advection (ADVH), and vertical advection (ADVZ). VMIX is initiated by turbulence and is closely associated with the development of planetary boundary layer (PBL), which influences O3 vertical diffusion. CHEM represents the net O3 chemical production (production minus consumption). ADVH and ADVZ indicate transport by winds (Gao et al., 2016; Ou-Yang et al., 2022). ADV is defined as the sum of ADVH and ADVZ. NET is the sum of all physical and chemical processes that contribute to variations in O3 concentrations.
3 Result and discussion
3.1 Model evaluation
We focused on a SI event that occurred in eastern China on 16–18 July 2016. Figure 1 shows the spatial distribution of maximum daily 8-h average (MDA8) O3 concentrations for cities in eastern China during the SI event from 15 to 18 July. The air quality was generally clean with MDA8 O3 concentrations being lower than 60 ppb on 15 July. Then, the pollution episode began to develop with MDA8 O3 concentrations ranging between 60 and 80 ppb in Jiangsu and Shandong. The MDA8 O3 concentrations even reached 100 ppb on July 17, exceeding the MDA8 O3 national air quality grade Ⅱ standard of 82 ppb (equal to 160 ug m−3 at 298 K and 1,013 hPa. The O3 pollution episode was gradually mitigated on July 18. We employed the WRF-Chem model to examine the contribution of SI to near-surface O3 during this widespread pollution.
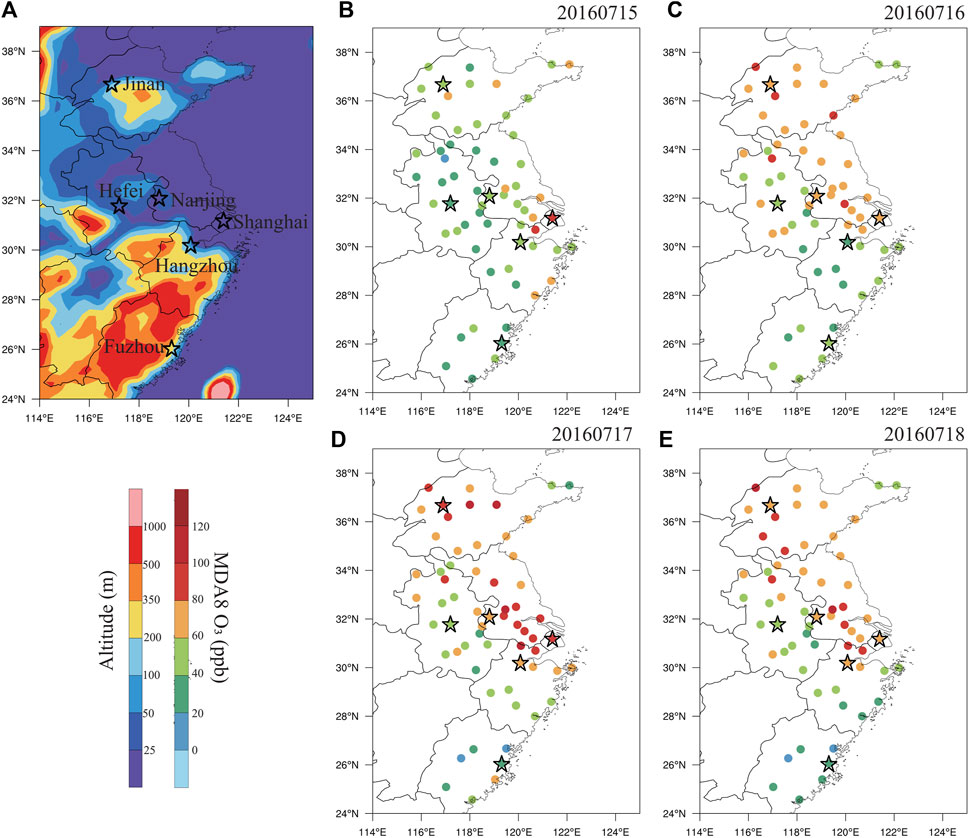
FIGURE 1. Topography in Eastern China (A) and the spatial distribution of surface O3 concentrations in major cities in eastern China from 16 to 18 July 2016 (B–E). The stars are provincial capitals, including Nanjing (the capital of Jiangsu province), Hefei (the capital of Anhui province), Jinan (the capital of Shandong province), Hangzhou (the capital of Zhejiang province), Fuzhou (the capital of Fujian) and Shanghai.
First, we evaluated the performance of the model in simulating meteorological parameters, including temperature, RH, wind speed and wind direction (Table 2). Generally, the model simulated well in reproducing temporal variations in meteorological parameters in eastern China, with IOA values ranging between 0.57 and 0.81. The simulated temperature and RH agreed well with observations, with absolute NMB lower than 12%. For wind speed, we found high NMB for Hangzhou (34.6%) and Jinan (40.5%), which may due to the unresolved topographic features in the surface drag parameterization and the coarse resolution (Yahya et al., 2015; Zhang et al., 2015; Chen et al., 2019). The IOA values were in the range of 0.57–0.74 and the absolute NMB values were in the range of 6.0%–19.4%, indicating that the WRF-Chem model captured wind direction fairly well.
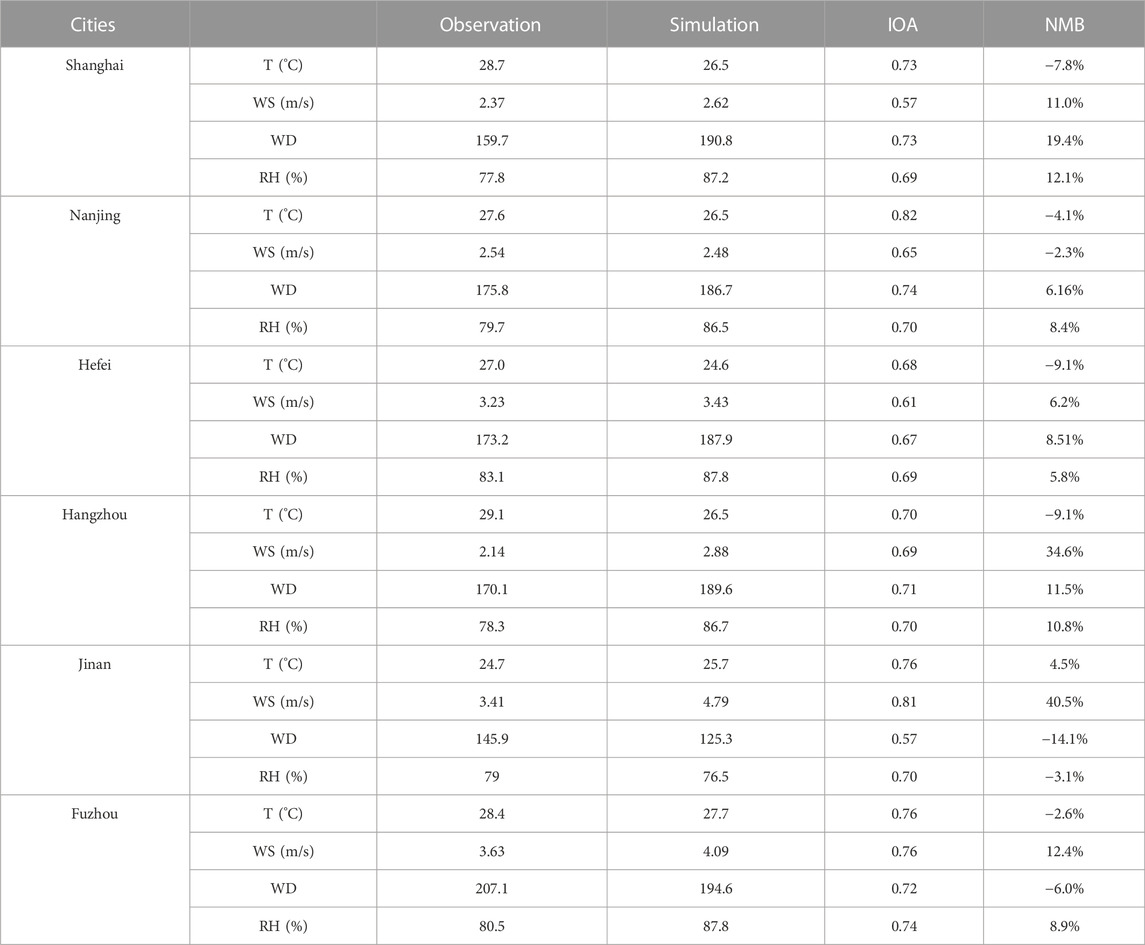
TABLE 2. Model performance in predicting meteorological parameters over cities during the study period. The T, WS, WD, and RH represent temperature, wind speed, wind direction and relative humidity, respectively.
Figure 2 shows the scatter plots of simulated versus observed hourly O3 concentrations and their regression statistics for six provincial capitals (Shanghai, Nanjing, Hangzhou, Fuzhou, Jinan, and Hefei) in eastern China. The mean IOA, R and regression slope is 0.72, 0.73 and 0.78, respectively, indicating a good agreement between simulation and observation. We also note that surface O3 concentrations were overestimated by 11.8%–54.0%, which might result from the PBL parameterization scheme (YSU scheme) and boundary input from the MOZART-4 model. It was suggested that the YSU scheme overestimated the nighttime PBL, which increased nighttime surface O3 by enhancing vertical mixing (Žabkar et al., 2011; Karlický et al., 2017). Abdallah et al. (2016) also found the boundary conditions from the MOZART-4 model were responsible for the overestimation of O3 in the Polyphemus chemical transport model. In addition, the model accuracy is also limited by the resolution (0.25° × 0.25°) of emission inventory (Gao et al., 2016). Despite these uncertainties, model simulations were capable of reproducing the spatial and temporal characteristics of O3 and meteorological parameters during SI.
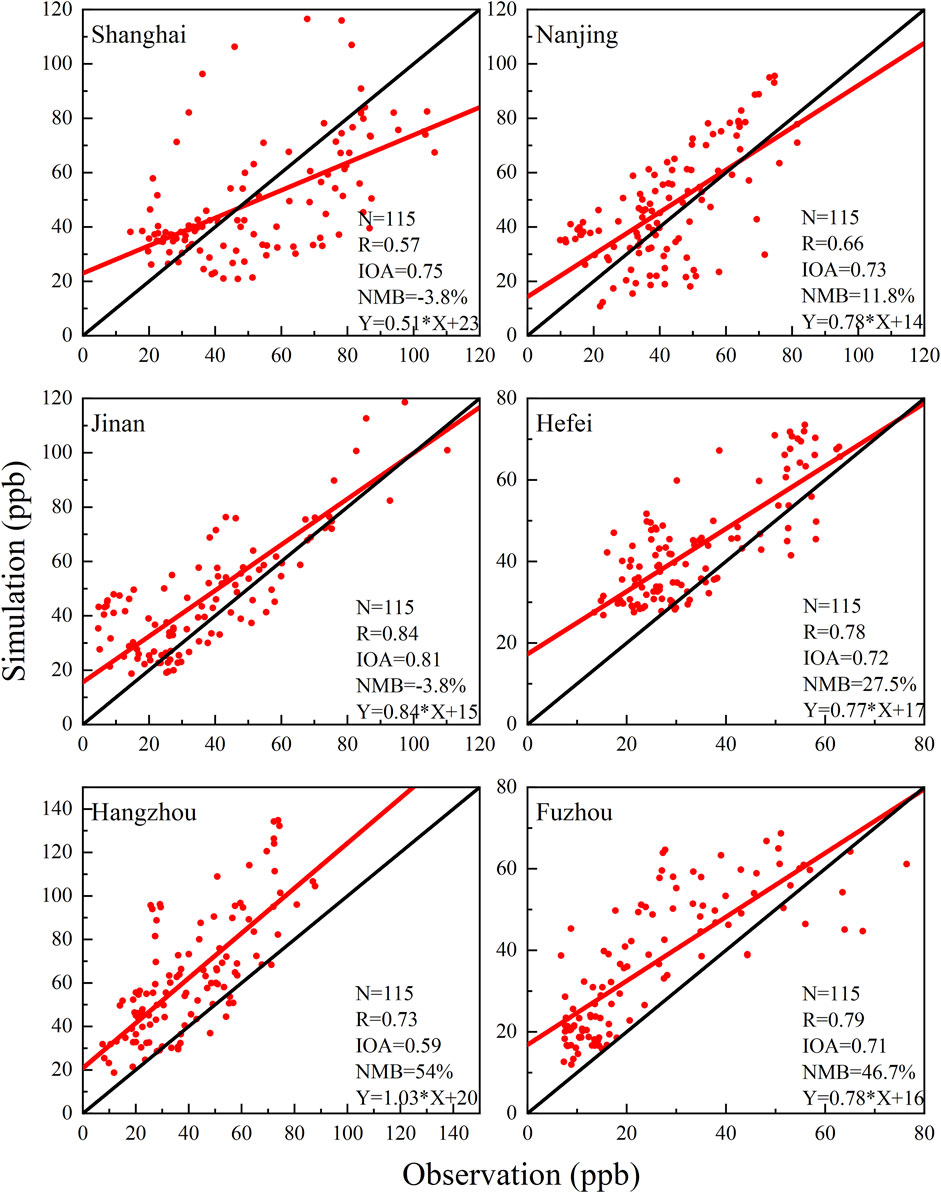
FIGURE 2. Scatter plots of O3 between simulations and observations for the six provincial capitals in eastern China. The IOA, NMB, R represent the index of agreement, the normalized mean bias and the correlation coefficient, respectively, N denotes the total number of hours.
3.2 Weather conditions during stratosphere intrusion
Figure 3 shows the synoptic conditions during SI over East Asia in the upper troposphere (300 hPa). The large-scale circulation pattern was characterized by a deep trough over central-to-North China, the South Asia high and the Western Pacific subtropical high (Figure 3A). Two cold eddies located around 45–50°N in northern Xinjiang and Mongolia, respectively, continuously brought cold air to the deep trough. The deep trough was developed from 12:00 BJT on 16 July to its peak at 00:00 BJT on 17 July, then gradually decayed at 00:00 BJT on 18 July. During the eastern development of the deep trough, the downdraft in the west of the upper-level trough were expected to carry O3-rich stratospheric air into the troposphere across eastern China.
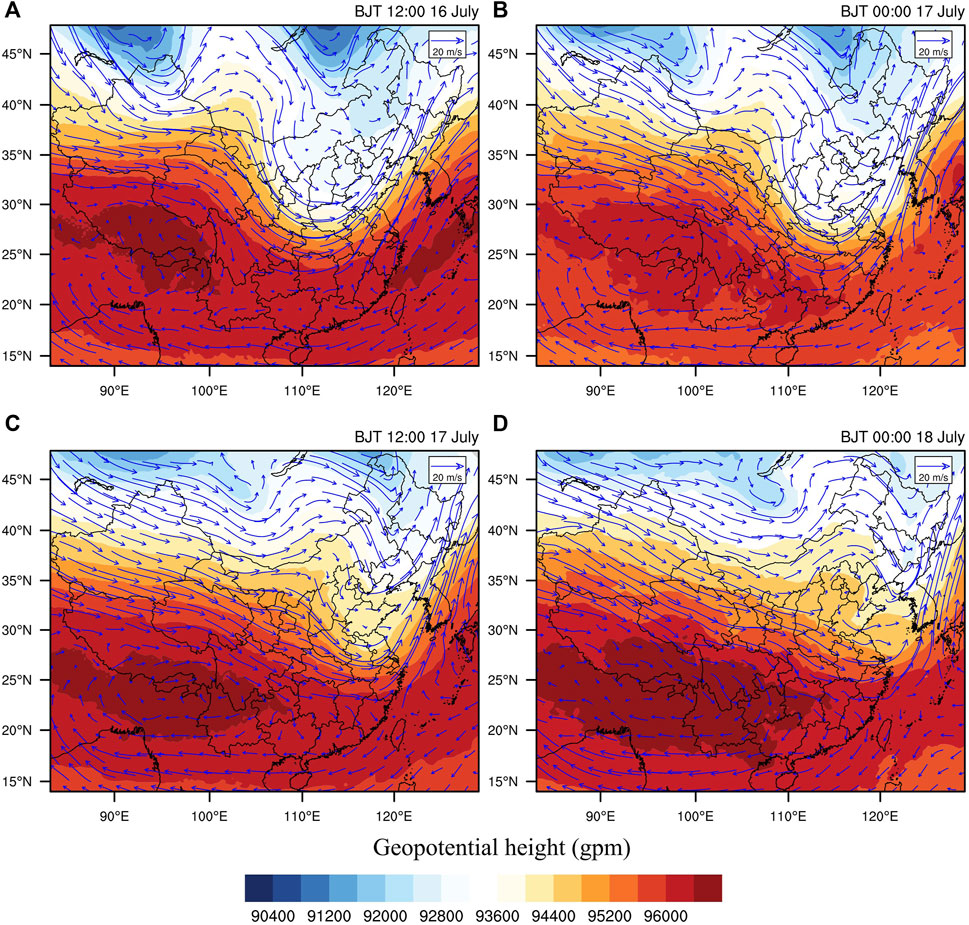
FIGURE 3. Spatial distribution of geopotential height (shading, unit: gpm) and horizontal winds (vector, unit: m s−1) at 300 hPa over East Asia from 16 to 18 July 2016.
A PV of 2 PVU (10–6 m2 K s−1 kg−1) is referred to as a dynamical tropopause at the midlatitude (Holton et al., 1995; Stohl et al., 2003b). Elevated PV in the tropopause can be used as a marker to indicate stratosphere intrusion which may lead to enhanced O3 concentration in the troposphere. Figure 4 shows the spatial distribution of PV at 300 hPa. We see that the regions with PV exceeding 2 PVU coincided with the passage of the deep trough shown in Figure 3. On 16 July (Figure 4A), high PV values were identified over northern Xinjiang, eastern Mongolia and northern China, corresponding to the three upper-level troughs in Figure 3A. Along with the development of the deep trough in central China, high PV values were found over eastern China on 17 July, indicating the SI occurred there.
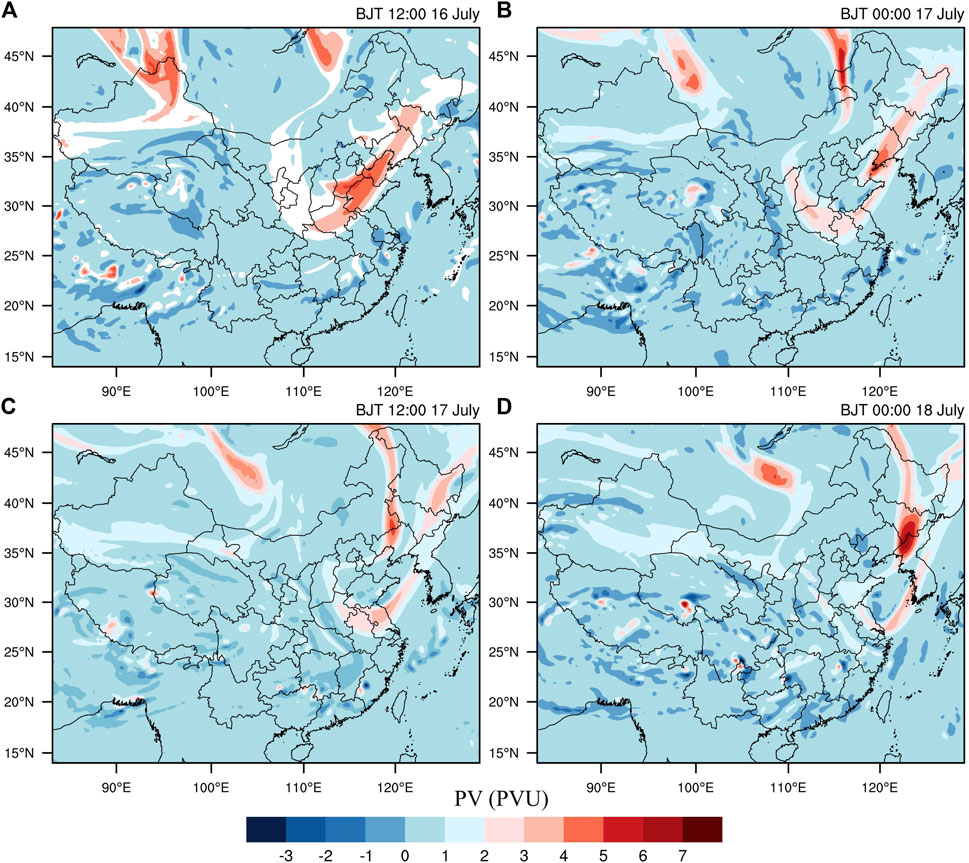
FIGURE 4. Spatial distribution of potential vorticity (PV, unit: 10–6 m2 K s−1 kg−1) at 300 hPa over East Asia from 16 to 18 July 2016.
3.3 The impact of stratospheric intrusion on tropospheric O3
Figure 5 shows the spatial distribution of O3 at 300 hPa from 16 to 18 July 2016. The simulated O3-rich stratospheric air match well with the high-PV regions. At 12:00 BJT on 16 July, the O3 concentration in eastern China was about 80–120 ppb, and the O3 tongue exceeding 110 ppb moved to 116° E after 12 h. As the deep trough moved eastward, the maximum center was identified at Jiangsu and Shandong provinces at 12:00 BJT on 17 July, with high O3 concentration that exceeded 150 ppb (Figure 5C). Based on the former analysis, the high-O3 concentrations at 300 hPa were attributed to the downward transport of O3 from the stratosphere during SI.
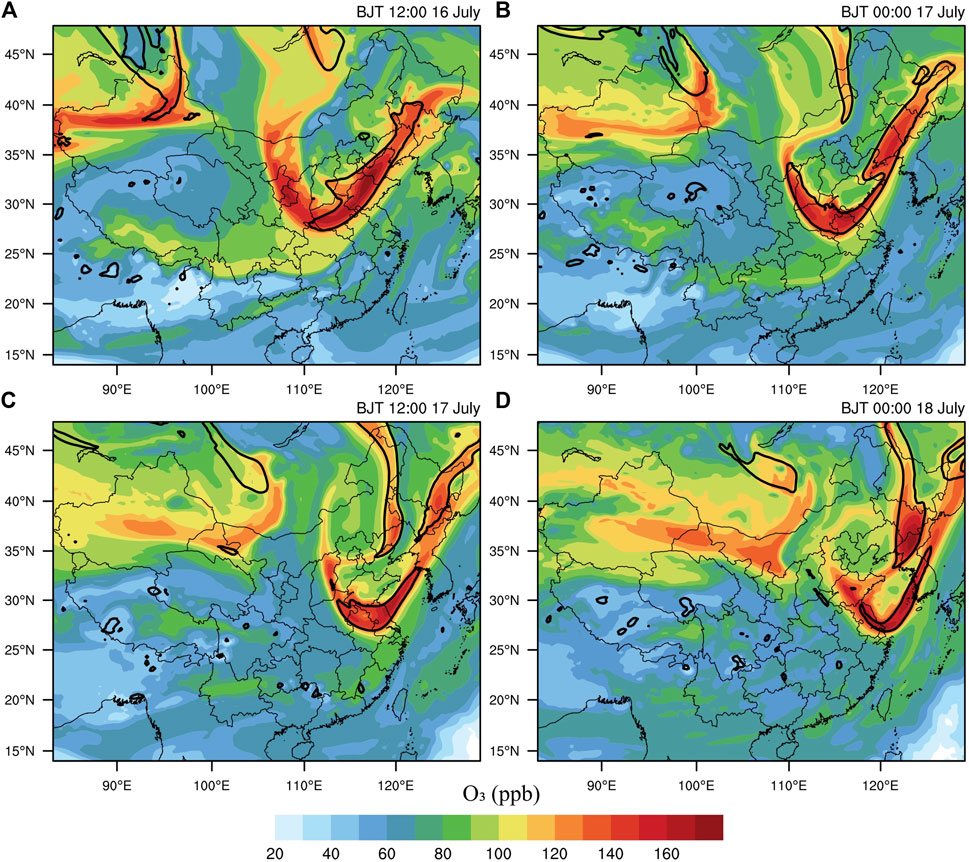
FIGURE 5. Spatial distribution of O3 (unit: ppb) at 300 hPa over East Asia from 16 to 18 July 2016. The black contour line indicates the dynamical tropopause of 2 PVU (1 PVU = 10–6 m2 s−1 K kg−1).
In order to study the depth of SI, the longitude-pressure cross-section of WRF-Chem simulated O3 and PV along the latitude of 30°–34°N were shown in Figure 6. Tongue plumes with O3 concentrations exceeding 160 ppb extend from 100 hPa to 280 hPa, representing the downward transport of stratospheric O3. This tongue-like plume moved from 110° E to 118° E with the development of the upper-level trough. At 12:00 BJT on 16 July, a band of high O3 concentration of 70–140 ppb extended from the top of the troposphere to near 800 hPa over eastern China (116°–120°E). Note that not every SI event can influence the near-surface O3. For example, Wang H. et al. (2020) identified a SI on 11–12 July 2016 over eastern China, and suggested that the SI did not reach the ground.
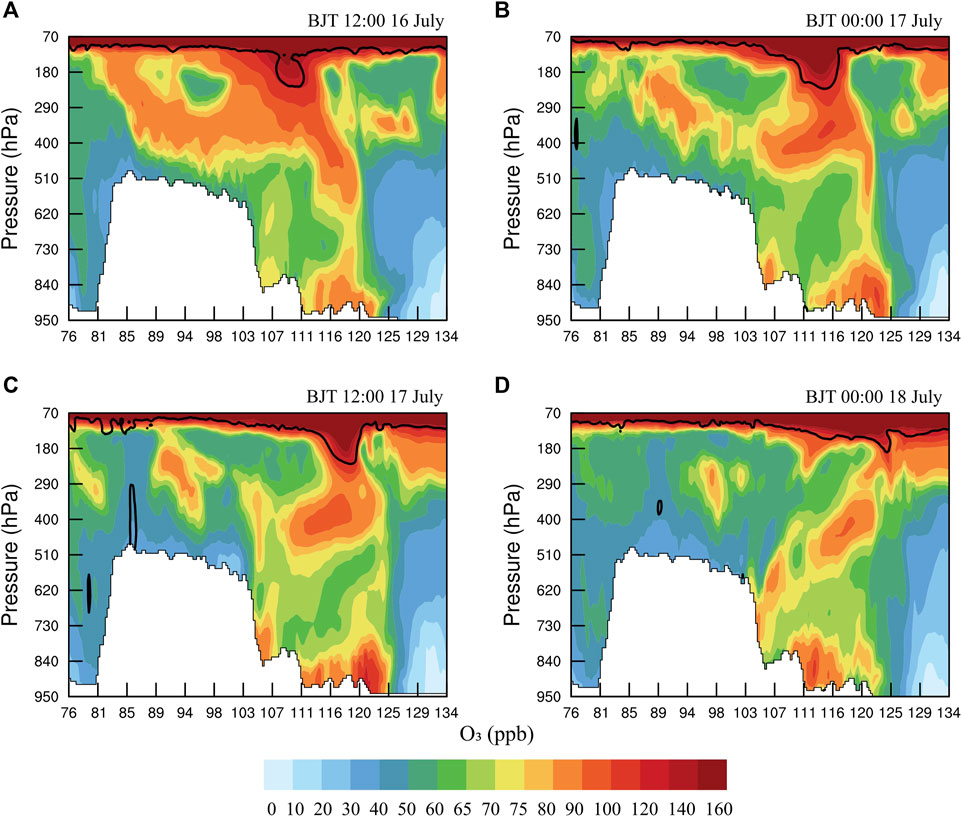
FIGURE 6. Longitude-pressure cross-section of WRF-Chem simulated O3 (unit: ppb) averaged over the longitude of 30°–34°N from 16 to 18 July 2016. The black contour line indicates the dynamical tropopause of 2 PVU.
To further confirm the impact of SI on surface O3, we investigated the stratosphere O3 tracers following the method in Section 2.4. Figure 7 shows the spatial distribution of O3S and O3P at the surface from 16 to 18 July 2016. The O3S values in Jiangsu and Shandong provinces were very low at 12:00 BJT on July 16. After 12 h, the maximum value of O3S reached 6 ppb (Figure 7B). The larger O3S values cover almost the whole of Shandong province. At 12:00 BJT on July 17, the maximum center of O3S moved to Jiangsu province with values of 2–4 ppb. We then calculated the relative stratospheric contribution to surface O3 (O3P). O3P reached a maximum of 15% at 00:00 BJT on July 17. By analyzing the weather condition in Section 3.2, we found that the strongest upper-air trough occurred over Jiangsu, while the simulated maximum stratospheric contribution occurred over Shandong. This discrepancy may be partly explained by the difference in terrain height. In provinces with greater elevations, such as Shandong, Henan, and Hubei, stratospheric O3 was more easily able to reach the ground (Figure 1A).
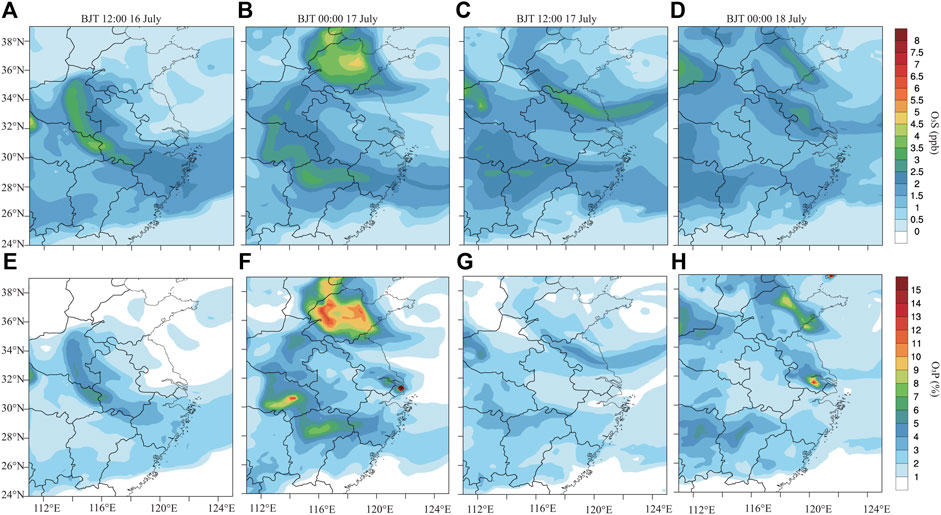
FIGURE 7. Spatial distribution of surface O3S and O3P in eastern China from 16 to 18 July 2016.
3.4 Contribution of different processes to O3 variation during stratospheric intrusion
To quantify the contribution of different process on surface O3, IPR analysis is utilized in this section. We selected four grid points over Jiangsu province, where the impact of the intrusion is significant (Figure 8E). The time span used to calculate the contribution of each process is 6 h. Figure 8 depicts the vertical profile of the ADVZ contribution during the intrusion. A clear positive contribution of up to 12.9 ppb h−1 is found in the upper troposphere over Xuzhou and extends down to about 13 km (grid point a). Further to the southeast, the peak of the positive ADVZ contribution gradually appears at the lower position of the free troposphere. For example, at grid point b (near Suqian), the maximum contribution is about 9.9 ppb h−1 at 8 km, and the positive contribution extends from 12 km to 8 km, while grid point c (near Huaian) indicates the maximum positive contribution of about 15 ppb h−1 at 6 km, and the positive contribution extends down to near 2 km. Further downstream, grid point d (near Yancheng) shows a positive contribution of about 10.15 ppb h−1 near 2.5 km. This provides evidence that O3 is transported vertically towards the surface from the northwest to the southeast. Although we analyzed only one transport route, similar transport paths (northwest-southeast) occurred through the Jiangsu and Shandong provinces during the SI.
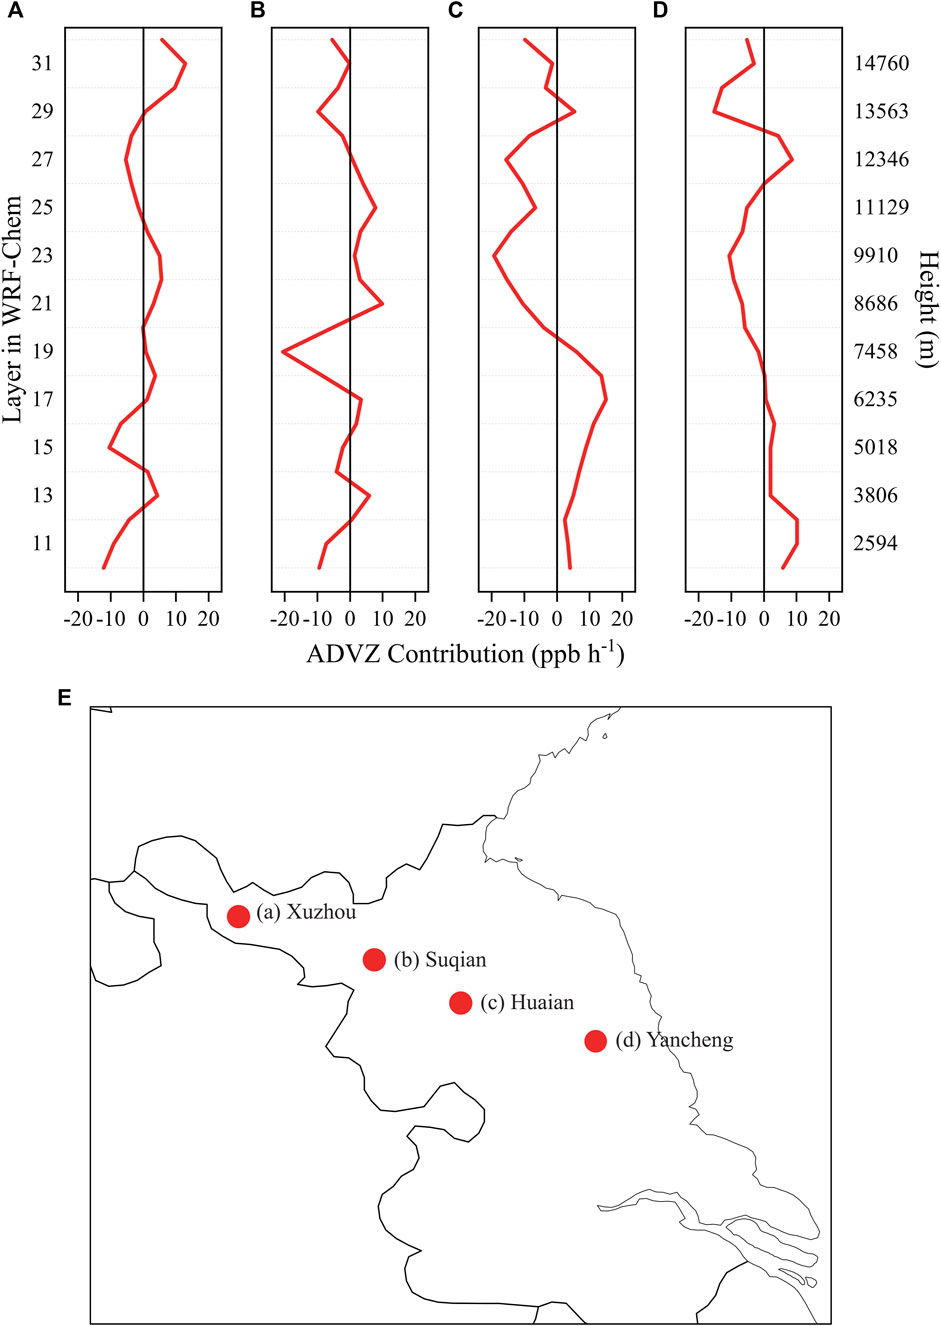
FIGURE 8. Vertical profiles of the ADVZ contributions (A–D) from four grid points in the northwest direction over Jiangsu province (E) during the intrusion.
Figure 9 shows the mean contributions of different physical/chemical processes to O3 concentration at the four grid points during SI. As shown in Figure 9A, the contributions from photochemical production were negligible in the free troposphere, where O3 precursors of nitrogen oxides and volatile organic compounds are limited. The ADV dominated the NET variation in O3, with positive contributions ranging from 0.1 to 13.8 ppb h−1. The contribution of ADV reduces as altitude decrease due to a gradual weakening of intrusion intensity. Undoubtedly, the contribution of ADV to O3 in the free troposphere was attributed to SI. To further quantify the influence of SI on near-surface O3, we analyzed the contribution of ADVZ and ADVH to O3 within the planetary boundary layer (Figure 9B). We suggested that during a SI, O3 from the stratosphere does not reach the surface directly but is first transported vertically to the boundary layer and then influenced downwind areas by horizontal advection. During this intrusion event, ADVH was the dominant process contributing to the increase in near-surface O3 (from 30 to 690 m), with values being 1.7–13.5 ppb h−1.
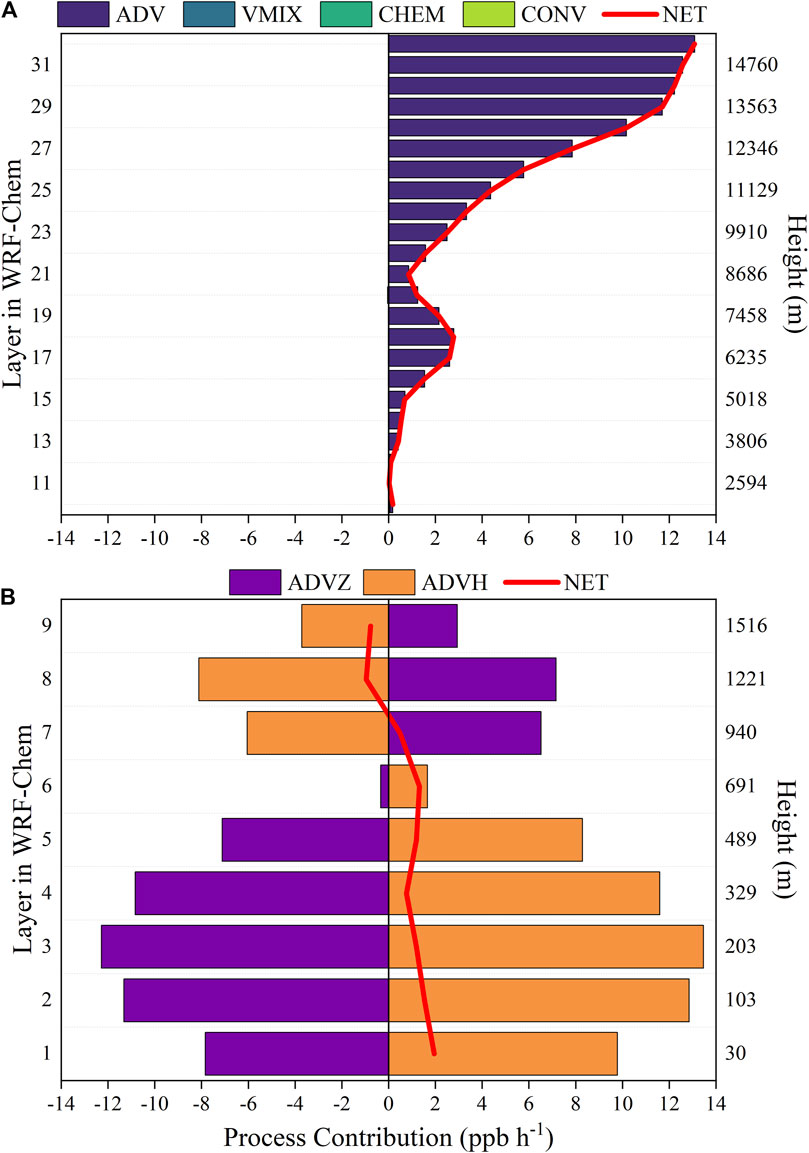
FIGURE 9. Changes in O3 during the stratospheric intrusion. The red lines denote the net contribution of all processes (NET; defined as ADV + VMIX + CHEM).
4 Conclusion
In this study, we simulated a typical SI event that occurred over eastern China from 15 to 19 July 2016 using the regional model WRF-Chem and examined the impacts of SI on surface O3 pollution. The results indicate that the large-scale circulation pattern during SI was characterized by a deep trough over central-to-North China, the South Asia high and the Western Pacific subtropical high. The downdrafts in the west of the upper-level trough carried O3-rich stratospheric air into the troposphere when the deep trough passed across eastern China. The spatial distribution and longitude-pressure cross-section of O3 at 300 hPa revealed a significant increase in O3 over eastern China during SI. Using a tracer tagging technique, we quantified the contribution of SI to surface O3 concentrations of up to 6.5 ppb. The IPR analysis was used to quantify the contribution of different physical/chemical processes to O3 variations during SI. The results indicate that the ADV dominated the NET variation in free troposphere O3, with positive contribution ranging from 0.1 to 13.8 ppb h−1. The contribution of ADV reduces as altitude decreases due to a gradual weakening of intrusion intensity. ADVH was the dominant contributor to the increase in near-surface O3 (from 30 to 690 m), with values ranging between 1.7 and 13.5 ppb h−1. O3 from SI reached the near surface and then influenced a larger area through horizontal advection.
SI as a natural factor makes O3 pollution mitigation more challenging. We argue that, while strictly regulating anthropogenic emissions, we should strengthen the identification of SI and develop discriminating criteria to detect its occurrence.
Data availability statement
The raw data supporting the conclusion of this article will be made available by the authors, without undue reservation.
Author contributions
Data curation, model simulation, visualization and writing-original draft preparation, FC; Supervision, funding acquisition, writing-review and editing, NL, JL, and HL All authors have read and agreed to the published version of the manuscript.
Funding
This work was supported by the National Key Research and Development Program of China (2019YFA0606804), the National Natural Science Foundation of China (41975171), the Natural Foundation of Jiangsu Province (Grants No BK20220031).
Acknowledgments
The numerical calculations in this paper have been done on the supercomputing system in the Supercomputing Center of Nanjing University of Information Science and Technology.
Conflict of interest
The authors declare that the research was conducted in the absence of any commercial or financial relationships that could be construed as a potential conflict of interest.
Publisher’s note
All claims expressed in this article are solely those of the authors and do not necessarily represent those of their affiliated organizations, or those of the publisher, the editors and the reviewers. Any product that may be evaluated in this article, or claim that may be made by its manufacturer, is not guaranteed or endorsed by the publisher.
References
Abdallah, C., Sartelet, K., and Afif, C. (2016). Influence of boundary conditions and anthropogenic emission inventories on simulated O 3 and PM 2.5 concentrations over Lebanon. Atmos. Pollut. Res. 7 (6), 971–979. doi:10.1016/j.apr.2016.06.001
Akritidis, D., Pozzer, A., Zanis, P., Tyrlis, E., Škerlak, B., Sprenger, M., et al. (2016). On the role of tropopause folds in summertime tropospheric ozone over the eastern Mediterranean and the Middle East. Atmos. Chem. Phys. 16 (21), 14025–14039. doi:10.5194/acp-16-14025-2016
Asuero, A. G., Sayago, A., and González, A. G. (2007). The correlation coefficient: An overview. Crit. Rev. Anal. Chem. 36 (1), 41–59. doi:10.1080/10408340500526766
Barth, M. C., Lee, J., Hodzic, A., Pfister, G., Skamarock, W. C., Worden, J., et al. (2012). Thunderstorms and upper troposphere chemistry during the early stages of the 2006 North American Monsoon. Atmos. Chem. Phys. 12 (22), 11003–11026. doi:10.5194/acp-12-11003-2012
Carter, L, W. P. (2000). “Documentation of the SAPRC-99 chemical mechanism for VOC reactivity assessment,” in Report to the California air resources board), 95–308.
Chen, D., Zhou, T., Guo, D., and Ge, S. (2021). Simulation of the multi-timescale stratospheric intrusion processes in a typical cut-off low over northeast Asia. Atmosphere 13 (1), 68. doi:10.3390/atmos13010068
Chen, L., Zhu, J., Liao, H., Gao, Y., Qiu, Y., Zhang, M., et al. (2019). Assessing the formation and evolution mechanisms of severe haze pollution in the Beijing–Tianjin–Hebei region using process analysis. Atmos. Chem. Phys. 19 (16), 10845–10864. doi:10.5194/acp-19-10845-2019
Dai, H., Zhu, J., Liao, H., Li, J., Liang, M., Yang, Y., et al. (2021). Co-occurrence of ozone and PM2.5 pollution in the Yangtze River Delta over 2013–2019: Spatiotemporal distribution and meteorological conditions. Atmos. Res. 249, 105363. doi:10.1016/j.atmosres.2020.105363
Dang, R., Liao, H., and Fu, Y. (2021). Quantifying the anthropogenic and meteorological influences on summertime surface ozone in China over 2012-2017. Sci. Total Environ. 754, 142394. doi:10.1016/j.scitotenv.2020.142394
Dang, R., and Liao, H. (2019). Radiative forcing and health impact of aerosols and ozone in China as the consequence of clean air actions over 2012–2017. Geophys. Res. Lett. 46 (21), 12511–12519. doi:10.1029/2019GL084605
Davies, T. D., and Schuepbach, E. (1994). Episodes of high ozone concentrations at the earth's surface resulting from transport down from the upper troposphere/lower stratosphere: A review and case studies. Atmos. Environ. 28 (1), 53–68. doi:10.1016/1352-2310(94)90022-1
Emmons, L. K., Lamarque, J.-F., Granier, C., Guenther, A., et al. (2010). Description and evaluation of the model for ozone and related chemical tracers, version 4 (MOZART-4). Geosci. Model. Dev. 3, 43–67. doi:10.5194/gmd-3-43-2010
Finlayson-Pitts, B. J., and Pitts, J. N. (1997). Tropospheric air pollution: Ozone, airborne toxics, polycyclic aromatic hydrocarbons, and particles. Science 276 (5315), 1045–1051. doi:10.1126/science.276.5315.1045
Fleming, Z. L., Doherty, R. M., von Schneidemesser, E., Malley, C. S., Cooper, O. R., Pinto, J. P., et al. (2018). Tropospheric Ozone Assessment Report: Present-day ozone distribution and trends relevant to human health. Elementa-Science Of Anthropocene 6. doi:10.1525/elementa.273
Ganguly, N. D. (2012). Influence of stratospheric intrusion on the surface ozone levels in India. ISRN Meteorol. 2012, 1–7. doi:10.5402/2012/625318
Gao, J., Zhu, B., Xiao, H., Kang, H., Hou, X., and Shao, P. (2016). A case study of surface ozone source apportionment during a high concentration episode, under frequent shifting wind conditions over the Yangtze River Delta, China. Sci. Total Environ. 544, 853–863. doi:10.1016/j.scitotenv.2015.12.039
Gao, J., Zhu, B., Xiao, H., Kang, H., Pan, C., Wang, D., et al. (2018). Effects of black carbon and boundary layer interaction on surface ozone in Nanjing, China. Atmos. Chem. Phys. 18 (10), 7081–7094. doi:10.5194/acp-18-7081-2018
Gonçalves, M., Jiménez-Guerrero, P., and Baldasano, J. M. (2009). Contribution of atmospheric processes affecting the dynamics of air pollution in South-Western Europe during a typical summertime photochemical episode. Atmos. Chem. Phys. 9 (3), 849–864. doi:10.5194/acp-9-849-2009
Gong, C., Liao, H., Zhang, L., Yue, X., Dang, R., and Yang, Y. (2020). Persistent ozone pollution episodes in North China exacerbated by regional transport. Environ. Pollut. 265, 115056. doi:10.1016/j.envpol.2020.115056
Greenslade, J. W., Alexander, S. P., Schofield, R., Fisher, J. A., and Klekociuk, A. K. (2017). Stratospheric ozone intrusion events and their impacts on tropospheric ozone in the Southern Hemisphere. Atmos. Chem. Phys. 17 (17), 10269–10290. doi:10.5194/acp-17-10269-2017
Grell, G. A., Peckham, S. E., Schmitz, R., McKeen, S. A., Frost, G., Skamarock, W. C., et al. (2005). Fully coupled “online” chemistry within the WRF model. Atmos. Environ. 39 (37), 6957–6975. doi:10.1016/j.atmosenv.2005.04.027
Guenther, A., Harley, P., Wiedinmyer, C., Palmer, P. I., and Geron, C. (2006). Estimates of global terrestrial isoprene emissions using MEGAN (model of emissions of Gases and aerosols from nature). Atmos. Chem. Phys. 6, 3181–3210. doi:10.5194/acp-6-3181-2006
Hocking, W. K., Carey-Smith, T., Tarasick, D. W., Argall, P. S., Strong, K., Rochon, Y., et al. (2007). Detection of stratospheric ozone intrusions by windprofiler radars. Nature 450 (7167), 281–284. doi:10.1038/nature06312
Holton, J. R., Haynes, H., Mclntyre, P., R., Douglass, M., R., Rood, B. R., and Pfister, L. (1995). Stratosphere-troposphere exchange. Rev. Geophys. 33 (4), 403–439. doi:10.1029/95rg02097
Huang, S., Huang, P.-R., Newman, S., Li, K.-F., Lin, Y.-C., Huh, C.-A., et al. (2022). Enhanced stratospheric intrusion at Lulin Mountain, Taiwan inferred from beryllium-7 activity. Atmos. Environ. 268, 118824. doi:10.1016/j.atmosenv.2021.118824
Jr, W. I. G., and Yu, S. (2012). Generalized approach for using unbiased symmetric metrics with negative values: Normalized mean bias factor and normalized mean absolute error factor. Atmos. Sci. Lett. 13 (4), 262–267. doi:10.1002/asl.393
Karlický, J., Huszár, P., and Halenka, T. (2017). Validation of gas phase chemistry in the WRF-Chem model over Europe. Adv. Sci. Res. 14, 181–186. doi:10.5194/asr-14-181-2017
Knowland, K. E., Ott, L. E., Duncan, B. N., and Wargan, K. (2017). Stratospheric intrusion-influenced ozone air quality exceedances investigated in the NASA MERRA-2 Reanalysis. Geophys Res. Lett. 44 (20), 10691–10701. doi:10.1002/2017gl074532
Lamarque, J. F., Emmons, L. K., Hess, P. G., Kinnison, D. E., Tilmes, S., Vitt, F., et al. (2012). CAM-Chem: Description and evaluation of interactive atmospheric chemistry in the community earth system model. Geosci. Model. Dev. 5 (2), 369–411. doi:10.5194/gmd-5-369-2012
Langford, A. O., Masters, C. D., Proffitt, M. H., Hsie, E.-Y., and Tuck, A. F. (1996). Ozone measurements in a tropopause fold associated with a cut-off low system. Geophys. Res. Lett. 23 (18), 2501–2504. doi:10.1029/96GL02227
Lelieveld, J., Evans, J. S., Fnais, M., Giannadaki, D., and Pozzer, A. (2015). The contribution of outdoor air pollution sources to premature mortality on a global scale. Nature 525 (7569), 367–371. doi:10.1038/nature15371
Li, D., Bian, J., and Fan, Q. (2015). A deep stratospheric intrusion associated with an intense cut-off low event over East Asia. Sci. China Earth Sci. 58 (1), 116–128. doi:10.1007/s11430-014-4977-2
Li, K., Jacob, D. J., Liao, H., Shen, L., Zhang, Q., and Bates, K. H. (2019a). Anthropogenic drivers of 2013-2017 trends in summer surface ozone in China. PNAS 116 (2), 422–427. doi:10.1073/pnas.1812168116
Li, K., Jacob, D. J., Liao, H., Zhu, J., Shah, V., Shen, L., et al. (2019b). A two-pollutant strategy for improving ozone and particulate air quality in China. Nat. Geosci. 12 (11), 906–910. doi:10.1038/s41561-019-0464-x
Li, K., Jacob, D. J., Shen, L., Lu, X., De Smedt, I., and Liao, H. (2020). Increases in surface ozone pollution in China from 2013 to 2019: Anthropogenic and meteorological influences. Atmos. Chem. Phys. 20 (19), 11423–11433. doi:10.5194/acp-20-11423-2020
Li, M., Zhang, Q., Kurokawa, J.-i., Woo, J.-H., He, K., Lu, Z., et al. (2017). Mix: A mosaic asian anthropogenic emission inventory under the international collaboration framework of the MICS-asia and HTAP. Atmos. Chem. Phys. 17 (2), 935–963. doi:10.5194/acp-17-935-2017
Lin, M., Fiore, A. M., Horowitz, L. W., Langford, A. O., Oltmans, S. J., Tarasick, D., et al. (2015). Climate variability modulates Western US ozone air quality in spring via deep stratospheric intrusions. Nat. Commun. 6, 7105. doi:10.1038/ncomms8105
Meng, K., Zhao, T., Xu, X., Zhang, Z., Bai, Y., Hu, Y., et al. (2022). Influence of stratosphere-to-troposphere transport on summertime surface O3 changes in North China Plain in 2019. Atmos. Res. 276, 106271. doi:10.1016/j.atmosres.2022.106271
Mills, G., Sharps, K., Simpson, D., Pleijel, H., Broberg, M., Uddling, J., et al. (2018). Ozone pollution will compromise efforts to increase global wheat production. Glob. Change Biol. 24 (8), 3560–3574. doi:10.1111/gcb.14157
Ni, Z.-Z., Luo, K., Gao, X., Gao, Y., Fan, J.-R., Fu, J. S., et al. (2019). Exploring the stratospheric source of ozone pollution over China during the 2016 Group of Twenty summit. Atmos. Pollut. Res. 10 (4), 1267–1275. doi:10.1016/j.apr.2019.02.010
Nieto, R., Gimeno, L., de la Torre, L., Ribera, P., Gallego, D., García-Herrera, R., et al. (2005). Climatological features of cutoff low systems in the northern hemisphere. J. Clim. 18 (16), 3085–3103. doi:10.1175/jcli3386.1
Ou-Yang, H., Chen, L., Liao, H., Zhu, J., Wang, W., and Li, X. (2022). Impacts of aerosol–photolysis interaction and aerosol–radiation feedback on surface-layer ozone in North China during multi-pollutant air pollution episodes. Atmos. Chem. Phys. 22 (6), 4101–4116. doi:10.5194/acp-22-4101-2022
Qian, J., Liao, H., Yang, Y., Li, K., Chen, L., and Zhu, J. (2022). Meteorological influences on daily variation and trend of summertime surface ozone over years of 2015-2020: Quantification for cities in the Yangtze River Delta. Sci. Total Environ. 834, 155107. doi:10.1016/j.scitotenv.2022.155107
Stohl, A., Bonasoni, P., Cristofanelli, P., Collins, W., Feichter, J., Frank, A., et al. (2003a). Stratosphere-troposphere exchange: A review, and what we have learned from staccato. J. Geophys. Res. Atmos. 108 (D12), 8516. doi:10.1029/2002JD002490
Stohl, A., Bonasoni, P., Cristofanelli, P., Collins, W., Feichter, J., Frank, A., et al. (2003b). Stratosphere-troposphere exchange: A review, and what we have learned from staccato. J. Geophys. Res. 108 (D12), 8516. doi:10.1029/2002jd002490
Tang, K., Zhang, H., Feng, W., Liao, H., Hu, J., and Li, N. (2022). Increasing but variable trend of surface ozone in the yangtze river delta region of China. Front. Environ. Sci. 10. doi:10.3389/fenvs.2022.836191
Wang, H., Wang, W., Huang, X., and Ding, A. (2020a). Impacts of stratosphere-to-troposphere-transport on summertime surface ozone over eastern China. Sci. Bull. 65 (4), 276–279. doi:10.1016/j.scib.2019.11.017
Wang, T., Xue, L., Brimblecombe, P., Lam, Y. F., Li, L., and Zhang, L. (2017). Ozone pollution in China: A review of concentrations, meteorological influences, chemical precursors, and effects. Sci. Total Environ. 575, 1582–1596. doi:10.1016/j.scitotenv.2016.10.081
Wang, X., Wu, Y., Randel, W., and Tilmes, S. (2020b). Stratospheric contribution to the summertime high surface ozone events over the Western United States. Environ. Res. Lett. 15 (10), 1040a6. doi:10.1088/1748-9326/abba53
Wiedinmyer, C., Akagi, S. K., Yokelson, R. J., Emmons, L. K., Al-Saadi, J. A., Orlando, J. J., et al. (2011). The Fire INventory from NCAR (FINN): A high resolution global model to estimate the emissions from open burning. Geosci. Model. Dev. 4 (3), 625–641. doi:10.5194/gmd-4-625-2011
Xu, X., Lin, W., Xu, W., Jin, J., Wang, Y., Zhang, G., et al. (2020). Long-term changes of regional ozone in China: Implications for human health and ecosystem impacts. Elementa-Science Of Anthropocene 8. doi:10.1525/elementa.409
Yahya, K., Wang, K., Gudoshava, M., Glotfelty, T., and Zhang, Y. (2015). Application of WRF/chem over North America under the AQMEII phase 2: Part I. Comprehensive evaluation of 2006 simulation. Atmos. Environ. 115, 733–755. doi:10.1016/j.atmosenv.2014.08.063
Žabkar, R., Rakovec, J., and Koračin, D. (2011). The roles of regional accumulation and advection of ozone during high ozone episodes in Slovenia: A WRF/chem modelling study. Atmos. Environ. 45 (5), 1192–1202. doi:10.1016/j.atmosenv.2010.08.021
Zaveri, R. A., Easter, R. C., Fast, J. D., and Peters, L. K. (2008). Model for simulating aerosol Interactions and chemistry (MOSAIC). J. Geophys. Res. 113 (D13), D13204. doi:10.1029/2007jd008782
Zhai, S., Jacob, D. J., Wang, X., Shen, L., Li, K., Zhang, Y., et al. (2019). Fine particulate matter (PM2.5) trends in China, 2013–2018: Separating contributions from anthropogenic emissions and meteorology. Atmos. Chem. Phys. 19 (16), 11031–11041. doi:10.5194/acp-19-11031-2019
Zhang, B., Wang, Y., and Hao, J. (2015). Simulating aerosol–radiation–cloud feedbacks on meteorology and air quality over eastern China under severe haze conditionsin winter. Atmos. Chem. Phys. 15 (5), 2387–2404. doi:10.5194/acp-15-2387-2015
Zhang, Y., Li, J., Yang, W., Du, H., Tang, X., Ye, Q., et al. (2022). Influences of stratospheric intrusions to high summer surface ozone over a heavily industrialized region in northern China. Environ. Res. Lett. 17 (9), 094023. doi:10.1088/1748-9326/ac8b24
Zhao, K., Hu, C., Yuan, Z., Xu, D., Zhang, S., Luo, H., et al. (2021a). A modeling study of the impact of stratospheric intrusion on ozone enhancement in the lower troposphere over the Hong Kong regions, China. Atmos. Res. 247, 105158. doi:10.1016/j.atmosres.2020.105158
Keywords: ozone, stratospheric intrusion, eastern China, IPR (integrated process rate), WRF-Chem
Citation: Chang F, Li J, Li N and Liao H (2023) Stratospheric intrusion may aggravate widespread ozone pollution through both vertical and horizontal advections in eastern China during summer. Front. Environ. Sci. 10:1115746. doi: 10.3389/fenvs.2022.1115746
Received: 04 December 2022; Accepted: 31 December 2022;
Published: 16 January 2023.
Edited by:
Guangxing Lin, Institute of Atmospheric Physics (CAS), ChinaCopyright © 2023 Chang, Li, Li and Liao. This is an open-access article distributed under the terms of the Creative Commons Attribution License (CC BY). The use, distribution or reproduction in other forums is permitted, provided the original author(s) and the copyright owner(s) are credited and that the original publication in this journal is cited, in accordance with accepted academic practice. No use, distribution or reproduction is permitted which does not comply with these terms.
*Correspondence: Nan Li, bGluYW5AbnVpc3QuZWR1LmNu; Hong Liao, aG9uZ2xpYW9AbnVpc3QuZWR1LmNu