 Rong Gao
 Danyue Zhao
 Ping Zhang1
 La Zhuo
94% of researchers rate our articles as excellent or good
Learn more about the work of our research integrity team to safeguard the quality of each article we publish.
Find out more
ORIGINAL RESEARCH article
Front. Environ. Sci. , 11 January 2023
Sec. Land Use Dynamics
Volume 10 - 2022 | https://doi.org/10.3389/fenvs.2022.1104797
The gray water footprint (GWF) can quantitatively evaluate the effect of non-point pollution on water quality in the context of water quantity. It is crucial to explore the driving forces behind the GWF to solve water quality problems. This study quantified the unit GWFs of grain crops and oil crops at the municipal scale in six provinces of western China over 2001–2018, then jointly applied the extended STIRPAT model and path analysis methods to analyze the climatic and socioeconomic driving forces of the GWF. Results show that the key driving forces affecting the GWF obtained by the two methods were consistent. Planting structure and population were the main factors increasing the total GWF, while crop yield was the largest factor inhibiting the unit GWF and demonstrates regional differences. However, when the indirect influence of the driving factor through other factors was large, some driving forces obtained by different methods were reversed. For example, the indirect impact of per capita cultivated land area on the total GWF in Inner Mongolia was large, resulting in a significant positive impact in path analysis and a slight negative impact in the STIRPAT model. To draw more comprehensive and referential conclusions, we suggest using multiple methods together to verify the driving forces and account for the regional differences.
At the global scale, farmland accounts for more than 70% of the total human water consumption (Foley et al., 2011; Hoekstra and Mekonnen 2012; FAO 2020). Population growth and economic development have led to increasing human demands for agricultural products. Growing more food by expanding farmland or allocating more water is not a viable option for feeding a growing global population (Foley et al., 2019). To overcome the constraints of limited water and soil resources, chemical fertilizer can be applied to increase the yield per unit area of crops (Mekonnen and Hoekstra 2015; Zhang et al., 2015; Guo et al., 2019), which is an effective way to meet the increased demand for food. However, the leaching of chemical fertilizers in agricultural production causes serious non-point source pollution, which not only destroys the ecological security of farmland (Li et al., 2022), but also disturbs the global nitrogen and phosphorus cycle, which is the main source of water pollution (Foley et al., 2011). Nitrogen N) and phosphate P) are two kinds of fertilizers commonly used in agricultural production, and the diffusion pollution of N and P affects the quality of water resources. The gradual deterioration of water quality reduces the amount of useable water and exacerbates the global water crisis (Mateo-Sagasta et al., 2017). Understanding the impact of poor water quality has become an indispensable part of solving the global water crisis. The water footprint (WF) was proposed by Arjen Y. Hoekstra in 2002 (Hoekstra 2003); the gray water footprint (GWF) is an important part of the WF indexes. The GWF is defined as the volume of freshwater required to absorb and assimilate the pollutant load based on the natural background concentration and existing ambient water quality standards (Hoekstra et al., 2011) and acts as an indicator for measuring the severity of water pollution. The GWF is used to reflect water pollution caused by production and life activities and has good application prospects in water pollution assessment, water resource efficiency assessment and water resource carrying capacity (Boazar et al., 2019; Aldaya et al., 2020; Ansorge et al., 2020; Chen et al., 2021). The GWF can connect water, crop production and the environment, realize the comprehensive evaluation of water shortages and water pollution in crop production processes, and enhance the comparability of water consumption and water pollution (Wan et al., 2016). Globally, 75% of N-related GWF (Mekonnen and Hoekstra 2015; Muratoglu 2020) and 38% of P-related GWF come from agriculture (Mekonnen and Hoekstra 2018).
In recent years, studies on GWF have increased. At present, the research on GWFs mainly focuses on the quantitative calculation of the water pollution degree of products or regions at different spatial scales. The size, intensity and distribution of GWFs are determined by the combined effects of climatic conditions, crop types, and farmland management methods (Mekonnen et al., 2016; Chukalla et al., 2018; De Girolamo et al., 2019; Muratoglu 2020) and are also closely related to social and economic factors. Therefore, it is of great significance to analyze the driving forces affecting the size and distribution of GWFs to solve water shortages and improve the sustainable utilization of regional water resources. Therefore, the driving force analysis of regional GWFs has become a popular topic of research. Based on the distribution of the study areas, China is the key area of these studies. The main research methods are structural decomposition analysis (SDA) (Wan et al., 2016; Liao et al., 2021), logarithmic-mean divisia index (LMDI) exponential decomposition (Li et al., 2017; Wang et al., 2019; Zhang et al., 2019; Cao et al., 2020; Cui et al., 2020; Su et al., 2020; Feng et al., 2021; Fu et al., 2021; Chen et al., 2022) and stochastic impacts by regression on population, affluence, and technology (STIRPAT) (Jin et al., 2016; Fan and Fang 2020; Zhang et al., 2020) (see Table 1). The SDA method is based on an input–output model and requires input–output coefficients and final demand for each sector (Su and Ang 2012; Wang et al., 2013; Jin et al., 2016); however, the LMDI method has no residual term (Ang 2005). The LMDI cannot examine the elasticity of each factor, which refers to the change in the dependent variable due to a change in an independent variable, while other factors remain constant (Huang et al., 2021). Compared with other methods, the STIRPAT model is more flexible and easier to operate, clarifying the mathematical relationship between driving forces and their effects (Wang et al., 2013; Jin et al., 2016). Path analysis (Wright 1934) was developed in the 1920s to analyze multiple causality (Petraitis et al., 1996), which can reveal the effect of multiple independent variables on dependent variables (Mao et al., 2021). The method decomposes the correlation coefficient into the direct path coefficient, indirect path coefficient and total correlation coefficient to represent the direct, indirect, and comprehensive influences of independent variables on dependent variables, respectively. Path analysis also provides an efficient method for finding interrelationships between independent variables (Brunn et al., 2020; Li et al., 2020). The significance of path analysis is that it not only reveals the direct and indirect effects of multiple independent variables on the dependent variable, but also obtains the best path for the independent variable to determine the dependent variable, which is helpful in decision-making.
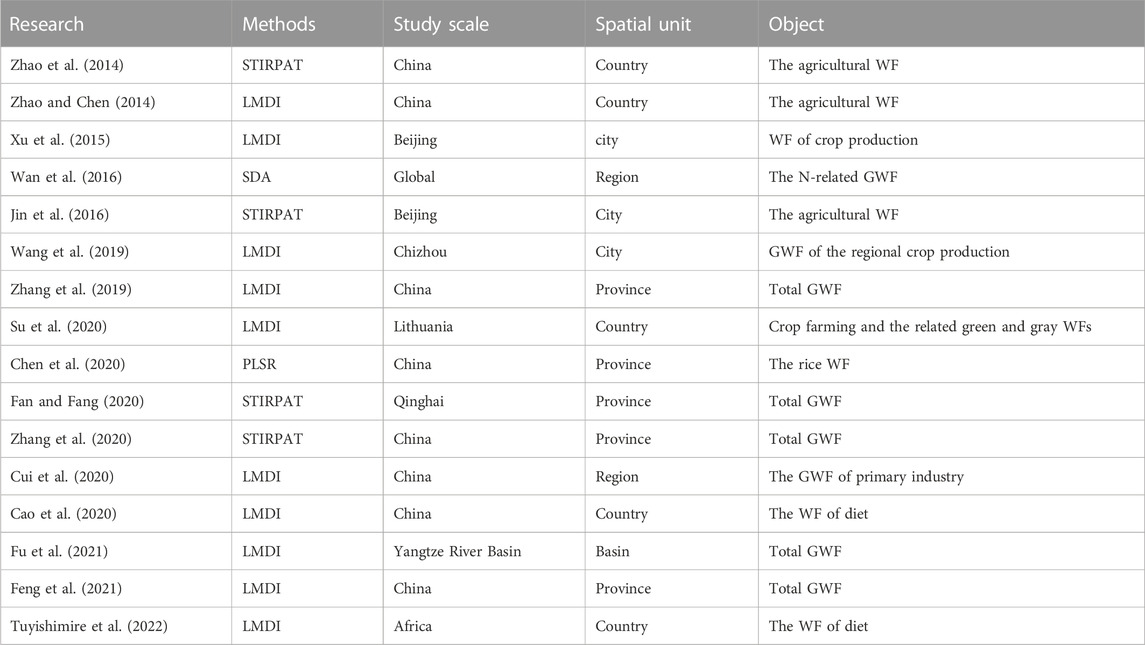
TABLE 1. Summary of representative literature on the driving forces of the gray water footprint.
There have been published studies which analyzed the driving forces of agricultural WF, including GWF, at intra-national scale for China. Jin et al. (2016) conducted a quantitative analysis of the WF of the agricultural sector in Beijing and concluded that the Engel coefficient and level of urbanization had the greatest positive effect on the growth of Beijing’s agricultural WF and that total rural electricity, population and per capita GDP can reduce the agricultural WF. Cui et al. (2020) divided China into eight economic regions to explore the driving forces of the GWF of the primary industry, indicating that economic scale, industrial structure, and population are the main driving factors and have spatial heterogeneity. Zhao et al. (2014) and Zhao and Chen (2014) analyzed the driving forces of the WF of the agricultural sector in China using the STIRPAT model and the LMDI method, respectively; both studies indicated that the economic development level, population, and dietary structure were the main contributing factors, but the effect of the two methods was different. Although there are some studies analyzing the driving forces of GWFs, most of these studies ignore spatial differences in driving forces; furthermore, a variety of research methods coexist. The differences in method conclusions have caused obstacles for implementing practical implementations of GWFs to solve agricultural water pollution problems.
This study quantifies the unit GWF of grain crops and oil crops and the total GWF of regional crop production related to N and P at the municipal scale in six western provinces of China (Shaanxi, Gansu, Qinghai, Ningxia, Xinjiang and Inner Mongolia) (Figure 1). The crop types considered, including wheat, corn, cotton, potatoes, vegetables, oilseeds, melons and fruits, cover 73% of the total cultivated land in the six provinces (CNKI, 2022). Grain crops dominates both the crop harvested area and production, whereas oil crops have higher values and contribute more to the economic benefits of the local agriculture. The STIRPAT model and path analysis method are jointly applied to accomplish the following: analyze the climatic and socioeconomic driving forces of the temporal and spatial evolution of N- and P-related GWFs; discuss the differences between the conclusions of these methods; propose more targeted and effective countermeasures to protect farmland ecological environments; promote the effective management of water resources; provide theoretical support for the realization of regional agricultural sustainable development; and provide methodological suggestions to analyze the driving force of GWFs.
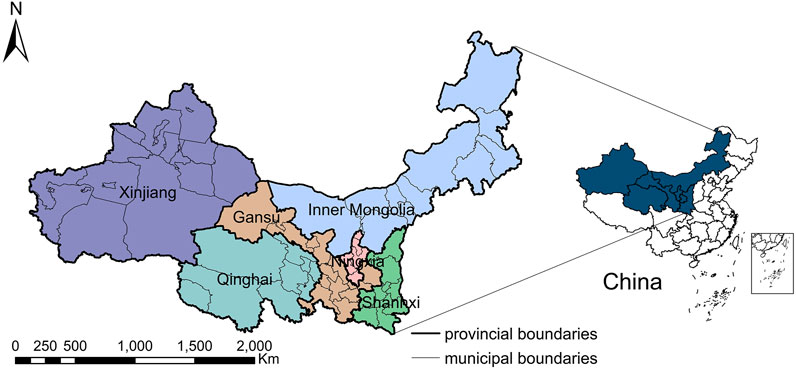
FIGURE 1. Study area.
In recent decades, the agricultural production model of “high-input, high-yield” has been adopted and promoted in many areas of China. Specifically, in six western provinces, the average yield of grain crops and oil crops increased by 1.91 and 1.90 times, respectively, with 1.61-fold total N fertilizer application and 2.03-fold total P fertilizer inputs over the period 2001–2018 (CNKI, 2022). Excessive fertilization has aggravated agricultural non-point source pollution, and environmental problems brought by China’s agricultural development have become increasingly prominent (Wu and Ge 2019). The annual consumption of fertilizers per hectare of arable land in China is four times the global limit, making it the world’s largest fertilizer consumer (Liu et al., 2021). In Northwest China, agriculture is still the main industry, and due to the shortage of water resources and low ecological efficiency, it is a key area targeted for agricultural pollution control and prevention (Wang and Lin 2021). The cultivated land area of the six western provinces is 22.2% of China, but the total amount of water resources accounts for only 10% of the national total water resources, and agricultural water accounts for 80% of the total local water withdrawal (Ministry of Water Resources of the People’s Republic of China, 2019; CNKI 2022). Meanwhile, the level of social and economic development in the six western provinces is not high, the ecological environment is fragile, and ecological environment damage caused by extensive and inefficient production methods is increasingly obvious (Chen et al., 2021). Since China began to implement the strategy of “Western Development” in 2000, the rapid economic development in western China has led to increasingly prominent water pollution problems, and the center of China’s GWF has tended to move westward (Lin et al., 2019).
Based on the GWF standard calculation framework of the International Water Footprint Network (Hoekstra et al., 2011), the GWF at the municipal scale of six western provinces from 2001 to 2018 was quantified. The unit GWF (m3/t) of the growth process of crops is calculated as follows:
where
According to guidelines for the use and protection of surface water in China, referring to Zhuo et al. (2016), the class III water standard in the “China Surface Water Environmental Quality Standard” (MEP 2002) is mainly applicable to the secondary protection areas of surface water sources used for centralized domestic and drinking water. The maximum allowable concentrations of N and P are 1 mg/L and 0.2 mg/L, respectively; the natural background concentrations of N and P are 0.2 mg/L and 0.02 mg/L, respectively.
The amount of fertilizer applied in each city is determined according to the proportion of the sown area in each city and then allocated based on the crop fertilizer allocation method (Wang et al., 2013). It is allocated to each crop according to the crop planting situation in the study area. The formula is as follows:
where
The STIRPAT model and path analysis method were combined to analyze the main driving forces of crop production GWF related to N and P in these provinces.
The STIRPAT model is a stochastic model transformed from the classic IPAT equation by York et al. (2003), which overcomes the limitations of the original model. Its form is usually as follows:
where I, P, A and T refer to environmental impact, population, affluence and technology, respectively; a is the model coefficient; b, c, and d are the index of each factor; and e is the error term. When a = b = c = d = e = 1, the STIRPAT model is the IPAT identity. The above formula is usually converted to logarithmic form:
where a and e are
The extended STIRPAT model can add other driving forces based on the above model to analyze their impacts on the environment. To fully reflect the driving forces of the GWF, we extend the STIRPAT model. According to the previous regression results, eight main effect variables are introduced into the model; these variables are selected based on the results of stepwise regression. The extended STIRPAT model is as follows (see Table 2):
where
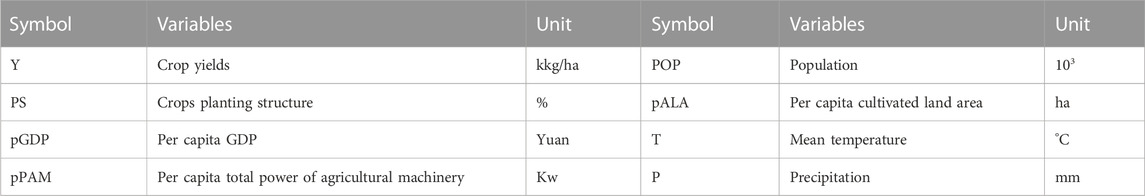
TABLE 2. Dependent and independent variables used in this study.
Regression requires multicollinearity diagnosis of independent variables, which can be tested by the variance inflation factor (VIF). Generally, if the VIF exceeds 10, the regression model has severe multicollinearity (Freund et al., 2006). The VIFs of all variables were less than the threshold of 10, and there was no clear multicollinearity in this study.
Path analysis is applied as well to determine the main factors that affect the GWF of crop production. To compare the differences between the results of the two methods, path analysis is still carried out using the aforementioned eight factors. That is, crop yield (kg/ha), crop planting structure (%), per capita GDP (Yuan), per capita total power of agricultural machinery (Kw), total population (103), per capita cultivated land area (ha), mean temperature (°C), and precipitation (mm) are independent variables, and the unit GWF of grain crops and oil crops and the total GWF of each region are dependent variables.
The path coefficient is obtained by solving the following equation:
where
The amount of N and P fertilizers applied, sown area, crop yield, cultivated land area, GDP, population, and total power of agricultural machinery were taken from the statistical yearbooks and statistical bulletins of each province and city (CNKI, 2022). To eliminate the effect of price changes and ensure comparability, data on the variable related to the economy, namely, per capita GDP, were converted to constant prices for 2001. The precipitation and mean temperature were derived from the National Meteorological Science Data Center, and the meteorological data of each city was the average of all stations or adjacent stations in each city. The amount of per unit N and P applied to each crop was obtained from the National Agricultural Product Cost-benefit Data Collection for 2001–2018 (Department of Price et al., 2019). Amounts for the crops not mentioned were determined by referring to the literature and taking the average of amounts noted in several articles.
The N and P leaching rate data on in the six western provinces were calculated, sorted, and summarized based on published local measurements (Table 3) (Mei 1991; Lv et al., 1998; Ye et al., 2004; An and Sun 2009; Liu et al., 2012; Yang et al., 2013; Ding 2015; Liu et al., 2016; Li et al., 2017; Chang et al., 2018; Liu 2018; Qi et al., 2020; Wang et al., 2021).
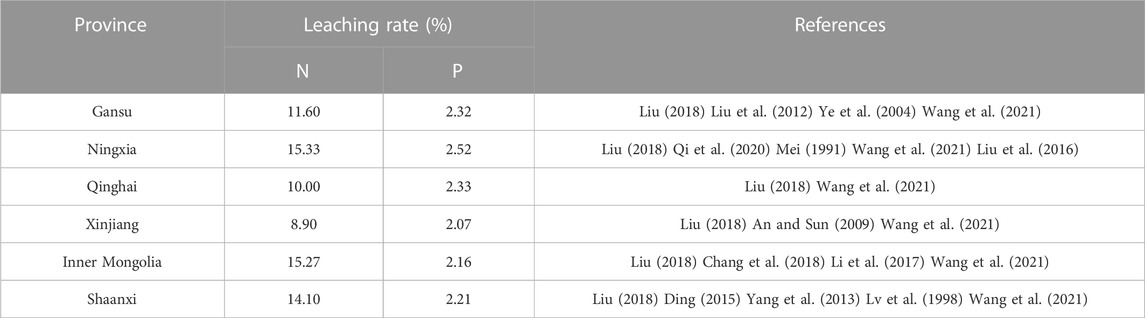
TABLE 3. Leaching rates of N and P in six provinces in western China.
As shown in Figure 2, from 2001 to 2018, the total GWF related to N and P in the six western provinces showed a fluctuating upward trend, increasing by 55% and 98%, respectively, over 18 years but declining after 2015. This was related to the country’s implementation of the “double reduction” policy in 2015. N was the main source of pollution, and the P-related GWF of crop production was much smaller than the N-related GWF; it was approximately 33% of the N-related GWF (2018). Wheat, corn, cotton, vegetables, oilseeds, melons and fruits were the main components of the N- and P-related total GWF, accounting for 72% and 81%, respectively, due to the larger sown areas of these crops. Among them, the total GWF of maize and cotton showed an upward trend due to the large increase in sown area, while the increase in the amount of fertilization was the direct reason for the increase in the total GWF of wheat production.
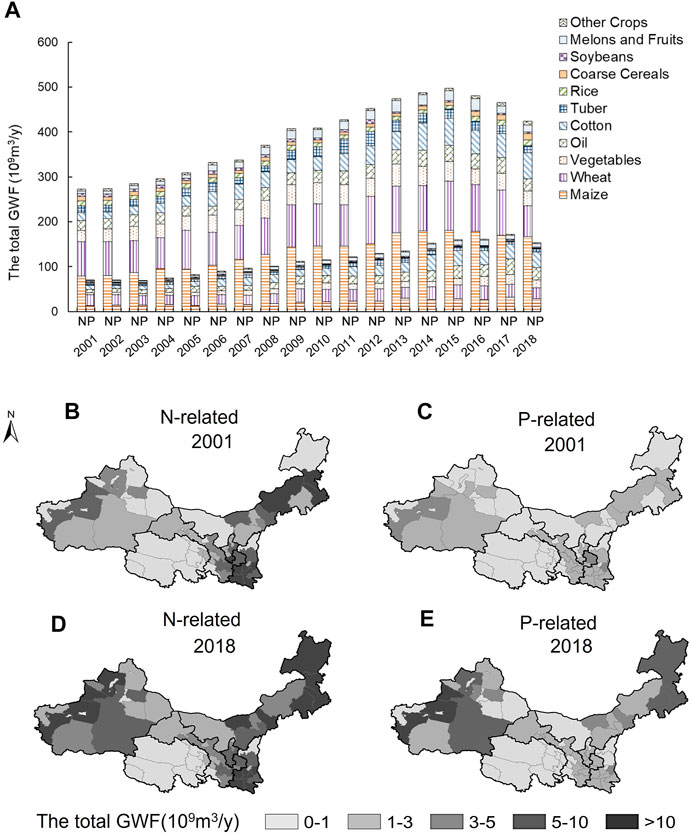
FIGURE 2. Spatiotemporal evolution of N- and P-related GWF in West China. (A) The interannual variation in the total GWF of crop production from 2001 to 2018; (B–E) the spatial distribution map of the total GWF of crop production in 2001 and 2018.
Higher values of total GWF related to N appeared in eastern Inner Mongolia, western Xinjiang, and southern Shaanxi, showing an overall increasing trend during the study period; total GWF in a few cities decreased due to the reduction in fertilizer application or sown area. During the study period, the P-related total GWF of crop production showed an upward trend. In 2018, higher values appeared in western Xinjiang and eastern Inner Mongolia, of which the increase was more obvious in most areas of eastern Inner Mongolia, which experienced an exponential increase in fertilizer application. In central and southern Shaanxi, the N-related total GWF was higher, but the P-related GWF was only 14.66% of that related to N, indicating that N fertilizer was mainly applied in most areas of Shaanxi. The largest intra-provincial difference was in Inner Mongolia. Due to the differences in the crop sowing area, main planting crops and agricultural development level among prefecture-level cities, there were differences in the GWF within the province.
Grain crops were the main source of food and the dominant crop overall. In 2018, grain crops in the six western provinces accounted for 64% of the total sown area and 63% of the total crop yield (CNKI 2022); grain was an indispensable part of the crop composition in six western provinces. At the same time, among economic crops, oil crops account for the largest proportion of the sown area in the six western provinces. Taking grain crops and oil crops as examples, this paper analyzes the temporal and spatial evolution characteristics of the unit GWF.
Figure 3 shows the temporal and spatial evolution of the unit GWF of grain crops and oil crops related to N and P in the six western provinces. During the study period, the main pollution source of grain crops dominated by chemical fertilizer was N, and the multiyear average unit GWF related to N was 5,243 m3/t, which was 4.4 times that of the P-related unit GWF. The unit GWF of grain crops related to N and P showed a downward trend; the reason for the decline was the increase in grain yield caused by the improvement in agricultural technology and agricultural production efficiency. The multiyear averages of the unit GWF of oil crops related to N and P were 8,181 m3/t and 4,924 m3/t, respectively. The unit GWF of oil crops related to N fluctuated and decreased, but the unit GWF of oil crops related to P showed an upward trend. The main pollution source of the unit GWF of oil crops dominated by chemical fertilizer gradually changed from N to P. The unit GWF of oil crops was higher than that of grain crops. The reason for this result was that oil crops had higher economic benefits, and the amount of fertilizer application per unit area was higher than that of grain crops, resulting in a larger unit GWF of oil crops.
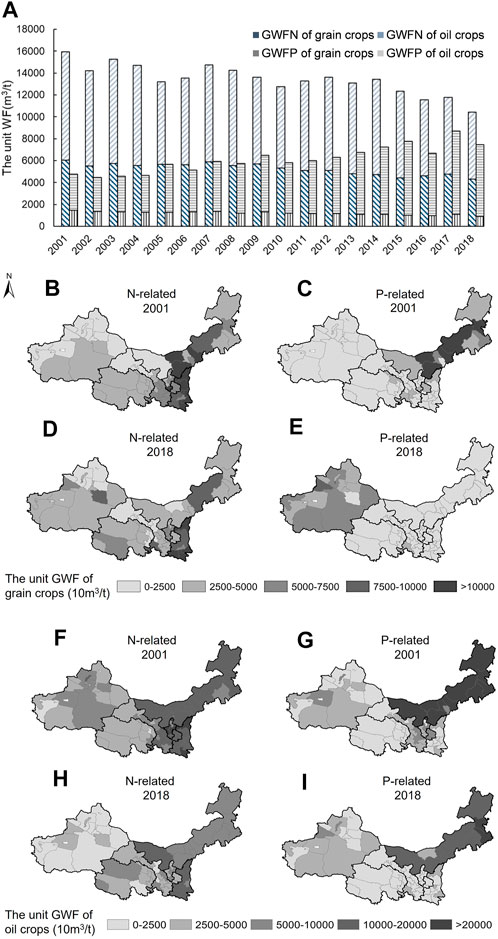
FIGURE 3. Spatiotemporal evolution of N- and P-related unit GWF in West China. (A) The interannual variation in the unit GWF of grain crops and oil crops from 2001 to 2018; (B–E) the spatial distribution of the unit GWF of grain crops in 2001 and 2018; (F–I) the spatial distribution of the unit GWF of oil crops in 2001 and 2018.
The higher levels of unit GWF of grain crops related to N mainly appeared in Shaanxi and central Inner Mongolia. The higher levels of unit GWF of grain crops related to P shifted from central Inner Mongolia to Xinjiang because of the decrease in P application in central Inner Mongolia and the increase in P application in most areas of Xinjiang. At the provincial scale, the difference in GWF related to N and P in Shaanxi was the largest, as a result of relatively high N application per unit area and medium P application per unit area in Shaanxi. The unit GWF of grain crops related to N and P in other provinces showed a downward trend except in Xinjiang. The increase in fertilizer application per unit area in Xinjiang led to the increase in the unit GWF of grain crops.
During the study period, the higher unit GWF related to the N of oil crops appeared in the eastern part of the six western provinces, namely, Shaanxi, Inner Mongolia and Ningxia. Most cities showed a downward trend, but the trend increased in Haixi, Qinghai Province, due to the adjustment of the internal planting structure. The higher level related to P was mainly concentrated in Inner Mongolia and showed an increasing trend, due to the increase in the amount of P applied per unit area and the sown area of oil crops in Inner Mongolia. Compared with grain crops, the regions with higher unit GWF values of oil crops were more concentrated because the planting area of oil crops varied greatly in different regions. Moreover, the spatial difference in the unit GWF of oil crops was even greater, possibly because oil crops were the main economic crops, and the sown area and fertilization amount per unit area were affected by agricultural development policy, agricultural technology level, climatic conditions and other factors.
Figure 4 shows the driving forces of the total GWF of crop production in the six western provinces. The results show that planting structure, population and per capita total power of agricultural machinery were the main factors increasing the total GWF, and the increase in grain demand caused by population growth was accompanied by an increase in the total GWF of crop production. In Ningxia and Shaanxi, planting structure was the strongest promoting factor, resulting in every 1% increase in the proportion of the sown area of each crop from 2001 to 2018, with an average increase of 0.68% and 0.54% and 0.68% and 0.57%, respectively, in the total GWF of crop production related to N and P. The effect of planting structure mainly came from cotton, melons, fruits, and potatoes. At the same time, the effects of various driving forces showed regional differences. For Ningxia, the per capita cultivated land area also showed a relatively significant positive effect. When the per capita cultivated land area increased by 1%, the total GWF of crop production related to N and P in Ningxia increased by 0.37% and 0.35% on average, respectively. The per capita cultivated land area and per capita total power of agricultural machinery reflected regional agricultural production conditions to a certain extent. The increase in agricultural production input and expansion of the agricultural production scale will have a positive impact on the GWF of crop production. Per capita GDP had a negative driving effect except in Inner Mongolia, reducing the total GWF of crop production related to N by 0.17% and 0.24% on average in Ningxia and Shaanxi, respectively. The negative effect on the total GWF of crop production related to P was most obvious in Qinghai and Ningxia, but it is worth noting that per capita GDP had a positive effect on the total GWF of potato production in Ningxia; for every 1% increase in per capita GDP, the GWF of potato production related to N and P in Ningxia increased by 0.26% and 0.39%, respectively. The growth of per capita GDP led to an increase in the demand for agricultural products, resulting in an increase in the GWF. At the same time, the growth of per capita GDP improved the level of agricultural technology and management, reduced the unit GWF of crop production, and even exceeded the total GWF of crop production brought by an increase in crop yield designed to reduce the GWF. In recent years, potato planting has been gradually industrialized in Ningxia, and the yield and price have continuously increased, which has stimulated farmers to plant more potatoes. The increase in potato planting area and chemical fertilizer input led to an increase in the total GWF of potato crop production in Ningxia. Meteorological factors (mean temperature and precipitation) had less effect, but mean temperature was the largest negative driving force in Inner Mongolia.
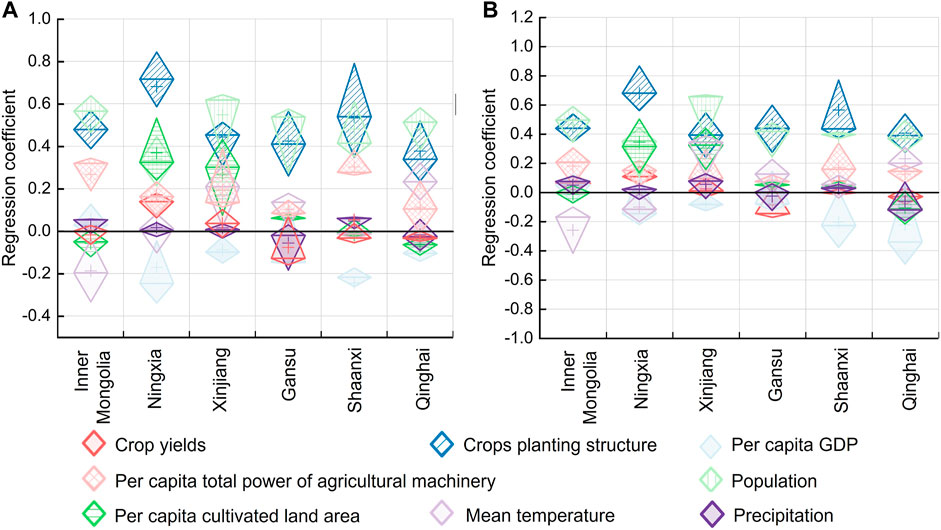
FIGURE 4. Boxplot of the driving force of the total GWF related to N (A) and P (B) in the six western provinces.
Figure 5 shows the impact of various driving forces on the unit GWF of crop production. The crop yield level played the largest role in reducing the unit GWF. For every 1% increase in the crop yield level, the unit GWF related to N and P decreased by 0.84% and 0.66% on average, respectively. Compared with crop yield levels, the effects of other driving forces were not as strong. Per capita GDP was the largest contributing factor to unit GWF related to N in Inner Mongolia and Qinghai. Every 1% increase in per capita GDP led to an average increase of 0.52% and 0.22% in unit GWF related to N in Inner Mongolia and Qinghai, respectively, which was related to the economic development stage and agricultural input emphasis of each province. Per capita GDP had a positive effect on unit GWF related to N in Inner Mongolia but a negative effect related to P because the growth trends of N and P application were different. Mean temperature was the main increasing factor for the unit GWF related to P in Xinjiang and Qinghai, and per capita total power of agricultural machinery was the main growth factor in Inner Mongolia and Shaanxi.
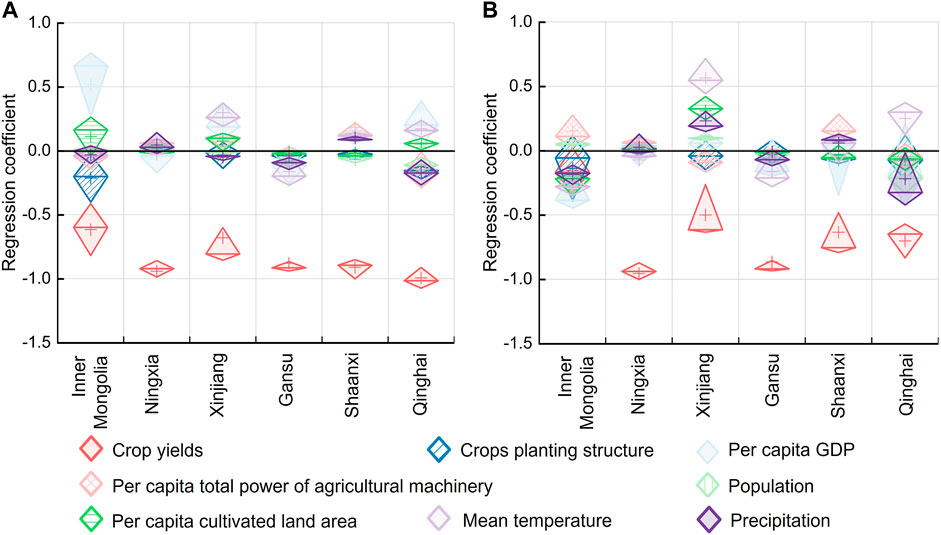
FIGURE 5. Boxplot of the driving force of the unit GWF related to N (A) and P (B) in six western provinces.
The total effect (see Supplementary Tables S1, S2) was expressed as the sum of the direct and indirect effects of factors on the dependent variable. From the perspective of the total effect, planting structure and population were the main promoting factors of the total GWF, and the total effect coefficients for planting structure and population related to N were 0.47 and 0.43, respectively, and to P were 0.44 and 0.41, respectively. At the same time, the positive effect of per capita cultivated land cannot be ignored. Meteorological factors had greater positive or negative effects in different provinces. For example, mean temperature showed the greatest inhibitory effect in Inner Mongolia and Ningxia, and precipitation was an important positive driving factor in Ningxia and Gansu. The negative effects of per capita GDP were stronger in Gansu and Ningxia than in other provinces.
Path analysis divided the influence of each factor into direct influence and indirect influence. Figure 6 shows the direct and indirect effects of various factors on the total GWF of grain crops and oil crops in the six western provinces. The direct path coefficient shows that population, per capita cultivated land area and planting structure had a positive effect on the total GWF of grain crops production, while per capita GDP had a negative effect on the total GWF of grains crop production related to P. There were also spatial differences in the main factors affecting the total GWF In Qinghai, mean temperature had the largest positive effect, but the main positive factor in Ningxia was per capita cultivated land area. The crop yield area and precipitation had indirect effects through other factors on the total GWF of grain crops related to N and P, but the direct effects were small. Population and planting had positive effects on the total GWF of oil crops production, consistent with grain crops, but the effect of planting structure was more prominent for oil crops. Per capita GDP had a negative effect on the total GWF of oil crops production, but the negative effect was inhibited by other factors in Ningxia and Gansu. Similarly, except for Qinghai, precipitation had a positive effect, but the positive effect was inhibited by other factors.
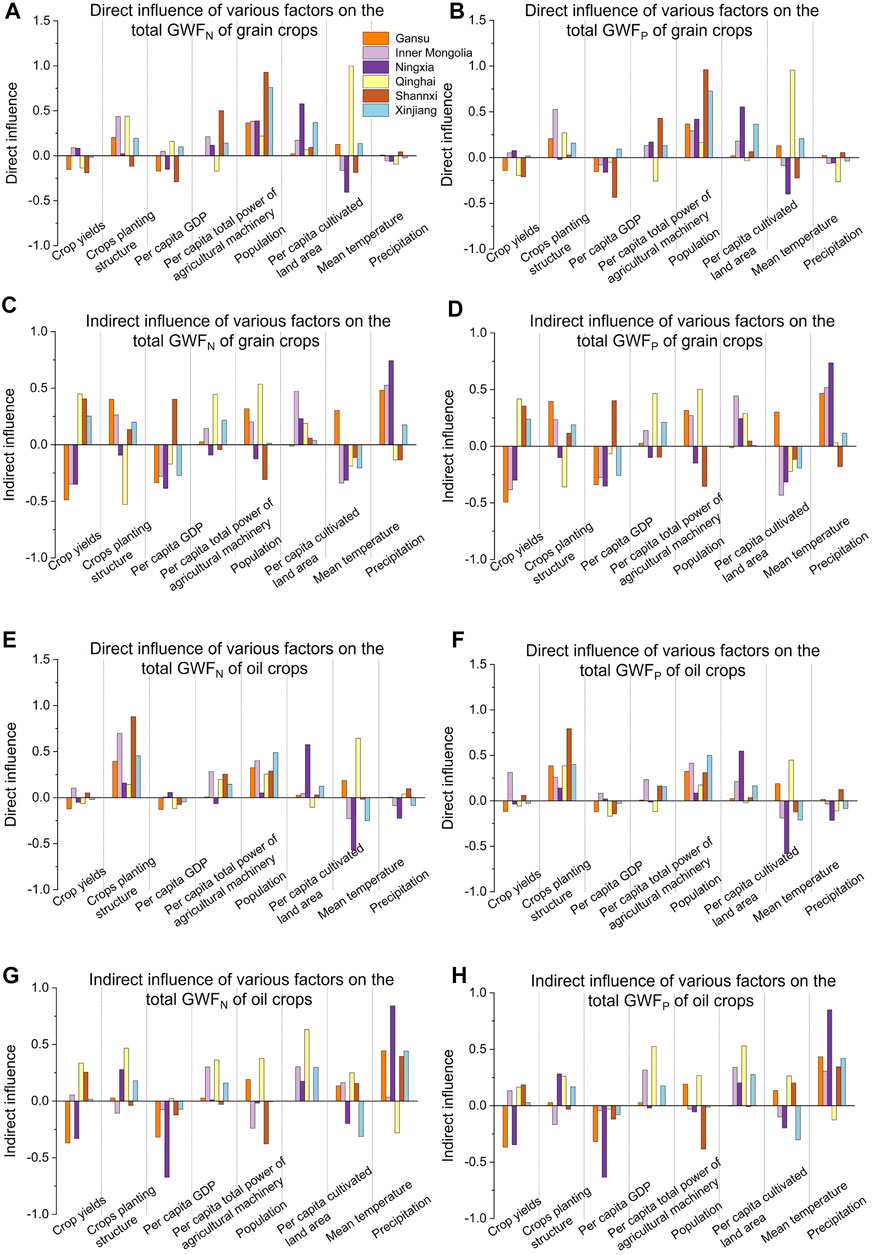
FIGURE 6. Direct and indirect effects of various factors on the total GWF of grain crops and oil crops in the six western provinces: (A,B) direct effects of various factors on the total GWF related to N (left) and P (right) of grain crops; (C,D) indirect effects of various factors on the total GWF related to N (left) and P (right) of grain crops; (E,F) direct effects of various factors on the total GWF related to N (left) and P (right) of oil crops; (G,H) indirect effects of various factors on the total GWF related to N (left) and P (right) of oil crops.
Figure 7 shows the degree of interactions between various factors for the total GWF of crop production. Meteorological factors mainly influenced the GWF of crop production through other factors, but indirect factors differed in each province. In Qinghai Province, other factors mainly affected the total GWF of grain crops and oil crops through mean temperature except per capita GDP, but the direction of the indirect effect of planting structure on the total GWF of the two crops through mean temperature was opposite. In Gansu Province, crop yield and per capita GDP negatively affected the total GWF of grain crops production mainly through the indirect effect of population, while the opposite was true in Shaanxi Province. Indirect negative effects of crop yield and per capita GDP through per capita cultivated land area and mean temperature on the total GWF of grain crops and oil crops production had same direction in Ningxia.
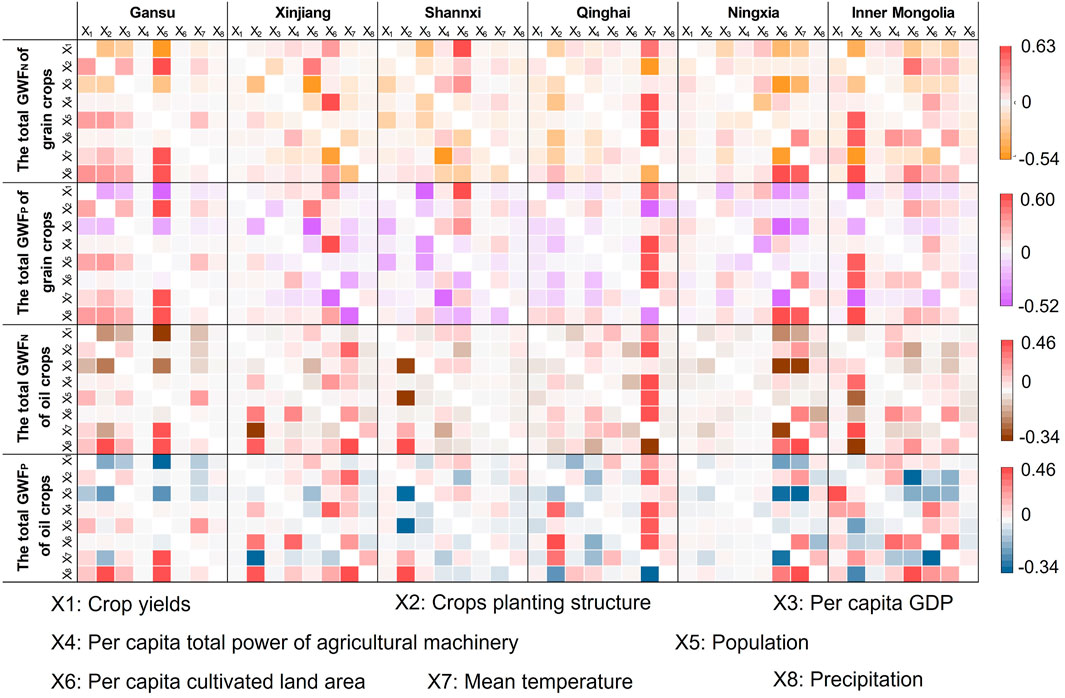
FIGURE 7. Indirect effects of various factors on the total GWF of grain crops and oil crops in the six western provinces.
In terms of unit GWF, from the perspective of the total effect (see Supplementary Tables S3, S4), except for the unit GWF related to P in Inner Mongolia, crop yield had the strongest negative effect. The main positive driving forces of each province were different. The per capita cultivated land area had the strongest positive driving effect in Ningxia, while planting structure had the strongest positive effect in Xinjiang. In addition, the positive effect of meteorological factors was more obvious in Gansu and Xinjiang. Per capita GDP was the second largest negative driving factor in Ningxia and Gansu, but it is worth noting that, in Inner Mongolia, per capita GDP had a strong positive effect on the GWF related to N but a negative effect on the GWF related to P.
Figure 8 shows the direct and indirect effects of various factors on the unit GWF of grain crops and oil crops in the six western provinces. The direct path coefficient shows that crop yield was the largest negative driving factor of the GWF of grain and oil crops in all the provinces except for Ningxia. The mean temperature had a significant negative effect on the unit GWF of grain crops in Ningxia, and the effect of planting structure on oil crops in Inner Mongolia was similar. Per capita GDP had a positive driving effect on the unit GWF of grain crops related to N, but it showed regional differences related to P. However, per capita GDP had a negative indirect impact on the unit GWF of grain crops related to N and P in different provinces. In Gansu, Qinghai and Shaanxi, the population had an indirect effect on the unit GWF, but the negative effect was suppressed by other factors. Precipitation had a negative effect on the unit GWF of grain crops, but it had a positive indirect effect through factors in Xinjiang. It is worth noting that almost all factors had a negative impact on the unit GWF of grain crops related to P in Ningxia. Similarly, per capita GDP positively drove the per unit GWF of oil crops related to N, of which per capita GDP was the largest positive driving factor in Qinghai, but there were regional differences in relation to P, and the direction of influence was the same as that related to N in Qinghai and Inner Mongolia, though the impact was small. In Inner Mongolia, planting structure had a significant negative effect on the unit GWF of oil crops and even had the largest negative drive for the P correlation. There were spatial differences in terms of key drivers of GWF in different provinces. The per capita total power of agricultural machinery had a positive effect in Inner Mongolia and Shaanxi, but the situation was reversed in Ningxia and Qinghai. The negative influencing factors of the unit GWF of oil crops related to P were per capita cultivated land area and mean temperature in Xinjiang. It is worth noting that the vast majority of factors had indirect effects, but the opposite was true for direct effects.
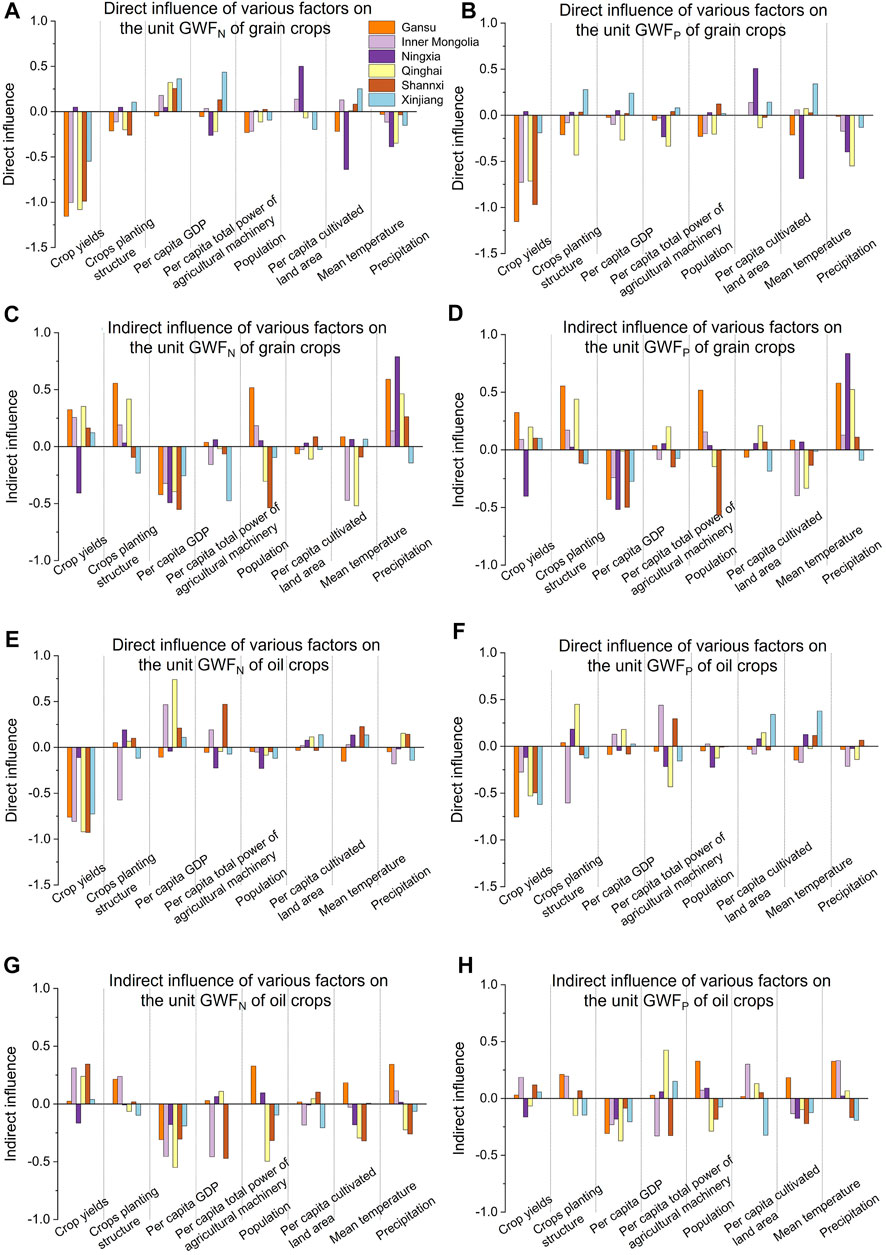
FIGURE 8. Direct and indirect effects of various factors on the unit GWF of grain crops and oil crops in the six western provinces: (A,B) direct effects of various factors on the unit GWF related to N (left) and P (right) of grain crops; (C,D) indirect effects of various factors on the unit GWF related to N (left) and P (right) of grain crops; (E,F) direct effects of various factors on the unit GWF related to N (left) and P (right) of oil crops; (G,H) indirect effects of various factors on the unit GWF related to N (left) and P (right) of oil crops.
The influence degree and direction of the interaction among factors for unit crop GWF were different among provinces as well as crops. Figure 9 shows the degree of interaction between various factors on the unit GWF of crop production. Except Ningxia, most factors in western provinces affected the unit GWF mainly through crop yield level, and the same crop in the same province had same impact direction. For example, all factors had the greatest indirect impact through the crop yield in Gansu; In Inner Mongolia, the planting structure had the largest positive driving effect on the unit GWF of grain crops through crop yield, but had a negative driving effect on the unit GWF of oil crops. Meteorological factors, which include mean temperature and rainfall, mainly affected the unit GWF through other factors, and the total indirect influence cannot be ignored. In Ningxia, rainfall had the largest indirect effect on the unit GWF grain and oil crops through mean temperature, but the impact of the two crop types was opposite.
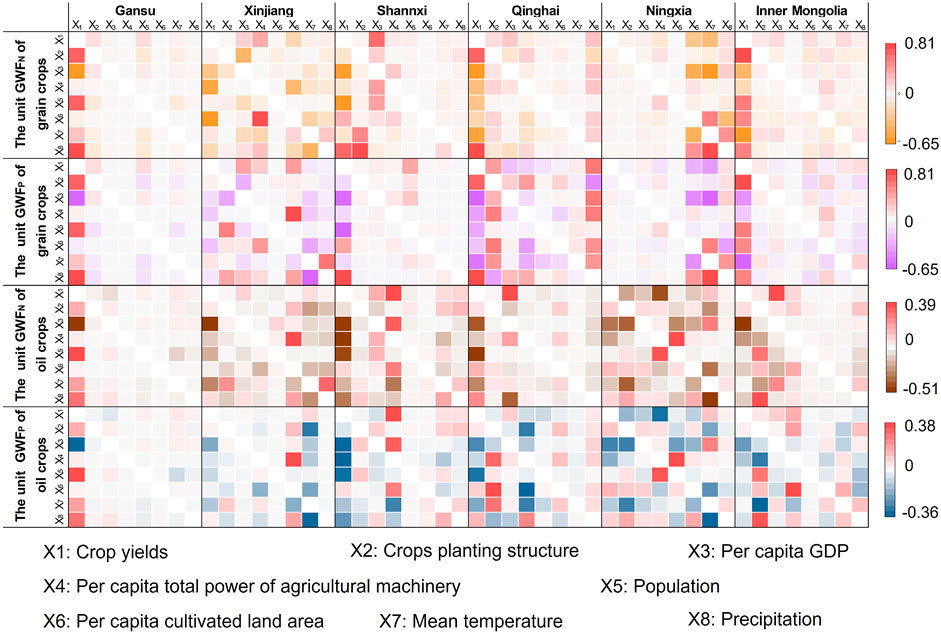
FIGURE 9. Indirect effects of various factors on the unit GWF of grain crops and oil crops in the six western provinces.
This study evaluated the driving forces behind the GWF of crop production in six western provincial regions from 2001 to 2018. Through the case study, based on the accounting of the GWF of crop production on the municipal scale, which considers the difference in leaching rate, two methods were used for the first time to reveal the regional driving forces of the GWF of crop production, allowing a more accurate conclusion to be drawn that can provide suggestions for applying the GWF to solve water pollution.
In terms of driving force analysis, we found that planting structure and population were the main factors that increase the total GWF, and crop yield was the largest inhibitory factor of unit GWF. Furthermore, the direction or intensity of the driving forces varied by region. Taking per capita GDP as an example, the impact of per capita GDP on GWF was positive or negative, which was related to the stage of economic development in each region and the crops, policies and agricultural input preferences of each region. The current results of path analysis show that per capita GDP played a promoting role on the increasing total GWF for vegetable production in Shaanxi province, through the indirect effects of 1.25 folded expansion in the planting area. The coefficient was 0.354 and 0.241 for GWF related to N and P, respectively (Figure 7). More vegetable production made more income as well as resulted in more fertilizer inputs. Meanwhile, in Gansu province, per capita GDP negatively affected the total GWP of grain crops through the indirect impacts on per capita total power of agricultural machinery, with the coefficient of -0.13 for GWF related to both N and P. Higher per capita GDP led to improvements in agricultural technological invests in Gansu province, where the grain crop production increased by 52.9% with 13.0% and 12.7% less N and P fertilization, respectively, over the study period.
Previous studies have shown that the scale of economic development, population, and industrial structure were the main driving factors of China’s agricultural WF (Zhao and Chen 2014; Zhao et al., 2014; Cui et al., 2020). This paper considers only the GWF of crop production and does not include the blue and green WFs, resulting in differences in the results. However, population and economic development remained important drivers of the GWF of crop production. In addition, our research found that the two methods showed consistency of key driving factors, with the same influence trend of each driving factor, though the order of intensity changed. In terms of the total GWF, the STIRPAT model shows that the effects of planting structure and population were stronger than other factors, but path analysis shows that per capita cultivated land area also had a positive effect, which even exceeded planting structure in Ningxia. Per capita GDP was a negative driving force in most cases, but for potatoes and vegetables, it was an obvious positive driving force in some provinces. The reason for this occurrence was that in recent years, vegetable and potato cultivation in these provinces had gradually become standard and industrialization, the scale of the industry had been steadily expanded, crop yield and income had gradually increased, and the effect of facility agriculture had been remarkable. The growth of per capita GDP had accelerated the development of facility agriculture, which had expanded the sown area of potatoes and vegetables and increased agricultural input at the same time. For the unit GWF, the STIRPAT model shows that the negative effect of crop yield was very significant compared to other factors, that the unit GWF related to N and P decreased by 0.84% and 0.66% on average, respectively, with 1% increase in crop yield. However, the negative effect of crop yield shown by path analysis was not as large as that shown by the STIRPAT model, the average total effect coefficients for crop yield level related to N and P were -0.594 and -0.488, respectively. The effect of other factors cannot be ignored, and even the negative effect of per unit yield on unit GWF related to P was relatively small in Inner Mongolia, which was related to the increasing trend of phosphorus application exceeding the increase in crop yield in Inner Mongolia. The positive effects showed regional differences, but the two methods showed different maximum positive driving forces. For example, the two methods show that the largest influential factors on the unit GWF in Xinjiang were mean temperature and planting structure, respectively. Furthermore, the STIRPAT model shows that factors other than per unit yield had little effect on the unit GWF in Ningxia and Gansu, but path analysis shows that per capita cultivated land area had the greatest positive effect in Ningxia, the positive effect of population in Gansu cannot be ignored, and per capita GDP was the second largest negative driving factor in Ningxia and Gansu.
In addition, when the indirect influence of the driving factor through other factors was larger, the influence of the two methods was reversed in some regions. Previous studies have shown that the main positive driving factors of the agricultural GWF were economic development status and population (Wang et al., 2019; Cui et al., 2020), planting structure and scale (Su et al., 2020). The main negative driving factors were investment change in crop planting, urbanization (Wang et al., 2019), and industrial structure adjustment (Cui et al., 2020). The positive driving factors were consistent with the main positive driving factors of the total GWF of crop production obtained in this study, which were planting structure and population, but our study showed that the per capita GDP had a negative driving effect on the total GWF of crop production except Inner Mongolia. The reason is that the research areas, scales and pollutant types of each study were inconsistent, leading to differences in the ranking and direction of driving factors. In the current results, the STIRPAT model shows that per capita cultivated land area had a slightly negative effect on the total GWF of crop production in Inner Mongolia, but path analysis shows an obvious positive effect because per capita cultivated land had a greater indirect impact through other factors. As far as meteorological factors were concerned, the STIRPAT model was minimally influenced by meteorological factors, but path analysis indicated that the impact of meteorological factors cannot be ignored. The main reason for this contradiction is that the calculation of GWF was greatly affected by the leaching rate, which was closely related to precipitation, and the crop production process was also greatly affected by temperature. Path analysis considers the indirect influence of meteorological factors on the GWF through other factors, and the results show that the indirect impact of meteorological factors cannot be ignored.
According to our analysis, we propose the following suggestions to solve non-point source water pollution in six western provinces.
1) Increasing the crop yield is an important means of reducing the pressure on water resources and the environment in the six western provinces. The results of this study indicate that crop yield was the most important driving factor for unit GWF. In the future, we should actively carry out the cultivation and promotion of drought-resistant, high-yield, green, and high-quality crops, improve land productivity, improve water resource utilization efficiency, and optimize agricultural structure and planting structure.
2) Optimizing planting structure is an effective means to control the pollution of agricultural chemical fertilizers. The results of this study show that the unit GWF of oil crops was higher than that of grain crops, and even increased in some provinces. Cash crops bring higher benefits to farmers, but pollution generated in the production process was higher than that of grain crops. The current results show that increases in P fertilization for oil crops has led to upward trends in P-related total and unit GWF of oil crops, especially in Xinjiang. The domination of the GWF of oil crops became P from N. Therefore, we suggest that the GWF should be considered in places like Inner Mongolia and Xinjiang where the GWF of oil crops was growing or higher than reasonable levels when optimizing the planting structure.
3) In different stages of economic development, affluence has different impacts on agricultural non-point source pollution, and different economic development levels in various regions have positive or negative impacts on the GWF of crop production. In technologically underdeveloped regions, one-sided pursuit of economic growth rates and unreasonable economic development structures lead to more severe water pollution, but in more developed regions, agricultural fertilizer pollution is controlled by promoting efficient agricultural irrigation technology and supporting ecological agriculture. Local governments should formulate economic development policies according to local conditions, change the one-sided pursuit of development models, and ease the relationship between the economy and the environment. At the same time, for economic development, it is necessary to consider the environmental carrying capacity and design and formulate reasonable policies and systems. To promote an increase in income and ensure the stable development of agricultural production, the implementation of policies that benefit farmers will not only increase farmers’ income and yield but also lead to the excessive use of chemical fertilizers. Hence, we should encourage farmers to adopt environmentally friendly technologies and strictly control the amount of fertilizer applied.
The current study is not limited to the case study itself. When many studies carry out driving force analysis in different regions, the differences between the selected analysis methods should be considered. The results of this study show that the two methods are applicable to most regions, and the key driving factors obtained are consistent, but the results of the two methods will be different in some regions for ranking the factors and influencing their directions. We suggest that a combination of multiple method tests be used to draw more accurate conclusions. At the same time, this study indicates that regional differences should be considered when analyzing the WF of crop production in different regions and scales. It should be noted that method is chosen given its advantages and feasibility to the analysis with data availability. With differences in terms of planting structure, climatic and socioeconomic conditions in planting locations, as well as yield and price among different crops, the analyzing results and conclusions would be different among crops. Therefore, crop types should be distinguished in such analysis.
The driving force analysis of the GWF represents only the impact of water pollution on water resource utilization, and physical water availability should be considered in solving water resource crises. Numerous studies have analyzed the driving forces of the blue and green WFs and investigated the main driving forces affecting water occupation. The results show that population, per capita GDP, and dietary structure are positive drivers, and therefore water use intensity is negatively affected (Xu et al., 2015; Wang et al., 2016; Feng et al., 2017; Soligno et al., 2019), which is partially consistent with the analysis results of the main driving forces of the GWF. Different research areas and different methods show different directions or intensities of effects. When analyzing driving forces in the future, multiple methods should be jointly verified, and regional differences should be considered.
However, this study still has some limitations. First, there were many types of pollutants that determine water quality. This study selected only N and P fertilizers as the main pollution sources and did not consider other types of pollutants. In the future, we should consider introducing more pollutants and comprehensively consider the GWF in many aspects when data are available. Although the GWF of a region should be the maximum value of the most critical pollutants, it is not comprehensive to calculate the GWF considering only the leaching losses of N and P, and this paper does not emphasize the final GWF value of the region. Second, due to the lack of more accurate data, when calculating the GWF of each crop at the municipal scale in this paper, N and P application at the municipal scale were allocated according to the planting area. Then, total N and P application at the municipal scale were allocated to each crop, and the amount of N and P applied by this method deviates from the actual value. Furthermore, there are certain limitations in the selection of research methods in this paper; the possibility of multiple methods for research comparison can be considered in the future.
In this study, the unit GWF of grain crops and oil crops and the total GWF of regional crop production at the municipal scale in six provinces of western China from 2001 to 2018 are the research objects, and the extended STIRPAT model and path analysis methods are jointly applied to analyze the climatic and socioeconomic driving forces of the GWF of crop production in these six western provinces and discuss the differences between different analysis methods. The results show that the total GWF of the six western provinces demonstrated a fluctuating upward trend during the study period, increasing by 55% and 98%, respectively. The total GWF of crops related to N was higher than that related to P. Except for the P-related unit GWF of oil crops, the unit GWF of grain crops and oil crops showed a downward trend, and oil crops had a higher unit GWF than grain crops. In terms of driving force analysis, the key driving factors affecting the GWF of crop production obtained by the two methods were consistent; only the order of the intensity of action changed. Planting structure and population were the main factors that increase the total GWF, while crop yield was the largest inhibiting factor of unit GWF; the study also demonstrates regional differences in driving factors. However, when the indirect influence of the driving factor through other factors was large, some driving forces obtained by different methods were reversed. For example, the indirect impact of per capita cultivated land area on the total GWF in Inner Mongolia was large, resulting in a significant positive impact in the path analysis and a slight negative impact in the STIRPAT model. We suggest that using multiple methods together to verify the driving forces and considering regional differences can lead to more comprehensive and referential conclusions.
The original contributions presented in the study are included in the article/Supplementary Material, further inquiries can be directed to the corresponding author.
RG and DZ: Conceptualization, Software, Methodology, Formal analysis, ML, PZ, and HH: Validation, Visualization, Writing- Original draft preparation. LZ: Conceptualization, Writing-Reviewing and Editing, Supervision. PW: Writing-Reviewing and Editing.
The study is financially supported by the Program for Cultivating Outstanding Talents on Agriculture, Ministry of Agriculture and Rural Affairs, People’s Republic of China (13210321) to LZ and National Innovation and Entrepreneurship Training Program for College Students (202210712006) to RG.
The authors declare that the research was conducted in the absence of any commercial or financial relationships that could be construed as a potential conflict of interest.
All claims expressed in this article are solely those of the authors and do not necessarily represent those of their affiliated organizations, or those of the publisher, the editors and the reviewers. Any product that may be evaluated in this article, or claim that may be made by its manufacturer, is not guaranteed or endorsed by the publisher.
The Supplementary Material for this article can be found online at: https://www.frontiersin.org/articles/10.3389/fenvs.2022.1104797/full#supplementary-material
Aldaya, M. M., Rodriguez, C. I., Fernandez, P. A., Merchan, D., Beriain, M. J., and Llamas, R. (2020). Grey water footprint as an indicator for diffuse nitrogen pollution: The case of navarra, Spain. Sci. Total Environ. 698 (6), 134338. doi:10.1016/j.scitotenv.2019.134338
An, Q., and Sun, S. (2009). Effect of different irrigation amount on NO3-- N leaching in the soil of cotton field in Alaer irrigated area. Agric. Res. Arid Areas 27 (3), 154–157+167. doi:10.7606/j.issn.1000-7601.2009.03.130
Ang, B. (2005). The LMDI approach to decomposition analysis: A practical guide. Energy Policy 33 (7), 867–871. doi:10.1016/j.enpol.2003.10.010
Ansorge, L., Stejskalová, L., and Dlabal, J. (2020). Grey water footprint as a tool for implementing the Water Framework Directive – temelín nuclear power station. J. Clean. Prod. 263, 121541. doi:10.1016/j.jclepro.2020.121541
Boazar, M., Yazdanpanah, M., and Abdeshahi, A. (2019). Response to water crisis: How do Iranian farmers think about and intent in relation to switching from rice to less water-dependent crops? J. Hydrology 570, 523–530. doi:10.1016/j.jhydrol.2019.01.021
Brunn, M., Diefenbacher, A., and Strain, J. J. (2020). Are there effects of consultation–liaison-psychiatry on length of stay in the general hospital? A path analysis. Eur. J. Psychiatry 34 (4), 195–201. doi:10.1016/j.ejpsy.2020.06.001
Cao, Y., Chai, L., Yan, X., and Liang, Y. (2020). Drivers of the growing water, carbon and ecological footprints of the Chinese diet from 1961 to 2017. Int. J. Environ. Res. Public Health 17 (5), 1803. doi:10.3390/ijerph17051803
Chang, F., Gao, F., Hong, M., Wu, Y., and Li, Y. (2018). Effects of fertilization regimes on nitrogen leaching and maize yield in Hetao Irrigation Area. Chin. J. Ecol. 37 (10), 2951–2958. doi:10.13292/j.1000-4890.201810.035
Chen, H., Liu, L., Fang, J., Li, C., Wang, L., Quan, Q., et al. (2022). Spatio-temporal analysis of the coupling relationship between urbanization and eco-environment in backward regions of China. Environ. Sci. Pollut. Res. Int. 29 (5), 7406–7423. doi:10.1007/s11356-021-16240-z
Chen, J., Gao, Y., Qian, H., Jia, H., and Zhang, Q. (2021). Insights into water sustainability from a grey water footprint perspective in an irrigated region of the Yellow River Basin. J. Clean. Prod. 316, 128329. doi:10.1016/j.jclepro.2021.128329
Chen, S., Wu, M., Cao, X., and Guo, X. (2020). Analysis of the characteristics and driving forces of water footprint productivity in paddy rice cultivation in China. J. Sci. Food Agric. 100 (4), 1764–1774. doi:10.1002/jsfa.10213
Chukalla, A. D., Krol, M. S., and Hoekstra, A. Y. (2018). Trade-off between blue and grey water footprint of crop production at different nitrogen application rates under various field management practices. Sci. Total Environ. 626, 962–970. doi:10.1016/j.scitotenv.2018.01.164
CNKI (2022). China yearbooks full-text database. Available at: http://epub.cnki.net/kns/brief/result.aspx?dbPrefix=CYFD. [Last Access: 18 December 2022].
Cui, S., Dong, H., and Wilson, J. (2020). Grey water footprint evaluation and driving force analysis of eight economic regions in China. Environ. Sci. Pollut. Res. Int. 27 (16), 20380–20391. doi:10.1007/s11356-020-08450-8
De Girolamo, A. M., Miscioscia, P., Politi, T., and Barca, E. (2019). Improving grey water footprint assessment: Accounting for uncertainty. Ecol. Indic. 102, 822–833. doi:10.1016/j.ecolind.2019.03.040
Department of PriceNational DevelopmentReform Commission (2019). Compilation of national agricultural product cost-benefit data. Beijing: China Statistics Press.
Ding, Y. (2015). Characteristics of N leaching and apparent N budget in cultivated lands under a winter wheat-summer maize rotation system in Guanzhong plain. Yangling, China: Northwest A&F University.
Fan, Y., and Fang, C. (2020). A comprehensive insight into water pollution and driving forces in Western China-case study of Qinghai. J. Clean. Prod. 274, 123950. doi:10.1016/j.jclepro.2020.123950
FAO (2020). The State of Food and Agriculture 2020. Overcoming water challenges in agriculture. Rome: Food and Agriculture. doi:10.4060/cb1447en
Feng, H., Sun, F., Liu, Y., Zeng, P., Deng, L., and Che, Y. (2021). Mapping multiple water pollutants across China using the grey water footprint. Sci. Total Environ. 785, 147255. doi:10.1016/j.scitotenv.2021.147255
Feng, L., Chen, B., Hayat, T., Alsaedi, A., and Ahmad, B. (2017). The driving force of water footprint under the rapid urbanization process: A structural decomposition analysis for zhangye city in China. J. Clean. Prod. 163, 322–328. doi:10.1016/j.jclepro.2015.09.047
Foley, D. J., Thenkabail, P. S., Aneece, I. P., Teluguntla, P. G., and Oliphant, A. J. (2019). A meta-analysis of global crop water productivity of three leading world crops (wheat, corn, and rice) in the irrigated areas over three decades. Int. J. Digit. Earth 13 (8), 939–975. doi:10.1080/17538947.2019.1651912
Foley, J. A., Ramankutty, N., Brauman, K. A., Cassidy, E. S., Gerber, J. S., Johnston, M., et al. (2011). Solutions for a cultivated planet. Nature 478 (7369), 337–342. doi:10.1038/nature10452
Freund, R. J., Wilson, W. J., and Sa, P. (2006). Regression analysis. Cambridge: Academic Press, 190–192.
Fu, T., Xu, C., Yang, L., Hou, S., and Xia, Q. (2021). Measurement and driving factors of grey water footprint efficiency in Yangtze River Basin. Sci. Total Environ. 802, 149587. doi:10.1016/j.scitotenv.2021.149587
Guo, M., Zhang, T., Li, J., Li, Z., Xu, G., and Yang, R. (2019). Reducing nitrogen and phosphorus losses from different crop types in the water source area of the danjiang river, China. Int. J. Environ. Res. Public Health 16 (18), 3442. doi:10.3390/ijerph16183442
Hoekstra, A. Y., Chapagain, A. K., Aldaya, M. M., and Mekonnen, M. M. (2011). The water footprint assessment manual: Setting the global standard. London: Earthscan.
Hoekstra, A. Y., and Mekonnen, M. M. (2012). The water footprint of humanity. Proc. Natl. Acad. Sci. U. S. A. 109 (9), 3232–3237. doi:10.1073/pnas.1109936109
Hoekstra, A. Y. (2003). Virtual water trade: Proceedings of the international expert meeting on virtual water trade. Value of Water Research Report No.12. Delft, Netherlands: IHE Delft.
Huang, H., Zhuo, L., Wang, R., Shang, K., Li, M., Yang, X., et al. (2021). Agricultural infrastructure: The forgotten key driving force of crop-related water footprints and virtual water flows in China. J. Clean. Prod. 309, 127455. doi:10.1016/j.jclepro.2021.127455
Jin, C., Huang, K., Yu, Y., and Zhang, Y. (2016). Analysis of influencing factors of water footprint based on the STIRPAT model: Evidence from the beijing agricultural sector. Water 8 (11), 513. doi:10.3390/w8110513
Li, X., Cai, J., Wang, Q., and Wang, X. (2022). Heterogeneous public preferences for controlling agricultural non-point source pollution based on a choice experiment. J. Environ. Manag. 305, 114413. doi:10.1016/j.jenvman.2021.114413
Li, X., Chen, D., Cao, X., Luo, Z., and Webber, M. (2020). Assessing the components of, and factors influencing, paddy rice water footprint in China. Agric. Water Manag. 229, 105939. doi:10.1016/j.agwat.2019.105939
Li, Z., Shi, H., Li, X., and Zhang, Z. (2017). Response of the nitrate leaching law to different water-nitrogen management patterns in farmland. J. Soil Water Conservation 31 (1), 310–317. doi:10.13870/j.cnki.stbcxb.2017.01.051
Liao, X., Chai, L., and Liang, Y. (2021). Income impacts on household consumption’s grey water footprint in China. Sci. Total. Environ. 755, 142584. doi:10.1016/j.scitotenv.2020.142584
Lin, J., Weng, L., and Dai, Y. (2019). Study on spatial and temporal pattern of grey water footprint and its decoupling relationship in China. Water Conservancy Sci. Technol. Econ. 25 (9), 14–21. doi:10.3969/j.issn.1006-7175.2019.09.003
Liu, C. (2018). The causes and negative externality of agricultural chemical fertiliser pollution in China. Hangzhou, China: Zhejiang University.
Liu, C., Zhang, E., Wang, Q., Liu, Q., Wang, T., Yu, H., et al. (2012). Effects of wheat-maize intercropping and stubble treatment on nitrogen uptake and nitrate nitrogen distribution and leaching. J. Soil Water Conservation 26 (1), 72–76. doi:10.13870/j.cnki.stbcxb.2012.01.053
Liu, G., Xu, Q., Qiao, N., Kang, J., and Wu, H. (2016). Cultivation structure optimization of crops with low nitrogen and phosphorus pollution in irrigated Yellow River region of Ningxia. Agric. Res. Arid Areas 34 (1), 140–146. doi:10.7606/j.issn.1000-7601.2016.01.22
Liu, P., Qi, S., Li, D., and Ravenscroft, N. (2021). Promoting agricultural innovation as a means of improving China's rural environment. J. Environ. Manag. 280, 111675. doi:10.1016/j.jenvman.2020.111675
Long, A., Xu, Z., Wang, X., and Shang, H. (2006). Impacts of population, affluence and technology on water footprint in China. Acta Ecol. Sin. 26 (10), 3358–3365. doi:10.3321/j.issn:1000-0933.2006.10.027
Lv, D., Tong, Y., Sun, B., and Ove, E. (1998). Study on effect of nitrogen fertiliser use on environment pollution. Plant Nutr. Fertiliser Sci. 4 (1), 8–15.
Mao, Y., Liu, Y., Zhuo, L., Wang, W., Li, M., Feng, B., et al. (2021). Quantitative evaluation of spatial scale effects on regional water footprint in crop production. Resour. Conservation Recycl. 173, 105709. doi:10.1016/j.resconrec.2021.105709
Mateo-Sagasta, J., Zadeh, S. M., and Turral, H. (2017). Water pollution from agriculture: A global review. Rome: The Food and Agriculture Organization of the United Nations Rome, and the International Water Management Institute on behalf of the Water Land and Ecosystems research program Colombo.
Mei, C. (1991). The nitrogenous balance in farming fields tentative approach to ground water pollution in Ningxia plain. China Popul. Resour. Environ. 1 (3), 75–79.
Mekonnen, M. M., and Hoekstra, A. Y. (2018). Global anthropogenic phosphorus loads to freshwater and associated grey water footprints and water pollution levels: A high-resolution global study. Water Resour. Res. 54 (1), 345–358. doi:10.1002/2017wr020448
Mekonnen, M. M., and Hoekstra, A. Y. (2015). Global gray water footprint and water pollution levels related to anthropogenic nitrogen loads to fresh water. Environ. Sci. Technol. 49 (21), 12860–12868. doi:10.1021/acs.est.5b03191
Mekonnen, M. M., Lutter, S., and Martinez, A. (2016). Anthropogenic nitrogen and phosphorus emissions and related grey water footprints caused by EU-27’s crop production and consumption. Water 8 (1), 30. doi:10.3390/w8010030
MEP (2002). Surface water quality standards in China (GB3838-2002). Beijing, China: Ministry of Environmental Protection.
Ministry of Water Resources of the People's Republic of China (2019). China water resources bulletin. Beijing, China.
Muratoglu, A. (2020). Grey water footprint of agricultural production: An assessment based on nitrogen surplus and high-resolution leaching runoff fractions in Turkey. Sci. Total Environ. 742, 140553. doi:10.1016/j.scitotenv.2020.140553
Petraitis, P., Dunham, A. E., and Niewiarowski, P. H. (1996). Inferring multiple causality: The limitations of path analysis. Funct. Ecol. 10 (4), 421–431. doi:10.2307/2389934
Qi, Y., Zhang, S., Tang, L., and Chen, J. (2020). Analysis of water footprint of main crop production in Guyuan, Ningxia. J. Water Resour. Water Eng. 31 (1), 91–96+103. doi:10.11705/j.issn.1672-643X.2020.01.14
Soligno, I., Malik, A., and Lenzen, M. (2019). Socioeconomic drivers of global blue water use. Water Resour. Res. 55 (7), 5650–5664. doi:10.1029/2018wr024216
Su, B., and Ang, B. W. (2012). Structural decomposition analysis applied to energy and emissions: Some methodological developments. Energy Econ. 34 (1), 177–188. doi:10.1016/j.eneco.2011.10.009
Su, W., Chen, S., Baležentis, T., and Chen, J. (2020). Economy-water nexus in agricultural sector: Decomposing Dynamics in water footprint by the LMDI. Technol. Econ. Dev. Econ. 26 (1), 240–257. doi:10.3846/tede.2020.11908
Tuyishimire, A., Liu, Y., Yin, J., Kou, L., Lin, S., Lin, J., et al. (2022). Drivers of the increasing water footprint in Africa: The food consumption perspective. Sci. Total Environ. 809, 152196. doi:10.1016/j.scitotenv.2021.152196
Wan, L., Cai, W., Jiang, Y., and Wang, C. (2016). Impacts on quality-induced water scarcity: Drivers of nitrogen-related water pollution transfer under globalization from 1995 to 2009. Environ. Res. Lett. 11 (7), 074017. doi:10.1088/1748-9326/11/7/074017
Wang, H., Li, J., Fan, J., Luo, X., Peng, C., Zhai, L., et al. (2021). Nitrogen and phosphorus leaching characteristics and temporal and spatial distribution patterns in northern China farmlands. Chin. J. Eco-Agriculture 29 (1), 11–18. doi:10.13930/j.cnki.cjea.200572
Wang, L., Li, L., Cheng, K., and Pan, G. (2019). Comprehensive evaluation of environmental footprints of regional crop production: A case study of chizhou city, China. Ecol. Econ. 164, 106360. doi:10.1016/j.ecolecon.2019.106360
Wang, L., Zhang, Y., Jia, L., Yang, G., Yao, Y., and Wang, W. (2019). Spatial characteristics and implications of grey water footprint of major food crops in China. Water 11 (2), 220. doi:10.3390/w11020220
Wang, R., Hertwich, E., and Zimmerman, J. B. (2016). (Virtual) water flows uphill toward money. Environ. Sci. Technol. 50 (22), 12320–12330. doi:10.1021/acs.est.6b03343
Wang, S., and Lin, Y. (2021). Spatial evolution and its drivers of regional agro-ecological efficiency in China’s from the perspective of water footprint and gray water footprint. Sci. Geogr. Sin. 41 (2), 290–301. doi:10.13249/j.cnki.sgs.2021.02.012
Wang, X., Zhang, F., and Zhang, W. (2013). China agrochemical service fertiliser and fertilisation manual. Beijing: China Agricultural Press.
Wang, Z., Huang, K., Yang, S., and Yu, Y. (2013). An input–output approach to evaluate the water footprint and virtual water trade of Beijing, China. J. Clean. Prod. 42, 172–179. doi:10.1016/j.jclepro.2012.11.007
Wright, S. (1934). The Method of path coefficients. Ann. Math. Statistics 5 (3), 161–215. doi:10.1214/aoms/1177732676
Wu, H., and Ge, Y. (2019). Excessive application of fertilizer, agricultural non-point source pollution, and farmers’ policy choice. Sustainability 11 (4), 1165. doi:10.3390/su11041165
Xu, Y., Huang, K., Yu, Y., and Wang, X. (2015). Changes in water footprint of crop production in beijing from 1978 to 2012: A logarithmic mean divisia index decomposition analysis. J. Clean. Prod. 87, 180–187. doi:10.1016/j.jclepro.2014.08.103
Yang, X., Lu, Y., Tong, Y., Lin, W., and Liang, T. (2013). Effects of application of nitrogen fertiliser and in corporation of straw on nitrate leaching in farmland under wheat-maize rotation system. Acta Pedol. Sin. 50 (3), 564–573. doi:10.11766/trxb201206080224
Ye, Y., Li, L., Zhang, F., Sun, J., and Liu, S. (2004). Effect of irrigation on soil NO3-N accumulation and leaching in maize/barley intercropping field. Trans. Chin. Soc. Agric. Eng. 20 (5), 105–109. doi:10.3321/j.issn:1002-6819.2004.05.022
York, R., Rosa, E. A., and Dietz, T. (2003). STIRPAT, IPAT and ImPACT: Analytic tools for unpacking the driving forces of environmental impacts. Ecol. Econ. 46 (3), 351–365. doi:10.1016/s0921-8009(03)00188-5
Zhang, L., Dong, H., Geng, Y., and Francisco, M. J. (2019). China's provincial grey water footprint characteristic and driving forces. Sci. Total Environ. 677, 427–435. doi:10.1016/j.scitotenv.2019.04.318
Zhang, L., Zhang, R., Wang, Z., and Yang, F. (2020). Spatial heterogeneity of the impact factors on gray water footprint intensity in China. Sustainability 12 (3), 865. doi:10.3390/su12030865
Zhang, X., Davidson, E. A., Mauzerall, D. L., Searchinger, T. D., Dumas, P., and Shen, Y. (2015). Managing nitrogen for sustainable development. Nature 528 (7580), 51–59. doi:10.1038/nature15743
Zhao, C., and Chen, B. (2014). Driving force analysis of the agricultural water footprint in China based on the LMDI method. Environ. Sci. Technol. 48 (21), 12723–12731. doi:10.1021/es503513z
Zhao, C., Chen, B., Hayat, T., Alsaedi, A., and Ahmad, B. (2014). Driving force analysis of water footprint change based on extended STIRPAT model: Evidence from the Chinese agricultural sector. Ecol. Indic. 47, 43–49. doi:10.1016/j.ecolind.2014.04.048
Zhuo, L., Li, M., Wu, P., Huang, H., and Liu, Y. (2020). Assessment of crop related physical-virtual water coupling flows and driving forces in Yellow River basin. J. Hydraulic Eng. 51 (9), 1059–1069. doi:10.13243/j.cnki.slxb.20200336
Keywords: intra-provincial scale, gray water footprint, crop production, spatial and temporal variations, arid zone
Citation: Gao R, Zhao D, Zhang P, Li M, Huang H, Zhuo L and Wu P (2023) Driving factor analysis of spatial and temporal variations in the gray water footprint of crop production via multiple methods: A case for west China. Front. Environ. Sci. 10:1104797. doi: 10.3389/fenvs.2022.1104797
Received: 23 November 2022; Accepted: 30 December 2022;
Published: 11 January 2023.
Edited by:
Xu Zhao, Shandong University, Weihai, ChinaCopyright © 2023 Gao, Zhao, Zhang, Li, Huang, Zhuo and Wu. This is an open-access article distributed under the terms of the Creative Commons Attribution License (CC BY). The use, distribution or reproduction in other forums is permitted, provided the original author(s) and the copyright owner(s) are credited and that the original publication in this journal is cited, in accordance with accepted academic practice. No use, distribution or reproduction is permitted which does not comply with these terms.
*Correspondence: La Zhuo, emh1b2xhQG53YWZ1LmVkdS5jbg==
†These authors have contributed equally to this work and share first authorship
Disclaimer: All claims expressed in this article are solely those of the authors and do not necessarily represent those of their affiliated organizations, or those of the publisher, the editors and the reviewers. Any product that may be evaluated in this article or claim that may be made by its manufacturer is not guaranteed or endorsed by the publisher.
Research integrity at Frontiers
Learn more about the work of our research integrity team to safeguard the quality of each article we publish.