 Nan Xing
 Yingxin Zhang1*
94% of researchers rate our articles as excellent or good
Learn more about the work of our research integrity team to safeguard the quality of each article we publish.
Find out more
ORIGINAL RESEARCH article
Front. Environ. Sci., 12 January 2023
Sec. Atmosphere and Climate
Volume 10 - 2022 | https://doi.org/10.3389/fenvs.2022.1101602
Based on hourly station precipitation data and ECMWF ERA5 reanalysis data from 2009 to 2019, this paper explores the temporal variations and spatial distribution of short–duration heavy rainfall (SDHR) induced by North China cold vortices (NCCV) over the Beijing-Tianjin-Hebei (BTH) region, and comparatively analyzes the characteristic of environmental parameters and then choose some predictors to make probability forecasting for short–duration heavy rainfall induced by North China cold vortices. Results show that short–duration heavy rainfall has obviously interannual, monthly and diurnal variations. Areas of high short–duration heavy rainfall frequency caused by North China cold vortices exhibit eastward movement, which generally locate along the mountain areas of the Beijing-Tianjin-Hebei region in the afternoon, and moves to the coastal areas of the Beijing-Tianjin-Hebei region after midnight. In general, short–duration heavy rainfall induced by North China cold vortices mainly occurs in 16:00–21:00 and around 02:00–05:00, showing a delayed peak time and a secondary peak time in recent years. Besides, short–duration heavy rainfall caused by North China cold vortices occurs fewer but more extremely over the northwestern and southern parts of the Beijing-Tianjin-Hebei region, more frequently and extremely over the border area of the Beijing-Tianjin-Hebei region, and more frequently but with moderate intensity over the coastal area of the Beijing-Tianjin-Hebei region. By comparing the distribution characteristics of some physical parameters for three categories of no precipitation, ordinary precipitation, and short–duration heavy rainfall weather induced by North China cold vortices, it is found that moisture and atmospheric instability conditions have great significance for the occurrence of short–duration heavy rainfall caused by North China cold vortices. Probability forecast for short–duration heavy rainfall caused by North China cold vortices is made based on ingredient method and fuzzy logic algorithms. The result shows the products have good performance, further implying the significance of the environmental parameters for forecasting short–duration heavy rainfall caused by North China cold vortices.
North China cold vortices (NCCV) generally refer to the high–altitude cold vortex systems in North China and eastern Inner Mongolia, which are important weather systems causing strong convection in summer in North China (Li et al., 2011). During its period of formation, development and extinction, the cold vortex system could lead to strong convective weather, such as sudden, local and catastrophic short–duration heavy rainfall (SDHR), thunderstorm wind and hail (Zhang et al., 2008; Yang et al., 2016). Since the NCCV contributes to nearly half of SDHR in Beijing-Tianjin-Hebei (BTH) region (Yu et al., 2011), it is of great practical significance to study the heavy precipitation weather in the BTH region caused by NCCV.
Previous studies have shown that frequency of cold vortex events in North China shows obviously monthly variation, and SDHR caused by NCCV mostly occurs in July (Yu et al., 2011; He et al., 2015). Heavy rainfall caused by NCCV shows relatively dispersed, but mainly located in the southeast quadrant of the cold vortex (Fu et al., 2019). In other words, SDHR occurs more frequently in the coastal area of BTH region (Yu et al., 2011). During the mature period of cold vortex, heavy precipitation is mostly induced by local convective instability, so heavy precipitation has obviously diurnal variation, which mainly occurs from afternoon to evening (Chen et al., 2008; Li et al., 2022).
SDHR induced by NCCV is closely related to the environmental conditions such as moisture content, instability, and dynamical forcing (Cai et al., 2019). Based on the case analysis of two cold vortex events in North China, it is found that the environmental conditions of high unstable energy and abundant water vapor favor the SDHR occurrence (Fu et al., 2019). Ma et al. (2021) found that vertical distribution of humidity with high moisture content in the low troposphere and dry air in the middle troposphere was conducive to the SDHR occurrence under the background of NCCV in Qingdao region. In order to find the environmental parameters indicating the SDHR occurrence induced by cold vortex, some scholars have analyzed parameters representing thermal, dynamic and moisture conditions of the atmosphere (Chen and Zhao, 2021). Yu et al. (2011) pointed out that values of both best uplift index and uplift condensation height are highest before the SDHR occurrence caused by NCCV in the BTH region. In general, there are some environmental indicators before the SDHR occurrence caused by NCCV in the BTH region, while studies on quantitative statistical analysis of the environmental parameters are relatively few.
Moreover, short–term predictions for SDHR can be made by analyzing the environmental parameters based on the ingredients–based methodology, which focus on the physical processes involved (Doswell et al., 1996; Lei et al., 2012; Dong et al., 2021). Tian et al. (2022) explore a new approach for the probability forecasting of SDHR based on ingredients–based methodology and fuzzy logic approach. However, the results have certain limitations due to the small number of samples in previous studies. It is necessary to calculate and analyze the dynamic, thermal and moisture conditions of a large number of cases of NCCV, and find and identify the possible environmental parameters for probability forecasting.
The characteristics of atmospheric circulation and climate over North China have interdecadal variations (Guo et al., 2012; Zang et al., 2022), and change may occur in the features of SDHR over the BTH region caused by NCCV. Therefore, it is necessary to investigate the characteristics of SDHR caused by NCCV in recent years, and explore the corresponding environmental parameters to find some indicators. The paper is organized as follows. Section 2 describes the data and methods used. The features of spatial–temporal variations of SDHR induced by NCCV are given in Section 3. Section 4 illustrates characteristics of environmental parameters and an application of the objective method for probability forecasting, and a summary and discussion are given in Section 5.
Hourly rainfall data of 175 observation stations (Figure 1) over the BTH region and observation data for temperature and geopotential height at 500 hPa from China Meteorological Administration (CMA) during 2009–2019 are used in this study. Reanalysis data are obtained from the European Centre for Medium-Range Weather Forecasts (ECMWF) ERA5 for the same period, with spatial resolution of .25° × .25° (Hersbach et al., 2020). Hourly rainfall data of national and automatic stations and the ECMWF numerical prediction products (.25° × .25°) for 2020–2021 are used produce probability forecasts for SDHR caused by NCCV.

FIGURE 1. Spatial distribution of the 175 national rain gauge stations over the BTH region. The black dots denote the stations, and the shading represents surface elevation.
Yu et al. (2011) defined the NCCV as a low–pressure circulation system with closed contour lines of geopotential height at 500 hPa in the range of 110–130°E and 35–55°N, and accompanied by a cold center or cold trough, which lasted for 2 days or more. Twice–daily Weather maps based on geopotential height and temperature at 500 hPa from CMA (figures not shown) are plotted and used for subjective selection, 99 cold vortexes (314 days) are identified from May to August of 2009–2019 according to the definition. Moreover, the spatial structure of NCCV is obtained by using dynamic composite analysis (Shen et al., 2020) based on data from CMA and the NCCV cases. It can be seen that NCCV shows obviously closed contour lines of geopotential height with central value of 5,220 gpm, associated with a cold trough (Figure 2).
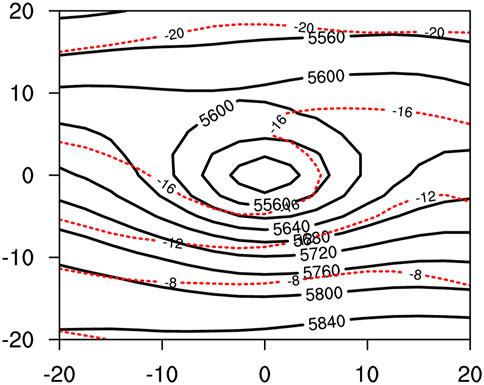
FIGURE 2. Dynamic composite of geopotential height (black line, unit: gpm) and temperature (red line, unit: °C) at 500 hPa. The origin of coordinates is the center of NCCV composite, and the horizontal and vertical coordinates are the relative longitude and latitude about the cold vortex center.
Based on the definition of SDHR (greater than 20 mm h−1), the characteristics of SDHR in the BTH region induced by the NCCV are analyzed. In this study, the total number of SDHR occurrence caused by NCCV is referred to as SDHR frequency during 2009–2019, which is used to analyze the characteristics of SDHR. And the hourly precipitation data are divided into three weather types: SDHR, ordinary precipitation (between .1 and 19.9 mm h−1), and non-precipitation, which are used to comparatively analyze the characteristic of environmental parameters among the three weather types.
Figure 3 shows the time series of the annual, monthly and diurnal frequency of SDHR caused by NCCV in the BTH region. It can be seen that the annual frequency shows an interannual variation, but with no obvious trend. The highest frequencies of SDHR induced by cold vortex events occur in 2012, reaching 260. Frequency of SDHR reaches the minimum in 2009 and 2019 with the value of 27, respectively (Figure 3A). SDHR frequency is 12, 140, 571, 285 from May to August, respectively, also showing an obviously monthly variation (Figure 3B). The result indicates SDHR caused by NCCV occurs more often in July than other months, which is consistent with previous studies (Yu et al., 2011). SDHR frequency also shows prominent diurnal variations with the lowest value from early morning to noon, and then increase from afternoon to evening, mainly occurring during around 16:00–21:00 LST (local standard time), then after a decline it rises again, reaching its secondary peak around 02:00–05:00 LST (Figure 3C). The peak period of SDHR around the evening is related to solar radiation, and the secondary peak period around after midnight could be associated with low–level jet (He et al., 2015). Compared to previous studies which reported SDHR induced by NCCV in the BTH region mainly occurs during 13:00–19:00 LST for 2001–2008 (Yu et al., 2011), the result indicates that the peak time of SDHR induced by NCCV in the BTH region delays to some extent, and moreover a secondary peak is found around after midnight in recent years.
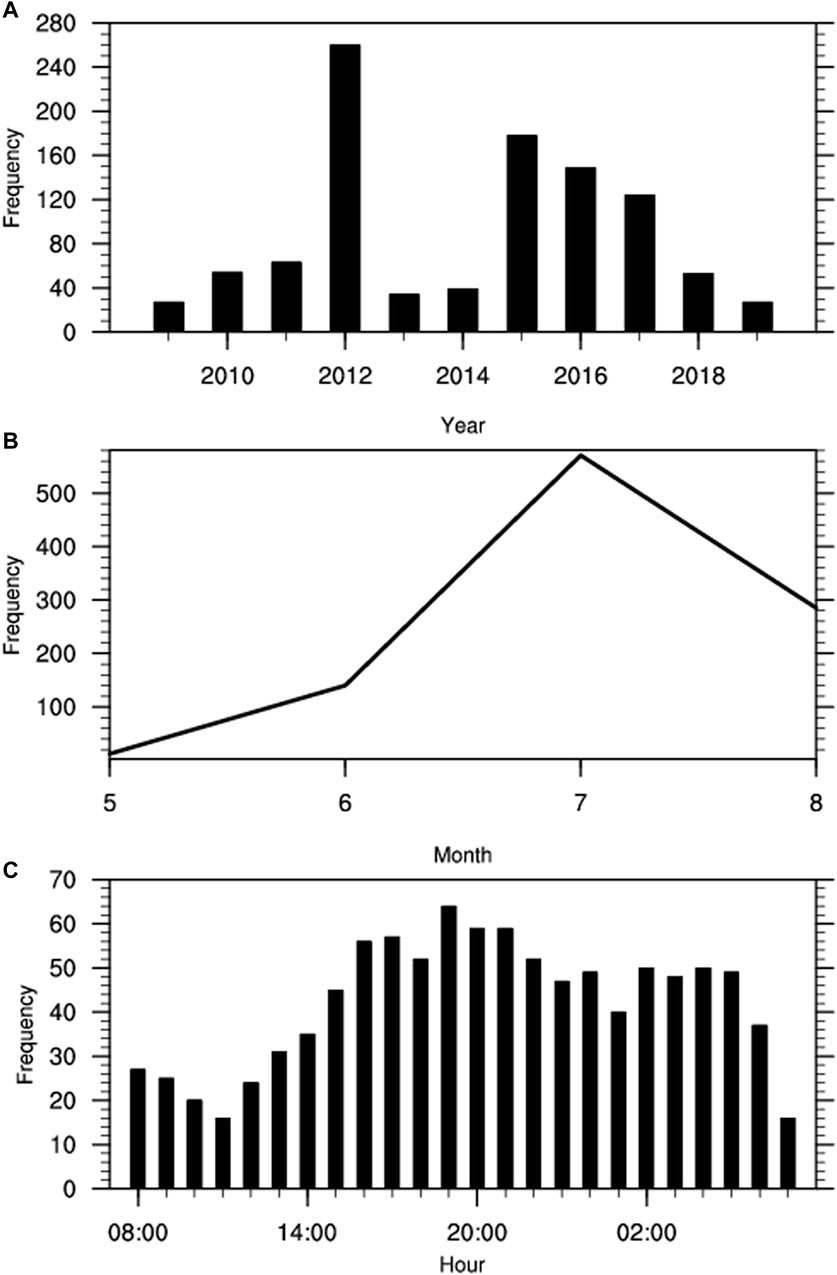
FIGURE 3. The annual (A), monthly (B), and diurnal (C) variations of SDHR in the BTH region caused by NCCV from May to August during 2009–2019.
To analyze the spatial characteristics of SDHR caused by NCCV, Figure 4 shows the spatial distribution of SDHR frequency caused by NCCV in the BTH region. Frequency of SDHR gradually decreases from east to northwest as a whole (Yu et al., 2011). SDHR occurs more frequently in the northeastern coastal areas of the BTH region, reaching more than 15. Inconsistent with previous studies (Yu et al., 2011), SDHR also occurs more than 15 times over plain areas of Beijing and border areas of the BTH region, which indicates another area with high frequency of SDHR induced by NCCV in recent years.
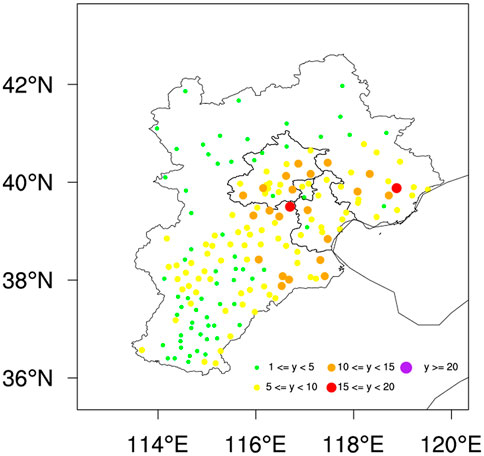
FIGURE 4. Distribution of the frequency of SDHR caused by NCCV from May to August during 2009–2019 in the BTH region.
In order to further explore the variations of the spatial distribution of SDHR frequency induced by NCCV over the BTH region, the SDHR frequency induced by NCCV at each station is divided into four periods: 08:00–14:00 LST, 14:00–20:00 LST, 20:00–02:00 LST, and 02:00–08:00 LST. Diurnal variation is also can be seen from the spatial distribution of SDHR frequency in Figure 5. SDHR shows the lowest frequency during 08:00–14:00 LST, and mainly occurs over plain areas of the BTH region with a frequency of 1–3 in most stations (Figure 5A). During 14:00–20:00 LST, SDHR increases in the Yanshan Mountains and the coastal area of the BTH region, reaching seven times in the northwestern Beijing (Figure 5B). Then, areas of high SDHR frequency move eastward to the East of Beijing and the border of BTH region during 20:00–02:00 LST, with a local frequency of up to eight times (Figure 5C). SDHR continues moving eastward during 02:00–08:00 LST, mainly occurs over the coastal area of the BTH region and slightly declines in frequency (Figure 5D). The results further indicate that in recent years SDHR induced by NCCV occurs later than previous period over the BTH region, mainly occurring around evening and after midnight.
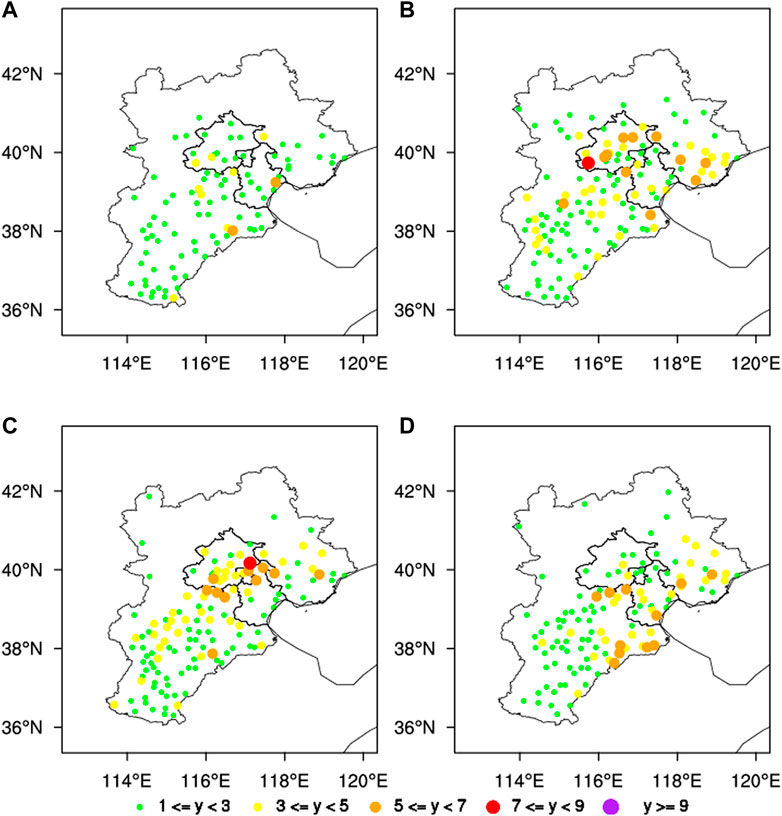
FIGURE 5. The distribution of SDHR frequency in the BTH region caused by NCCV in four periods of days from May to August during 2009–2019. (A) 08:00–14:00; (B) 14:00–20:00; (C) 20:00–02:00; (D) 02:00–08:00.
Besides the SDHR frequency, we also explore the characteristic of extreme SDHR induced by NCCV. Figure 6 shows the spatial distribution of the average SDHR caused by NCCV in the BTH region. The average intensity of SDHR is between 25 and 35 mm h−1 in most areas, and locally exceeds 40 mm h−1 in the border areas of BTH region and the southern part and Zhangjiakou of Hebei. According to the frequency and average amount of SDHR induced by NCCV, it is found that SDHR caused by NCCV occurs fewer but more extremely over Zhangjiakou and the southern part of Heibei, more frequently and extremely over the border areas of BTH region, and more frequently but with moderate intensity over the coastal area of the BTH region.
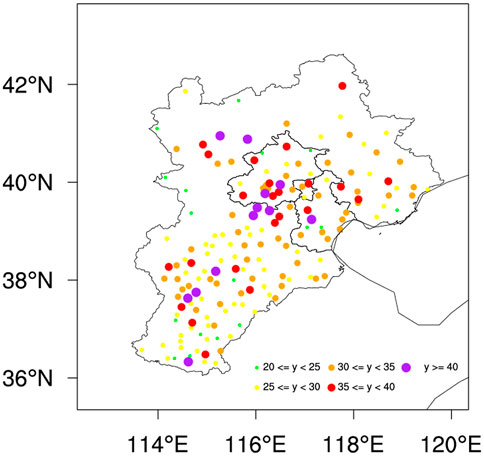
FIGURE 6. The distribution of average SDHR (mm h−1) in the BTH region caused by NCCV from May to August during 2009–2019.
The environmental conditions of the atmosphere are analyzed to make SDHR short–term predictions (Lei et al., 2012; Dong et al., 2021; Zhao et al., 2022). On the basis of previous studies, this study classifies the environmental parameters into indicators of moisture, thermal and energy conditions, and dynamic conditions, and finds the possible indicators for SDHR caused by NCCV by comparatively analyzing distribution characteristics of the three weather types (Tian et al., 2015).
Moisture is represented by the specific humidity at 925, 850, and 700 hPa, and 2 m dew point temperature. Thermal and energy conditions are represented by convective available potential energy (CAPE), K index (KI), temperature difference between 850 and 500 hPa (TD), and potential pseudo–equivalent temperature difference between 850 and 500 hPa (PPTD). The parameters used to denote the dynamic conditions are divergence at 925 and 850 hPa, meridional wind at 850 hPa, vertical velocity, 0–1 km, 0–3 km, and 0–6 km vertical wind shear (VWS).
Figure 7 shows the box–and–whisker plots of specific humidity at 925, 850, and 700 hPa for the three weather types under the background of NCCV. In order to remove the influence of outliers, 5% and 95% of each parameter are used as the lower and upper limits of box–and–whisker plots. More than 95% of SDHR occurs in the environment with specific humidity at 925, 850, and 700 hPa greater than 10.5, 9.4, 4.8 g kg−1, respectively. The median specific humidity at 925 hPa for the three weather types is 16.1, 14.1, and 8 g kg−1, respectively. Much less than 25% of ordinary rainfall events occur with the median specific humidity at 925 hPa for SDHR, and the percentage for no rainfall is few. Similar characteristics for specific humidity at 850 hPa are also shown in Figure 7, while more than 25% of ordinary rainfall events occur with the threshold of the median specific humidity at 700 hPa for SDHR. Therefore, moisture conditions at 925 and 850 hPa have greater differences than 700 hPa between SDHR and ordinary rainfall events.

FIGURE 7. Box–and–whisker plots of specific humidity (g kg−1) at 925, 850, and 700 hPa for SDHR (red), ordinary rainfall (blue), and no rainfall (black) in the BTH region caused by NCCV from May to August during 2009–2019. Short horizontal lines located at the lower and upper positions denote the 5th and the 95th percentiles, respectively. Three horizontal lines form lower to upper positions in the box represent the 25th, the 50th, and the 75th percentiles, respectively.
In general, more than 50% of SDHR occurs in the environment with specific humidity greater than 16.1, 14.1, and 8 g kg−1 at 925, 850, and 700 hPa, respectively. Specific humidity at 925 and 850 hPa can well identify the moisture environment favoring SDHR caused by NCCV.
Surface moisture condition also shows significantly different among the three weather types induced by NCCV (Figure 8). More than 50% of SDHR occurs in the environment with 2 m dew point temperature greater than 23.1°C. The percentages of both ordinary and no precipitation are much less than 25% with 2 m dew point temperature greater than 23.1°C. Moreover, moisture condition of 2 m dew point temperature greater than 24.5°C basically corresponds to SDHR weather.
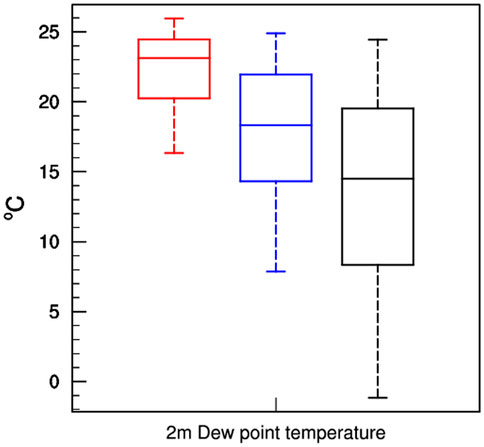
FIGURE 8. As for Figure 7, but for 2 m dew point temperature (°C).
Figure 9 shows the distribution of thermal and energy conditions of the three weather types caused by NCCV. From the box-and-whisker plot in Figure 9A, we can see significant differences in CAPE before three types of weather occur, with the median values of 1004.8, 21, and 3 J kg−1, respectively. More than 50% of heavy rainfall has a CAPE in excess of 1004.8 J kg−1, and non-precipitation and ordinary precipitation is far less than 25% when CAPE is greater than 1004.8 J kg−1. This indicates that CAPE is capable to identify SDHR weather caused by NCCV.
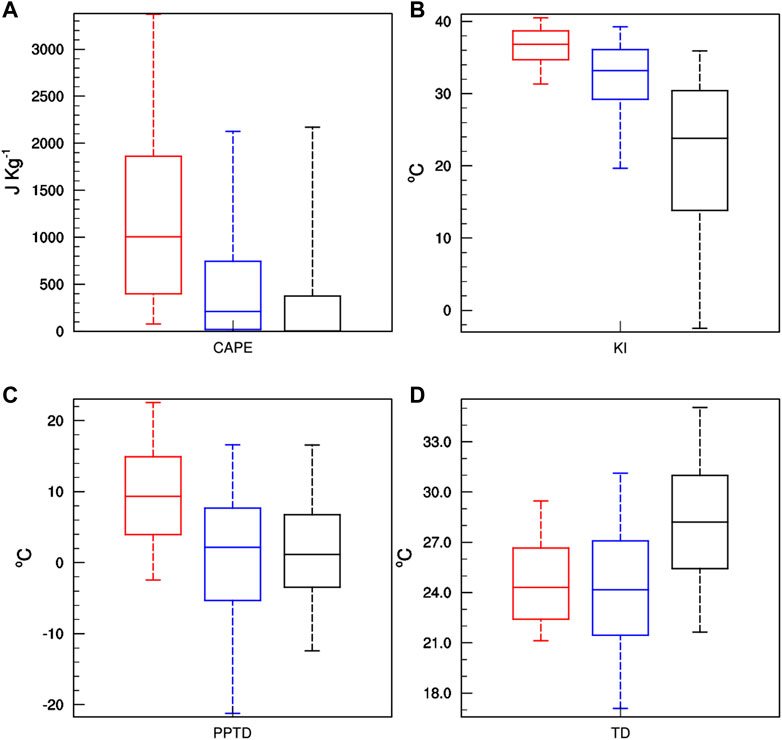
FIGURE 9. As for Figure 7, but for (A) CAPE, (B) K index, (C) potential pseudo-equivalent temperature difference between 850 and 500 hPa, and (D) temperature difference between 850 and 500 hPa.
KI is used to characterize the stability of the lower and middle atmosphere, and the median KI before three weather types are 36.8°C, 33.2°C, and 23.8°C, respectively, indicating instability of the lower and middle atmosphere before SDHR occurrence. More than 50% of heavy precipitation occurs with KI over 26.8°C, however, far less than 25% of non-precipitation and ordinary precipitation events have a KI that exceed 26.8°C (Figure 9B). In general, KI shows prominent differences among the three weather types, which can be used to distinguish the occurrence of SDHR caused by NCCV.
According to PPTD distribution show in Figure 9C, the median values of the three types of weather are 9.3°C, 2.1°C, and 1.2°C, respectively, implying the instability of atmosphere before SDHR occurrence. For non-precipitation and ordinary precipitation, the percentile of PPTD greater than the median of SDHR is less than 25%. Therefore, PPTD is effective in identifying the three weather types, and indicates the instability conditions of SDHR caused by NCCV.
As shown in Figure 9D, the median values of TD for three weather types are 24.3°C, 24.2°C, and 28.2°C, respectively. All of these median values exceed that in moist neutral stratification (20°C–21°C) (Chen and Zhao, 2021), indicating the conditional instabilities of atmosphere for precipitation occurrence caused by NCCV. However, ordinary precipitation and SDHR weathers are similar in the distributions of DT, which means a thermal condition can favors both of them. Thus, DT could not be used to distinguish the environmental condition of SDHR caused by NCCV.
Compared with ordinary precipitation and non-precipitation events, SDHR usually occur in the environment with favorable low–level lifting (Tian et al., 2015). To analyze low–level lifting conditions, Figures 10A, B shows the distributions of divergence at 925 and 850 hPa, and meridional wind at 850 hPa among the three weather types. More than 75% of SDHR events occur with a negative divergence at 925 hPa, which indicates SDHR occurs in the environment of low–level convergence and lifting. Moreover, the variation ranges of divergence at 925 hPa show different to some extent among SDHR, ordinary precipitation and non-precipitation weather types, with median values of −2, −.43, and .33 10−5 s−1, respectively. The three weather types are not well distinguished by divergence at 850 hPa (Figure 10A). Meridional wind at 850 hPa shows discrimination for the three weather types, with medians of 5.9, 2.3, and –.9 m s−1, respectively (Figure 10B). On the whole, meridional wind at 850 hPa and divergence at 925 hPa show some discrimination, and are able to identify SDHR caused by NCCV to some extent.
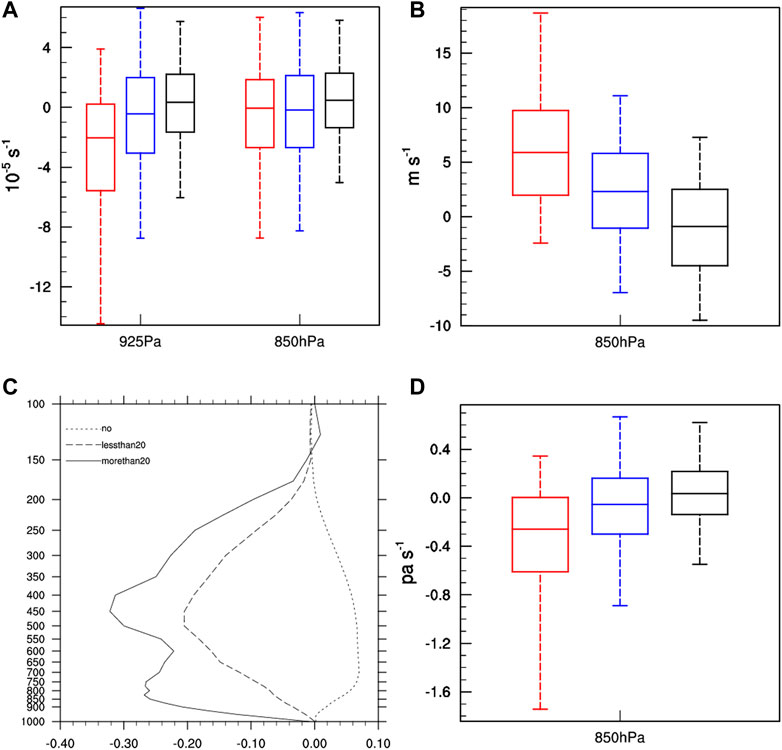
FIGURE 10. (A,B,D) as for Figure 7, but for divergence (10−5 s−1) at 925 and 850 hPa (A), meridional wind (m s−1) at 850 hPa (B), and vertical velocity (pa s−1) at 850 hPa (D). Vertical velocity profiles in the troposphere (pa s−1) for the three weather types in the BTH region caused by NCCV from May to August during 2009–2019 (C). Lines represent the median value in each troposphere for the three weather types, respectively.
To exhibit more clearly the features of vertical motion, vertical velocity profiles in the troposphere for the three weather types are also shown in Figure 10C. Profiles for SDHR show a broad upward motion with two centers in the lower and middle troposphere, which is associated with the deep circulation with strong convergence in the upper and lower atmosphere. Profiles for ordinary precipitation also shows a broad upward motion with one center through the middle troposphere, while the strength of vertical velocity in the troposphere is relatively weak compared to SDHR. Then, vertical velocity at 850 hPa are selected as an parameter according to the discrimination for the three weather types. Vertical velocity at 850 hPa, with medians of −.26, −.06, and .04 pa s−1, respectively (Figure 10D), which also can be used to identify SDHR caused by NCCV.
Strong VWS is an important indicator for further strengthening and development of convective storms (Yu et al., 2012). The median of 0–1 km VWS in three types of weather is 5.6, 4.2, and 3.5 m s−1, respectively (Figure 11). SDHR occurs in the environment with larger VWS in the lower troposphere, which may be related to the stronger warm and wet moisture transport in the lower troposphere. The median of 0–3 km VWS for the three weather types is 9.5, 9.3, and 8.5 m s−1, respectively. 0–3 km VWS under the background of NCCV is relatively large (Tian et al., 2015), but there is no distinction among the three weather types. More than 50% of 0–6 km VWS corresponding to NCCV occurs in the environment with moderate intensity (Johns and Doswell, 1992; Yu et al., 2012), while the distribution are all close for the three weather types, which cannot indicate the SDHR occurrence caused by NCCV.
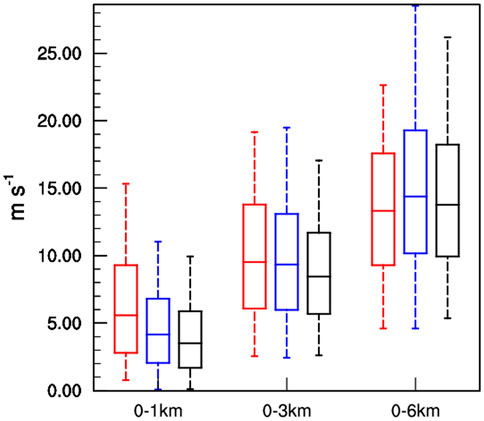
FIGURE 11. As for Figure 7, but for 0–1 km, 0–3 km, and 0–6 km vertical wind shear (m s−1).
In order to verify the indicators of the above environmental parameters for SDHR, we quantitatively select some representative parameters to make probability forecasting for SDHR caused by NCCV (Tian et al., 2022). The overlapping size of the relative frequencies of SDHR and ordinary precipitation (S1) and SDHR and non-precipitation (S2) are calculated for the above parameters (Table 1). The smaller the overlapping size, the better the discrimination. For moisture conditions, S1 and S2 for specific humidity at 850 hPa are smaller with a value of .58 and .3, respectively, indicating specific humidity at 850 hPa perform better than other moisture conditions. For the thermal and energy conditions, KI has the smallest S1 and S2 with a value of .6 and .25, respectively. CAPE has the same value of S1 with KI, and a smaller S2. Therefore, KI and CAPE are selected as the thermal and energy conditions. For dynamic forcing, meridional wind at 850 hPa has the smallest S1 and S2, which indicates the best performance among the dynamic forcing. Therefore, specific humidity at 850 hPa, KI, CAPE and meridional wind at 850 hPa are selected as predictors for SDHR caused by NCCV.
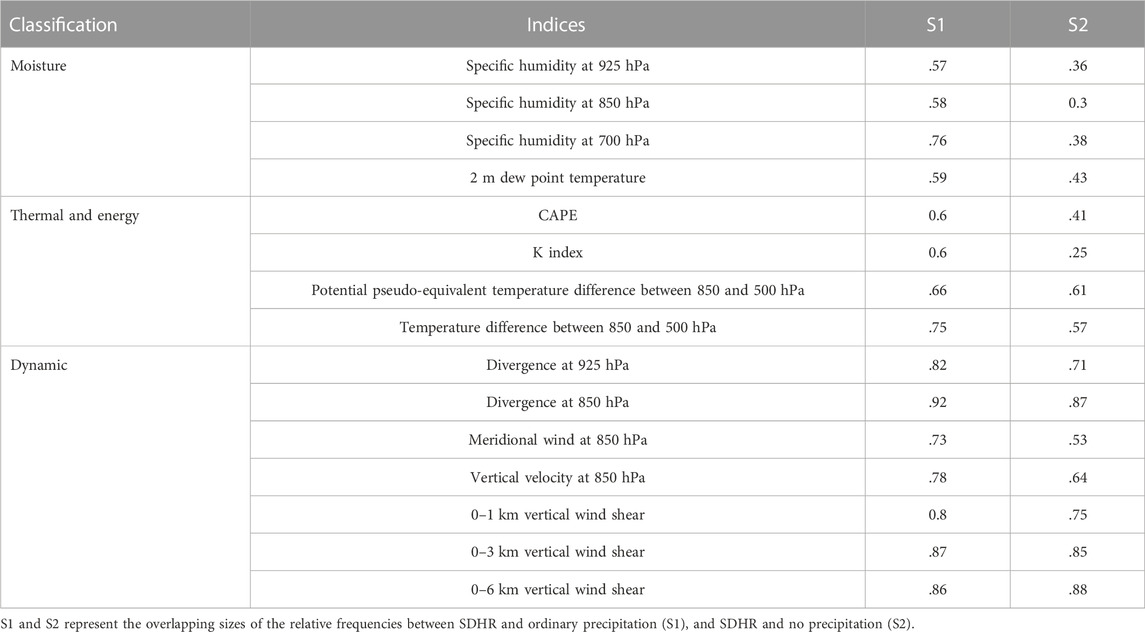
TABLE 1. Overlapping size of probability density distributions of moisture conditions, thermal and energy conditions, and dynamic conditions among the three weather types caused by NCCV.
Based on the fuzzy logic algorithm and ingredient method (Tian et al., 2022), the probability for SDHR occurrence at each grid point is obtained by weighted summation on the basis of the single physical quantity potential of short–term heavy precipitation weather. The calculation formula of probability P is as follows:
where
Based on ECMWF numerical forecast products from 2020 to 2021 with a time interval of 3 h from 0 to 24 h, probability forecast products of SDHR caused by NCCV in the BTH region are calculated according to the above methods. Then, we obtain station products by interpolating the grid forecast probability and ECMWF rainfall products through the nearest point method, and define heavy precipitation as 30 mm with a time interval of 3 h. Comparison of both TS scores is shown in Figure 12. Compared to ECMWF forecast products, TS score of probability products is higher with respect to probability threshold in the range .5–.8.
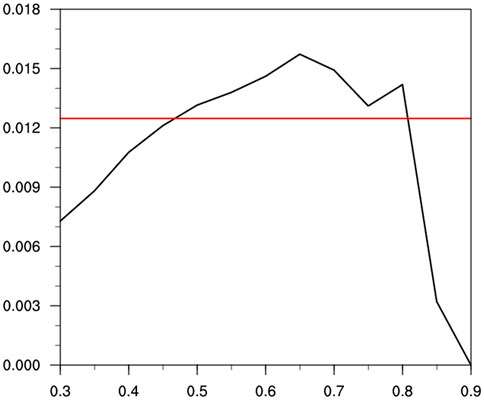
FIGURE 12. Variations of TS scores (black) with respect to probability threshold during NCCV events from May to August for 2020-2021. The red line represents TS score based on ECMWF forecast rainfall products.
A case of NCCV on 2–3 July 2021 was selected for further analysis. It can be seen from Figure 13A that there are two main precipitation belts in the mountain area of Beijing, the middle and southeast of BTH region, and then the rain belts move northeastward to the eastern part of Beijing and the coastal area of BTH region (Figure 13B). After that, precipitation belt continue to move northeastward to the northeast of BTH region (Figure 13C). High probability areas of SDHR are relatively large. High probability corresponds to the two main precipitation belts, while false alarms occur in the southern part of BTH region. ECMWF forecast products do not predict the eastern rain belt, and the moving speed of the rain belt is slower than the observation (figures not shown). Overall, forecast probability can perform heavy rainfall areas well.
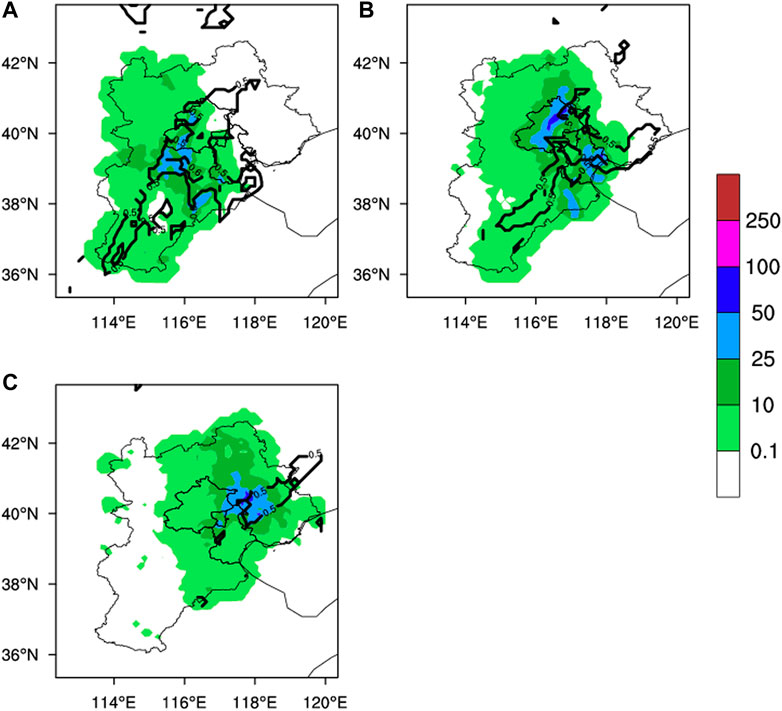
FIGURE 13. Distribution of observed precipitation (shaded) and forecast probability (contour) from (A) 23:00–02:00, (B) 02:00–05:00, (C) 05:00–08:00 LST on 2–3 July 2022.
In this study, the spatiotemporal characteristics, and the thermodynamic and moisture conditions of SDHR in the BTH region caused by NCCV are analyzed. SDHR induced by NCCV over the BTH region has obvious interannual, monthly and diurnal variations. The diurnal variation has two peaks that occur frequently at 16:00–21:00 and 02:00–05:00 LST in recent years, which is different from previous results (Yu et al., 2011). SDHR mainly occurs in Beijing in the evening to midnight, and then moves eastwards and occurs in the eastern coast of the BTH region in the evening to late night. In addition, the spatial distribution of SDHR frequency and SDHR intensity caused by NCCV has significant discrepancy. There are lower frequency and stronger intensity in SDHR over Zhangjiakou and the southern part of Heibei, higher frequency and stronger intensity in SDHR over the border area of the BTH region, higher frequency and moderate intensity in SDHR over the coastal area of the BTH region.
The environmental conditions show better moisture content, stronger instability and certain uplift before SDHR occurrence caused by NCCV compared with ordinary and no precipitation weather. According to the parameters representing moisture conditions, specific humidity at 925 and 850 hPa, and 2 m dew point temperature can well identify the moisture environment conditions for SDHR caused by NCCV. In terms of thermal and energy conditions, CAPE, KI and PPTD can be used to distinguish SDHR weather caused by NCCV. Dynamic conditions have certain ability for SDHR caused by NCCV. Then, the parameters indicating different aspects of the environmental conditions are chosen as predictors to make probability forecasting for SDHR caused by NCCV based on fuzzy logic and ingredients–based methods. The products shows positive skills compared to ECMWF products, indicating the significance of the environmental conditions.
In addition, probability of SDHR caused by NCCV with various weight settings is evaluated for 2020–2021. It is found that specific humidity at 850 hPa with higher weights could lead to a slight increase of the highest TS. Besides, the indicators representing atmospheric environmental conditions are important for probability forecasting (Tian et al., 2022). In this study, we make an attempt to forecast the probability of SDHR occurrence induced by NCCV based on limited environmental parameters, more work should be carried out to improve the forecast capability for SDHR caused by NCCV in the future. Characteristics of SDHR induced by NCCV over the BTH region in recent years are different from previous results (Yu et al., 2011), indicating the interdecadal and interannual variations of NCCV. It is necessary to explore the interdecadal and interannual variations of NCCV and the possible relationships with climatic factors in the future.
The original contributions presented in the study are included in the article/Supplementary Material, further inquiries can be directed to the corresponding author.
NX performed the data collection, analysis, writing of original manuscript. YZ conceived the research idea and supervised the study. SL, YD, CH, JL, and XZ contributed to the discussion of the results. All authors contributed to the article and approved the submitted version.
This study was supported by the National Key Research and Development Program of China [Grant No. 2018YFC1507305], the National Science foundation of China [Grant No. 41805041], and the National Science Foundation of Beijing, China [Grant No. 8224090].
We sincerely appreciate the two reviewers' constructive comments and suggestions, which help us to improve the quality of the manuscript.
The authors declare that the research was conducted in the absence of any commercial or financial relationships that could be construed as a potential conflict of interest.
All claims expressed in this article are solely those of the authors and do not necessarily represent those of their affiliated organizations, or those of the publisher, the editors and the reviewers. Any product that may be evaluated in this article, or claim that may be made by its manufacturer, is not guaranteed or endorsed by the publisher.
Cai, X., Chen, Y., Shen, X., Zheng, Y., and Tao, Y. (2019). Cause analysis of different types of severe convective weather under cold vortex background (in Chinese). Meteorol. Mon. 45 (5), 621–631.
Chen, L., Zhang, L., and Zhou, X. (2008). Characteristic of instable energy distribution in cold vortex over northeastern China and its relation to precipitation area (in Chinese). Plateau Meteorol. 27 (2), 339–348.
Chen, X., and Zhao, Y. (2021). Statistical analysis on hourly heavy rainfall in northeast China induced by cold vortices (in Chinese). Plateau Meteorol. 40 (3), 510–524.
Dong, C., Wu, Y., Guo, Y., Ma, L., and Miao, Q. (2021). Application of classification indexes and criterion on severe convection weather in Shanxi province. Chin. J. Arid Meteorology 39 (2), 345–355.
Doswell Ⅲ, C.-A., Broodks, H.-E., and Maddox, R.-A. (1996). Flash flood forecasting: An ingredients based methodology. Wea Forecast. 11, 560–581. doi:10.1175/1520-0434(1996)011<0560:fffaib>2.0.co;2
Fu, J., Chen, S., Shen, X., Zhang, X., and Quan, W. (2019). Comparative study of the cause of rainfall and its forecast biases of two cold vortex rainfall events in north China (in Chinese). Meteorol. Mon. 45 (5), 606–620.
Guo, Y., Li, J, -P., and Li, Y. (2012). A time-scale decomposition approach to statistically downscale summer rainfall over North China. J. Clim. 25, 572–591. doi:10.1175/jcli-d-11-00014.1
He, H., Chen, Y., Xiao, T., Wang, J., and Chen, Y. (2015). Statistical analysis of severe short-time precipitation under cold vortex background (in Chinese). Meteorol. Mon. 41 (12), 1466–1476. doi:10.1039/c5ib00191a
Hersbach, H., Bell, B., Berrisford, P., Hirahara, S., Horanyi, A., Munoz-Sabater, J., et al. (2020). The ERA5 global reanalysis. Q. J. R. Meteorol. Soc. 146 (730), 1999–2049. doi:10.1002/qj.3803
Johns, R.-H., and Doswell, C.-A. (1992). Severe local storms forecasting. Weather Forecast. 7 (4), 588–612. doi:10.1175/1520-0434(1992)007<0588:slsf>2.0.co;2
Lei, L., Sun, J., Wang, G., and Guo, R. (2012). An experimental study of the summer convective weather categorical probability forecast based on the rapid updated cycle system for the Beijing area (BJ-RUC) (in Chinese). Acta Meteorol. Sin. 70 (4), 752–765.
Li, J., Wang, Z., Wang, F., and Jin, X. (2011). Characteristic and forecasting of continuous hail shooting processes caused by the north China cold vortex (in Chinese). Plateau Meteorol. 30 (4), 1119–1131.
Li, S., Ren, H., Gao, Z., Yin, L., and Yang, X. (2022). Temporal and spatial distribution of precipitation related to northeast cold vortex in warm season in Jinlin Province during 1981-2019. Chin. J. Atmos. Sci. 46 (1), 1–14.
Ma, Y., Dong, H., Hao, Y., and Gong, M. (2021). Contrastive analysis for environmental conditions of three co-existence convective processes at Qingdao under the background of cold vortex over North China. Periodical Ocean Univ. China 51 (4), 13–20.
Shen, X., Zhang, C., Gao, H., Wang, L., and Li, X. (2020). Classification and dynamic composite analysis of three kinds of high altitude cold vortex (in Chinese). Torrential Rain Disasters 39 (1), 1–9.
Tian, F., Zhang, X., Xia, K., Sun, J., and Zheng, Y. (2022). Probability forecasting of short-term short-duration heavy rainfall combining ingredients-based methodology and fuzzy logic approach. Atmosphere 13, 1074. doi:10.3390/atmos13071074
Tian, F., Zheng, Y., Zhang, T., Zhang, X., Mao, D., Sun, J., et al. (2015). Statistical characteristics of environmental parameters for warm season short-duration heavy rainfall over central and eastern China. J. Meteorological Res. 29 (3), 370–384. doi:10.1007/s13351-014-4119-y
Yang, S., Chen, Y., Li, S., Xiao, T., and Ling, T. (2016). Analysis of squall lines under the background of cold vortex. Meteorol. Mon. 42 (9), 1079–1089.
Yu, X., Zhou, X., and Wang, X. (2012). The advances in the nowcasting techniques on thunderstorms and severe convection. Acta Meteorol. Sin. 70 (3), 311–337.
Yu, Z., He, L., Fan, G., Li, Z., and Su, Y. (2011). The basic features of the severe convection at the background of cold vortex over North China. Chin. J. Trop. Meteorology 27 (1), 89–94.
Zang, Z., Luo, J., and Ha, Y. (2022). Interdecadal increase in summertime extreme precipitation over east China in the late 1990’s. Front. Earth Sci. 10, 969853. doi:10.3389/feart.2022.969853
Zhang, C., Zhang, Q., Wang, Y., and Liang, X. (2008). Climatology of warm season cold vortices in east asia: 1979–2005. Meteorol. Atmos. Phys. 100, 291–301. doi:10.1007/s00703-008-0310-y
Zhao, Y., Deng, L., Li, Z., and Wang, Y. (2022). Quantitative attribution of vertical motion responsible for summer heavy rainfall over North China. J. Geophys. Res. Atmos. 127, e2021JD035765. https://doi. org/10.1029/2021JD035765.
Keywords: North China cold vortices, short-duration heavy rainfall, spatial-temporal features, environmental parameters, probability forecasting
Citation: Xing N, Zhang Y, Li S, Dai Y, Hao C, Li J and Zhi X (2023) The features and probability forecasting of short–duration heavy rainfall in the Beijing-Tianjin-Hebei region caused by North China cold vortices. Front. Environ. Sci. 10:1101602. doi: 10.3389/fenvs.2022.1101602
Received: 18 November 2022; Accepted: 27 December 2022;
Published: 12 January 2023.
Edited by:
Yucong Miao, Chinese Academy of Meteorological Sciences, ChinaReviewed by:
Guicai Ning, The Chinese University of Hong Kong, ChinaCopyright © 2023 Xing, Zhang, Li, Dai, Hao, Li and Zhi. This is an open-access article distributed under the terms of the Creative Commons Attribution License (CC BY). The use, distribution or reproduction in other forums is permitted, provided the original author(s) and the copyright owner(s) are credited and that the original publication in this journal is cited, in accordance with accepted academic practice. No use, distribution or reproduction is permitted which does not comply with these terms.
*Correspondence: Yingxin Zhang, emhhbmd5eDlAc2luYS5jb20=
Disclaimer: All claims expressed in this article are solely those of the authors and do not necessarily represent those of their affiliated organizations, or those of the publisher, the editors and the reviewers. Any product that may be evaluated in this article or claim that may be made by its manufacturer is not guaranteed or endorsed by the publisher.
Research integrity at Frontiers
Learn more about the work of our research integrity team to safeguard the quality of each article we publish.