
95% of researchers rate our articles as excellent or good
Learn more about the work of our research integrity team to safeguard the quality of each article we publish.
Find out more
ORIGINAL RESEARCH article
Front. Environ. Sci. , 20 January 2023
Sec. Environmental Economics and Management
Volume 10 - 2022 | https://doi.org/10.3389/fenvs.2022.1101080
This article is part of the Research Topic Environmental Governance in Resilient Cities: Multidisciplinary Approaches View all 8 articles
 Shiwen Huang1,2
 Wei Song1,3*He Gao1
 Congjie Cao1
 Junfang Li1Bo Liu1Hao Yu1Shuchang Li1Xi Wei1Shuangqing Sheng1
Rapid urbanization leads to changes in ecosystem services and may exacerbate ecological risks. Clarifying the relationship between these two factors in a specific context is essential to explore the integrated management model and achieve sustainable regional development. However, previous studies mainly lack an integrated analysis, fail to clearly explain the mechanism of ecosystem change, and can neither support landscape ecological security construction nor spatial planning and management. This study, using the urban agglomeration on the northern slope of the Tianshan Mountains (UANSTM) as an example, applied multi-source data from 2010 to 2020, investigated the changes and relationships between ecological risks and ecosystem services, and proposes an assessment framework. The total ecosystem services (TES) of the studied agglomeration showed a decreasing trend, with an overall loss of 0.43%. Corresponding to the decrease of ecosystem services, the ecological risk was higher in the south and north of the UANSTM and lower in the northwestern, central, and eastern regions. The proportion of ecological high-risk areas was expanding. The key to the relationship between ecological risks and ecosystem services is the change in hydrological conditions. Therefore, we suggest that the UANSTM actively transforms the development and use mode of water resources and coordinates their allocation, aiming to reduce regional ecological risks and optimize the pattern of ecosystem services.
Urbanization promotes social and economic development but also leads to profound ecosystem changes (Grimm et al., 2008; Niemela et al., 2010), resulting in deteriorating ecosystem services (Liao et al., 2018). According to the results of the Millennium Ecosystem Assessment, more than 60% of the ecosystem services are currently degenerating or transforming (La Notte et al., 2017). The degeneration of ecosystem services is closely linked to rapid urbanization, with land use change as the main driver (Fang et al., 2019), posing significant risks to ecosystems (Wolff et al., 2015; Wong et al., 2015), as well as human health and wellbeing (Tang et al., 2018). Because of the higher level of urbanization across the globe, sustainable development of cities has become one of the most daunting challenges mankind faces in the 21st century. Sustainable development considers the sustainability and support capacity of ecosystems under the influence of human activities. Improving ecological services and preventing ecological risks are at the base of human survival and development and the basic preconditions for achieving sustainable development. Against the background of a growing population and the subsequent resource and environmental and social problems, the measurement of ecological risks and ecosystem services can provide indicators for regional sustainable development. Currently, most countries face severe ecological risks (Brahmasrene and Lee, 2017), with China being one of the most impacted countries. China’s ongoing rapid urbanization results in widespread ecosystem degeneration (Tang et al., 2018), and to propose targeted solutions to ecological and environmental problems and sustainable development strategies, regional ecological risks should be systematically assessed, and changes in ecosystem functions need to be understood. Furthermore, exploring the relationships between ecological risks and ecosystem services can provide a reference to follow-up goals, including improving regional ecosystem functions and building regional patterns for ecological security. In this sense, it is of great significance to both the theoretical and practical aspects of promoting sustainable development.
Ecosystem services and ecological risks are often treated and researched as separate topics. The latter refers to the pressures external factors impose on the structure and functions of an ecosystem. Ecological risks describe the potential negative impacts of human activities and natural disasters on ecosystems (Norton et al., 1992; Xing et al., 2020), and ecological risk evaluation is an effective measure to determine and mitigate ecosystem degeneration (Estoque and Murayama, 2014; Yang et al., 2022; Zhi et al., 2022) and to understand the negative impacts of various factors on ecosystems (Luo et al., 2018; Zhai et al., 2020; Wang et al., 2021). The term ecosystem services is used to describe the ability of an ecosystem to provide services to humans, emphasizing the importance of the natural environment for human society (Small et al., 2017; Wu et al., 2020). Ecosystem service values are closely related to ecosystem processes and human wellbeing and reflect whether the relationships between regional ecosystems and human society are harmonious and mutually beneficial (Costanza, 2012). In recent years, the number of studies on ecological risks and ecosystem services has increased. To realize sustainable development, it is crucial to reduce ecological risks and enhance ecosystem services (Ouyang et al., 2016; Reyers and Selig, 2020). However, considering their respective spatial ranges and research scopes, the relationship between ecological risks and ecosystem services is not strictly a synergistic one, and the associations and responses between them need to be investigated to explore an effective approach for sustainable development (Cao et al., 2019).
Ecological risk evaluation is an efficient measure to determine the sustainability of a region or landscape (Xu et al., 2015). Different ecological features and risks are usually attributed to spatial heterogeneity and the difference in the time sequence. There are two main types of evaluation methods. The landscape metrics method, which is based on land usage, focuses on the composite ecological risks for different landform combinations. For example, Graham et al. took into consideration the connections between land and aquatic landscapes and used a contagion index to evaluate the regional ecological risks (Graham et al., 1991), whereas Zhang et al. (2018) combined the Landscape Disturbance Index with the Landscape Vulnerability Index and created a temporal and spatial model to evaluate the ecological risk level. The second method is based on the source-sink theory. It evaluates the ecological risks in the target region by estimating the spatial diffusion of a particular risk source in the entire region or, alternatively, the sink. Wu et al. (2021a) conducted a quantified evaluation of regional ecological risks by combining the source-sink theory and the pressure-exposure-response principles for such risks. Although the two methods apply different principles and theories, they follow the same risk characteristics paradigm, namely, the multiplication of probability and loss, which means that an ecological risk equals the probability that the risk would occur multiplied by the potential loss that would occur if the risk appeared.
Ecosystem services are essential for sustainable ecosystem management, and a pattern-scale-function-driver research paradigm has been established. Evaluation methods mainly include the mass method, the value method, and the energy method, and models are widely used in evaluation. For example, Wang et al. (2022) evaluated the carbon storage (CS), water yield (WY), and soil conservation (SC) of the Loess Plateau from 2000 to 2018, using three different models, namely, CASA, InVEST, and RUSLE. The authors discussed the spatial heterogeneity, tradeoffs, synergies, and driving forces for this region. Bejagam et al, (2022) used the InVEST water volume model to analyze the impacts of climate change on water resource-related services (such as water volume and hydroelectric generation) in the Tungabhadra water area. The authors evaluated the sensitivity of the water investment model using data from 1971 to 2000 and predicted how climate change would affect water supply services from 2021 to 2040.
Landscape patterns and ecosystem services are the foundation for research focusing on landscape sustainability (Peng et al., 2021). However, the current evaluation system emphasizes the tradeoffs and synergies among ecosystem services (Maes et al., 2019; Zhou et al., 2019), largely neglecting the security of landscape patterns and the comprehensive relationships among ecosystem services. Social-ecological sustainable development can never be fully understood when the focus is solely on one aspect (Wang et al., 2021). Nevertheless, the landscape pattern index leans more toward describing the sedative landscape pattern, but it does not take into account ecosystem processes and functions and can, therefore, not support the security construction and spatial management of landscape ecosystems (Deacon et al., 2015; Wang et al., 2021; Liang and Song, 2022; Aziz, 2023). Currently, research on landscape ecological risks and ecosystem services is developing toward the same direction, but studies mainly focus incorporating ecosystem services into the ecological risk evaluation system. For example, Xing et al. (2020) used Hubei Province, China, as an example and proposed a composite regional ecological risk evaluation framework containing ecosystem services and uncertainties. Similarly, Malekmohammadi and Blouchi (2014) proposed a set of management strategies for different risk levels based on their research on the values, functions, and relevant risks of a wetland ecosystem. Although the relationship between the service values and risks of ecosystems has been explored, relevant papers only reported the presence or absence of associations, largely neglecting the potential impacts of ecological risks on ecosystem service values and individual ecosystem functions. In this context, it is difficult to determine the relationship between ecological risks and ecosystem services (Faber and Van Wensem, 2012; Nienstedt et al., 2012).
The urban agglomeration on the northern slope of the Tianshan Mountains (UANSTM) is located in the central area of the Eurasian continent and is the most developed area in the Xinjiang Uyghur Autonomous Region, China. Geographically, it is in the arid western parts of China. As part of the core area of the Silk Road Economic Belt, the UANSTM plays a piloting role. While urbanization promotes economic development, it also leads to more severe ecological and environmental issues in the UANSTM (Yan et al., 2021), such as environmental degradation because of the ecological fragility of the area, a conflicting supply and demand of water resources, an unreasonable water usage structure, and a low water use efficiency. These issues seriously restrict the sustainable development of the region (Fang et al., 2019; Zhi et al., 2022). In addition, the ecological security of the land in the UANSTM is also under pressure in many aspects, which mainly manifests itself in the reduction of forest and grassland areas and the decline in habitat quality, leading to a decrease in ecosystem functions. In this sense, investigating the ecological risks and ecosystem services of the UANSTM is crucial to safeguard the ecological security of this urban agglomeration.
This study, using the UANSTM as the research area, focuses on the integration of ecosystem services based on landscape pattern changes, with ecological risk assessment. Ecological risk factors were selected based on four aspects: terrain sensitivity, ecological resilience, landscape vulnerability, and ecological sensitivity. Based on the idea of “ecological risk assessment-ecosystem service assessment-ecological risk assessment matrix construction,” the temporal and spatial variation characteristics of the two factors were analyzed. Using the bivariate spatial autocorrelation analysis method, the relationship between 2010 and 2020 was comprehensively analyzed to provide a case study for integrating ecosystem services into the framework of ecological risk assessment and offer a novel solution direction for reducing the ecological risks of urban agglomerations in arid areas. The objectives of this study were as follows: i) to evaluate the ecological risks and ecosystem service spatial distribution patterns for 2010 and 2020; ii) to quantify the responses from ecosystem service bundles and ecological risks; and iii) to integrate ecological risks and ecosystem services into the planning of ecosystem function zones and provide suggestions and measures for regional development management.
The UANSTM is located in the center of Eurasia (Figure 1). It expands from 83°24′ E to 91°54′ E in an east–west direction and 41°11′ N to 46°12′ N from south to north. The agglomeration is bordered by the Gurbantünggüt Desert in the north, the Tianshan Mountains in the south, Jinghe County of Bortala Mongolian Autonomous Prefecture in the west, and the Balikun Kazakh Autonomous County in Hami City in the east. The average elevation is approximately 1,000 m. The total area of the urban agglomeration is 215,400 km2, accounting for 13% of Xinjiang’s total area, and the municipal administrative units include Urumqi, Wujiaqu, Changji Hui People Autonomous Prefecture, Turpan, Shihezi, Karamay, Kuitun, Wusu, and Shawan City,.
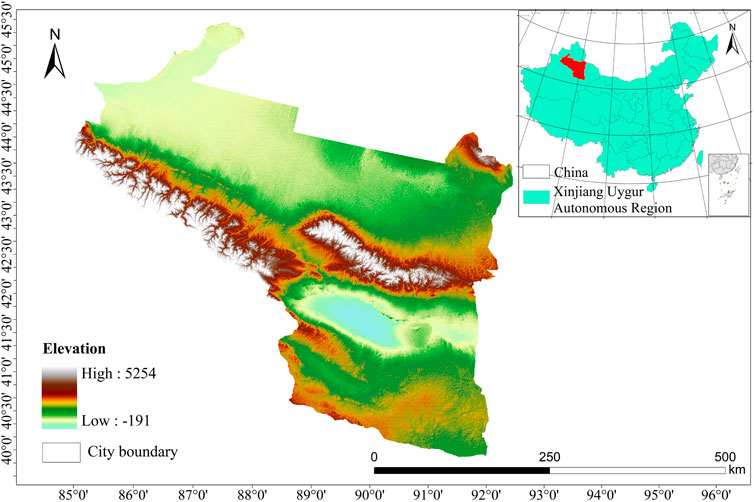
FIGURE 1. Location of UANSTM.
The UANSTM has the most developed economy and transportation system, the densest population, and the most concentrated industry in Xinjiang. It plays an essential role in constructing the core area of the Silk Economic Belt in the new era, is crucial to the national security, and serves as a key facilitator in achieving new urbanization in Xinjiang, a task set in the 14th Five-Year Plan and the 2035 Long-Term Goal. The climate is temperate continental climate, with large diurnal temperature variations and a large annual variation. The ecological environment in this region is fragile, and under the combined impacts of human activities and climate, it faces shortages of resources and land. As a result of salinization, glacier retreat, and the ecological fragility of this region, environmental degradation is serious. The fragile ecological environment largely restricts the sustainable development of the social economy of the UANSTM.
This study used geographical, climatological, and soil data (Table 1).
1) Geographical data included land use data from the Data Center for Resources and Environmental Sciences with a resolution of 30 m (https://www.resdc.cn/), digital elevation model (DEM) data from the Geospatial Data Cloud with a resolution of 30 m, from which slope and relief amplitude were extracted (http://www.gscloud.cn/), normalized difference vegetation index (NDVI) data from the China National Space Administration (http://www.cnsa.gov.cn/), and river basin data from the National Geomatics Center of China (http://www.ngcc.cn/ngcc/).
2) Climatology data included vegetation transpiration, precipitation, potential evapotranspiration, temperature, and wind speed data, all obtained from the China Meteorological Network and with a resolution of 1,000 m (http://www.cma.gov.cn/).
3) Soil data included soil type information as the levels of sand, silt, clay, and organic matter, obtained from the Soil Science Data Base and with a resolution of 1,000 m (http://vdb3.soil.csdb.cn/). Soil depth and available water content data at a resolution of 1,000 m were obtained from the Harmonized World Soil Database (http://www.iiasa.ac.at/).
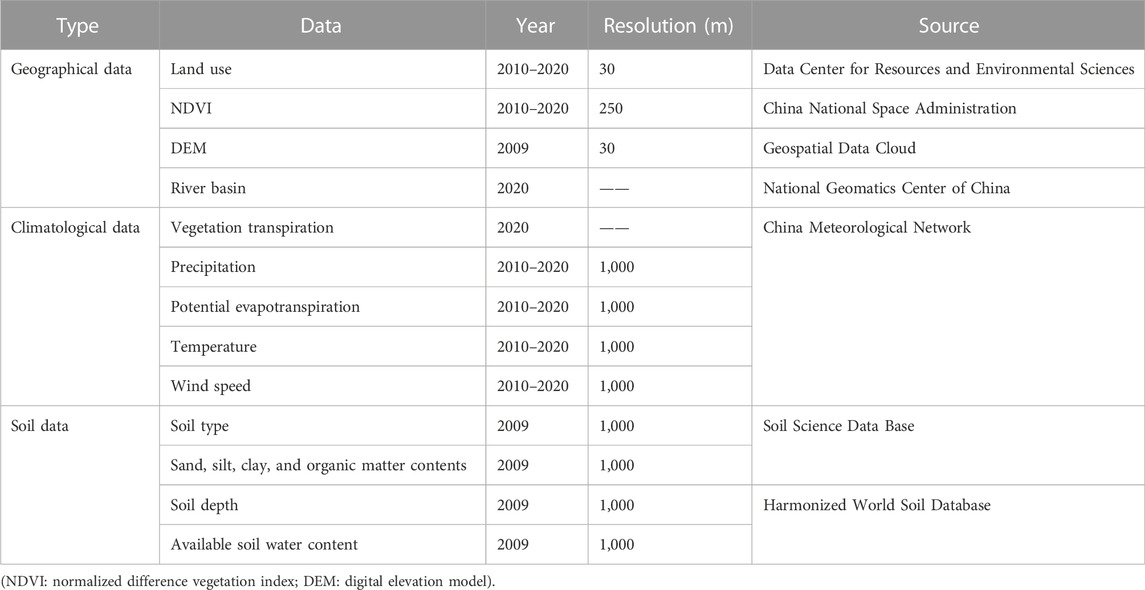
TABLE 1. Data sources used in this study.
We propose a three-step evaluation framework for ecological risks and ecosystem services in the UANSTM (Figure 2): ecological risk evaluation, ecosystem service evaluation, two-dimensional ecological risk matrix building, and bivariant spatial autocorrelation calculation. Step 1 consisted of the selection of environmental risk factors to evaluate the UANSTM’s ecological risks based on the four aspects, namely, landform sensitivity, ecological resilience, landscape vulnerability, and ecological sensitivity. In step 2, the negative impacts of land use changes on the UANSTM from 2010 to 2020 were evaluated, using the InVEST model to evaluate the three key ecosystem services (water production, habitat quality, and soil conservation). In step 3, the two-dimensional ecological risk matrix was generated to evaluate the relationship between ecological risks and ecosystem services, facilitating the drawing of quantitative results.
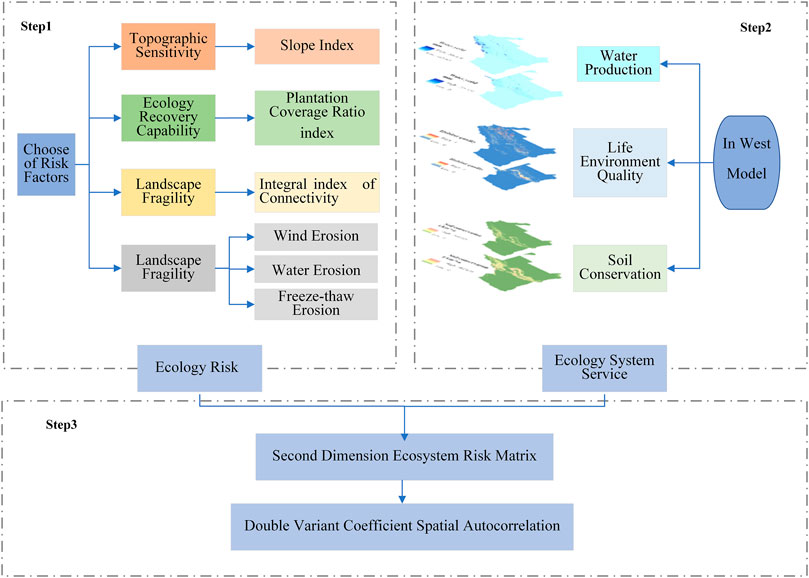
FIGURE 2. Evaluation frameworks for ecological risks and ecosystem services.
The UANSTM is a complex agglomeration that includes urban and natural landscapes. In recent years, due to population growth and the continuous expansion of construction land, various ecological and environmental problems, such as declining air quality and water pollution, have surfaced. Therefore, for ecological risk assessment, five factors were selected as the ecological risk factors in this region. According to the ecological risk characterization paradigm “probability and loss multiplication” thinking, the corresponding ecological risk probability is defined as the probability of the occurrence of factors that would result in the reduction of the ecosystem service values in a certain period.
This study selected and quantified the slope index as the landform sensitivity indicator for calculating risk probability. The slope information was based on DEM data. The larger a slope, the more likely it is for natural disasters, such as landslides or mudslides, to occur (Zhang et al., 2021).
Ecological resilience is the adaptability and resilience of ecosystems to risks, defined as the ability of a system to absorb or resist disturbances before reaching the threshold for transition. We quantified ecological resilience by using the vegetation factional cover (VFC), which refers to the percentage of the vertical projection area of vegetation (including leaves, stems, and branches) on the ground to the total area of the study region. The VFC is often used in studies on vegetation change, ecological environment research, soil and water conservation, and climate, among others. A more practical method is the use of a vegetation index to approximate the VFC, and the commonly used index is the NDVI. Generally, the higher the vegetation cover, the greater the ecological resilience. The calculation formula is as follows (Zhang et al., 2019):
where
Landscape vulnerability indicates the ability of a given landscape type to resist external disturbances. Landscapes that are less able to endure disturbances are more vulnerable and consequently face greater ecological risks. The ecological risk level of a given region is related to the landscape vulnerability of this and quantified by the integral index of connectivity (IIC). The index can measure the degree of connectivity of regional ecological processes as maintaining good connectivity is essential for biodiversity conservation and ecosystem balance. Landscape vulnerability decreases with increasing IIC levels; the IIC is calculated as follows (Hashemi and Darabi, 2022):
where n is the total amount of green patches,
Ecological sensitivity refers to the level of sensitivity of a given ecosystem to disturbances imposed by natural and human activities and indicates the likelihood of ecological problems to occur when the ecosystem is disturbed. We used the strengths of water erosion, wind erosion, and frozen-thaw erosion as characteristics to quantify the ecological sensitivity.
1) Wind erosion. Wind erosion is a composite effect of the climate and various other factors, including wind speed, precipitation, and temperature. Because of this, any change in the wind erosive factors could result in changes in wind erosion. We used wind erosion factors to assess wind erosion, applying the following equation (Zhang et al., 2022):
where
2) Water erosion. We used the Revised Universal Soil Loss Equation (RUSLE) to calculate the water erosion strength, with the following equation (Zhang et al., 2022):
where
3) Frozen-thaw erosion. The slope, slope strike, annual precipitation, and VFC are factors that need to be considered when assessing frozen-thaw erosion. After standardization, assigning weights, and calculating the weighted average, the frozen-thaw erosion strength was achieved, using the following equation (Lu et al., 2019):
where F is the frozen-thaw erosion indicator, n is the number of factors,
Water conservation is one of the most important ecosystem services. Ecosystems can provide the water needed for human production and life, ensuring steady economic and social development in a sustainable manner. The water production module in the InVEST model is mainly used to calculate the water yield of ecosystems (Wu et al., 2021b). This module is based on the principle of water balance, subtracting the actual evapotranspiration from the amount of precipitation in each grid. The equations are as follows:
where
Habitat quality indicates an ecosystem’s ability to provide suitable habitats for various species (Wu et al., 2021b). For areas with more connected patches and fewer isolated ones, habitat quality is high because there would be less human interference. Factors such as the land use structure and land development level can directly influence habitat quality; it is calculated as follows (Liang and Song, 2022):
where
Soil conservation is a multi-faceted ecosystem service that can help maintain soil nutrients, assisting the soil in providing good growth conditions and sufficient nutrients for various species. Based on the general soil erosion equation, the potential soil erosion of different landscape types was calculated in the case of bare ground, using the following equation (Aziz, 2023):
where
In this study, the UANSTM’s total ecosystem services are considered as the sum of the aforementioned three key services, namely, soil conservation, water production, and habitat quality (Gibbs, 2011). The following equation was used:
where
where
We used Arc GIS 10.7 to classify the aforementioned risk probability indicators into five levels: 1, 2, 3, 4, and 5. The higher the level, the higher the probability of ecological risks; the combined maximum method was used to obtain a composite evaluation of the probability. That is, if any indicator in the grid has a higher level, the probability of risks occurring in that grid is high. The discrete coefficient method was used to construct a composite index of the aforementioned three ecosystem services, and the following formula was used to characterize ecological loss (Zhang et al., 2022). Finally, based on the comprehensive assessment results of probability and loss, a two-dimensional matrix of ecological risk assessment was constructed. Calculation was performed as follows:
where
The bivariate spatial autocorrelation model is a type of exploratory spatial data analysis (ESDA). Generally, ESDA can reveal the spatial pattern and mechanism of a geographical object by describing its spatial distribution, visualizing it, and identifying its spatial layout, agglomeration characteristics, and anomalies (Bi et al., 2007; Acevedo Bohorquez and Velasquez Ceballos, 2008). The ESDA includes global and local spatial autocorrelation. While the first is used to study the overall spatial relationship, the latter is applied to investigate spatial variation (Kang et al., 2016). The ESDA was introduced through ArcGIS and the GeoDa spatial econometrics analysis software, and we constructed a bivariate exploration mechanism between the ecological risk index and ecosystem service value.
Global spatial autocorrelation is usually expressed in terms of Moran’s I exponent. The closer the absolute value of Moran’s I to 1, the stronger the spatial autocorrelation of the study unit. The local indicators of spatial association (LISA) map was used to identify the spatial association patterns of high and low values in ecological risk areas, using the following equations (Wu et al., 2021a):
where I is the ecological risk indicator, i is the ecosystem service value, and j is the bivariant autocorrelation coefficient; xi and xj are the ecological risk indicator and ecosystem service values of a specific unit, respectively, n is the number of units in the study, and ωij is the neighboring weight.
Figure 3 and Figure 4 show the spatial distribution of the ecological risk probability index. The slope is steep in the northwestern and mid-eastern parts and moderate in the south and north. Steep-slope areas are mainly distributed in the high-elevation areas of the UANSTM, such as Wusu City, Shawan County, Manas County, Hutubi County, Changji City, the southern part of Urumqi County, the junction of Fukang City, Jimsar County, Qitai County, and Mulei Kazakh Autonomous County in the south, Dabancheng District, Gaochang District, and the northern part of Shanshan County. The northern and southern areas typically have lower slope values. High VFC values can mainly be found in the northwest and center parts as woodlands and grasslands are largely distributed in this area. High DPC values are mainly concentrated in the northwest and central parts of the UANSTM, whereas low values can be found in the north and southwest because the unused land in these parts of the region impedes ecological processes. Considerable wind erosion is mainly observed in the northeast and south, and wind erosion is particularly strong in Mulei Kazakh Autonomous County because there are more unused sites and less grasslands. Water erosion is high in the northwestern and central parts and low in the north and southeast; Shanshan County is most prone to water erosion, mainly because of its steep terrain and abundant precipitation. The frozen-thaw erosion areas in the UANSTM are relatively small and mostly consistent with the distribution range of water erosion areas, mainly because of the high elevation, low temperatures, and high radiation.
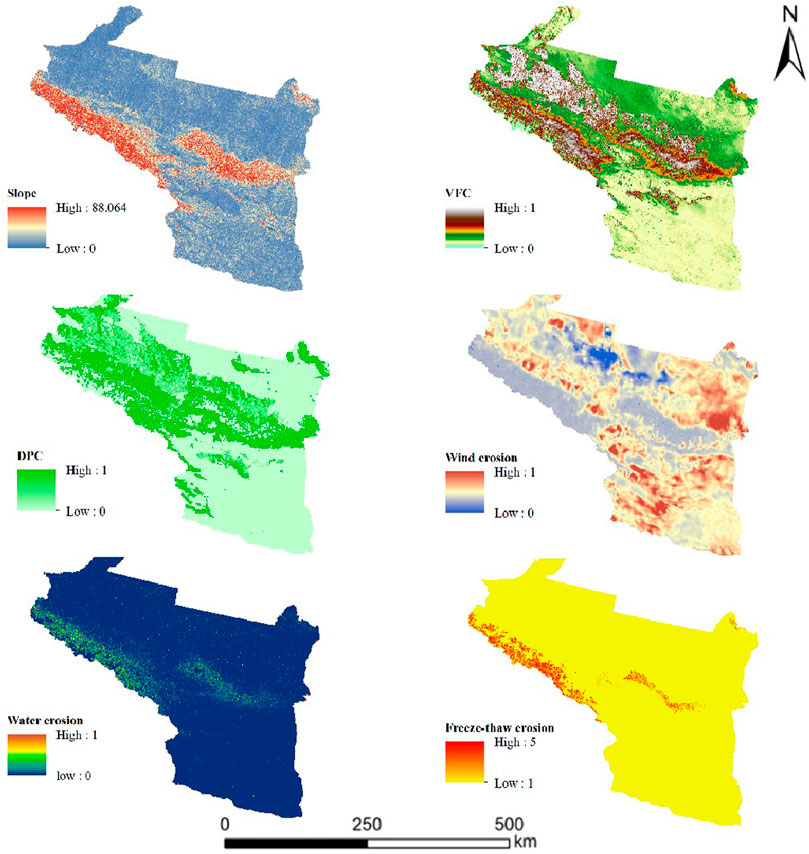
FIGURE 3. Spatial distribution of risk probability index.
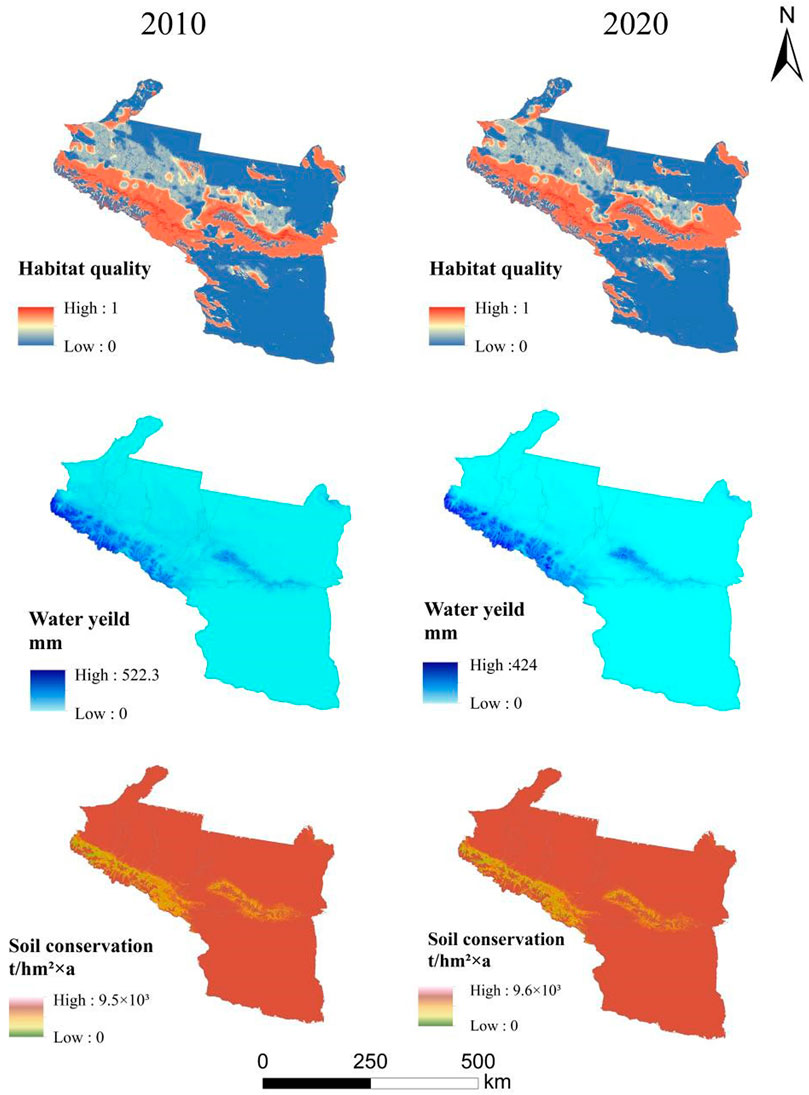
FIGURE 4. Ecosystem service spatial distribution from 2010 to 2020.
Habitat quality showed a spatial decline pattern from the northwest–southeast line to the northern and southern sides. This is because the mild climate, abundant water resources, and rich ecosystems in the northwest-southeast area provide favorable conditions for numerous species. From 2010 to 2020, the spatial distribution pattern of habitat quality in the UANSTM changed significantly; habitat quality decreased significantly in the northwest and improved significantly in the central and eastern areas, and the overall habitat quality increased by 0.13%.
The high water production in the northwest and the low production in the north and south are mainly due to the high VFC and abundant water resources in the northwestern areas. From 2010 to 2020, the water yield of the UANSTM decreased considerably in the southwest and increased slightly in the central and eastern regions. Specifically, the high-value areas were mainly concentrated in the southern mountainous areas such as Wujiu City, Shawan County, and Urumqi, as well as the mountainous woodland areas with generally high WY values. The low-value area was located in the southeast of the urban agglomeration (especially in Shanshan County), and the total water production decreased by 0.34%. Overall, the dry climate, limited rainfall, and high proportion of undeveloped and unused land resulted in a low WY in the UANSTM.
Soil conservation also decreased from the northwest–southeast line to the north and south, mainly because the predominant land use type in this area is grassland, which can intercept rainfall; consequently, more rain can infiltrate the soil, maintaining soil nutrients. From 2010 to 2020, the spatial distribution pattern of soil conservation in the UANSTM changed significantly, among which the soil conservation values in the southwestern, central, and eastern regions increased significantly, and the overall soil conservation increased by 0.12%. High soil conservation values were mainly observed in Urumqi County, Wusu, Shawan, and Changji City, whereas low values were found in the southeastern part of the UANSTM, mainly in Shanshan County, Sen County, and Toksun County.
Overall, the ecosystem services in the UANSTM showed a decreasing trend from the northwest-middle east line to the south and north sides, and the distribution characteristics were consistent with those of the ecological risk probability index (Figure 5A and B). Because the land use type in the northern and southern parts of the study area is mostly unused land, with sparse precipitation, dense evaporation, and large-scale desertification, the total values of ecosystem services in the southern and northern parts of the region were low. In addition, the central and western regions are rich in vegetation, with a wide spatial distribution of grassland and woodland. For instance, the southern part of Changji Hui People Autonomous Prefecture and the northwest of Turpan Prefecture are densely forested, and the total values of ecosystem services are high. From 2010 to 2020, the total ecosystem services in the UANSTM decreased by 0.43%. Spatially, ecosystem services showed drastic changes in the central region but varied less in the north and south (Figure 5C). The areas with the largest declines were Karamay City, central Changji Hui People Autonomous Prefecture, and central Urumqi. The largest increases were observed in the southern part of Changji Hui People Autonomous Prefecture and the southwestern part of Urumqi City.
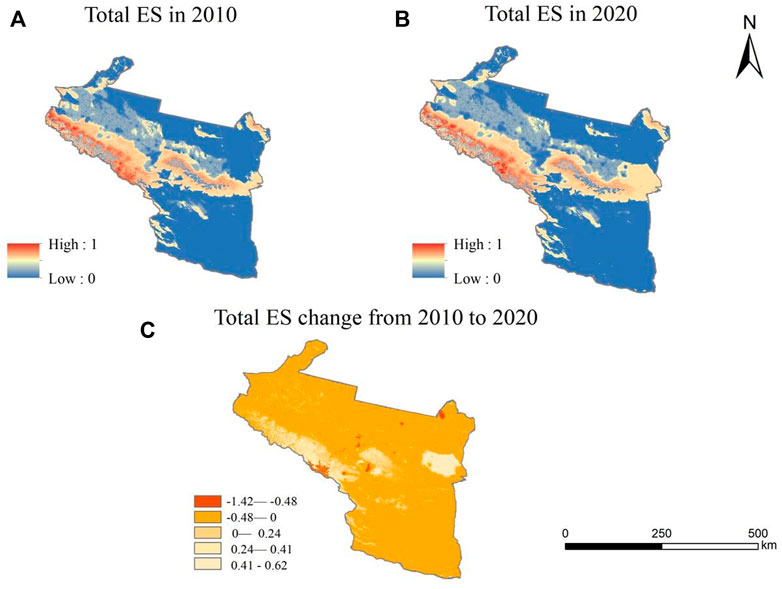
FIGURE 5. Ecosystem services and changes in UANSTM from 2010 to 2020.
The distribution characteristics of ecological risks in the UANSTM are consistent with those of ecosystem services. Based on the natural breakpoint classification method, six risk probability indicators are reclassified to form five levels. The higher the grade, the higher the probability of ecological risk. A comprehensive evaluation result of ecological risk probability was obtained by using the maximum synthesis method (Figure 6). The results of probability integration showed that the ecological risk of the UANSTM increased from the northwest to the middle east, and the distribution characteristics were consistent with those of the ecological risk probability index. The low- and medium-risk areas accounted for a relatively small proportion, whereas the high-risk areas accounted for a relatively large proportion.
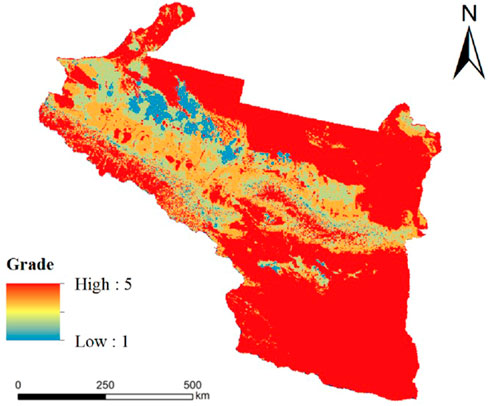
FIGURE 6. Spatial distribution for ecological risk level.
Low and medium risks were concentrated in the northwest, mainly including the northern part of Changji Hui Autonomous Prefecture, the southern part of Karamay City, Yili Kazakh Autonomous Prefecture, and the northern part of Urumqi. In these areas, woodland and grassland are the main land use types, the ecosystem has good integrity and stability, the total ecosystem services are numerous, and the losses are small; consequently, the risk occurrence probability is relatively low. High-risk areas were located in the northern and southern parts of the study area. The VFC in this area was low as the predominant land use type was unused land, with poor landscape connectivity, high wind erosion intensity, few ecosystem services, and high losses, with a high ecological risk. Furthermore, slopes, freeze-thaw erosion, and water erosion in some parts of the central and northwestern parts were considerable, which also resulted in high ecological risks.
Moran’s I is frequently used to investigate the overall distribution and spatial aggregation of a region, but it cannot indicate the spatial correlation. Therefore, the LISA analysis was used to explore the correlation degree of ecological risks in the study area and determine whether there was spatial aggregation. The LISA cluster diagram of ecological risks and ecosystem service loss was used to show local spatial autocorrelation, and the two factors were positively correlated (Figure 7). Four significant autocorrelations emerged in the study area, namely, high-high (HH), low-low (LL), low-high (LH), and high-low (HL). The HH areas were mainly concentrated in the north and south, LL areas in the northwestern, central, and eastern parts, and HL and LH areas were scattered throughout the study region. Areas with higher ecological risks correspond to areas with greater losses of ecosystem services at the spatial scale.
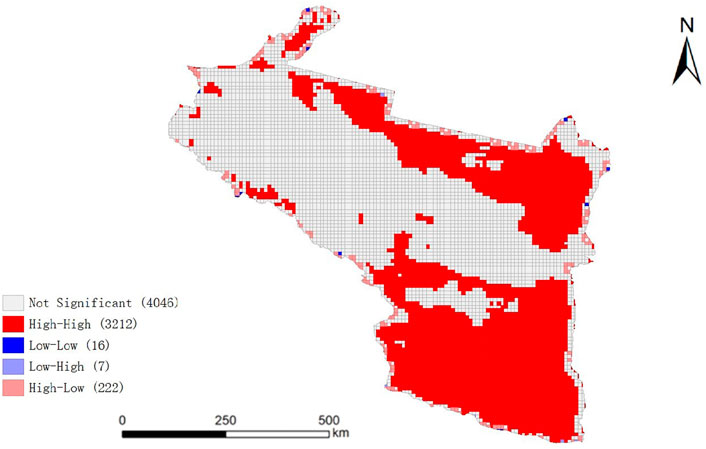
FIGURE 7. Spatial autocorrelation results.
In this study, the ecological risk was negatively correlated with the total number of ecosystem services and positively correlated with the loss of ecosystem services. Since the 1970s, research on ecological risk assessment has been developing gradually (Munns, 2006). The main purpose of ecological risk assessment is to provide decision support for ecosystem protection and management (Wong et al., 2015). However, traditional ecological risk assessment methods are easily affected by the complexity and variability of ecosystems, and it is difficult to take into account the multi-objects that need to be protected in ecosystems (Kang et al., 2016). When only ecological entities are protected, without considering human wellbeing, it is difficult to implement the specific decision-making level. With the continuous improvement of human living standards, ecological risk assessment is gradually becoming an important measure of ecosystem services (Rapport, 2007; Peng et al., 2015). Some authors (Faber and van Wensem, 2012) believe that ecological risk assessment will eventually move toward the relationship between ecosystem processes and services, and the assessment of ecosystem services will serve as the end point of ecological risk assessment, connecting ecological processes with ecological risk sources. An ecological risk assessment framework oriented to ecosystem services can reduce the error between the loss of ecosystem services and the management of complex ecosystems (Galic et al., 2012; Xu et al., 2014).
However, there are three challenges in integrating ecosystem services into regional ecological risk assessment. First, the existing assessment methods tend to focus on a single ecosystem service rather than considering multiple ecosystem services as a whole system (Qian et al., 2022). Second, the analytical framework needs to be further improved to implement comprehensive assessment, focusing not only on the impact on ecosystem services but also on the status of ecosystems (Xu et al., 2014; Wong et al., 2015; Xu et al., 2016). Some researchers suggested that the goal of protection should not only be the provision of diversified ecosystem services but also the maintenance of a high level of ecosystem health (Rapport et al., 1999). A healthy ecosystem is considered as the development goal of environmental management, emphasizing the integrity of the ecosystem and providing the basis for ecosystem assessment (Costanza, 2012). However, until now, few studies have established an ecological risk assessment framework oriented by the combination of ecosystem services and ecosystem health. Nevertheless, compensating for the deficiency of traditional ecological risk assessment methods and improving the efficiency of risk management, the introduction of ecosystem services into ecological risk assessment for development and improvement has become the frontier and hotspot of current ecological risk assessment research (Kang et al., 2016).
This study, using the UANSTM as the study area, evaluated ecological risks by selecting factors based on four aspects: terrain sensitivity, ecological resilience, landscape vulnerability, and ecological sensitivity. It used the InVEST model to quantify the three key ecosystem services, namely, water production, habitat quality, and soil conservation to evaluate the ES pattern. Subsequently, the correlations between ecological risks and ecosystem services were analyzed.
Regarding the methodology, in this paper, four ecological risk probability indicators were calculated, which is consistent with the ecological risk assessment method of Huang et al, (2022) but differs from that used by Qian et al, (2022), which was based on the landscape ecological loss index (LELI) model. Zhang et al. (2022) used two indicators, landscape disturbance and landscape fragility, and applied the landscape pattern index model to accurately evaluate the LER caused by different landscape patterns. The improved ERA model adopted in this paper facilitates the spatial visualization of multi-source ecological risks, provides a scientific basis for strengthening ecosystem management, and adds a response analysis of ecological risks and ecosystem services, making ecological risk assessment more ecologically indicative. In terms of the results, this paper used the data from 2010 to 2020 to evaluate and analyze the ecological risk and ecosystem service pattern of the UANSTM, concluding that ecological risk and ecosystem service loss are positively correlated spatially. However, Zhang et al, (2022) took the Xi’an metropolitan area as the research area and used remote sensing data from 2010 to 2020 to explore the relationship between landscape ecological risks and ecosystem services (such as carbon sequestration, soil conservation, water yield, crop yield, and habitat support). The authors concluded that there was no obvious linear relationship between landscape ecological risks and ecosystem services. The two studies produced different results, mostly because of two aspects. First, the Xi’an metropolitan area is relatively small, whereas the UANSTM covers a large area, and there are certain differences in the data on ecological risks and ecosystem services. Second, the methods used were also different; the present study calculated the ecological risk indicators, whereas Zhang et al. used the landscape pattern index to calculate the ecological risk. The landscape pattern index method only focuses on the fragmentation of static landscape patterns and the vulnerability of land use types, but it does not consider ecosystem processes and environmental conditions. Therefore, the evaluation results are not comprehensive. Aziz (2023) mapped the potential and realized ecosystem services intensity from 140 of Pakistan’s terrestrial protected areas (TPAs) using the Co$ting Nature model, with the potential services being positively and the TPA size being negatively correlated with the realized ecosystem services. The research methodology using in this paper is similar to that applied here. The present study provides a suitable method to investigate the relationship between ecological risks and ecosystem services and represents a scientific reference for subsequent related research.
Our study has some limitations. First, the spatial resolution of the data used needs to be further improved to achieve a more accurate assessment. The meteorological and soil data had a resolution of 1,000 m, which is relatively low. The research area was a relatively small local area, and the low resolution may cause microscopic deviations when making relevant calculations. Second, this paper does not consider the trade-offs and coordination relationships among ecosystem services, which may have a certain impact on the composite index of ecosystem services, which in turn affects ecological loss and risk assessment results. Third, we selected factors based on the four aspects, namely, ecological resilience, landscape vulnerability, terrain sensitivity, and ecological sensitivity, to evaluate the ecological risk, and the selection of factors was subject to certain subjectivity. With this in mind, the establishment of the index system can still be optimized.
According to our understanding and analysis of previous studies and the limitations of this study, the following aspects can be further improved: 1) when conducting small-area research, it is necessary to further improve the accuracy of the data, supplement relevant scientific data, and optimize the index system according to the data availability; 2) in follow-up research, long-term dynamics of key ecosystem services should be explored to make ecological risk assessment predictive; and 3) since the interaction between landscape pattern and ecological processes is highly uncertain, the ecological risk assessment results are not the only constant values, and the identification of areas of uncertainty in risk level should be strengthened to reduce the impact of subjective perception on the assessment results.
Exploring the relationship between ecological risks and ecosystem services is essential to build a regional ecological security pattern and promote sustainable development. This study analyzed the ecological risks and ecosystem services of the arid UANSTM and explored the spatial correlation and responses between them. We observed a significant positive correlation between the loss of ecosystem services and ecological risk. Between 2010 and 2020, the total ecosystem services showed a decreasing trend, with an overall loss of 0.43%. Corresponding to the loss of ecosystem services, the proportion of ecological high-risk areas in the UANSTM has expanded.
In the UANSTM, the northern and southern sides are mostly unused land, and the central area is largely affected by human activities. Coupled with the arid climate, the loss of ecosystem services is considerable, especially regarding water production services. Ecological risks stem from the lower vegetation cover, lower landscape connectivity, and stronger wind erosion, and the link between ecological risks and ecosystem services is based on hydrological changes. Therefore, the UANSTM should focus on the protection and allocation of water resources, pay attention to regional water ecological security, and consider the resource-carrying capacity. We propose to promote irrigation-free afforestation on the northern and southern sides of the UANSTM and to actively change the development and use of water resources, aiming to coordinate the allocation of water resources and ensure the ecological security of this urban agglomeration.
Publicly available datasets were analyzed in this study. All the data used are described in the manuscript.
SH, HY, and WS: methodology, software, and validation. BL, LS, XW, and SS: software, investigation, validation, data curation, and writing—original draft. CC, JL, HG, and WS: methodology, validation, project administration, and writing—review and editing. All authors contributed to the manuscript and approved the submitted version.
This research was supported by the Project of National Natural Science Foundation of China (Grant No. 42071233), the Second Tibetan Plateau Scientific Expedition and Research (Grant No. 2019QZKK0603), and the Project of Panshi Municipal Bureau of Agriculture and Rural Affairs (Outline of the Plan for Building Beautiful Panshi).
The authors thank the native English-speaking experts from the editing team for polishing our paper.
The authors declare that the research was conducted in the absence of any commercial or financial relationships that could be construed as a potential conflict of interest.
All claims expressed in this article are solely those of the authors and do not necessarily represent those of their affiliated organizations, or those of the publisher, the editors, and the reviewers. Any product that may be evaluated in this article, or claim that may be made by its manufacturer, is not guaranteed or endorsed by the publisher.
Acevedo Bohorquez, I., and Velasquez Ceballos, E. (2008). Some concepts of spatial econometrics and exploratory analysis of spatial data. ECOS De. Econ. 12 (27), 9–34.
Aziz, T. (2023). Terrestrial protected areas: Understanding the spatial variation of potential and realized ecosystem services. J. Environ. Manag. 326 (0301-4797), 116803. doi:10.1016/j.jenvman.2022.116803
Bejagam, V., Keesara, V. R., and Sridhar, V. (2022). Impacts of climate change on water provisional services in Tungabhadra basin using InVEST Model. River Res. Appl. 38 (1), 94–106. doi:10.1002/rra.3891
Bi, X., Zhang, W., and Hu, H. (2007). The spatial-temporal evaluation and variability study on the aridity of northern China using ESDA, Geoinformatics 2007. Nanjing: Geospatial Information ScienceSPIE, 972–981.
Brahmasrene, T., and Lee, J. W. (2017). Assessing the dynamic impact of tourism, industrialization, urbanization, and globalization on growth and environment in Southeast Asia. Int. J. Sustain. Dev. World Ecol. 24 (4), 362–371. doi:10.1080/13504509.2016.1238021
Cao, Q. W., Zhang, X. W., Lei, D. M., Guo, L. Y., Sun, X. H., Kong, F. E., et al. (2019). Multi-scenario simulation of landscape ecological risk probability to facilitate different decision-making preferences. J. Clean. Prod. 227, 325–335. doi:10.1016/j.jclepro.2019.03.125
Costanza, R. (2012). Ecosystem health and ecological engineering. Ecol. Eng. 45, 24–29. doi:10.1016/j.ecoleng.2012.03.023
Deacon, S., Norman, S., Nicolette, J., Reub, G., Greene, G., Osborn, R., et al. (2015). Integrating ecosystem services into risk management decisions: Case study with Spanish citrus and the insecticide chlorpyrifos. Sci. Total Environ. 505, 732–739. doi:10.1016/j.scitotenv.2014.10.034
Estoque, R. C., and Murayama, Y. (2014). Measuring sustainability based upon various Perspectives: A case study of a hill station in southeast asia. Ambio 43 (7), 943–956. doi:10.1007/s13280-014-0498-7
Faber, J. H., and van Wensem, J. (2012). Elaborations on the use of the ecosystem services concept for application in ecological risk assessment for soils. Sci. Total Environ. 415, 3–8. doi:10.1016/j.scitotenv.2011.05.059
Fang, C. L., Gao, Q., Zhang, X. L., and Cheng, W. G. (2019). Spatiotemporal characteristics of the expansion of an urban agglomeration and its effect on the eco-environment: Case study on the northern slope of the Tianshan Mountains. Sci. China Earth Sci. 62 (9), 1461–1472. doi:10.1007/s11430-018-9369-x
Galic, N., Schmolke, A., Forbes, V., Baveco, H., and van den Brink, P. J. (2012). The role of ecological models in linking ecological risk assessment to ecosystem services in agroecosystems. Sci. Total Environ. 415, 93–100. doi:10.1016/j.scitotenv.2011.05.065
Gibbs, M. (2011). Ecological risk assessment, prediction, and assessing risk predictions. Risk Anal. 31 (11), 1784–1788. doi:10.1111/j.1539-6924.2011.01605.x
Graham, R., Hunsaker, C., O'neill, R., and Jackson, B. (1991). Ecological risk assessment at the regional scale: Ecological archives a005-001. Ecol. Appl. 1 (2), 196–206. doi:10.2307/1941812
Grimm, N. B., Faeth, S. H., Golubiewski, N. E., Redman, C. L., Wu, J. G., Bai, X. M., et al. (2008). Global change and the ecology of cities. Science 319 (5864), 756–760. doi:10.1126/science.1150195
Hashemi, R., and Darabi, H. (2022). The review of ecological Network indicators in graph theory context: 2014–2021. Int. J. Environ. Res. 16 (2), 24–26. doi:10.1007/s41742-022-00404-x
Huang, X., Wang, X. F., Zhang, X. R., Zhou, C. W., Ma, J. H., and Feng, X. M. (2022). Ecological risk assessment and identification of risk control priority areas based on degradation of ecosystem services: A case study in the Tibetan Plateau. Ecol. Indic. 141, 109078. doi:10.1016/j.ecolind.2022.109078
Kang, P., Chen, W., and Wang Mei, E. (2016). Advancesin ecosystem service-based ecological risk assessment. Acta Ecol. Sin. 36 (5), 1192–1203.
La Notte, A., D'Amato, D., Makinen, H., Paracchini, M. L., Liquete, C., Egoh, B., et al. (2017). Ecosystem services classification: A systems ecology perspective of the cascade framework. Ecol. Indic. 74, 392–402. doi:10.1016/j.ecolind.2016.11.030
Liang, Y., and Song, W. (2022). Integrating potential ecosystem services losses into ecological risk assessment of land use changes: A case study on the qinghai-tibet Plateau. J. Environ. Manag. 318, 115607. doi:10.1016/j.jenvman.2022.115607
Liao, J. F., Jia, Y. Q., Tang, L. N., Huang, Q. L., Wang, Y. Y., Huang, N., et al. (2018). Assessment of urbanization-induced ecological risks in an area with significant ecosystem services based on land use/cover change scenarios. Int. J. Sustain. Dev. World Ecol. 25 (5), 448–457. doi:10.1080/13504509.2017.1415234
Lu, Y., Zhang, T., Liu, Y., You, Y., Feng, C., and Kong, W. (2019). Evaluation and spatial distribution characteristics of freeze-thaw erosion intensity in the Yalu Tsangpo River basin on the basis of geographic information system. Geomatics, Nat. Hazards Risk 10, 1047–1069. doi:10.1080/19475705.2018.1564705
Luo, F. H., Liu, Y. X., Peng, J., and Wu, J. S. (2018). Assessing urban landscape ecological risk through an adaptive cycle framework. Landsc. Urban Plan. 180, 125–134. doi:10.1016/j.landurbplan.2018.08.014
Maes, M. J., Jones, K. E., Toledano, M. B., and Milligan, B. (2019). Mapping synergies and trade-offs between urban ecosystems and the sustainable development goals. Environ. Sci. policy 93, 181–188. doi:10.1016/j.envsci.2018.12.010
Malekmohammadi, B., and Blouchi, L. R. (2014). Ecological risk assessment of wetland ecosystems using multi criteria decision making and geographic information system. Ecol. Indic. 41, 133–144. doi:10.1016/j.ecolind.2014.01.038
Munns, W. R. (2006). Assessing risks to wildlife populations from multiple stressors: Overview of the problem and research needs. Ecol. Soc. 11 (1), art23. doi:10.5751/es-01695-110123
Niemela, J., Saarela, S. R., Soderman, T., Kopperoinen, L., Yli-Pelkonen, V., Vare, S., et al. (2010). Using the ecosystem services approach for better planning and conservation of urban green spaces: A Finland case study. Biodivers. Conserv. 19 (11), 3225–3243. doi:10.1007/s10531-010-9888-8
Nienstedt, K. M., Brock, T. C., van Wensem, J., Montforts, M., Hart, A., Aagaard, A., et al. (2012). Development of a framework based on an ecosystem services approach for deriving specific protection goals for environmental risk assessment of pesticides. Sci. Total Environ. 415, 31–38. doi:10.1016/j.scitotenv.2011.05.057
Norton, S. B., Rodier, D. J., Gentile, J. H., Vanderschalie, W. H., Wood, W. P., and Slimak, M. W. (1992). A framework for ecological risk assessment at the epa. Environ. Toxicol. Chem. 11 (12), 1663–1672. doi:10.1002/etc.5620111202
Ouyang, Z., Zheng, H., Xiao, Y., Polasky, S., Liu, J., Xu, W., et al. (2016). Improvements in ecosystem services from investments in natural capital. Science 352 (6292), 1455–1459. doi:10.1126/science.aaf2295
Pastorok, R. A., Akçakaya, R., Regan, H., Ferson, S., and Bartell, S. M. (2003). Role of ecological modeling in risk assessment. Hum. Ecol. Risk Assess. An Int. J. 9 (4), 939–972. doi:10.1080/713610017
Peng, J., Liu, Y., Corstanje, R., and Meersmans, J. (2021). Promoting sustainable landscape pattern for landscape sustainability, 36. Springer, 1839–1844.
Peng, J., Liu, Y. X., Wu, J. S., Lv, H. L., and Hu, X. X. (2015). Linking ecosystem services and landscape patterns to assess urban ecosystem health: A case study in shenzhen city, China. Landsc. Urban Plan. 143, 56–68. doi:10.1016/j.landurbplan.2015.06.007
Qian, Y., Dong, Z., Yan, Y., and Tang, L. A. (2022). Ecological risk assessment models for simulating impacts of land use and landscape pattern on ecosystem services. Sci. Total Environ. 833, 155218. doi:10.1016/j.scitotenv.2022.155218
Rapport, D. J., Bohm, G., Buckingham, D., Cairns, J., Costanza, R., Karr, J. R., et al. (1999). Ecosystem health: The concept, the ISEH, and the important tasks ahead. Ecosyst. Health 5 (2), 82–90. doi:10.1046/j.1526-0992.1999.09913.x
Rapport, D. J. (2007). Sustainability science: An ecohealth perspective. Sustain. Sci. 2 (1), 77–84. doi:10.1007/s11625-006-0016-3
Reyers, B., and Selig, E. R. (2020). Global targets that reveal the social-ecological interdependencies of sustainable development. Nat. Ecol. Evol. 4 (8), 1011–1019. doi:10.1038/s41559-020-1230-6
Small, N., Munday, M., and Durance, I. (2017). The challenge of valuing ecosystem services that have no material benefits. Glob. Environ. Change 44, 57–67. doi:10.1016/j.gloenvcha.2017.03.005
Tang, L. N., Wang, L., Li, Q. Y., and Zhao, J. Z. (2018). A framework designation for the assessment of urban ecological risks. Int. J. Sustain. Dev. World Ecol. 25 (5), 387–395. doi:10.1080/13504509.2018.1434570
Wang, H., Liu, X. M., Zhao, C. Y., Chang, Y. P., Liu, Y. Y., and Zang, F. (2021). Spatial-temporal pattern analysis of landscape ecological risk assessment based on land use/land cover change in Baishuijiang National nature reserve in Gansu Province, China. Ecol. Indic. 124, 107454. doi:10.1016/j.ecolind.2021.107454
Wang, X., Wu, J., Liu, Y., Hai, X., Shanguan, Z., and Deng, L. (2022). Driving factors of ecosystem services and their spatiotemporal change assessment based on land use types in the Loess Plateau. J. Environ. Manag. 311, 114835. doi:10.1016/j.jenvman.2022.114835
Wolff, Schulp, Schulp, C. J. E., and Verburg, P. H. (2015). Mapping ecosystem services demand: A review of current research and future perspectives. Ecol. Indic. 55, 159–171. doi:10.1016/j.ecolind.2015.03.016
Wong, C. P., Jiang, B., Kinzig, A. P., Lee, K. N., and Ouyang, Z. Y. (2015). Linking ecosystem characteristics to final ecosystem services for public policy. Ecol. Lett. 18 (1), 108–118. doi:10.1111/ele.12389
Wu, J., Zhu, Q., Qiao, N., Wang, Z., Sha, W., Luo, K., et al. (2021). Ecological risk assessment of coal mine area based on “source-sink” landscape theory–A case study of Pingshuo mining area. J. Clean. Prod. 295, 126371. doi:10.1016/j.jclepro.2021.126371
Wu, X. T., Wei, Y. P., Fu, B. J., Wang, S., Zhao, Y., and Moran, E. F. (2020). Evolution and effects of the social-ecological system over a millennium in China's Loess Plateau. Sci. Adv. 6 (41), eabc0276. doi:10.1126/sciadv.abc0276
Wu, Z., Lin, C., Shao, H., Feng, X., Chen, X., and Wang, S. (2021). Ecological risk assessment and difference analysis of pit ponds under different ecological service functions-A case study of Jianghuai ecological Economic Zone. Ecol. Indic. 129, 107860. doi:10.1016/j.ecolind.2021.107860
Xing, L., Hu, M. S., and Wang, Y. (2020). Integrating ecosystem services value and uncertainty into regional ecological risk assessment: A case study of Hubei Province, central China. Sci. Total Environ. 740, 140126. doi:10.1016/j.scitotenv.2020.140126
Xu, E. G., Leung, K. M., Morton, B., and Lee, J. H. (2015). An integrated environmental risk assessment and management framework for enhancing the sustainability of marine protected areas: The Cape d'Aguilar Marine Reserve case study in Hong Kong. Sci. Total Environ. 505, 269–281. doi:10.1016/j.scitotenv.2014.09.088
Xu, X. B., Tan, Y., Chen, S., and Yang, G. S. (2014). Changing patterns and determinants of natural capital in the Yangtze River Delta of China 2000-2010. Sci. Total Environ. 466, 326–337. doi:10.1016/j.scitotenv.2013.07.043
Xu, X. B., Yang, G. S., Tan, Y., Zhuang, Q. L., Li, H. P., Wan, R. R., et al. (2016). Ecological risk assessment of ecosystem services in the Taihu Lake Basin of China from 1985 to 2020. Sci. Total Environ. 554, 7–16. doi:10.1016/j.scitotenv.2016.02.120
Yan, Y. B., Chai, Z. Y., Yang, X. D., Zibibula, S., and Yang, S. T. (2021). The temporal and spatial changes of the ecological environment quality of the urban agglomeration on the northern slope of Tianshan Mountain and the influencing factors. Ecol. Indic. 133, 108380. doi:10.1016/j.ecolind.2021.108380
Yang, Y. P., Chen, J. J., Lan, Y. P., Zhou, G. Q., You, H. T., Han, X. W., et al. (2022). Landscape Pattern and ecological risk assessment in guangxi based on land use change. Int. J. Environ. Res. Public Health 19 (3), 1595. doi:10.3390/ijerph19031595
Zhai, T. L., Wang, J., Fang, Y., Qin, Y., Huang, L. Y., and Chen, Y. (2020). Assessing ecological risks caused by human activities in rapid urbanization coastal areas: Towards an integrated approach to determining key areas of terrestrial-oceanic ecosystems preservation and restoration. Sci. Total Environ. 708, 135153. doi:10.1016/j.scitotenv.2019.135153
Zhang, D. H., Jing, P. Q., Sun, P. J., Ren, H. H., and Ai, Z. M. (2022). The non-significant correlation between landscape ecological risk and ecosystem services in Xi?an Metropolitan Area, China. Ecol. Indic. 141, 109118. doi:10.1016/j.ecolind.2022.109118
Zhang, F., Yushanjiang, A., and Wang, D. (2018). Ecological risk assessment due to land use/cover changes (LUCC) in Jinghe County, Xinjiang, China from 1990 to 2014 based on landscape patterns and spatial statistics. Environ. Earth Sci. 77 (13), 491. doi:10.1007/s12665-018-7676-z
Zhang, M., Wang, J., and Li, S. (2019). Tempo-spatial changes and main anthropogenic influence factors of vegetation fractional coverage in a large-scale opencast coal mine area from 1992 to 2015. J. Clean. Prod. 232, 940–952. doi:10.1016/j.jclepro.2019.05.334
Zhang, X., Du, H., Wang, Y., Chen, Y., Ma, L., and Dong, T. (2021). Watershed landscape ecological risk assessment and landscape pattern optimization: Take Fujiang River Basin as an example. Hum. Ecol. Risk Assess. An Int. J. 27 (9-10), 2254–2276. doi:10.1080/10807039.2021.1970511
Zhi, X. J., Anfuding, G., Yang, G., Gong, P., Wang, C. X., Li, Y., et al. (2022). Evaluation of the water resource carrying capacity on the north slope of the tianshan Mountains, northwest China. Sustainability 14 (3), 1905. doi:10.3390/su14031905
Keywords: arid area, association and response, ecological risk, ecosystem service, UANSTM, China
Citation: Huang S, Song W, Gao H, Cao C, Li J, Liu B, Yu H, Li S, Wei X and Sheng S (2023) Association between ecological risks and ecosystem services in an urban agglomeration in arid China. Front. Environ. Sci. 10:1101080. doi: 10.3389/fenvs.2022.1101080
Received: 17 November 2022; Accepted: 02 December 2022;
Published: 20 January 2023.
Edited by:
Chenchen Shi, Capital University of Economics and Business, ChinaReviewed by:
Xueru Zhang, Hebei University of Economics and Business, ChinaCopyright © 2023 Huang, Song, Gao, Cao, Li, Liu, Yu, Li, Wei and Sheng. This is an open-access article distributed under the terms of the Creative Commons Attribution License (CC BY). The use, distribution or reproduction in other forums is permitted, provided the original author(s) and the copyright owner(s) are credited and that the original publication in this journal is cited, in accordance with accepted academic practice. No use, distribution or reproduction is permitted which does not comply with these terms.
*Correspondence: Wei Song, c29uZ3dAaWdzbnJyLmFjLmNu
Disclaimer: All claims expressed in this article are solely those of the authors and do not necessarily represent those of their affiliated organizations, or those of the publisher, the editors and the reviewers. Any product that may be evaluated in this article or claim that may be made by its manufacturer is not guaranteed or endorsed by the publisher.
Research integrity at Frontiers
Learn more about the work of our research integrity team to safeguard the quality of each article we publish.