 Muhammad Yousaf Raza
 Qiu Zhongpan2*
95% of researchers rate our articles as excellent or good
Learn more about the work of our research integrity team to safeguard the quality of each article we publish.
Find out more
ORIGINAL RESEARCH article
Front. Environ. Sci. , 09 January 2023
Sec. Environmental Economics and Management
Volume 10 - 2022 | https://doi.org/10.3389/fenvs.2022.1099813
This article is part of the Research Topic Institutional Forces, Energy Transition, and Climate Action: Strategies for Achieving Sustainable Development Goals 7 & 13 View all 6 articles
Fossil fuel energy consumption in the agriculture sector of Pakistan has created serious climate change issues, adding extremely to CO2 emissions, economic growth, and food production. The current research has investigated the most carbon-emitting agriculture factors based on human activities, such as transportation, land, multiple crops, distribution, and consumption under various crops. The study objective is to provide a roadmap for decarbonizing the food supply chain and its current framework toward food policy. The different machines and frameworks applied in agricultural farming can mitigate the CO2 emissions of the agriculture sector if renewable energy technologies (RETs) and renewable energy sources are organized with proper agrarian loads. The major concerns of this paper show a roadmap among a) CO2 emissions in the food supply chain and per capita CO2 emissions, b) food chain activities in the agriculture farming process, c) the agriculture output units and energy consumption, and d) the decarbonization of traditional agriculture and sustainable development in the agriculture sector. The analysis shows that the RETs and mitigation frameworks can lessen the CO2 emissions of farming depending on the type of farm and energy utilization. Finally, the present research highlights possibilities and opportunities for gaining CO2 emissions in crop production linked to Pakistan’s good management practices. In respect to agriculture efficiency and productivity, the government should increase the water, energy, and modern machinery for huge productivity and sustainability. Further policies are provided below.
Many scientific studies claim that the increasing share of carbon dioxide (CO2) emissions as greenhouse gas (GHG) adds to global warming and climate change (IPCC Second Assessment on Climate Change, 1996). The growth in both population and sectorial economic doings are the key drivers of increasing energy demand and CO2 emissions in the agriculture sector (Raza and Tang, 2022). Because of the consumption of huge fossil fuels, climate change impacts the climate, poverty, agriculture, income, biodiversity, and industrial income (Lin and Raza, 2019). In addition, fossil fuels and pollution-creating sectors have produced versatile issues, in which climate change has instigated a loss exceeding US$9.6 billion to the economy of Pakistan since 2010 (Pakistan CPEIR, 2017). The reason is that agriculture, manufacturing, and transport add 18.53%, 20.91%, and 13.04%, respectively, to the country’s GDP (Pakistan Economic Survey, 2020).
CO2 emissions from fossils and land use have constantly increased since 19th century after the significant rise in using machines caused by the industrial revolution. Under the Paris Agreement in 2015, a motivation to reduce worldwide temperature to 1.5–2°C above pre-industrial levels started. The key objectives of this agreement are to reduce pollution, which is not so easy to fulfill this target of the current tendencies in CO2 emissions, infrastructure, and populace growth (Höhne et al., 2020). Human activities discharge the maximum GHGs in energy and heat, industries, agriculture, land use, and services sectors. In 2018, agriculture, land use, and forestry added 21% of GHGs globally (Lamb et al., 2022). The CO2 emissions by the economic sector (agriculture) and population from 1990–2019 are shown in Figure 1. The CO2 emissions of the agriculture and per capital sections grew 16.01% and 80% in the previous 30 years. The rise of CO2 emissions in the agriculture sector and population is a consequence of the integral rise of agriculture farming and population. The CO2es primarily come from agriculture, including livestock, crop cultivation, and deforestation (Raza et al., 2021).
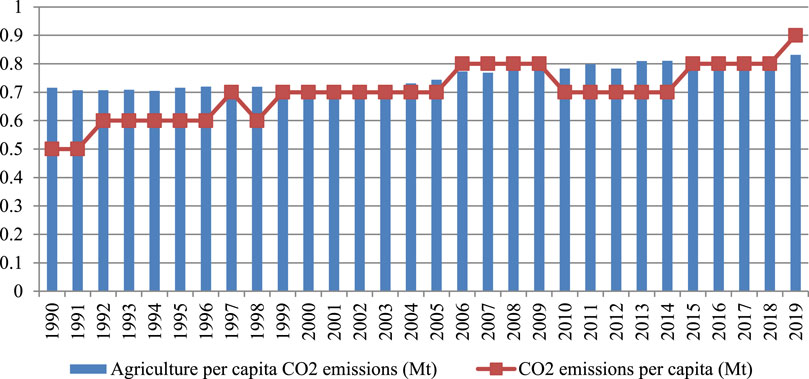
FIGURE 1. Carbon emissions in the agriculture sector and per capita from 1990–2019. Source: (IEA, 2019; Lin and Raza, 2021).
Numerous techniques are applied to investigate the global influence of human activities on earth. The idea of the carbon footprint arises from the environmental footprint established in the 1990s. This measures the number of “earth” that is theoretically needed if individuals use earth resources at a similar level as the individual estimating their environmental footprint (Wackernagel and Rees, 1998). Moreover, a carbon footprint can be stated as; “it is the overall form of GHG emissions due to industry, human, product or an event.” Also, the current statement suggested that it is an estimation of the overall amount of CO2 emissions and methane (CH4) of a limited population, doings or system, taking each resource, storage, and sink inside the geographical and physical population limit, interest, and related movement (Wright et al., 2011).
After the industrial transformation, a huge quantity of energy (coal, oil, and gas) has been widely utilized (Raza and Tang, 2022; Xiuhui and Raza, 2022). Generally, fossil fuels give strong power to economic development; thus, the extensive use of fossil fuels discharges an enormous quantity of CO2 emissions. The modernization of the agriculture industry caused a rapid rise in the CO2 emissions in this sector. Therefore, it is necessary to analyze the key factors adding to the agriculture sectors’ CO2 emissions to alleviate their ecological effect. Except it, the rapid population growth of the world in current times will provide nominal growth in daily consumption (food) demand in the future. This rising demand for food will drive the growth of CO2 emissions from the agriculture sectors (Jiang et al., 2021), which will further worsen global climate change. In addition, regarding agriculture, climate change, production, and energy consumption, Rehman et al. (2020) analyzed the pollution emissions of China’s agriculture sector. They found that CO2 emissions and GHGs have a positive relationship in the long-run. Chandio et al. (2020) investigated the agricultural output effects of different regions of the world from 1982–2014 and found that agricultural land, energy, crops, and fertilizers have positive effects on CO2 emissions. Rehman et al. (2021a) analyzed sectorial energy consumption for Pakistan, including agriculture sector from 1980–2016 and found that there is a long-run relationship between agriculture energy consumption and economic growth. Dagar et al. (2021) analyzed India’s technical efficiency of farmers with distinct volumes across agro-climate zones using a field survey method and found that technical inefficiency with family and hired labor shows about 70% of average farmers are inefficient. Similarly, Rehman et al. (2021b) analyzed the impact of CO2 emissions on forestry, crops and livestock production from 1970–2017 in Pakistan and found that all the factors have a positive relationship with CO2 emissions in the short run. Consequently, the effects of food crops on climate change cannot be undervalued, which plays a wide part in spreading pollution (Boehm et al., 2018). About 19%–29% GHGs of food production and land-freshwater mining adds 70% and employs 1/3rd of ice-free land worldwide (Aleksandrowicz et al., 2019). In addition to that (Aleksandrowicz et al., 2019), the food system will give 60% of the rising population needs by 2050, thus fronting similar challenges, and food production might face huge pressure from environmental change.
Thus, the motivation and novelty of the current study are as follows: i) global agriculture CO2 emissions and energy consumption have grown significantly during the current decades (Raza et al., 2023), and an annual growth of 6% is being experienced during the current decade (Carroll et al., 2018). In addition to the influence of agriculture development and fuel consumption, the pollution factor is found; ii) the study investigates the most polluting activities, including human, faring, and related machineries, and gives a framework for decarbonizing the food supply chain. For this, the study suggests RETs for carbon mitigation and renewable energy sources with proper agrarian load; and iii) behind the economic impact, agriculture development and its contribution to the research and development provide an empirical analysis of free trade1 agreements and climate change agreements on environmental pollution. Moreover, ecological change lessens the elasticity and income of traditional farms (Lin and Raza, 2021). The CO2 emissions of the agriculture division will grow significantly if the food supply system is not revised. The modern framework will provide a new framework to mitigate or reduce the CO2 emissions of agriculture production. Most of agriculture’s production carbon footprint generally comes from machinery, insecticide, and irrigation. As per Soofi et al. (2022), machinery has a large contribution to each agricultural activity on a farm. Substituting machinery, i.e., tractors, harvesters, tube wells, other vehicles in farming, and insecticide processes with clean energy resources and renewable energy technologies (RETs), can mitigate the CO2 emissions of agriculture. Balogh (2022) investigated the agricultural growth and trade on CO2 emissions in the European Union and found that economic growth, agriculture production, and trade cause pollution while non-European Union countries have major contributions to pollution emissions. The technological policies are the best way to enhance the productivity and mitigate the pollution. Deike et al. (2008) analyzed that machinery adds 43.5% to the overall energy contributions in farming; Yu et al. (2020) analyzed China’s agricultural structural emissions reduction, which presents that the secondary industry has played a key role in the final demand outcome, adding above 50% of the final demand result, shadowed by the primary and the tertiary industries, and Raza et al. (2020) investigated that the development of RETs plays an imperative part in reducing carbon emissions, especially in rural areas of Pakistan. Employing these resources to report on these systems’ energy demand is dynamic to mitigate the agriculture sector’s carbon footprint. Consequently, the remaining part of the study is as follows: Section 2 presents the food chain and energy situation; Section 3 presents the measurement of the carbon footprint of traditional farming in Pakistan; Section 4 presents the carbon reduction paths; and Section 5 presents the conclusion and future recommendations.
To understand the food supply system, it is necessary to present a conceptual framework, as shown in Figure 2. Figure 2 shows Pakistan’s agriculture food chain, including agricultural land, industry, allocation, utilization, and energy consumption. All the parts of the food supply chain have critical tasks to be carried out by employing equipment that causes CO2 emissions. For further understanding, the food supply chain has five major phases.
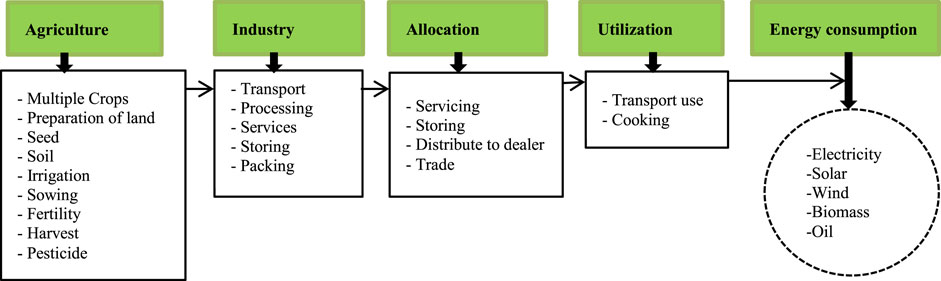
FIGURE 2. Framework based on food chain activities of Pakistan.
Phase one concerns farming (farm production), where wheat, rice, bajra, maize, barley, food gram, sugarcane, rapeseed, mustard, sesame, cotton, and tobacco are produced. In this stage, the crops are considered, and the irrigation land is set by tractors, excavators, loaders, and harvesters. These machines emit carbon emissions and alternatively raise the carbon footprint of the produced food. Tractors and related machinery are used in preparing the soil, cultivating, and plowing the fields, which contain burning engines and consume fossil fuels (Pakistan Economic Survey, 2020). For the healthy growth of plants, irrigation, fertilization, and spraying are compulsory. On the other hand, energy use for irrigation, insect spraying, and fertilization should be taken as a source of CO2 emissions if the electric power source is based on fossil fuels. In the end, some machines (i.e., harvesting, loading, and packaging) are used in the last process. However, these machines utilize a huge quantity of fossil fuels to perform, which is in line with the study by Lin and Raza (2020).
Phase two includes the industrial role in the final production process. This phase presents that the final product is then transported to food manufacturing services. The food supply chain’s service adds a necessary share of the CO2 emissions. As per the IEA (2009) and Raza and Lin (2020), the transportation sector plays a significant role in the context of energy utilization, global warming, oxidization, diseases, etc. As a developing country, these traditional and present machines cannot be ignored suddenly; therefore, modern machines and modern farming outcomes will be limited. Regarding energy consumption, the processing and storage steps use the electrical grid’s electrical energy; thus, this process’s energy use in the industrial section should be estimated2. One of how it can be related to carbon footprint to energy use is to estimate the CO2 emissions generated by a diesel generator unit to produce similar electricity. On the other hand, the carbon footprint is commonly taken for the industrial carbon footprint in this phase.
Phase three includes allocating or distributing foods, as the food is eatable. This phase transports the food to the dealers for export; hence, the traders, dealers, and distributors sell food, create business links, adjust reasonable costs, and add value to their specific product. According to Hertwich and Peters (2009), carbon emissions are linked to the total use of goods and services for 73 countries and 14 aggregate world regions, including food, clothing, mobility, shelter, construction, services, and trade. Thus, servicing the product from industry to dealers contributes to the CO2 emissions of the product. Therefore, the carbon footprint is generally calculated to the transport’s carbon footprint.
Phase four consists of food consumption, in which consumers buy ready foods from various markets or stores. Our concern is that the cooking process causes CO2 emissions, while the carbon footprint is generally added to the household’s carbon footprint. It is important to note that the carrying of foods plays an imperative role in goods transportation; thus, the carbon footprint of the food’s transportation is commonly measured for transport sectors’ carbon footprint (Wright et al., 2011; Soofi et al., 2022). According to Pimentel (2006), the food supply chain uses almost 19% of the overall non-renewable energy burned in the United States (US), of which 7% comes from agriculture production, 7% from processing, and 5% from delivery and food preparation by users. Overall, 2.4% of the total energy consumption of Pakistan was counted in the agriculture sector, where the maximum is concerned with production and transportation (Pakistan Energy Yearbook, 2019). Concerning food wastage, a specific share of food is lost during the overall procedures. This is in line with the studies of multiple developed and developing countries (Lipinski et al., 2013; Balaji and Arshinder, 2016; Raak et al., 2017; Ali et al., 2019). The food supply chain raises the agriculture sector’s carbon footprint in various processing phases. This process is complex to manage since it has time limitations to evade decomposition, CO2 emissions, weighted values, instability, customer demand, reduced food wastage, and packaging demand. As per the country’s level, the food supply chain and security challenges are provided in Table 1. This is imperative because global production of primary crops raised by 53% between 2000–2019 due to the huge use of irrigation, pesticides, and fertilizers, large cultivated area, and high-yield crops (Food and Agriculture Organization, 2021). Growing food export has supported local and global food security, on the other side; they have severely damaged the freshwater ecosystem (Lall et al., 2020). Therefore, it is necessary to discuss the key challenges for Pakistan’s agriculture sector.
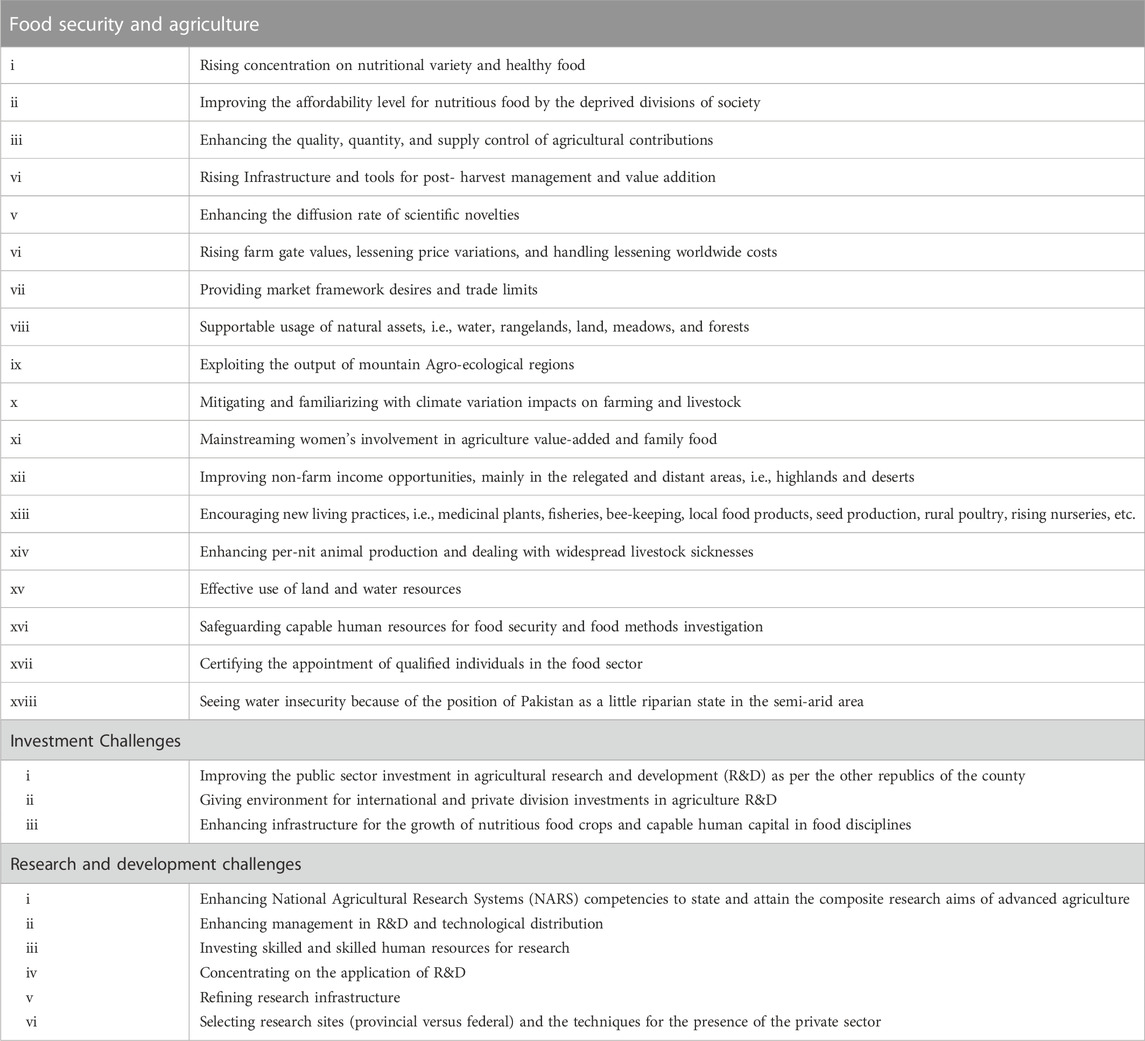
TABLE 1. Key challenges to Pakistan’s food security and agriculture (Ministry of National Food Security and Research, 2018)2.
Over the previous several decades, Pakistan has made great improvements in terms of food production. However, food security remains a major concern due to high population growth, fast urbanization, low purchasing power, high price swings, irregular food supply, and inadequate food delivery networks (Ministry of National Food Security and Research, 2018). As per the Food Security Assessment (FSA) Survey, 18% of the population is undernourished (Food Security Assessment Survey, 2016). The National Institute of Population Studies (NIPS) stated a high level of severe stunting (45%), wasting (15%), and being underweight (30%). The malnourishment issues are high in rural areas (46%) and definite regions such as FATA (58%), GB (51%), and Baluchistan (52%). Similarly, over half of the population uses less than the dietary requirement of vitamin-A and Iron (NIPS, 2018). Food insecurity in Pakistan is mostly due to the poorest and most economically vulnerable people’s inadequate access to food. Finally, industrial locations and services can impact rising CO2 emissions; alternatively, the total carbon footprint of the food supply chain was significantly lessened by positioning the processing, storing, and packing services in regions where maximum energy is produced from renewables (Sim et al., 2007).
Phase five discusses the energy investigation based on two key principles. First is the energy efficiency, which can be stated as the ratio between the gross output of energy in the procedure of agricultural products and the overall demands on fossil fuels, including direct (fuel and electricity) and indirect (input and manufacturing). These are based on the lifecycle method, as shown in Figure 3.
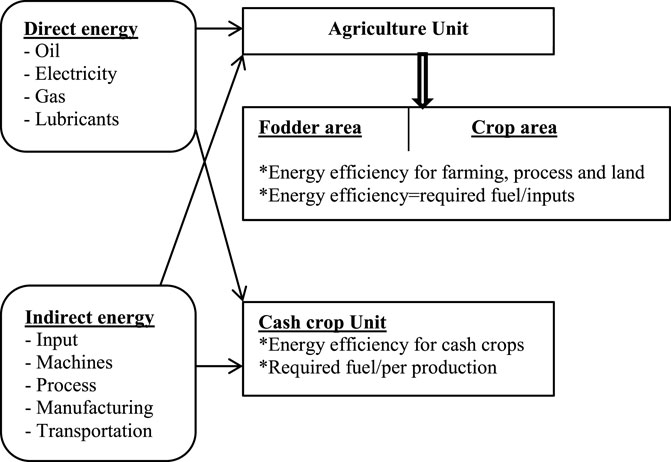
FIGURE 3. Framework based on agricultural energies and output units.
As shown in Table 2, the total farming activity presents the share of cash crops, which signifies that farming energy use is based on farming activities. We estimated the production unit’s overall farming and energy efficiency situation, including agriculture production, land, and machinery, yields, fruits, meats, fertilizers, irrigation, and energy consumption. The energy is based on both renewable and non-renewable production processes, which have been employed by Lin and Raza (2021) to estimate the technical progress of the agriculture sector of Pakistan. Many other studies, for instance, Abdullah et al. (2021) and Zia et al. (2020), focused on bio-energy and Peña-Arancibia et al. (2021) on climate change and the irrigation system of Pakistan. These and many old studies are very limited, and no one has discussed Pakistan’s carbon footprint and farming situation, which is imperative for current literature. To understand the system and aggregated types (see Table 2) show proper units and processes of the agriculture sector. Consequently, this cycle has numerous advantages in providing nutrients and livelihood to humans and creating pollution while processing. Therefore, it is necessary to investigate the major findings linked to the agriculture sector of Pakistan. However, we could not analyze hectare-wise energy consumption and carbon emissions, which could be our limitation (can be considered as individual research). The current research aims to deal with an agriculture carbon footprint as a whole in multiple farming systems in Pakistan.
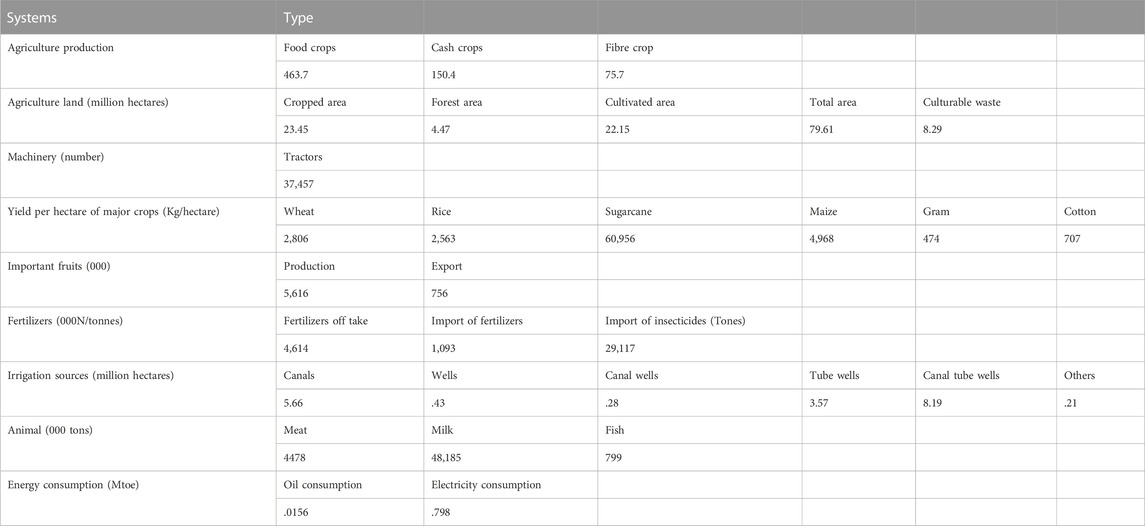
TABLE 2. Overall farming activity of Pakistan as of 2019 (Pakistan Economic Survey, 2020).
Based on a critical literature review on Pakistan as well as in other countries, definitions and frameworks, the study measures the technical efficiency of agriculture productivity3 using these three major phases,: preparation, technology and application inventory, and expert prediction of technology maturity phases, as shown in Figure 4. The key technologies under the literature, for instance, Rehman et al. (2021a) and Lin and Raza (2021) under Pakistan’s agriculture development and technologies is imperative to discuss from the preparation perspective. Phase-II illustrates that the inventories in the agriculture sector include the natural events and industrial inventories for the short-and long-run life cycle. For example, Sinisterra-Solís et al. (2023) analyzed the life cycle inventories of Spanish agriculture and found that environmental scores are consistent with the literature. The technology impact is the only way to reduce costs, risk of deterioration, and damage to products. Phase-III discusses the results of the prototyping and inventory technologies, their implication and experts’ corresponding relationship with the agriculture market. This process is the outcome which analyzes the maturity of individual technology and measures future trends. A roadmap for agriculture development is drawn to serve as a reference for the planning of development strategies by the government and related industries.
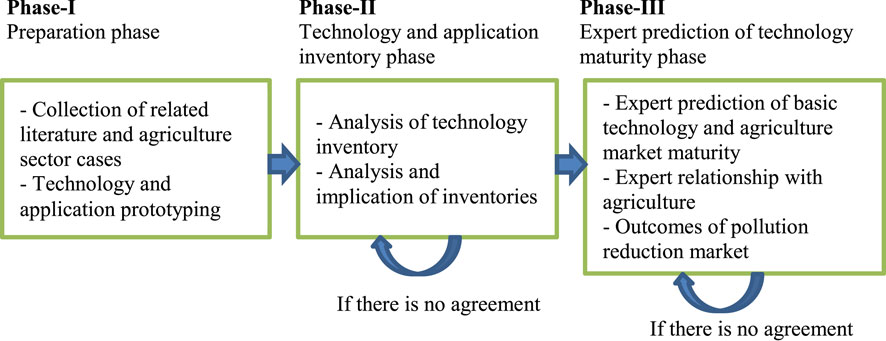
FIGURE 4. Technology roadmap process in the agriculture sector.
The “carbon footprint” and CO2 emissions have broadly applied in today’s discussion against the threat of global warming, which is also rooted in the language of “Ecological Footprint” (Wackernagel and Rees, 1998; Pottier, 2022). Ecological footprint theory has been widely applied in different ways (for example, productive biological functions, underestimating the actual situation, calculating the physical amount of natural capital over the long-run) using the country-level parameters around the world (known as a traditional ecological footprint) (Shujian and Shigai, 2013; Wang et al., 2018; Yang and Yang, 2019). The carbon footprint reveals the degree of the exclusive overall quantity of CO2 emissions that are directly and indirectly attributable to an activity or collected over the product life cycle, which is consistent with (Wiedmann and Minx, 2008). They explored that this term could be employed if all the GHGs were taken in the estimation, instead of only CO2 emissions. As a quantitative measure of GHGs emissions from any activity support carbon emissions management and alleviation. According to Pandey et al. (2011), by calculating GHGs discharges, the emissions source can quantify, and CO2 emissions mitigation parts can be highlighted. However, in the current study, the CO2 emissions of every farming section are discussed.
The carbon footprint of the crop production in terms of land use and yield produced for the major crops of Pakistan was estimated for 2019 using the references of Nationally Determined Contribution, 2021 and Pakistan Economic Survey (2020), respectively, as shown in Table 3. The highest annual carbon emissions were observed for livestock (1,522.9 million numbers and emitted 109.12MtCO2). According to the Pakistan Bureau of Statistics, 2019, livestock having a proportion of 60.07% in agriculture and 11.53% in GDP, attained 3.06% in 2019. While, 7.83 Mt CO2 emissions were observed as the lowest share of rice cultivation under 22.15 million hectares.
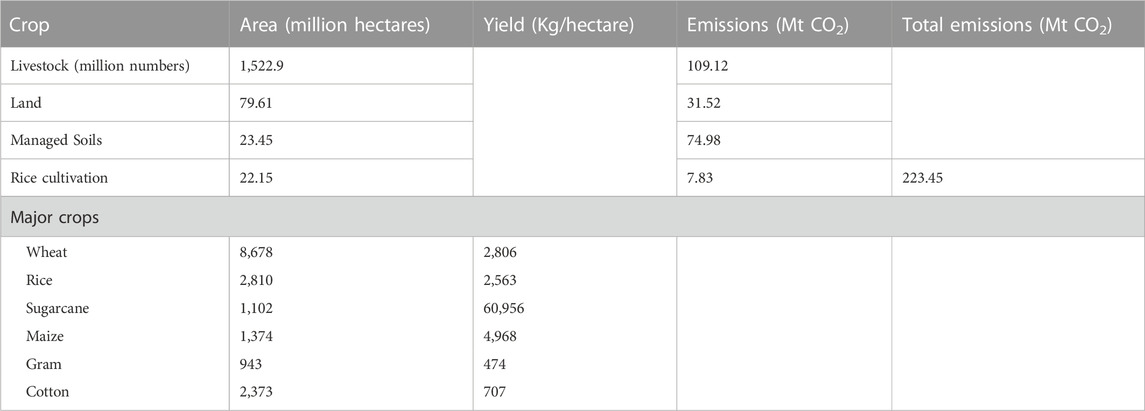
TABLE 3. Comparison of carbon emission footprint between different crops in Pakistan (Pakistan Economic Survey, 2020; Nationally Determined Contribution, 2021)3.
Moreover, emissions from the agricultural soils were 74.98 MtCO2, accounting for 33.55% of overall agriculture emissions, followed by 23.45 million hectares of land. 48.85% of the total CO2 emissions were credited to dung management from livestock, adding 109.12 MtCO2 to the overall carbon emissions output. The remaining 3.50% of the CO2 emissions were from rice farming, followed by burning the crop, adding 7.84 MtCO2, respectively, to the total agricultural CO2 emissions, as shown in Table 3. The results are consistent with the studies of (Cheng et al., 2015; Ijaz and Goheer, 2021). Moreover, the large proportion of livestock with maximum emission factors is the evidence. The lifecycle of major agricultural products, with the aim of carbon footprint, lifecycle valuation measures the CO2 emissions emitted by each product. It should be noted that various CO2 emissions last in the climate for multiple lengths and show different land and yield. Since CO2 emissions have a worldwide warming potential value of one, all data related to CO2 emissions were estimated, employing factors given by IPCC (Ar5 climate change, 2014; Lin and Raza, 2019). For instance, 1-kg of methane causes 25 times more warming influence over a hundred years compared to 1-kg of CO2 emissions, and thus, 1 kg of methane equals 25 kg of CO2 emissions (Brander and Davis, 2012). As shown in Table 3, the CO2 emissions are based on the production of crops, including major crops, fruits, meat, etc. The efforts linked to cultivating the related crop and feeding livestock up to the final readiness for usage as basic material will be included. It is obvious that the measures to uplift the agriculture sector paid off regarding enhanced yield productivity of 2806, 2563, 60956, 4968, 474, and 707 kg/ha under the area of 1,648,16 million hectares in 2019. CO2 emissions as the key engines of ecological change are responsible for the social environment effect that leads to global warming, which has seemed to be 223.45 MtCO2. This is due to the human-driven activities, for instance, burning of fossil fuels, electricity, heat production, agriculture machinery, and land use, which is consistent with (Krapivin et al., 2017). Other activities include transportation, processing, packaging, food preparation, and related technologies. Overall, the analysis shows that the indirect CO2 emissions add to each product’s imperative role. Therefore, the direct GHG emission for agricultural systems includes CO2 emissions from various factors (see Table 3) and fossil fuel energy farm machinery (i.e., tractors, harvesters, threshers, processing machinery, spray related, and soil and fertilization related).
As discussed above, the multiple machines in land preparation, irrigation, processing, and harvesting can only mitigate the CO2 emissions of the agriculture sector. As per Lin and Raza (2021), the electrification of various machines and production processes can lessen the CO2 emissions in Pakistan’s agriculture sector if renewable energy technologies are introduced. However, transportation related to the production process is a major concern. These tools include machinery, irrigation systems, insecticides systems, transportation, renewable energy technologies (RETs), and indoor machinery. Moreover, it mitigates the CO2 emissions of agriculture products, but managing RETs is the key concern to investigate.
As per the United Nations Environment Programme (UNEP) report on waste management, Pakistan has added 30% to food waste (UNEP, 2021). Huge food waste and loss at various supply chain stages can reduce food accessibility in the food market and ultimately raise prices. Consequently, this will impact low-salaried persons as well as impact food safety, the economy, and the country’s sustainability (Soofi et al., 2022). It is revealed that modern farming lessens the food waste in various phases of food supply, thus, employing the RETs in Pakistan, where the maximum share of their energy comes from clean energy. For this, the government of Pakistan has already signed an energy-related agreement with the China–Pakistan Economic Corridor (CPEC), which comprises $33.8 billion for the energy sector (McGarrity, 2015). These projects include a major proportion of renewable energy generation, leading to the country’s green environment and economic sustainability. Moreover, the trade-off between energy networks and modern agriculture farming will create a sustainable community. The RETs will connect electricity grids, product demand, and related community needs over the future, especially energy, food, and efficient resources.
As per the objectives, the agriculture sector is one of the key sectors that have provided 38.5% of employment and more than 65%–70% population is linked with this sector. Pakistan’s agriculture sector is imperative, contributing about 19% to the economy in 2019 (Pakistan Economic Survey, 2020). The study discusses the most imperative factors, such as energy, carbon emissions, farming, and production in the current period, which is very essential. During the last 2 decades, Pakistan had experienced rapid agricultural development, which impacts climate change. We analyzed that the measures for 2019 have presented that the agriculture sector emitted CO2 emissions by .83 Mtoe. Thus, this study provided a roadmap for decarbonizing the food supply chain and its present framework. For various components of the food supply chain, we have provided the CO2 emissions impacts for the crops and as a whole during 2019. These production factors are the challenges that raise the CO2 emissions of food provided. The key challenges to Pakistan’s food security, farming, and energy output present that the country is raising the return on scale. Challenging policies at various stages, output units, and farming activities benefit the economy, efficiency, and pollution reduction. The idea of decarbonization of traditional agriculture and sustainable development of Pakistan is provided, which shows how traditional farming is transferred to modern farming for sustainable communities. Estimating CO2 emissions based on various productions is necessary; on the other hand, renewable energy is rising in the future. The individual farm activities are based on area, yield, and CO2 emissions. Finally, the major production, i.e., wheat, rice, cotton, maize, sugarcane, and maize in Pakistan presents huge CO2 emissions, including the aggregate of agriculture-related factors (livestock, land, managed soil, and rice cultivation) of 109.12, 31.52, 74.98, and 7.83 MtCO2, respectively, mainly due to fertilizer inputs.
Agriculture is the backbone of Pakistan’s economy, giving livelihoods and food security. Unfortunately, this sector is also the most impacted by climate variability, as provided in Table 3. First, crop yields over recent years have been poorly impacted by varying climate patterns and related shocks. According to the Nationally Determined Contribution of Pakistan, the agriculture sector is also the largest consumer of fresh water, accounting for 95% of total withdrawals. The four major crops that account for 80% of this share include high water consumption and low-value crops, i.e., rice and sugarcane. The country is estimated to lose 4% of its GDP to inefficient water use in agriculture. Hence, to ensure long-term productivity and the water and food security of the country, Pakistan needs to significantly boost water efficiency and agriculture productivity using renewable electricity. This is because the maximum irrigation is based on diesel. Second, the major agriculture tools should be enhanced; for example, all kinds of machines related to growing, cultivating, and harvesting crops on a farm should be enhanced. These machines are tractors, harvesters, threshers, etc., which use fossil fuels and emit a huge amount of CO2 emissions. Third, the insect spray should be modern, using machines, saving energy and labor. For example, aero planes and machinery spraying is more suitable for huge farming. Finally, the transportation system should be enhanced, and products should be made in the hilly area, such as the shift of wheat and rice in the hilly areas, including Gilgit and Azad Jammu and Kashmir.
Moreover, this study is not without limitations. As an emerging country with and growing population, the food supply chain and security challenges can never be ignored. For this, carbon footprint in different processing phases, values, demand, supply, hectare-wise energy consumption, and carbon emissions are the future limitations. These would help Pakistan to fulfill the demand and control pollution.
The original contributions presented in the study are included in the article/Supplementary Material; further inquiries can be directed to the corresponding author.
All authors listed have made a substantial, direct, and intellectual contribution to the work and approved it for publication.
This research was supported by “Shanghai Cooperation Organization Institute of Modern agriculture Development.”
The authors declare that the research was conducted in the absence of any commercial or financial relationships that could be construed as a potential conflict of interest.
All claims expressed in this article are solely those of the authors and do not necessarily represent those of their affiliated organizations, or those of the publisher, the editors, and the reviewers. Any product that may be evaluated in this article, or claim that may be made by its manufacturer, is not guaranteed or endorsed by the publisher.
1https://www.iea.org/data-and-statistics/data-browser/?country=PAKISTAN &fuel=CO2%20emissions&indicator=CO2PerCap.
2http://www.mnfsr.gov.pk/userfiles1/file/National%20Food%20 Security%20 Policy%20%202018%20(1).pdf.
3www.gcisc.org.pk/Pakistan%20Updated%20NDC%202021.pdf. http://www.fnance.gov.pk/survey/chapters_19/ Economic_Survey_2019_20.pdf.
Abdullah, A., Ahmed, A., Akhter, P., Razzaq, A., Hussain, M., Hossain, N., et al. (2021). Potential for sustainable utilisation of agricultural residues for bioenergy production in Pakistan: An overview. J. Clean. Prod. 287, 125047. doi:10.1016/j.jclepro.2020.125047
Aleksandrowicz, L., Green, R., Joy, E. J., Harris, F., Hillier, J., Vetter, S. H., et al. (2019). Environmental impacts of dietary shifts in India: A modelling study using nationally-representative data. Environ. Int. 126, 207–215. doi:10.1016/j.envint.2019.02.004
Ali, S. M., Moktadir, M. A., Kabir, G., Chakma, J., Rumi, M. J. U., and Islam, M. T. (2019). Framework for evaluating risks in food supply chain: Implications in food wastage reduction. J. Clean. Prod. 228, 786–800. doi:10.1016/j.jclepro.2019.04.322
Ar5 Climate Change (2014). Mitigation of climate change. https://www.ipcc.ch/report/ar5/wg3/.
Balaji, M., and Arshinder, K. (2016). Modeling the causes of food wastage in Indian perishable food supply chain. Resour. Conservation Recycl. 114, 153–167. doi:10.1016/j.resconrec.2016.07.016
Balogh, J. M. (2022). The impacts of agricultural development and trade on CO2 emissions? Evidence from the non-European union countries. Environ. Sci. Policy 137, 99–108. doi:10.1016/j.envsci.2022.08.012
Boehm, R., Wilde, P. E., Ver Ploeg, M., Costello, C., and Cash, S. B. (2018). A comprehensive life cycle assessment of greenhouse gas emissions from US household food choices. Food Policy 79, 67–76. doi:10.1016/j.foodpol.2018.05.004
Brander, M., and Davis, G. (2012). Greenhouse gases, CO2, CO2e, and carbon: What do all these terms mean. Bethesda, MD, USA: Econometrica.
Carroll, E., Chang, J., Lodi, L., Rapsomanikis, G., Zimmermann, A., and Blandford, D. (2018). “The state of agricultural commodity markets 2018: Agricultural trade,” in Climate change and food security (Rome, Italy: Food and Agriculture Organization of the United Nations).
Chandio, A. A., Jiang, Y., Rehman, A., and Rauf, A. (2020). Short and long-run impacts of climate change on agriculture: An empirical evidence from China. Int. J. Clim. Change Strategies Manag. 12 (2), 201–221. doi:10.1108/ijccsm-05-2019-0026
Cheng, K., Yan, M., Nayak, D., Pan, G. X., Smith, P., Zheng, J. F., et al. (2015). Carbon footprint of crop production in China: An analysis of national statistics data. J. Agric. Sci. 153 (3), 422–431. doi:10.1017/s0021859614000665
Dagar, V., Khan, M. K., Alvarado, R., Usman, M., Zakari, A., Rehman, A., et al. (2021). Variations in technical efficiency of farmers with distinct land size across agro-climatic zones: Evidence from India. J. Clean. Prod. 315, 128109. doi:10.1016/j.jclepro.2021.128109
Deike, S., Pallutt, B., and Christen, O. (2008). Investigations on the energy efficiency of organic and integrated farming with specific emphasis on pesticide use intensity. Eur. J. Agron. 28 (3), 461–470. doi:10.1016/j.eja.2007.11.009
Food and Agriculture Organization (2021). World food and agriculture 2021. Rome, Italy: Food and Agriculture Organization.
Food Security Assessment Survey (FSA) (2016). Food security assessment survey Pakistan 2016 report. https://cn.bing.com/search?q=Food%20Security%20Assessment%20Survey%20PAKISTAN%202016%20REPORT&qs=n&form=QBRE&=%25eManage%20Your%20Search%20History%25E&sp=1&pq=food%20security%20assessment%20survey%20pakistan%202016%20report&sc=7-52&sk=&cvid=D39634C21031451A858801693EE2AFD5.
Hertwich, E. G., and Peters, G. P. (2009). Carbon footprint of nations: A global, trade-linked analysis. Environ. Sci. Technol. 43 (16), 6414–6420. doi:10.1021/es803496a
Höhne, N., den Elzen, M., Rogelj, J., Metz, B., Fransen, T., Kuramochi, T., et al. (2020). Emissions: World has four times the work or one-third of the time. Nature 579 (7797), 25–28. doi:10.1038/d41586-020-00571-x
IEA (2019). Data and statistics. https://www.iea.org/data-and-statistics/data-browser/?country=PAKISTAN&fuel=CO2%20emissions&indicator=CO2PerCap.
IEA (2009). Transport, energy and CO2: MOVING TOWARD sustainability. Paris, France: International Energy Agency.
Ijaz, M., and Goheer, M. A. (2021). Emission profile of Pakistan’s agriculture: Past trends and future projections. Environ. Dev. Sustain. 23 (2), 1668–1687. doi:10.1007/s10668-020-00645-w
IPCC Second Assessment on Climate Change (1996). International panel on climate change. Cambridge, UK: Cambridge University Press.
Jiang, J., Zhao, T., and Wang, J. (2021). Decoupling analysis and scenario prediction of agricultural CO2 emissions: An empirical analysis of 30 provinces in China. J. Clean. Prod. 320, 128798. doi:10.1016/j.jclepro.2021.128798
Krapivin, V. F., Varotsos, C. A., and Soldatov, V. Y. (2017). Simulation results from a coupled model of carbon dioxide and methane global cycles. Ecol. Model. 359, 69–79. doi:10.1016/j.ecolmodel.2017.05.023
Lall, U., Josset, L., and Russo, T. (2020). A snapshot of the world's groundwater challenges. Annu. Rev. Environ. Resour. 45, 171–194. doi:10.1146/annurev-environ-102017-025800
Lamb, W. F., Wiedmann, T., Pongratz, J., Andrew, R., Crippa, M., Olivier, J. G., et al. (2022). Corrigendum: A review of trends and drivers of greenhouse gas emissions by sector from 1990 to 2018 (2021 environ. Res. Lett. 16 073005). Environ. Res. Lett. 17 (4), 049502. doi:10.1088/1748-9326/ac5b3c
Lin, B., and Raza, M. Y. (2019). Analysis of energy related CO2 emissions in Pakistan. J. Clean. Prod. 219, 981–993. doi:10.1016/j.jclepro.2019.02.112
Lin, B., and Raza, M. Y. (2020). Energy substitution effect on transport sector of Pakistan: A trans-log production function approach. J. Clean. Prod. 251, 119606. doi:10.1016/j.jclepro.2019.119606
Lin, B., and Raza, M. Y. (2021). Fuels substitution possibilities and the technical progress in Pakistan's agriculture sector. J. Clean. Prod. 314, 128021. doi:10.1016/j.jclepro.2021.128021
Lipinski, B., Hanson, C., Waite, R., Searchinger, T., and Lomax, J. (2013). Reducing food loss and waste. Washington, DC, USA: World Resources Institut.
McGarrity, J. (2015). Chinese-funded energy projects in Pakistan likely to damage environment. London, UK: China Dialogue.
Ministry of National Food Security and Research (2018). Ministry of national food security and research. http://www.mnfsr.gov.pk/userfiles1/file/National%20Food%20Security%20Policy%20%202018%20(1).pdf.
National Institute of Population Studies (NIPS) (2018). National institute of population studies (NIPS). https:National Institute of Population Studies (NIPS) - Search (bing.com).
Nationally Determined Contribution (Ndc), (2021). Nationally determined contribution (NDC). www. gcisc.org.pk/Pakistan%20Updated%20NDC%202021.pdf.
Pakistan Bureau of Statistics (2019). Pakistan Bureau of statistics. http://www.pbs.gov.pk/content/agriculture-statistics.
Pakistan Cpeir, (2017). Pakistan CPEIR final report may 2017. https://www.climatefinance-developmenteffectiveness.org/sites/default/files/publication/attach/Pakistan-CPEIR-2017.pdf.
Pakistan Economic Survey (2020). Pakistan economic survey 2019-20. http://www.fnance.gov.pk/survey/chapters_19/Economic_Survey_2019_20.pdf.
Pakistan Energy Yearbook (2019). Ministry of energy (petroleum division) hydrocarbon development institute of Pakistan. https://hdip.com.pk/contents.php?cid=32.
Pandey, D., Agrawal, M., and Pandey, J. S. (2011). Carbon footprint: Current methods of estimation. Environ. Monit. Assess. 178 (1), 135–160. doi:10.1007/s10661-010-1678-y
Peña-Arancibia, J. L., Yu, Y., Stewart, J. P., Podger, G. M., and Kirby, J. M. (2021). Climate change and reservoir sedimentation implications for irrigated agriculture in the Indus Basin Irrigation System in Pakistan. J. Hydrology 603, 126967. doi:10.1016/j.jhydrol.2021.126967
Pimentel, D. (2006). Impacts of organic farming on the efficiency of energy use in agriculture. Org. Cent. state Sci. Rev. 15, 1–40.
Pottier, A. (2022). Expenditure elasticity and income elasticity of GHG emissions: A survey of literature on household carbon footprint. Ecol. Econ. 192, 107251. doi:10.1016/j.ecolecon.2021.107251
Raak, N., Symmank, C., Zahn, S., Aschemann-Witzel, J., and Rohm, H. (2017). Processing-and product-related causes for food waste and implications for the food supply chain. Waste Manag. 61, 461–472. doi:10.1016/j.wasman.2016.12.027
Raza, M. Y., Khan, A. N., Khan, N. A., and Kakar, A. (2021). The role of food crop production, agriculture value added, electricity consumption, forest covered area, and forest production on CO2 emissions: Insights from a developing economy. Environ. Monit. Assess. 193 (11), 747–816. doi:10.1007/s10661-021-09523-y
Raza, M. Y., and Lin, B. (2020). Decoupling and mitigation potential analysis of CO2 emissions from Pakistan's transport sector. Sci. Total Environ. 730, 139000. doi:10.1016/j.scitotenv.2020.139000
Raza, M. Y., and Tang, S. (2022). Inter-fuel substitution, technical change, and carbon mitigation potential in Pakistan: Perspectives of environmental analysis. Energies 15 (22), 8758. doi:10.3390/en15228758
Raza, M. Y., Wasim, M., and Sarwar, M. S. (2020). Development of renewable energy technologies in rural areas of Pakistan. Energy Sources, Part A Recovery, Util. Environ. Eff. 42 (6), 740–760. doi:10.1080/15567036.2019.1588428
Raza, M. Y., Wu, R., and Lin, B. (2023). A decoupling process of Pakistan's agriculture sector: Insights from energy and economic perspectives. Energy 263, 1–11. doi:10.1016/j.energy.2022.125658
Rehman, A., Ma, H., Ahmad, M., Irfan, M., Traore, O., and Chandio, A. A. (2021b). Towards environmental Sustainability: Devolving the influence of carbon dioxide emission to population growth, climate change, Forestry, livestock and crops production in Pakistan. Ecol. Indic. 125, 107460. doi:10.1016/j.ecolind.2021.107460
Rehman, A., Ma, H., Irfan, M., and Ahmad, M. (2020). Does carbon dioxide, methane, nitrous oxide, and GHG emissions influence the agriculture? Evidence from China. Environ. Sci. Pollut. Res. 27 (23), 28768–28779. doi:10.1007/s11356-020-08912-z
Rehman, A., Ma, H., Ozturk, I., Ahmad, M., Rauf, A., and Irfan, M. (2021a). Another outlook to sector-level energy consumption in Pakistan from dominant energy sources and correlation with economic growth. Environ. Sci. Pollut. Res. 28 (26), 33735–33750. doi:10.1007/s11356-020-09245-7
Shujian, X. I. A. N. G., and Shigai, C. H. A. I. (2013). Deficiencies and improvements to ecological footprint theory and practice. Resour. Sci. 35 (5), 1051–1058.
Sim, S., Barry, M., Clift, R., and Cowell, S. J. (2007). The relative importance of transport in determining an appropriate sustainability strategy for food sourcing. Int. J. Life Cycle Assess. 12 (6), 422–431. doi:10.1065/lca2006.07.259
Sinisterra-Solís, N., Sanjuán, N., Ribal, J., Estruch, V., and Clemente, G. (2023). An approach to regionalise the life cycle inventories of Spanish agriculture: Monitoring the environmental impacts of orange and tomato crops. Sci. Total Environ. 856, 158909. doi:10.1016/j.scitotenv.2022.158909
Soofi, A. F., Manshadi, S. D., and Saucedo, A. (2022). Farm electrification: A road-map to decarbonize the agriculture sector. Electr. J. 35 (2), 107076. doi:10.1016/j.tej.2022.107076
United Nations Environment Programme (Unep), (2021). United nations environment programme (UNEP). https://www.trade.gov/country-commercial-guides/pakistan-waste-management.
Wackernagel, M., and Rees, W. (1998). Our ecological footprint: Reducing human impact on the earth. columbia, Canada: New society publishers.
Wang, Z., Yang, L., Yin, J., and Zhang, B. (2018). Assessment and prediction of environmental sustainability in China based on a modified ecological footprint model. Resour. Conservation Recycl. 132, 301–313. doi:10.1016/j.resconrec.2017.05.003
Wiedmann, T., Minx, J., Barrett, J., and Wackernagel, M. (2008). Allocating ecological footprints to final consumption categories with input–output analysis. Ecol. Econ. Res. trends 56, 28–48. doi:10.1016/j.ecolecon.2005.05.012
Wright, L. A., Kemp, S., and Williams, I. (2011). ‘Carbon footprinting’: Towards a universally accepted definition. Carbon Manag. 2 (1), 61–72. doi:10.4155/cmt.10.39
Xiuhui, J., and Raza, M. Y. (2022). Delving into Pakistan's industrial economy and carbon mitigation: An effort toward sustainable development goals. Energy Strategy Rev. 41, 100839. doi:10.1016/j.esr.2022.100839
Yang, L., and Yang, Y. (2019). Evaluation of eco-efficiency in China from 1978 to 2016: Based on a modified ecological footprint model. Sci. Total Environ. 662, 581–590. doi:10.1016/j.scitotenv.2019.01.225
Yu, Y., Jiang, T., Li, S., Li, X., and Gao, D. (2020). Energy-related CO2 emissions and structural emissions’ reduction in China’s agriculture: An input–output perspective. J. Clean. Prod. 276, 124169. doi:10.1016/j.jclepro.2020.124169
Keywords: energy consumption (EC), carbon emission, food supply chain, sustainable development, Pakistan
Citation: Raza MY, Zhongpan Q and Pengju W (2023) Agriculture-related energy consumption, food policy, and CO2 emission reduction: New insights from Pakistan. Front. Environ. Sci. 10:1099813. doi: 10.3389/fenvs.2022.1099813
Received: 16 November 2022; Accepted: 19 December 2022;
Published: 09 January 2023.
Edited by:
Nazim Hussain, University of Groningen, NetherlandsReviewed by:
Xing Chen, Dalian University of Technology, ChinaCopyright © 2023 Raza, Zhongpan and Pengju. This is an open-access article distributed under the terms of the Creative Commons Attribution License (CC BY). The use, distribution or reproduction in other forums is permitted, provided the original author(s) and the copyright owner(s) are credited and that the original publication in this journal is cited, in accordance with accepted academic practice. No use, distribution or reproduction is permitted which does not comply with these terms.
*Correspondence: Muhammad Yousaf Raza, eW91c2FmLnJhemFAeW1haWwuY29t, eW91c2FmLnJhemFAc2R0YnUuZWR1LmNu; Qiu Zhongpan, enBxaXVAeG11LmVkdS5jbg==
Disclaimer: All claims expressed in this article are solely those of the authors and do not necessarily represent those of their affiliated organizations, or those of the publisher, the editors and the reviewers. Any product that may be evaluated in this article or claim that may be made by its manufacturer is not guaranteed or endorsed by the publisher.
Research integrity at Frontiers
Learn more about the work of our research integrity team to safeguard the quality of each article we publish.