 Xinghua Cui
 Mingyu Lin2
94% of researchers rate our articles as excellent or good
Learn more about the work of our research integrity team to safeguard the quality of each article we publish.
Find out more
ORIGINAL RESEARCH article
Front. Environ. Sci., 10 January 2023
Sec. Land Use Dynamics
Volume 10 - 2022 | https://doi.org/10.3389/fenvs.2022.1098924
This article is part of the Research TopicLand Use Management and Carbon Abatement in a Sustainable Development PerspectiveView all 12 articles
In this study, we calculate the urban land green use efficiency (ULGUE) in the Yangtze River Economic Belt from 2005 to 2019 by using the epsilon-based measure (EBM) model. Further, the spatial-temporal distribution, regional differences and evolution trends of ULGUE in the Yangtze River Economic Belt are investigated in depth by using the Dagum Gini coefficient, Kernel Density estimation and Markov Chain method. The following results are obtained. 1) From the perspective of spatial-temporal evolution, the ULGUE in the Yangtze River Economic Belt show a fluctuating upward trend from 2005 to 2019, and it is manifested as diffusion from downstream to middle and upper reaches. 2) From the perspective of regional differences, there is a relatively obvious imbalance of ULGUE within the Yangtze River Economic Belt, but the differences narrow over time. 3) Considering the distribution dynamic evolution, the box diagram and distribution curve of ULGUE in the Yangtze River Economic Belt have a tendency to move to high values, but there is a more obvious phenomenon of spatial polarization. 4) For the part of time and space transfer, the ULGUE within the Yangtze River Economic Belt show the characteristic of “club convergence”, and the Spatial Markov Chain results show an obvious “spatial spillover” effect.
As a material means of production, land is an important carrier of urban economic activities and the basis for the exchange and interaction of factors (Krekel et al., 2016; Zhao, 2016; Lu et al., 2020; Lin and Ling, 2021; Tong et al., 2021), which is related to urban development and the wellbeing of residents’ lives. However, with the continuous acceleration of China’s urbanization, the land use problems caused by it have become increasingly prominent. For example, the excessive expansion and extensive use of urban construction land occupied a large number of agricultural lands, resulting in the increasingly acute contradiction between people and land (Cartier, 2001; Lambin and Meyfroidt, 2010; Zhang et al., 2022). Problems such as extensive use of urban land, circle instead of use, and insufficient degree of intensification had led to irrational land use structure and inefficient utilization (La Rosa et al., 2014; Choi and Wang, 2017; Zhang L. et al., 2020). In addition, due to the excessive emphasis on economic benefits of urban land use, a large number of pollution emissions had been generated, resulting in the destruction of ecosystems and endangering the sustainable development of cities (Martínez-Zarzoso and Maruotti, 2011; Chen, 2015; Verma and Raghubanshi, 2018). In the face of the above-mentioned serious practical problems, it has become particularly vital to integrate the concept of green development throughout the entire process of urban land use (Liang et al., 2019; Wang A. et al., 2021). The ULGUE is a comprehensive mapping between the input system of urban production factors and the output system of urban land use in urban space, which emphasizes the efficient and sustainable use of urban land and can guarantee the coordinated development of man-land system. ULGUE is a fundamental transformation of land use mode and a breakthrough improvement of land use quality in China. It has great significance to reduce ecological and environmental risks in urban land development and promote sustainable, green and coordinated development of social economy. It is also an important practical activity to implement the concept of “Lucian waters and lush mountains are gold and silver mountains”. Therefore, exploring the efficiency of green use of urban land is of great practical significance to solve the problem of ecological environment improvement lagging behind urbanization development, and to promote the coordinated development of economy, society and ecology (Cui et al., 2021; Lu et al., 2022).
Among China’s economic regions, the Yangtze River Economic Belt is not only one of the regions with the strongest comprehensive strength and the greatest strategic support, but also a leading demonstration zone and ecological security barrier zone for ecological civilization construction, and an important position to promote the coordinated development of China’s economic regions (Yin et al., 2021; Tan and Zou, 2022; Wang et al., 2022).
The Yangtze River Economic Belt covers 11 provincial-level regions1, with land area accounting for about 21.5% of China’s national land area and about 42.9% of China’s total population, showing a mismatch between the high concentration of population and the limited supply of land (Zhang et al., 2022). At the same time, with the continuous acceleration of industrialization and urbanization, the land use problem in the Yangtze River Economic Belt is facing a huge threat, and the disorderly expansion and inefficient use of land have seriously hindered the sustainable development of resources and environment in the region and the optimization of the layout of land space (Cui et al., 2021), which has become the main crux restricting the transformation and development of cities in the Yangtze River Economic Belt. In 2017, the “Yangtze River Economic Belt Ecological and Environmental Protection Plan” pointed out that it is necessary to establish and improve the coordination mechanism for the protection, development and utilization of the Yangtze River shoreline, and coordinate the use and management of the shoreline and the rear land. It can be seen that how to achieve the rational allocation, intensive utilization and green sustainable development of land resources has become a new topic in the management and utilization of land resources.
At present, some scholars have paid attention to the issue of green land use efficiency and have achieved a series of research results (Liang et al., 2019; Wang and Pang, 2019; Xu and Liu, 2021; Chen et al., 2022; Lu et al., 2022), but the research scale is mostly based on the national level of China (Lu et al., 2020; Xu and Liu, 2021), and the Yellow River basin (Ding et al., 2021; Su and Yang, 2022). Only a few literatures focus on the green land use efficiency of the Yangtze River Economic Belt (Zhong et al., 2022). At the same time, in terms of measurement methods, most of the existing studies use the SBM model to measure the ULGUE, but the SBM model cannot effectively deal with the input-output relationship between “non-radial” factors inputs (land and other factors) and “radial” undesirable outputs, which leads to the underestimate of the efficiency value (Li et al., 2020; Zhao et al., 2021). In addition, when analyzing the evolution trend of ULGUE, the existing literature usually uses the Kernel density estimation and Moran index to analyze the spatial-temporal evolution of land use efficiency ((Lu et al., 2020). However, the above methods are more inclined to provide the overall regional information, but cannot capture the internal dynamic changes of ULGUE in the evolution process.
Therefore, this study mainly expands the existing research from the following aspects. 1) In terms of research scope, the Yangtze River Economic Belt is selected as the research object, environmental factors are included in the research framework of urban land use efficiency, and targeted analysis is made on the ULGUE in the Yangtze River Economic Belt. 2) In terms of measurement, this study uses the EBM (Epsilon Based Measure) model proposed by (Tone and Tsutsui, 2010), which includes “radial” and “non-radial” distance functions, to measure the ULGUE of the Yangtze River Economic Belt. The input-output relationship between the “non-radial” factor inputs and the “radial” undesirable outputs is comprehensively considered to form the input-output bidirectional solution programming model, so as to effectively solve the underestimation problem of efficiency value in the SBM model. 3) In terms of analysis methods, this study comprehensively uses the Dagum Gini coefficient, the Kernel density estimation and spatial Markov chain method to analyze the spatial distribution, regional differences and evolution trend of ULGUE in the Yangtze River Economic Belt. By introducing the spatial transfer probability matrix analysis method, the dynamic evolution process of each city in different periods is investigated to reflect the possibility of upward or downward transfer of ULGUE of each city.
The organizational structure of this work is arranged as follows. Section 2 provides a literature review of ULGUE. Section 3 illustrates the methodology and data used in this work. Section 4 analyzes the ULGUE in the Yangtze River Economic Belt quantitatively, so as to reveal its spatial distribution, regional differences and dynamic evolution trend. Section 5 provides a conclusion, a brief discussion on policy implications and a validity and limitations of this study.
With the gradual intensification of global warming, resource and environmental issues have become a hot topic of discussion in the academic circles of various countries (Skea and Nishioka, 2008), and the related research on land use has gradually paid attention to the impact of urban land use on green development, and then the ULGUE has gradually become the focus of land use research (Li et al., 2009; Liu, 2018). The research on ULGUE mainly focuses on the following aspects.
1) The measurement of ULGUE. First of all, in the measurement of ULGUE, existing studies have basically agreed on the connotation of ULGUE, and it is believed that ULGUE is a comprehensive evaluation index, which is the unity of economic, social and ecological benefits. Under the conditions of established production technology, it is committed to obtaining higher desirable outputs and reducing “undesirable” outputs through the least factor input (land and other factors) (Yu et al., 2020; Lu et al., 2022). In terms of measurement methods (Fukuyama and Weber, 2009), used the SBM Model to measure the ULGUE, which is proposed by (Tone, 2001). Subsequently, many scholars used the SBM model to measure the green land use efficiency (Liang et al., 2019; Lu et al., 2020; Ge et al., 2021a; Ge et al., 2021b, Wang S. et al., 2021). Although the SBM model has been used by many scholars to measure ULGUE, the SBM model has lost the proportion information between the actual value of input and output and the target value, so it cannot deal with the situation of both “radial” and “non-radial” characteristics between input and output variables, resulting in a large deviation in the measurement results of the efficiency value. Therefore, it is necessary to further explore more accurate measurement methods for the measurement of ULGUE.
2) The research scope of ULGUE. At present, the research on ULGUE considering environmental factors is still in the exploratory stage, and the research scope is mainly focused on the national and watershed scope. Among them, most studies have been researched on ULGUE at the national scope of China (Liang et al., 2019; Xu and Liu, 2021; Lu et al., 2022). At the watershed scope, the Yellow River Basin and the Yangtze River Basin are the two major river basins in China, but the existing literature mainly focused on the study of ULGUE of the Yellow River Basin (Han and Tongtong, 2022; Su and Yang, 2022), while only a few literatures focused on ULGUE of the Yangtze River Economic Belt (Ge et al., 2021a; Ge et al., 2021b; Zhong et al., 2022). And the existing literature did not conduct in-depth analysis on the spatial differences and spatial-temporal evolution of ULGUE in the Yangtze River Economic Belt, so relevant studies need to be further supplemented and expanded.
3) The spatial characteristics of ULGUE. Based on the measurement of ULGUE, many scholars further analyze the characteristics of ULGUE mainly from two perspectives: regional differences and spatial-temporal evolution of the ULGUE. First of all, in terms of regional differences, some scholars have used Theil index, Gini coefficient and other methods to verify that there are significant differences in land green use efficiency in different regions (Hu et al., 2018; Liang et al., 2019), due to the significant differences in geographical location environment and economic development level among different regions (Ahmad et al., 2021). Secondly, in terms of spatial-temporal evolution characteristics, although some studies have used Kernel density estimation and Moran index to describe the spatial-temporal evolution of ULGUE (Lu et al., 2020), these can describe the spatial evolution characteristics and rules of the overall distribution pattern, it cannot directly reflect the spatial dynamic evolution process of ULGUE, and lacks relevant research on the targeted analysis of the spatial transfer of ULGUE in each region. In summary, abundant research results have been achieved in the study of ULGUE, which lays a foundation for the smooth development of this study, but there are still the following deficiencies and expansion space. First of all, most of the existing studies uses SBM model to measure ULGUE, which may lead to the underestimate of the final measured efficiency value. Therefore, this study uses the EBM model which includes “radial” and “non-radial” distance functions to measure the ULGUE in the Yangtze River Economic Belt, so as to effectively make up for the shortcomings of the traditional SBM model. Secondly, in terms of the research scope of ULGUE, the existing literature mainly focuses on the national scope and the Yellow River basin, while the literature on ULGUE in the Yangtze River Economic Belt is less. As one of the most important economic belts in China, the ULGUE of the Yangtze River Economic Belt is directly related to the sustainable use of land resources in the Yangtze River Economic Belt and even the healthy development of urbanization in China. Therefore, this study choice the Yangtze River Economic Belt as the research object to supplement the existing research. Finally, when analyzing the spatial characteristics of ULGUE, the dynamic transfer process of ULGUE has not been considered in the existing studies. Therefore, this study uses the spatial Markov chain method to supplement, and calculates the probability of conditional state transition by introducing the “spatial lag” condition, so as to reveal the possibility of upward or downward transfer of ULGUE in the Yangtze River Economic Belt.
This study uses the EBM model to measure the ULGUE in the Yangtze River Economic Belt, and analyzes its spatial and temporal evolution routes (Study1). On this basis, Dagum Gini coefficient method is used to analyze the spatial difference analysis of ULGUE in the Yangtze River Economic Zone (Study2), Kernel Density Estimation is used to analyze the dynamic evolution of green land-use efficiency distribution in the Yangtze River Economic Zone (Study3), and Spatial Markov Chain is used to analyze the spatial and temporal transfer routes of ULGUE in the Yangtze River Economic Zone (Study4). The more detailed research framework is shown in Figure 1.
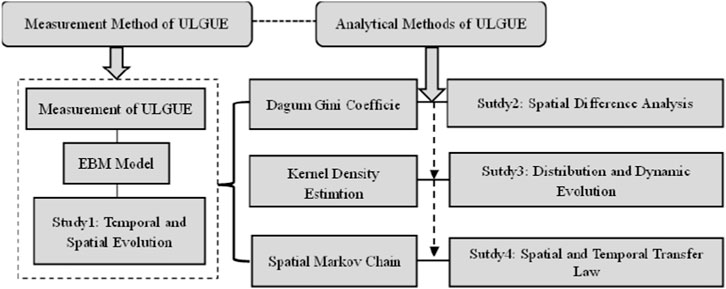
FIGURE 1. Research methods and framework.
Data Envelopment Analysis (DEA) can evaluate multiple input and multiple output decision making units. It projects the Decision Making Units (DMU) onto the frontier by using linear programming, and evaluates its relative effectiveness by comparing the degree of deviation of the DMU from the frontier, so as to obtain the information of DMU As a major direction, DEA model includes DEA-CCR, DEA-BCC, SBM, EBM and many other models. Considering the undesirable output, the current method widely used in the academic circle is the SBM model, which is “non-radial” and “non-angular”. However, the SBM model loses the proportion information between the actual value of input and output and the target value, and cannot handle the case of both “radial” and “non-radial” characteristics between the input and output variables, which leads to a large deviation in the measurement results of the efficiency value. The EBM model can deal with the situation that both “radial” and “non-radial” exist simultaneously. It can not only measure the improvement ratio between the target value and the actual value, but also find out the gap between the target value and the actual value by solving the “non-radial” value of each input and output, so as to measure the ULGUE more accurately, and make up for the shortcomings of the SBM model.
Therefore, this study uses the EBM model proposed by (Tone and Tsutsui, 2010) to measure the ULGUE from 2005 to 2019. The EBM model can be represented as follows:
In the equation,
This work uses the Dagum (1997) Gini coefficient to measure the difference in ULGUE in the Yangtze River Economic Belt. This method can not only reveal the internal difference sources of ULGUE in the upper, middle and lower reaches of the Yangtze River Economic Belt, but also intuitively observe the dynamic change process of the contribution rate of these three types of differences, which is conducive to characterizing the regional imbalance caused by the overlap between regions. Assuming that there are
Where
Where
Kernel density estimation is a non-parametric estimation method used to estimate the density function of random variables. Compared with the parametric method, it has a weak spatial dependence on the model and is often used to describe the phenomenon of uneven distribution of research objects. It is assumed that the density function of the random variable y composed of green use efficiency of all urban land is as follows:
Where, n is the total number of cities,
As far as this work is concerned, the distribution position of the density function calculated by Eq. 10 can reflect the degree of ULGUE in the Yangtze River Economic Belt, and the distribution pattern can be used to judge the spatial difference and polarization degree of ULGUE in the Yangtze River Economic Belt. The height and width of the curve peaks jointly reflect the spatial difference, and the number of peaks reflects the polarization degree; The distribution extensibility is used to describe the spatial difference between the cities with the highest green land use efficiency in the Yangtze River Economic Belt and other cities within the Yangtze River Economic Belt. The longer the tail is in the high value direction, the greater the difference between cities.
In this study, it is assumed that the ULGUE can be divided into M states according to the numerical value within the sample interval (in this study, the samples are divided into 4 states of “low level (L)”, “Medium-low level (ML)”, “Medium-high level (MH)” and “high level (H)” according to the percentile points of 25%, 50% and 75%), then the probability matrix P of state transition can be expressed as:
Where, the element
Assuming the spatial lag value
Where
The element
This study selects eleven variables to construct the ULGUE evaluation system based on previous research (Table 1). It includes input, desirable output and undesirable output. 1) Input variables include land, labor, capital, and energy (Yu et al., 2019; Wang P. et al., 2021). Specifically, urban land input is represented by the area of urban construction land, labor input is represented by the number of employees in urban secondary and tertiary industries, and capital input is represented by urban capital stock. The measurement of capital stock is calculated using the perpetual inventory method, and the depreciation rate of fixed assets is 10.96% (Shan, 2008; Huang, 2021). 2) Desirable output indicators include environmental benefits, economic benefits and social benefits) (Xu and Liu, 2021). Among them, the ecological environment benefits are expressed in terms of the park green space area and the green coverage rate of the built-up areas under the municipal jurisdiction, the economic benefits are expressed in terms of the added value of the secondary and tertiary industries of the city, and the social benefits are expressed in terms of the public financial revenue of the city. 3) The selection of undesirable output takes into account the availability of data and the heavy pollution of industry. It is measured by three major urban pollution emissions, including industrial wastewater emissions, industrial sulfur dioxide emissions and industrial smoke emissions (Cui et al., 2021; Lu et al., 2022). The original data sources of the indicators involved in this paper are China Urban Statistical Yearbook and the EPS data platform. And the descriptive statistics of variables are shown in Table 2.
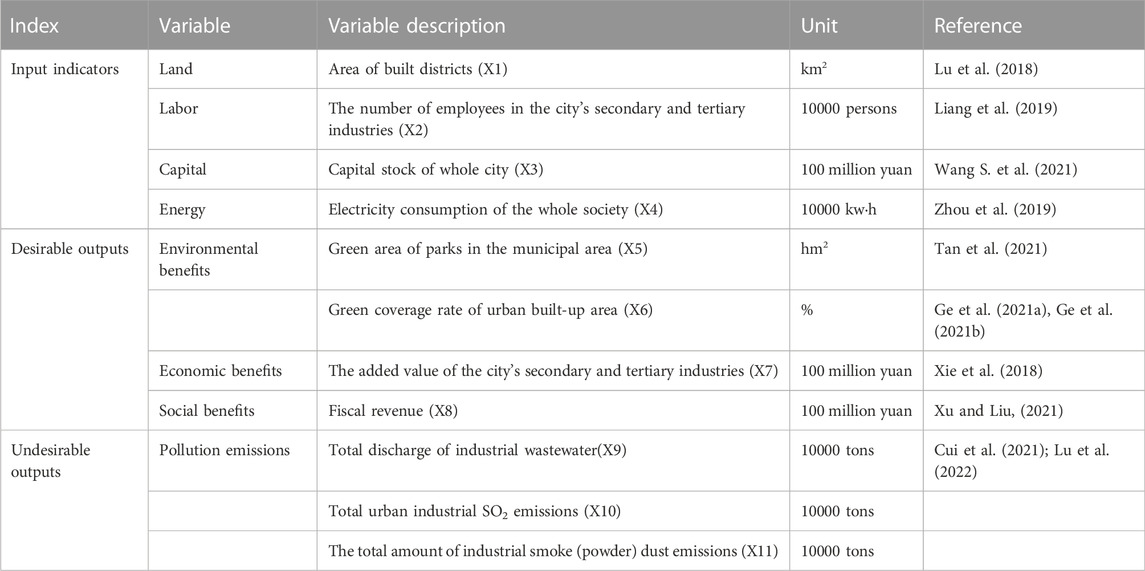
TABLE 1. Definitions and measurements of variables.
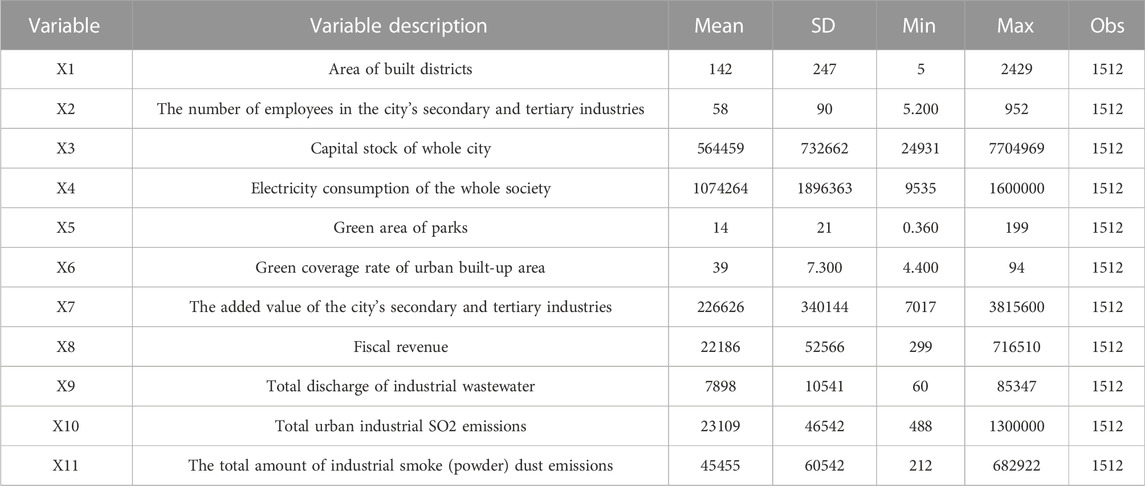
TABLE 2. Descriptive statistics of variables.
According to the EBM model, we measure the ULGUE of the Yangtze River Economic Belt from 2005 to 2019, and based on the measurement results, we plot the time series change trend of ULGUE of the Yangtze River Economic Belt from 2005 to 2019. At the same time, according to the economic and social development overview report of the Yangtze River Economic Belt, the Yangtze River Economic Belt is divided into upstream, midstream and downstream. The temporal changes of ULGUE in the Yangtze River Economic Belt as a whole and in different watersheds are shown in Figure 2. In Figure 2, the ordinate represents the average value of ULGUE in each year. It can be seen that during the period from 2005 to 2019, the overall green use efficiency of land in the Yangtze River Economic Belt showed a fluctuating upward trend, from 0.263 in 2005 to 0.438 in 2019, an increase of 66.36%.
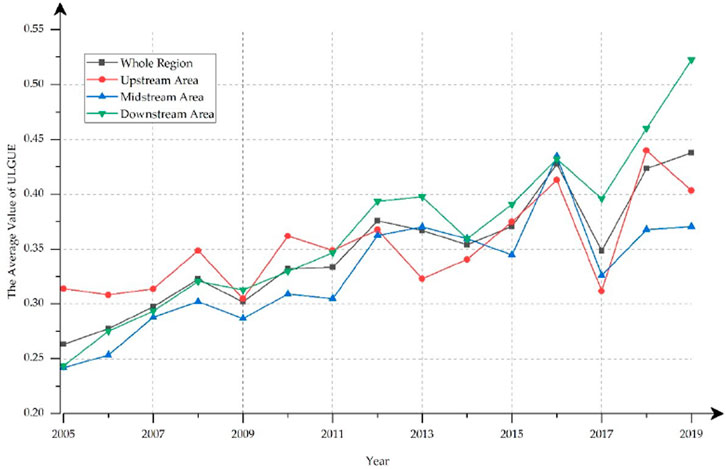
FIGURE 2. Time series trend of ULGUE in the Yangtze River Economic Belt.
The main reason for the gradual increase of ULGUE in the Yangtze River Economic Belt is that, the Chinese Government has put forward many planning concepts and development tasks such as the “Outline of the Yangtze River Economic Belt Development Plan” and the “Yangtze River Economic Belt Ecological Environment Protection Plan” for the development of the Yangtze River Economic Belt, and these positioning and assumptions also reflect the requirements for innovation in land use methods. For example, in the process of promoting the construction of new urbanization, the spatial layout of land use is optimized from various levels such as urban agglomerations, large, medium, and small cities, and new rural communities, and a land use structure with reasonable distribution of production, living and ecological space is formed, which is conducive to promoting the improvement of ULGUE. From the perspective of the time-series evolution trend of ULGUE in various regions, the green land use efficiency in the upper, middle and lower reaches of the Yangtze River Economic Belt is consistent with the overall change trend, and also shows a fluctuating upward trend, but the growth rate of each region varies greatly. Before 2011, the ULGUE in the upstream area is the highest, followed by the downstream area, and the land use efficiency in the middle reaches is the lowest, mainly because the urbanization process in the upper reaches of the Yangtze River is relatively slow, the distribution of construction land is relatively small, and the distribution of forest land and grassland was more, so the green use efficiency of land is higher. The urban agglomeration in the middle reaches of the Yangtze River is a heavy chemical industry layout concentration area with the Wuhan Urban Agglomeration, the “ChangZhutan” Urban Agglomeration, the Poyang Lake Urban Agglomeration and the “Jianghuai” Urban Agglomeration as the main body, and the land use model of industrial development with high input, high consumption and heavy quantitative expansion makes it difficult to improve the efficiency of land green use in the region (Chen et al., 2018). However, after 2011, the ULGUE in the middle and downstream areas increase significantly, while the upstream areas show a significant decline, especially after 2017, the differences between the three regions further increase, showing a “trumpet-shaped” evolution trend. This is mainly because the State Council issued the “National Plan for Functional Zones” in 2011, which pointed out that a strategic ecological security pattern of “two screens and three zones” should be built, with emphasis on the prevention and control of soil erosion and the protection of natural vegetation, so as to ensure ecological security in the middle and lower reaches of the Yangtze River. This require that urban land use in the middle and lower reaches of the Yangtze River should give more consideration to the coordination and unity of economy and ecology, which is conducive to the improvement of ULGUE in the lower reaches and middle reaches to a certain extent. To some extent, this reflects the effectiveness of the National Plan for Functional Zones.
In order to verify the validity of the EBM measurement results and compare with the SBM model, we also present the time series variation chart of ULGUE measured by SBM model. As can be seen from Figure 3, the time variation trend of the measured results of the SBM model is consistent with that of the measured results of the EBM model, indicating that the measured results of the EBM model in this paper are robust. At the same time, it can be seen from the efficiency value size that the measurement results of SBM model are relatively small, compared with the measurement results of EBM model. This is mainly due to the fact that SBM cannot effectively deal with the relationship between the “non-radial” factor input and the “radial” undesired output, leading to the underestimation of the efficiency value, which also verifies the above analysis.
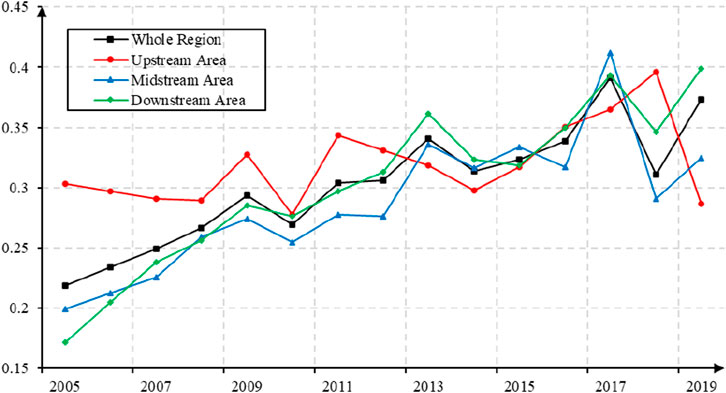
FIGURE 3. Time series trend of ULGUE in the Yangtze River Economic Belt measured by SBM model.
In order to intuitively reflect the spatial evolution of ULGUE in the Yangtze River Economic Belt, this study first divides the green land use efficiency of the Yangtze River Economic Belt into four types according to the quartile method, namely low level (L), medium and low level (ML), medium and high level (MH) and high level (H). The cross-sectional data of 2005, 2009, 2013 and 2019 are selected, and the spatial distribution map of ULGUE in the Yangtze River Economic Belt is drawn by ArcGIS software.
According to Figure 4, the overall ULGUE of the Yangtze River Economic Belt has gradually increased with the evolution of time, which is manifested in the gradual decrease in the number of cities with low ULGUE and the gradual increase in the number of cities with high levels. In 2005, the ULGUE in the Yangtze River Economic Belt was initially mainly based on L and ML, and the cities with MH and H were mainly scattered on both sides of the Yangtze River Basin. Subsequently, the growth of ULGUE in the Yangtze River Basin show an evolution trend of diffusion from the downstream to the middle and upper reaches, which is manifested in the increase in the number of cities with MH and H in 2009, 2013 and 2019 from the downstream to the middle and upper reaches. Finally, it should be noted that compared with the cities in the middle and lower reaches, the increase rate of H cities in the upstream areas is slower, such as in 2005, the cities with H in the upstream areas were the most, but the growth was always slow, and the green use efficiency level of some cities even declined. The reason for this phenomenon is that on the one hand, it has an important relationship with geographical relations, on the other hand, due to the impact of the large-scale development of the western region and the construction of the “One Belt and One Road”, the economic development and urbanization process in the upper reaches of the Yangtze River has accelerated, and the pollution emissions caused by it have gradually increased, resulting in a slow growth in ULGUE.
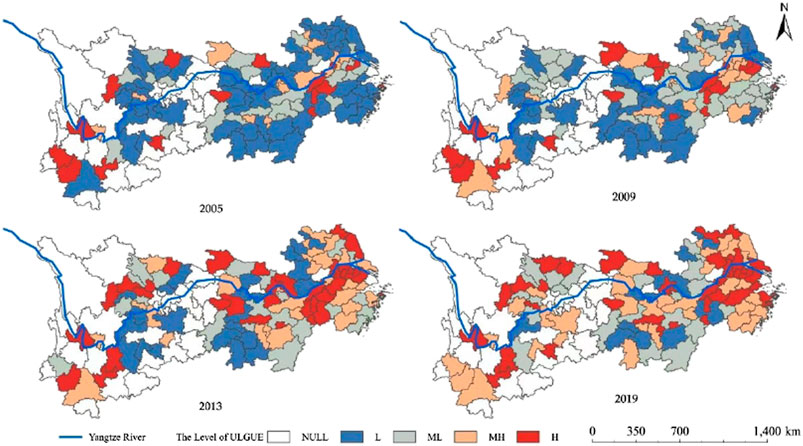
FIGURE 4. Spatial distribution pattern of ULGUE in the Yangtze River Economic Belt.
The reasons for this phenomenon mainly lie in the following two aspects. On the one hand, the upper reaches of the Yangtze River Economic Belt mainly include Chongqing, Sichuan, Guizhou, Yunnan and other provinces and cities, which suffer from severe soil erosion, desertification, environmental pollution and ecological damage, and severe pollution in and around the city. At the same time, the economic development and technological level of these western cities are relatively backward, the average production efficiency of per unit land is low, and the undesirable output is high, which leads to the slow growth of ULGUE in the upper reaches of the Yangtze River Economic Belt. On the other hand, the cities in the middle and lower reaches of the Yangtze River Economic Belt have a relatively higher level of economic development, and the relatively high level of production technology makes the production process of enterprises cleaner and more efficient, so that the industrial added value brought by the unit land production is higher, rather than the desirable output is less. Therefore, in the future development, we should focus on the ULGUE of the upstream cities of the Yangtze River Economic Belt, and promote the continuous improvement of the environmental quality of the Chengdu-Chongqing urban agglomeration. In the process of undertaking the industrial transfer in the downstream areas, the corresponding environmental threshold should be set, so as to realize the unification of the economic effect and environmental benefit of land use, and improve the ULGUE in the upper reaches of the Yangtze River Economic Belt.
It can be seen from the previous description of the characteristics and facts that the ULGUE of the Yangtze River Economic Belt shows spatial imbalance on the whole. In order to analyze the difference sources of the whole Yangtze River and the three regions of the upper, middle and lower reaches, this study uses Dagum method to calculate the Gini coefficient of the ULGUE of the Yangtze River Economic Belt. The results are shown in Table 3. It can be seen from column 2 in Table 3 that the Dagum Gini coefficient of the overall ULGUE in the Yangtze River Economic Belt show a gradual downward trend from 2005 to 2019, specifically from 0.410 in 2005 to 0.324 in 2019, a decrease of 26.54%. This indicates that the gap in ULGUE in the Yangtze River Economic Belt has narrowed over time, mainly because with the continuous promotion of China’s economic regional integration strategy. The following is a detailed description from three aspects: intra-regional differences, inter-regional differences and sources of differences.
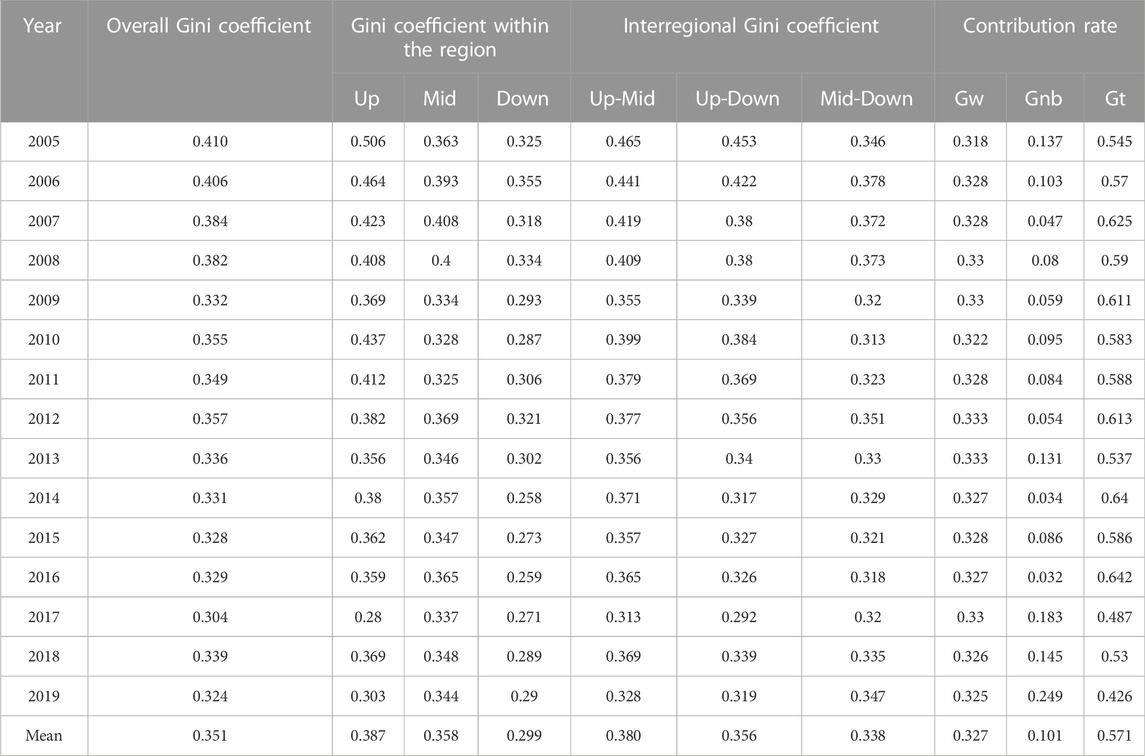
TABLE 3. Disparities in ULGUE in the Yangtze river economic belt (I).
There is a significant gap in the efficiency of land green use within the three major regions of the Yangtze River Economic Belt, and the average Dagum Gini coefficient is ranked from large to small in the upstream region> the middle reaches > downstream areas, and only the Gini coefficient in the downstream area is less than the Gini coefficient in the whole basin. From the perspective of the evolution trend of Gini coefficients within each region, since 2005, the Gini coefficients in the upstream and downstream regions have shown a fluctuating downward trend, while the Gini coefficients for ULGUE in the middle reaches are relatively flat. Among them, the upstream area decreased from 0.506 in 2005 to 0.303 in 2019, a decrease of 41.12%, and the downstream area decreased from 0.325 in 2005 to 0.290 in 2019, a decrease of 10.79%. It can be seen that the initial value of ULGUE in upstream areas is larger, but the rate of decline is faster, and the initial value of ULGUE in downstream areas is relatively low, and the rate of decline is relatively slow. The ULGUE in the middle reaches of the region basically remained fluctuating around 3.5, showing a relatively “stable” development trend. The possible reason is that there are cities with low efficiency levels catching up with cities with high efficiency levels, and then the development of ULGUE among cities in the middle reaches of the group tends to be stable.
Inter-regional differences. Table 3 (6)–(8) lists the differences in ULGUE between regions in the Yangtze River Economic Belt. During the sample investigation period, the regional differences between “Up-Mid” and “Up-Down” were relatively obvious, with the mean Dagum Gini coefficients being 0.380 and 0.356, respectively, while the interregional Gini coefficients of “Mid-Down” were relatively low. From the perspective of change trend, the regional difference trend of “Up-Mid” and “Up-Down” is similar, showing a downward trend of fluctuation, but the overall fluctuation amplitude is not large, maintained within 0.20, while the regional difference between “Mid-Down” is relatively small, but there is no obvious downward trend, and during the sample investigation, it is always maintained at about 0.35. Specifically, the regional differences between “Up-Mid” and “Upstream-Down” were both greatest at the beginning of the sample expedition in 2005, at 0.465 and 0.453, respectively, indicating that in the early stage of the sample investigation, the regional differences between “Up-Mid” were the largest, followed by “Up-Down”, and the interregional differences between “Mid-Down” were the smallest. From the perspective of change, the Dagum Gini coefficient between “Up-Mid” regions decreased from 0.465 in 2005 to 0.328 in 2019, a decrease of 29.49%, and the Dagum Gini coefficient between “Up-Down” regions decreased from 0.453 in 2005 to 0.319 in 2019, a decrease of 29.66%. While the Dagum Gini coefficient between “Mid-Down” area rose from 0.346 in 2005 to 0.347 in 2019, during which the “N” type change trend of first rising and then falling and then rising, but the overall fluctuation range was not large. Through the analysis of the above characteristics and facts, it can be seen that the coordinated development of ULGUE in the “Mid-Down” area is relatively high, and the difference between the upstream region and the middle and lower reaches is the main reason for the interregional difference, but the gap is gradually narrowing. Therefore, it is necessary to promote targeted policy measures and regulatory mechanisms that are conducive to improving the efficiency of urban land green use in the upper reaches of the Yangtze River Economic Belt.
Items (9)–(11) in Table 3 are the decomposition results of the Dagum Gini coefficient for ULGUE in the Yangtze River Economic Belt. It can be seen that the average contribution rates of the intraregional differences
The heterogeneity of ULGUE in different regions of the Yangtze River Economic Belt has been analyzed previously. This study further analyzes the difference between core environmental protection cities and non-core environmental protection cities of the Yangtze River Economic Belt. The results are shown in Table 4 below. It can be seen from Table 4 that from 2005 to 2019, the Gini coefficient of core environmental protection cities is 0.304 on average, while that of non-core environmental protection cities is 0.367. It can be seen that the Gini coefficient of core environmental protection cities is significantly lower than that of non-core environmental protection cities, indicating that there is a large difference in ULGUE within the non-core environmental protection cities. The main reason is that the core environmental protection cities pay more attention to clean development. In order to promote the green development of the city, there is a mutual learning mechanism between enterprises in environmental protection behavior, through adjusting production and life style, improving technology and management level and other ways to achieve collaborative development, which is conducive to reducing the ULGUE difference between core environmental protection cities.
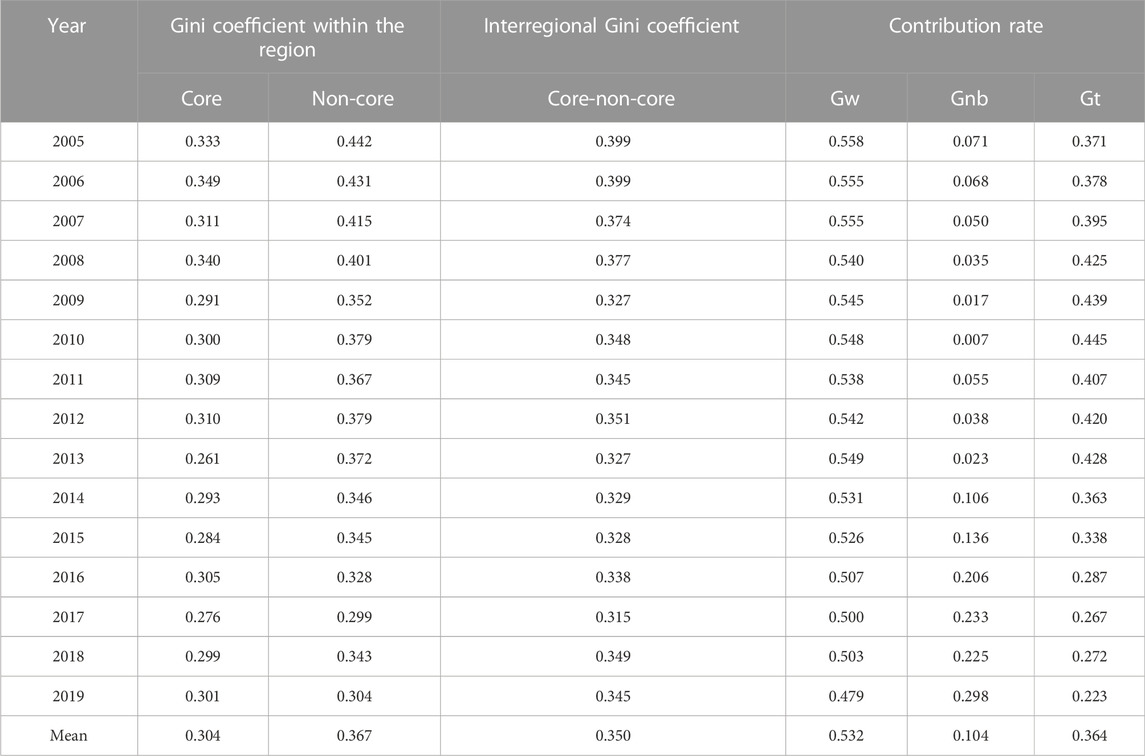
TABLE 4. Disparities in ULGUE in the Yangtze river economic belt (II).
From the perspective of change trend, Gini coefficient of both core and non-core environmental protection cities show a fluctuating downward trend, and the decline of non-core environmental protection cities was greater. The Gini coefficient between core and non-core environmental protection cities also show a trend of fluctuation and decline. The above trend indicates that with the continuous promulgation of China’s environmental protection policies, such as “promoting governance by awards” and “promoting governance by examination”, non-core environmental protection cities are catching up with core environmental protection cities, and the ULGUE difference within non-core environmental protection cities and between non-core environmental protection cities and core environmental protection cities has decreased significantly.
From the perspective of contribution rate of difference, the average contribution rate of intra-city difference, inter-city difference and super variable density of different environmental protection types is 53.2%, 10.4% and 36.4%, respectively. Among them, intra-city difference of different environmental protection cities is the main source of ULGUE in the Yangtze River Economic Belt. From the perspective of the trend of change, the difference within cities of different environmental protection cities and the contribution rate of super variable density showed a decreasing trend, while the contribution rate of inter-city difference showed an increasing trend. The possible reason is that different environmental protection cities have different degrees of green development, and the undesired output generated by unit land production is quite different, which has a strong rationality. Therefore, we should pay more attention to the coordination of ULGUE in different environmental protection cities.
Although the Dagum Gini coefficient can describe the relative differences in ULGUE and their sources in the Yangtze River Economic Belt, it is impossible to judge the absolute differences in ULGUE in the Yangtze River Economic Belt by the evolution of the crests as in the Kernel function. To this end, this study uses Origin software to plot the box line diagram and Kernel density estimation map of urban land green utilization in the Yangtze River Economic Belt as a whole and in the upstream, middle and lower reaches, and explores the dynamic evolution of its empirical distribution and fitted distribution, and the results are shown in Figure 5.
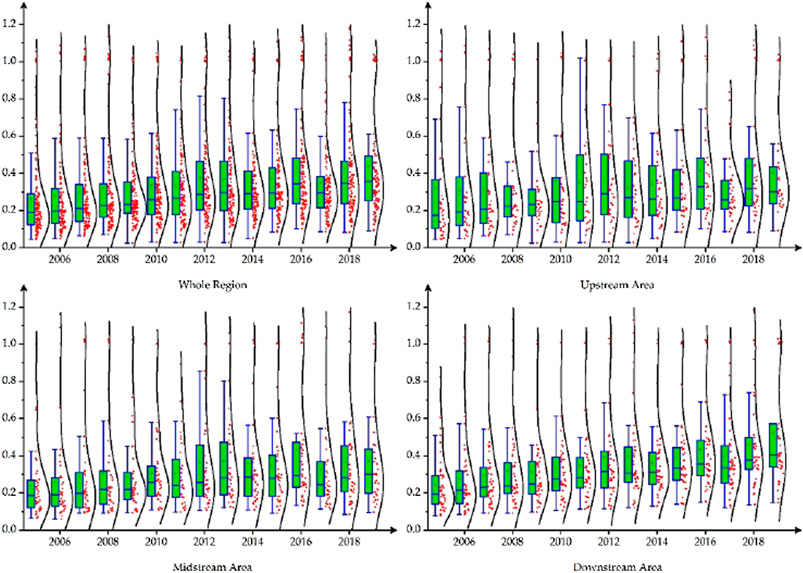
FIGURE 5. Distribution dynamics of ULGUE in the Yangtze River Economic Belt.
During the sample period, the box line diagram and distribution curve of ULGUE of the Yangtze River Economic Belt as a whole and the upstream, middle and downstream cities all had a tendency to move to high values, indicating that the ULGUE in the Yangtze River Economic Belt generally showed an increasing trend, which is consistent with the typical fact that the Yangtze River Economic Belt should become a demonstration belt for the construction of ecological civilization. From the perspective of the three major regions, relatively speaking, the distribution curve of ULGUE in the lower reaches of the Yangtze River move to the high value the most, followed by the middle reaches, and the lowest in the upstream, indicating that the ULGUE in the downstream areas of the investigation period was the most improved, which is consistent with the characteristic factual analysis of the timing evolution trend of the previous context.
Although the average value of ULGUE in the Yangtze River Economic Belt generally showed an upward trend between 2005 and 2019, the deviation between the majority and mean value is large, and most of the representative cities are gathered in the low-value part, and only a few prefecture-level cities move closer to the high value, which show that although the ULGUE is generally on the rise, the differences between cities are more obvious and have an unbalanced development trend. To a certain extent, this reflects that the degree of dispersion of the level of ULGUE in the Yangtze River Basin has increased, which is due to the large area and wide range of the Yangtze River Basin, the soil quality, resource environment, and economic development level in different regions are very different, and there are large differences in the choice and difficulty of achieving the improvement of ULGUE. Specifically, during the period 2005–2008, the size of the range of 25% and 75% quantiles of the box map remains basically unchanged, indicating that the absolute difference in ULGUE between cities during this period remained basically unchanged. During the period from 2009 to 2013, the intervals of 25% and 75% quantiles of the box diagram become significantly larger, and the density curve is flattered, indicating that the absolute difference in ULGUE between cities increase significantly in this period. After 2013, the range of 25% and 75% quantiles for boxplots has shrunk significantly compared to 2009–2013.
The overall distribution curve of ULGUE in the Yangtze River Economic Belt has always exist in the polarization phenomenon of “main peak” and “side peak” during the investigation period, of which the main peak is mainly located near the median and gathers to a low value, while the side peak is mainly located near 1, the reason for this phenomenon may be: 1) The use of super efficiency DEA to measure the green use efficiency of urban land, the use of high efficiency of the city as the frontier and the efficiency value is set to greater than or equal to 1. Other inefficient cities will be compared to these cities and the efficiency value will tend to be less than 1, resulting in the fact that the values of high ULGUE are mostly concentrated around 1, while inefficient cities are far away from 1. In particular, if measured directly using the non-super-efficient DEA method, the value of high utilization efficiency will be equal to 1. 2) There is indeed obvious polarization between cities, mainly reflected in the large gap between 75% of the digits and the efficiency equal to 1, which shows that ULGUE of most cities in the Yangtze River Economic Belt is still at a low level, and only a small number of cities are at a high level of ULGUE. For the upstream region, polarization decreased significantly in 2013 and 2017, and remained largely unchanged in other years. For the midstream region, the polarization phenomenon has a significant inverted “U” trend from 2005 to 2011, that is, the distance between low value aggregation and high value aggregation in the region is reduced. In the downstream areas, except for the low polarization phenomenon in 2005, the polarization phenomenon in other years is more obvious.
The Kernel density function can characterize the distribution dynamics and evolution trend of ULGUE in the Yangtze River Economic Belt, but it is impossible to judge the transfer law between different levels and the influence of neighboring cities on the ULGUE in the region, so this study uses ordinary Markov chain and spatial Markov chain method to analyze it. Specifically, according to the hierarchical classification method described above, the sample data from 2005 to 2019 are divided into four types of quartile methods, namely low level L), medium and low level (ML), medium and high level (MH) and high level H), and the maximum likelihood method is used to estimate the probability matrix of spatial Markov transfer of the two types, where the main diagonal line indicates the probability that the state of ULGUE remains unchanged, and the non-diagonal indicates the probability of state change, that is, the probability of upward or downward transfer.
Table 5 shows the estimation results of Markov chains without spatial lag and different types of spatial hysteresis. It can be seen that during the investigation period, the dynamic evolution of ULGUE in the Yangtze River Economic Belt without considering the geospatial pattern has the following characteristics: 1) There is a phenomenon of “four kinds of club convergence” in the change of ULGUE. The transfer probability on the diagonal is greater than the transfer probability on the non-diagonal line, indicating that the green use efficiency of land in the Yangtze River Economic Belt is more likely to remain in its original state. Among them, the probability of L, ML, MH and H maintaining the original state is 78.4%, 67.1%, 74.2 and 84.5% respectively, which shows that the probability of convergence of H, L and MH is larger than L, indicating that under normal circumstances, the state of high level of ULGUE will continue to maintain a high level of development without regression, while cities with low level of ULGUE will not easily develop to the next level. It reflects the path dependence characteristics of ULGUE change. 2) For ML and MH where there is an upward and downward transfer, the probability of upward transfer is greater than the probability of downward transfer. Among them, the probability of ML to MH and L transfer is 18.8% and 9.4%, and the probability of MH to H and ML is 15.5% and 9.8%, respectively, indicating that with the promotion of interregional coordinated development strategy and the deepening of inter-regional exchanges, the ULGUE has a trend of upward transfer, but it is also necessary to be vigilant against the possibility of reverse transformation of ULGUE. 3) The cross-stage transfer probability of L, ML, MH and H is very small. Among them, the probability of L to MH and H transfer is 1.0% and 0.8%, the probability of ML to H transfer is 4.7%, the probability of MH to L transfer is 0.5%, and the probability of H to L and ML transfer is 1.6% and 2.2%, indicating that the ULGUE is not prone to cross-level transfer.
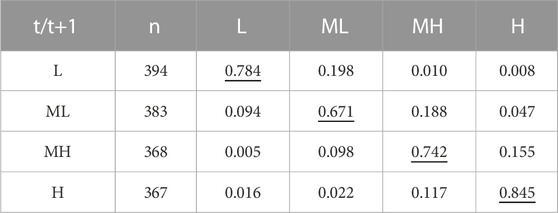
TABLE 5. Traditional Markov transfer probability matrix of ULGUE in the Yangtze River Economic Belt.
In this study, the Q statistics of 777.07 obtained by calculation are much greater than
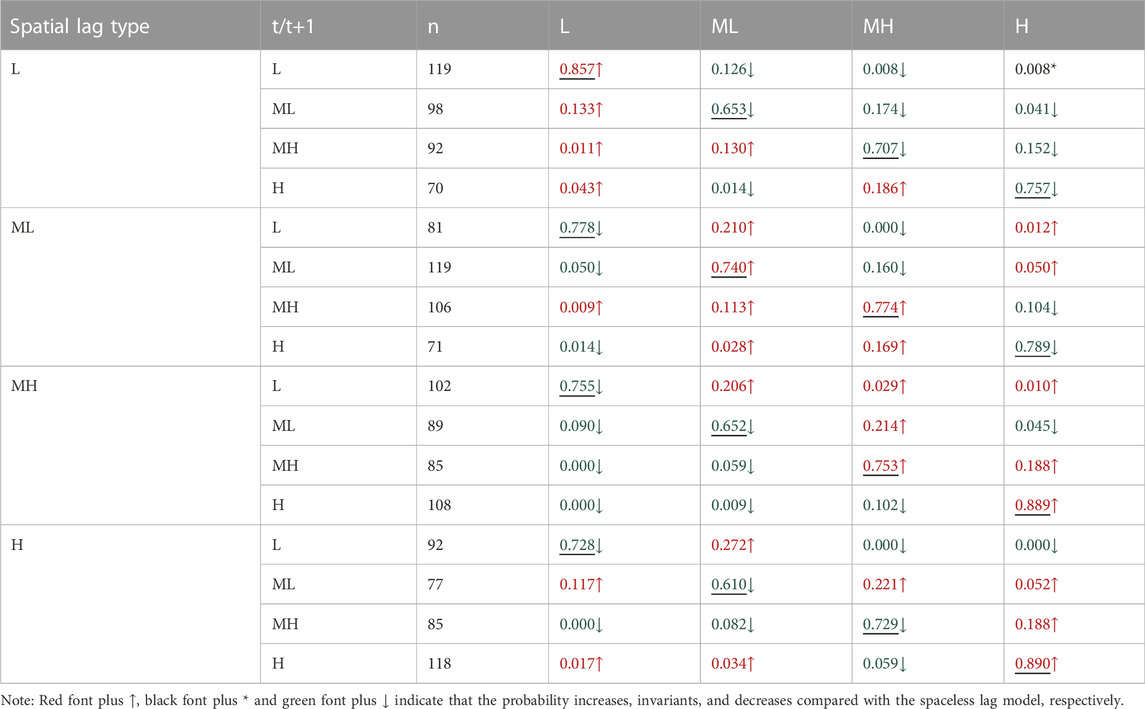
TABLE 6. Markov transfer probability matrix of ULGUE in the Yangtze River Economic Belt.
The spatial distribution of traditional Markov state transfers is shown in Figure 6. From the perspective of the number of state transfers, during the inspection period, the number of cities in the Yangtze River Economic Belt where the ULGUE is transferred upwards accounted for the majority, and the number of cities that maintained stability and downward transfer is relatively small. Among them, the prefecture-level cities that have shift upward account for 61.11% of the total number of research cities in the Yangtze River Economic Belt, the prefecture-level cities that have shift downward account for 4.63% of the total number of study cities, and the prefecture-level cities that have maintained a stable state account for 34.26% of the total number of research cities. From the perspective of state transfer distribution, the upward transfer area is mainly concentrated in the cities on both sides of the Yangtze River, of which the downstream areas are more widely distributed, and the areas that maintain stability are mainly concentrated in the middle and lower reaches of the area, while the areas that are transferred downward are mainly Lincang City, Baoshan City, Loudi City, Anqing City and Huainan City.
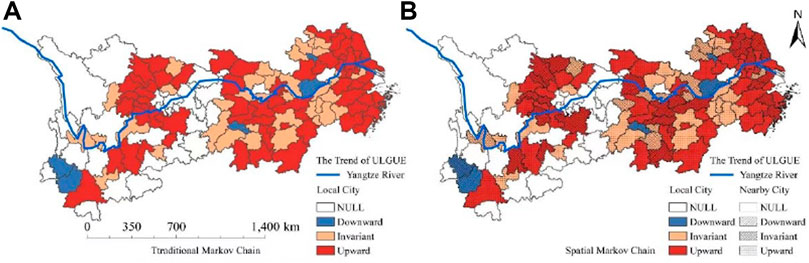
FIGURE 6. Spatial pattern of ULGUE transfer type in the Yangtze River Economic Belt.
The spatial distribution of spatial Markov state transfers is shown in Figure 6B. From the quantitative point of view, during the investigation period, the number of upward, invariant and downward transfers of urban neighborhoods is comparable to the number of urban areas, and the upward transfer still accounts for the majority, followed by stability, and the number of cities moving downward is the smallest. From the perspective of state transfer distribution, the upward transfer area is still mainly concentrated in the cities on both sides of the Yangtze River, of which the downstream areas are more widely distributed, the areas that remain stable are mainly concentrated in the middle and lower reaches of the area, and the areas that are transferred downward are mainly Lincang City, Loudi City, Anqing City and Huainan City. It is worth noting that the combination of neighborhood transfer and regional transfer can be found that there is no jumping transfer phenomenon (“neighborhood shift down-regional transfer upward” or “neighborhood transfer upward-regional transfer downward”), which once again verifies that the transfer of ULGUE in the Yangtze River Economic Belt has the convergence of space clubs and spatial spillover effects.
1) The green use efficiency of urban land in the Yangtze River Economic Belt increased in a fluctuating manner. As for the growth trend, the ULGUE of the Yangtze River Economic Belt show a fluctuating upward trend from 2005 to 2019, which is consistent with previous conclusions (Li and Zhang, 2018; Zhang L. S. Y. et al., 2020) on the traditional land use efficiency of the Yangtze River Economic Belt. However, compared with their research, we find that after considering the undesired output of land use, the ULGUE in the Yangtze River Economic Belt is lower than the traditional land use efficiency measured in previous studies. At the same time, compared with the growth rate of the same period in previous studies, the growth rate of ULGUE is also lower than that of traditional land use efficiency. The above two points indicate that there may be an overestimation of land use efficiency, if undesired output is not considered. Therefore, under the current background of China’s green transformation development and ecological civilization construction, it is necessary to study the ULGUE of the Yangtze River Economic Belt, which can more suitably reflect the current situation and trend of the urban green transformation development of the Yangtze River Economic Belt.
2) Reasons for regional differences of ULGUE in the Yangtze River Economic Belt. In terms of regional differences, ULGUE in the Yangtze River Economic Belt shows spatial imbalance, with significant differences between upstream, middle and downstream, which is consistent with the previous research (Jin et al., 2018) on traditional land use efficiency. The main reason for the regional differences of ULGUE in the Yangtze River Economic Belt is that, there are obvious differences between the actual input of labor, capital, land and energy in different regions and the desired and undesired outputs. The unreasonable spatial allocation of input factors leads to the waste of land resources. Therefore, it is necessary to further clarify the geographical spatial form of ULGUE. At the same time, according to the research in this study, the regional differences of ULGUE in the Yangtze River Economic Belt has narrowed. The main reason is that, with the continuous promotion of China’s regional economic integration strategy, urban economic growth strategies in different spatial areas have gradually changed from mutual competition to horizontal cooperation. This change has brought about government policy support, industrial structure selection, the agglomeration of resource elements and the innovation of production technology will directly or indirectly affect the green use efficiency of urban land from the macro, meso and micro levels (Ge et al., 2021a; Ge et al., 2021b), thus helping to reduce the differences of ULGUE in the Yangtze River basin.
3) Spatial polarization of ULGUE in the Yangtze River Economic Belt. According to the research conclusion, the distribution dynamics of ULGUE in the Yangtze River Economic Belt has an unbalanced development trend from 2005 to 2019. The overall distribution curve has a double peak feature of “main peak” and “side peak”, which indicates that there is a relatively obvious spatial polarization phenomenon in ULGUE in the Yangtze River Economic Belt, and there is a gradient effect between ULGUE in different regions. The reason for this phenomenon may be that the soil quality, resource environment, and economic development level in different regions are quite different, and the path selection and difficulty of improving the ULGUE are quite different. At the same time, it reflects that the green land-use efficiency of most cities in the Yangtze River Economic Belt is still at a low level, and a few cities have a high level of green land use efficiency.
4) Spatial spillover effect of ULGUE in the Yangtze River Economic Belt. The ULGUE of the Yangtze River Economic Belt has obvious characteristics of “spatial club convergence”. At the same time, using the spatial Markov chain, the change of ULGUE in the vicinity of the Yangtze River Economic Belt shows a “spatial spillover” effect. This is consistent with the relevant research conclusions (Cui, 2014; Lu et al., 2020). It shows that ULGUE has obvious spatial correlation, and is strongly affected by land use in adjacent areas. Moreover, land use between different regions has obvious “feedback effect” (Ward and Gleditsch, 2018). Policy measures and strategic actions taken in land resource management, environmental governance intensity, etc. have imitation effect and competition effect. At the same time, compared with previous studies, this study finds that when a city with a higher level is adjacent to itself, the probability of self-transfer to a higher level tends to increase, which proves that there is not only a “feedback effect” between different regions, but also an obvious “positive feedback effect”.
In view of the above research conclusions, this study believes that narrowing the gap in the green use efficiency of urban land, gradually eliminating the polarization phenomenon in the process of land green utilization, and promoting the balanced development of urban land green use efficiency are favorable measures to enhance the green development of the Yangtze River Economic Belt. We make the following policy recommendations:
At the national level as a whole, the implementation of the Yangtze River Protection Law of the People’s Republic of China is of great importance, and the government should optimize the spatial structure and layout of the Yangtze River Basin and implement the zoning and classified use control system. At the same time, it is of great significance to scientifically and orderly arrange the ecological, agricultural, urban and other functional spaces in the Yangtze River Basin, and delineate the ecological protection red line, permanent basic farmland and urban development boundary. In addition, under the framework of top-level design, the spatial structure and layout of the national land should be optimized, and the ecological transfer compensation should be given to the key areas of ecological environmental protection.
At the regional level of the Yangtze River Basin, the government should deepen the structural reform of the land supply side, fully consider the differences in geographical location, land resource endowments and economic development stages of cities, and take comprehensive management measures for land according to local conditions due to the combination of district policies and urban policies. In terms of projects, funds, talents, management, etc., support should be given to the implementation of ecological environment restoration and other protection measures in the source and upstream areas of the Yangtze River Basin, so as to enhance the ability of ecological environment restoration and implementing other protection measures in the ecologically fragile areas of the Yangtze River Basin.
At the inter-regional level of the Yangtze River Basin, it is needed to pay more attention to the spatial spillover effect between neighboring cities, and strengthen the cooperation and exchange of land development and utilization and ecological environment protection among regions. Under the guidance of the new development concept, to construct a reasonable urban hierarchy is crucial. In addition, to play the leading role of high-level urban land green use in innovative ecology, ecological collaborative governance, higher level opening up, urban-rural integration, etc., and promote the coordinated development of urban land green use efficiency in the Yangtze River Basin from the fields of economic synergy, social synergy and ecological synergy are suggested.
This study uses the EBM model to calculate the ULGUE of the Yangtze River Economic Belt from 2005 to 2019, and makes a deeper discussion based on Dagum Gini coefficient, Kernel density estimation and Markov chain method to reveal that there are still some shortcomings in this study and the relevant results have certain limitations in guiding practice. On the one hand, the issue of ULGUE in the Yangtze River Economic Belt is a complex system involving nature, economy, society, culture and ecology. Although the EBM model can take both expected and unexpected outputs into consideration, a comprehensive measurement of ULGUE may also include more indicators of expected output, unexpected output and input factors. At the same time, how to build an evaluation index system of ULGUE more in line with its own characteristics in view of the current situation of urban green land-use in the Yangtze River basin plays an important role in more accurately grasping the context of urban land development in the Yangtze River basin, which needs to be deepened in the follow-up research. On the other hand, it is found in the study that there is a spatial spillover effect on ULGUE in the Yangtze River Economic Belt. However, how to estimate the size of this spatial effect, we need to use the spatial panel regression econometric model for specific parametric estimation in the next step.
In addition to the above limitations, we believe that future research can be deepened from the following two aspects. 1) We need to analyze the efficiency of green land use from the perspective of the whole life cycle of land use. The research on green land use is a complex system, involving the investigation, monitoring and accounting of different types of land use, the analysis of land green use efficiency at different spatial and temporal scales, and the low-carbon target-oriented land use management and other aspects. Therefore, a systematic framework for the study of ULGUE can be constructed from the perspective of the whole life cycle of land green use in the future. 2) We need to expand the research scope of land green use. In terms of vertical dynamic development, factors affecting land green use efficiency can be deeply explored from the micro-scope such as terrain, slope, soil layer thickness, soil biology and mineral content. At the same time, we can discuss the characteristics of green land use efficiency development through coupling and comparative analysis of different scope, and establishing a model or indicator system with universal applicability.
Publicly available datasets were analyzed in this study. This data can be found here: https://www.epsnet.com.cn/index.html#/Index.
Conceptualization, XC; methodology, YQ; software, ML; validation, YQ and XC; formal analysis, XC; investigation, YQ; resources, XC; data curation, XC; writing—original draft preparation, XC; writing—review and editing, YQ; visualization, ML; supervision, ML and YQ; project administration, XC; funding acquisition, XC. All authors have read and agreed to the published version of the manuscript.
The research was funded by Humanities and Social Sciences Research Project of Jiangxi Colleges and Universities (No. JJ21221), National Natural Science Foundation of China (No. 72263013), and National Natural Science Foundation of China (No. 72063013).
The authors declare that the research was conducted in the absence of any commercial or financial relationships that could be construed as a potential conflict of interest.
All claims expressed in this article are solely those of the authors and do not necessarily represent those of their affiliated organizations, or those of the publisher, the editors and the reviewers. Any product that may be evaluated in this article, or claim that may be made by its manufacturer, is not guaranteed or endorsed by the publisher.
1The Yangtze River Economic Belt traverses the three major regions of East, West, central China, covering 11 provinces and cities including Shanghai, Jiangsu, Zhejiang, Anhui, Jiangxi, Hubei, Hunan, Chongqing, Sichuan, Yunnan and Guizhou.
Ahmad, M., Işık, C., Jabeen, G., Ali, T., Ozturk, I., and Atchike, D. W. (2021). Heterogeneous links among urban concentration, non-renewable energy use intensity, economic development, and environmental emissions across regional development levels. Sci. Total Environ. 765, 144527. doi:10.1016/j.scitotenv.2020.144527
Cartier, C. (2001). Zone fever', the arable land debate, and real estate speculation: China's evolving land use regime and its geographical contradictions. J. Contemp. China 10, 445–469. doi:10.1080/10670560120067135
Chen, D. L., Lu, X., Zhang, C., Hu, W., and Li, Y. (2022). Path selection of improving urban land green use efficiency driven by collaborative innovation from the perspective of configuration. China Popul. Resour. Environ. 32, 103–111.
Chen, S. (2015). Environmental pollution emissions, regional productivity growth and ecological economic development in China. China Econ. Rev. 35, 171–182. doi:10.1016/j.chieco.2014.08.005
Chen, D., Lu, X., and Kuang, B. (2018). Dynamic evolution and spatial convergence of urban land use efficiency in the middle reaches of the Yangtze River. Chinese J. Popul. Resour. Environ. 28 (12), 106–114.
Choi, Y., and Wang, N. (2017). The economic efficiency of urban land use with a sequential slack-based model in Korea. Sustainability 9, 79. doi:10.3390/su9010079
Cui, J., Kong, X., Chen, J., Sun, J., and Zhu, Y. (2021). Spatially explicit evaluation and driving factor identification of land use conflict in yangtze river economic belt. Land 10, 43. doi:10.3390/land10010043
Cui, X. (2014). The spatial pattern and spillover effect of land-use efficiency. Econ. Manag. 28, 19–25.
Dagum, C. (1997). A new approach to the decomposition of the Gini income inequality ratio. Empir. Econ. 22, 47–63. doi:10.1007/978-3-642-51073-1_4
Ding, Y., Guo, Q., and Qin, M. (2021). Temporal-spatial evolution and influencing factors of land green use efficiency of resource-based cities in the Yellow River Basin, China. Trans. Chin. Soc. Agric. Eng. 37 (19), 250–259.
Fukuyama, H., and Weber, W. L. (2009). A directional slacks-based measure of technical inefficiency. Socio-Econ. Plan. Sci. 43, 274–287. doi:10.1016/j.seps.2008.12.001
Ge, K., Zou, S., Ke, S., and Chen, D. (2021a). Does urban agglomeration promote urban land green use efficiency? Take the Yangtze River Economic zone of China as an example. Sustainability 13, 10527. doi:10.3390/su131910527
Ge, K., Zou, S., Lu, X., Chen, D., and Kuang, B. (2021b). Spatial convergence of urban land green utilization efficiency under the background of regional integration:take the Yangtze River Economic belt as an example. East China Econ. Manag. 35, 31–41.
Han, L., and He, T. (2022). Measurement of urban land green use efficiency and its spatiotemporal evolution in the Yellow River Basin. J. Henan Univ. Nat. Sci. 52, 405–415.
Hu, B., Li, J., and Kuang, B. (2018). Evolution characteristics and influencing factors of urban land use efficiency difference under the concept of green development. Econ. Geogr. 38, 183–189.
Huang, C. W. C. (2021). Research on the synergetic effect of industrial green transformation and ecological civilization construction in the Yangtze River Economic belt. Resour. Environ. Yangtze Basin 30, 1287–1297.
Jin, G. D. X., Zhao, X., Guo, B., and Yang, J. (2018). Spatio-temporal patterns of urban land use efficiency in the Yangtze River Economic Zone during 2005-2014. Acta Geogr. Sin. 73, 1242–1252.
Krekel, C., Kolbe, J., and Wüstemann, H. (2016). The greener, the happier? The effect of urban land use on residential well-being. Ecol. Econ. 121, 117–127. doi:10.1016/j.ecolecon.2015.11.005
La Rosa, D., Barbarossa, L., Privitera, R., and Martinico, F. (2014). Agriculture and the city: A method for sustainable planning of new forms of agriculture in urban contexts. Land use Policy 41, 290–303. doi:10.1016/j.landusepol.2014.06.014
Lambin, E. F., and Meyfroidt, P. (2010). Land use transitions: Socio-ecological feedback versus socio-economic change. Land use Policy 27, 108–118. doi:10.1016/j.landusepol.2009.09.003
Li, L. D. J., and Zhang, J. (2018). Regional difference and formation mechanism of urban land use efficiency in the Yangtze River Economic belt. Resour. Environ. Yangtze Basin 27, 1665–1675.
Li, F., Liu, X., Hu, D., Wang, R., Yang, W., Li, D., et al. (2009). Measurement indicators and an evaluation approach for assessing urban sustainable development: A case study for China's jining city. Landsc. urban Plan. 90, 134–142. doi:10.1016/j.landurbplan.2008.10.022
Li, H., Luo, L., Zhang, X., and Zhang, J. (2020). Dynamic change of agricultural energy efficiency and its influencing factors in China.China Population. Resour. Environ. Yangtze Basin 30, 105–115.
Liang, L., Yong, Y., and Yuan, C. (2019). Measurement of urban land green use efficiency and its spatial differentiation characteristics: An empirical study based on 284 cities. China Land Sci. 33, 80–87.
Lin, Q., and Ling, H. (2021). Study on green utilization efficiency of urban land in Yangtze River delta. Sustainability 13, 11907. doi:10.3390/su132111907
Liu, Y. (2018). Introduction to land use and rural sustainability in China. Land use Policy 74, 1–4. doi:10.1016/j.landusepol.2018.01.032
Lu, X., Kuang, B., and Li, J. (2018). Regional difference decomposition and policy implications of China's urban land use efficiency under the environmental restriction. Habitat Int. 77, 32–39. doi:10.1016/j.habitatint.2017.11.016
Lu, X., Yang, X., and Chen, Z. (2020). Measurement and temporal-spatial evolution characteristics of urban land green use efficiency in China. China Popul. Resour. Environ. 30, 83–91.
Lu, X., Li, J., Liu, C., Kuang, B., Cai, D., and Hou, J. (2022). Driving factors and spatial differentiation of the urban land green use efficiency in China. Sci. Geogr. Sin. 42, 611–621.
Martínez-Zarzoso, I., and Maruotti, A. (2011). The impact of urbanization on CO2 emissions: evidence from developing countries. Ecol. Econ. 70, 1344–1353. doi:10.1016/j.ecolecon.2011.02.009
Shan, H. (2008). Reestimating the capital stock of China:1952∼2006. J. Quant. Technol. Econ. 25, 17–31.
Skea, J., and Nishioka, S. (2008). Policies and practices for a low-carbon society. Clim. Policy 8, S5–S16. doi:10.3763/cpol.2008.0487
Su, H., and Yang, S. (2022). Spatio-temporal urban land green use efficiency under carbon emission constraints in the Yellow River Basin, China. Int. J. Environ. Res. Public Health 19, 12700. doi:10.3390/ijerph191912700
Tan, S., and Zou, S. (2022). Study on the evolution characteristics and influencing factors of land disputes in the Yangtze River Economic belt. China Land Sci. 36, 22–31.
Tan, S., Hu, B., Kuang, B., and Zhou, M. (2021). Regional differences and dynamic evolution of urban land green use efficiency within the Yangtze River Delta, China. Land Use Policy 106, 105449. doi:10.1016/j.landusepol.2021.105449
Tone, K., and Tsutsui, M. (2010). An epsilon-based measure of efficiency in DEA–a third pole of technical efficiency. Eur. J. Oper. Res. 207, 1554–1563. doi:10.1016/j.ejor.2010.07.014
Tone, K. (2001). A slacks-based measure of efficiency in data envelopment analysis. Eur. J. Oper. Res. 130, 498–509. doi:10.1016/S0377-2217(99)00407-5
Tong, D., Yuan, Y., and Wang, X. (2021). The coupled relationships between land development and land ownership at China’s urban fringe: A structural equation modeling approach. Land Use Policy 100, 104925. doi:10.1016/j.landusepol.2020.104925
Verma, P., and Raghubanshi, A. (2018). Urban sustainability indicators: Challenges and opportunities. Ecol. Indic. 93, 282–291. doi:10.1016/j.ecolind.2018.05.007
Wang, A., Lin, W., Liu, B., Wang, H., and Xu, H. (2021). Does smart city construction improve the green utilization efficiency of urban land? Land 10, 657. doi:10.3390/land10060657
Wang, D., and Pang, X. (2019). Research on green land-use efficiency of Beijing-Tianjin-Hebei urban agglomeration.China Population. Resour. Environ. Yangtze Basin 29, 68–76.
Wang, C., Zhu, G., Huang, J., and Zou, W. (2022). Study on temporal and spatial pattern evolution and driving factors of market level of industrial land in Yangtze River Economic belt. Resour. Environ. Yangtze Basin 31, 823–831.
Wang, P., Shao, Z., Wang, J., and Wu, Q. (2021). The impact of land finance on urban land use efficiency: A panel threshold model for Chinese provinces. Growth Change 52, 310–331. doi:10.1111/grow.12464
Wang, S., Yang, C., and Li, Z. (2021). Spatio-temporal evolution characteristics and spatial interaction spillover effects of new-urbanization and green land utilization efficiency. Land 10, 1105. doi:10.3390/land10101105
Xie, H., Chen, Q., Lu, F., Wu, Q., and Wang, W. (2018). Spatial-temporal disparities, saving potential and influential factors of industrial land use efficiency: A case study in urban agglomeration in the middle reaches of the Yangtze River. Land use policy 75, 518–529. doi:10.1016/j.landusepol.2018.04.027
Xu, Z. X. W., and Liu, C. (2021). Influences of environmental regulations on green land use efficiency. China Land Sci. 35, 87–95.
Yin, F., Zhou, T., and Ke, X. (2021). Impact of cropland reclamation on ecological security in the Yangtze River Economic belt, China. Sustainability 13, 12735. doi:10.3390/su132212735
Yu, J., Zhou, K., and Yang, S. (2019). Land use efficiency and influencing factors of urban agglomerations in China. Land Use Policy 88, 104143. doi:10.1016/j.landusepol.2019.104143
Yu, H., Song, G., Li, T., and Liu, Y. (2020). Spatial pattern characteristics and influencing factors of green use efficiency of urban construction land in Jilin province. Complexity 2020. doi:10.1155/2020/5637530
Zhang, R., Zhang, X., and Yin, P. (2022). Spatial-temporal differentiation and driving factors identification of urban land resources carrying capacity in the Yangtze River Economic belt. Econ. Geogr. 42, 185–192.
Zhang, L., Bi, X., and Huang, Z. (2020). Urban industrial land use efficiency under the background of economic transformation in the Yangtze River Economic Belt. Resour. Sci. 42, 1728–1738. doi:10.18402/resci.2020.09.08
Zhang, L. S. Y., Zhu, D., and Huang, A. (2020). Spatial temporal pattern evolution and influencing factors of urban construction land use efficiency in Yangtze River Economic belt. Areal Res. Dev. 39, 154–159.
Zhao, L., Cao, N., Han, Z., and Gao, X. (2021). Spatial correlation network and influencing factors of green economic efficiency in China. Resour. Sci. 43, 1933–1946. doi:10.18402/resci.2021.10.01
Zhao, P. (2016). Planning for social inclusion: The impact of socioeconomic inequities on the informal development of farmland in suburban Beijing. Land Use Policy 57, 431–443. doi:10.1016/j.landusepol.2016.06.010
Zhong, S., Li, X., and Ma, J. (2022). Impacts of land finance on green land use efficiency in the Yangtze River Economic belt: A spatial econometrics analysis. Environ. Sci. Pollut. Res. 29, 56004–56022. doi:10.1007/s11356-022-19450-1
Keywords: urber land, green use efficiency, regional differences, distribution dynamic evolution, Yangtze river economic belt
Citation: Cui X, Lin M and Qiu Y (2023) Regional differences and dynamic evolution of urban land green use efficiency within the Yangtze river economic belt, China. Front. Environ. Sci. 10:1098924. doi: 10.3389/fenvs.2022.1098924
Received: 15 November 2022; Accepted: 12 December 2022;
Published: 10 January 2023.
Edited by:
Xiaodong Yang, Xinjiang University, ChinaCopyright © 2023 Cui, Lin and Qiu. This is an open-access article distributed under the terms of the Creative Commons Attribution License (CC BY). The use, distribution or reproduction in other forums is permitted, provided the original author(s) and the copyright owner(s) are credited and that the original publication in this journal is cited, in accordance with accepted academic practice. No use, distribution or reproduction is permitted which does not comply with these terms.
*Correspondence: Xinghua Cui, MTIwMjAwMDAyNEBqeHVmZS5lZHUuY24=
Disclaimer: All claims expressed in this article are solely those of the authors and do not necessarily represent those of their affiliated organizations, or those of the publisher, the editors and the reviewers. Any product that may be evaluated in this article or claim that may be made by its manufacturer is not guaranteed or endorsed by the publisher.
Research integrity at Frontiers
Learn more about the work of our research integrity team to safeguard the quality of each article we publish.