 Zaicheng Xu
 Wei Xu1*
94% of researchers rate our articles as excellent or good
Learn more about the work of our research integrity team to safeguard the quality of each article we publish.
Find out more
ORIGINAL RESEARCH article
Front. Environ. Sci., 04 January 2023
Sec. Environmental Informatics and Remote Sensing
Volume 10 - 2022 | https://doi.org/10.3389/fenvs.2022.1097874
The geological disasters caused by the ground deformation of the goaf have brought huge security risks to the ecological environment and society. Therefore, it is imminent to realize the effective monitoring and stability analysis of the ground deformation of the goaf. In this paper, taking the goaf of the gypsum mine in Diaodao District, Jingmen City as an example, through the investigation of the overall structure and distribution characteristics of the gypsum goaf, combined with the mechanical parameters of the rock mass selected from the site, the InSAR and GNSS technology are used to analyze the ground of the goaf of the gypsum mine. Deformation monitoring is carried out to give full play to the advantages of InSAR monitoring with high vertical accuracy and GNSS monitoring with high horizontal accuracy. Analyzed the thickness conditions of the mined-out area of pillar, roof and overlying rock, established the numerical model of the goaf, and used FLAC (3D) to carry out numerical simulation on this basis to evaluate the stability of the goaf. The research shows that two subsidence areas and three deformation areas were deciphered by DInSAR and time series InSAR, respectively, and the deep buried areas in the goaf were monitored by GNSS. The surface deformation is dominated by horizontal displacement, and the direction of horizontal displacement is the whole points to the goaf. Finally, based on the conclusion that the gob is in different degrees of deformation, the stability of the gob is analyzed, and the area of surface subsidence is obtained by FLAC (3D) simulation.
China’s topography is complex, and the area of the goaf accounts for about 26% of the national mine area (Wang et al., 2019a). The over-exploitation of mineral resources has led to frequent occurrence of geological disasters such as landslides, and there is a trend of aggravation year by year, posing a great threat to people’s lives and property safety (Wang et al., 2018). Therefore, the application of modern spatial geodesy means to achieve effective monitoring of surface deformation (Zhou N. et al., 2021), analysis of the stability of the interior of the goaf to establish a geological disaster monitoring and early warning system, can prevent the occurrence of geological disasters at the same time a good ecological restoration, reduce people’s disaster losses (Zhang and Wang, 2021).
With the development of space earth observation technology, Interferometric Synthetic Aperture Radar (InSAR) technology has shown unprecedented potential in the field of surface deformation monitoring (Biggs and Wright, 2020). It can monitor the spatial position and small changes of ground points (Osmanoğlu et al., 2016; Zhang et al., 2021a), and can obtain high spatial resolution and large-scale surface deformation information throughout the day and all weather. Soil and other geological deformation monitoring fields (Yu et al., 2019; Yao et al., 2022). Combining InSAR technology to qualitatively and quantitatively interpret the deformation characteristics of the ground surface can realize the survey of disaster potential sites (Zhou W. et al., 2021). Global Navigation Satellite System (GNSS) technology is one of the important means to monitor the ground deformation by measuring the distance between at least four satellites to the ground receiver and solving the receiver’s position based on the satellite orbit coordinates to provide high precision and high temporal resolution three-dimensional point location information on the ground surface (Zhu et al., 2018; Lian et al., 2020). However, GNSS technology requires field survey and deployment, which makes it difficult to implement monitoring for disaster hazard points that are inaccessible to personnel (Zhang et al., 2021b), and is limited by the conditions of ground receiving equipment, which makes it difficult to deploy high-density GNSS stations, and is a discrete point observation with low spatial resolution and small coverage area, and it is easy to miss some potential dangerous deformation areas (Wang et al., 2021).
Casu et al. (2014) used SBAS-InSAR technology to monitor surface deformation in Naples, Italy and Los Angeles, United States, and its monitoring results were compared with GNSS data to verify the reliability of SBAS-InSAR in monitoring surface deformation. In 2013, Liu et al. (2013) The SBAS-InSAR technique was used to process Envisat SAR images between 2003 and 2010 to obtain the surface deformation in the Three Gorges reservoir area, identify two landslides in Badong County, and analyze the correlation between seasonal landslide movements and water level changes. In 2014, Calò et al. (2014) processed COSMO-SkyMed data using SBAS-InSAR technology to extract landslide deformation results in central Italy. In 2018, Zhao et al. (2018) used SBAS-InSAR technology to detect 22 landslides with more active surface deformation in the Jinsha River basin (Wudongde reservoir area) and analyzed their spatial and temporal deformation characteristics. In 2014, Zhao et al. (2019) monitored the Karakorum Highway landslide using SBAS-InSAR technology, and the analysis concluded that the Ghazi Valley and Tashkurgan Valley have high landslide sensitivity.
Goaf stability has long existed as an extremely complex problem in the field of geotechnical engineering related research and application (Jiang et al., 2017). It has many requirements and influencing factors, including geological and non-geological factors, as well as external influence processes and its own structural mutation processes (Shang et al., 2018). The more commonly used methods at home and abroad for the stability of the goafs are generally prediction method, analytical method, physical simulation method and numerical simulation method, using FLAC (3D) for the analysis of geotechnical engineering in the mining area (Wang et al., 2019b).
Research scholars have invested more research on the stability of the goafs and achieved better results, but there is still no more research on the monitoring of the goaf site, and there is even less analysis of the stability based on the monitoring of the whole goaf. In this paper, the distribution and structural characteristics of the goaf was surveyed by interpreting the study area of the quarry area in the gypsum mine in Duodao District, Jingmen City, in order to select the appropriate site rock mechanics parameters. At the same time, we prepare the mobile deformation monitoring and the theoretical analysis of roof stability for the goaf, establish the numerical model of mobile deformation, use InSAR and GNSS technology to analyze the monitoring results of the goaf, and use FLAC (3D) to conduct numerical simulation analysis of the goaf of gypsum mine to evaluate the stability in the goaf domain. The ultimate goal of this paper is to make a good risk assessment of the gypsum mine goaf in the Duodao District of Jingmen City, to achieve effective monitoring and stability analysis of the goaf, and to ensure that the gypsum mine goaf can carry out the next step of mine rehabilitation and the safety of the people in the area.
As shown in Figure 1, Duodao District is located in the main urban area of Jingmen City, the district has 207 national highway and soap dang, Jing Qian two provincial highway through, close to the Hulong high-speed and the second wide high-speed, convenient transportation. Jingmen Duoduo knife district white temple street area of 50.5 km2, arable land area of .328 km2, is the focus of construction and development of Jingmen City, the new city and the core area of urban economic development.
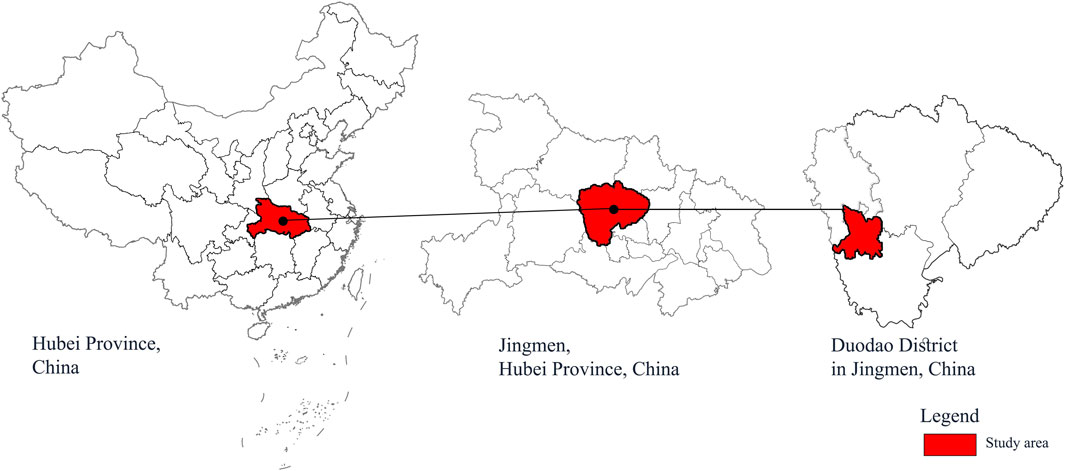
FIGURE 1. Location map of Duodao district.
Jingmen urban area is rich in gypsum mine mineral resources, in order to promote local economic development, as shown in Table 1, there were four gypsum mine enterprises engaged in mining activities on the south east side of the work area in the 1980s and 1990s, with a long history of mining, forming a large range of goafs. The total area of the mining area in the central city is about 42.89 km2, and the area of the goaf was about 11.95 km2 nearly one hundred ground collapses have occurred in each mining area, and the total area of collapse is about 3.854 km2. The collapse is concentrated in the area from Dongbao district and Duodao district to Macheng Town. The vertical displacement deformation produced by the ground deformation is large, and the damage to the original topography is serious, and it is more harmful to the basic facilities such as surface construction, transportation, agriculture, water and electricity and communication (Xu et al., 2020).
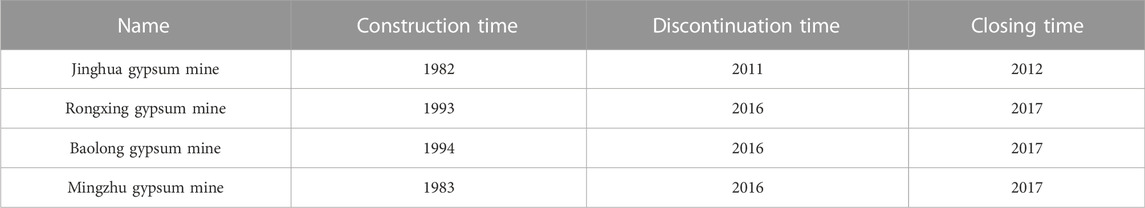
TABLE 1. Basic information of mines in the survey area.
The distribution of the goaf is mainly affected by the distribution of the ore layers, while the fault has an impact on the distribution of the goaf by controlling the distribution of the ore layers. There are nine layers of gypsum ore layers in the working area. The four mines in the Duodao area mainly mine the X gypsum group and the VI gypsum group. As shown in Figure 2, the X gypsum group is 1.91–12.98 m thick, The thickness of the VI gypsum formation is 1.27–4.32 m, the strike of the ore layers in the area is 247°, and the dip angle is 8°. There are nine faults in the area. The faults affect the mining difficulty and control the boundary of the goaf to a certain extent.
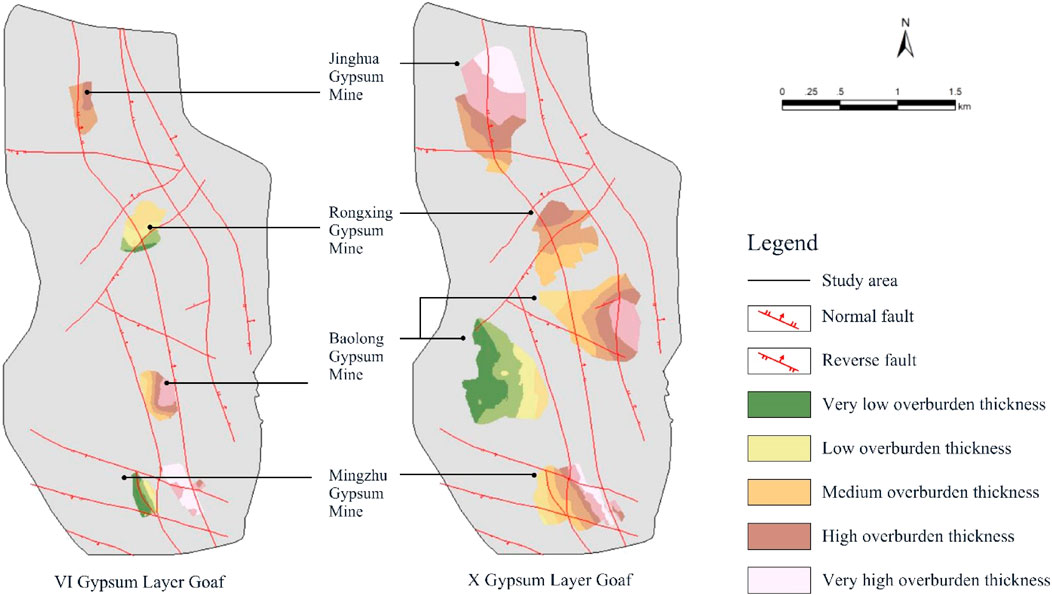
FIGURE 2. X and Ⅵ gypsum layer goaf.
The survey of the goaf was based on the collection of information, combined with the ground survey, the arrangement of physical prospecting to verify the preliminary analysis results, the physical prospecting anomalies and multi-solution lot arrangement of drilling for further verification, the final Table 2 comprehensive analysis to derive the scope of the mining area.
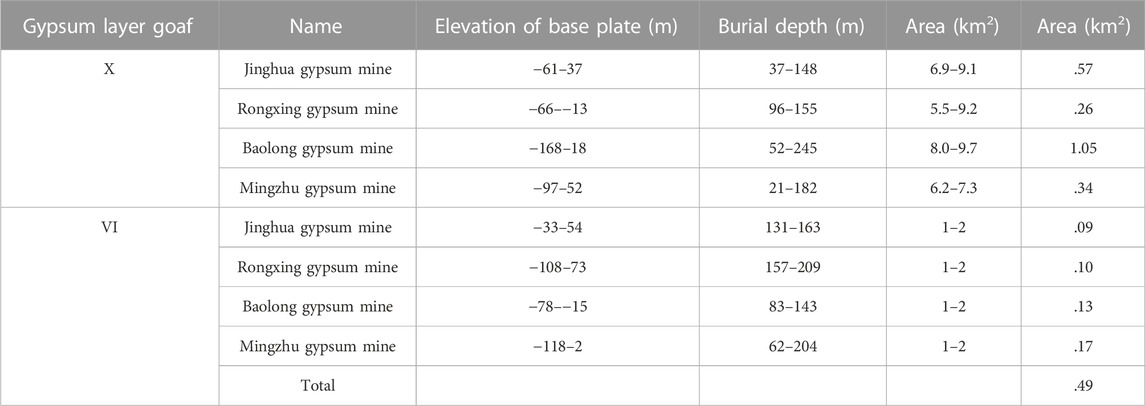
TABLE 2. Statistical table of the distribution of goafs in X and Ⅵ gypsum layer in each mining area.
The total area of Ⅹ gypsum layer quarrying area of four mines in Duodao district is 2.22 km2 and the total area of Ⅵ gypsum layer goaf is .49 km2. Among them, as shown in Figure 3, three mines, Jinghua, Rong Xing, and Ming Zhu, have double layer quarrying area overlapping area, and the Ⅹ gypsum layer goaf of Baolong gypsum mine does not overlap with the Ⅵ gypsum layer goaf. The overlapping area of double-layer goaf of Jinghua gypsum mine is .09 km2, and the vertical distance is about 39–61 m; the overlapping area of double-layer goaf of Rong Xing gypsum mine is .1 km2, and the vertical distance is about 42–50 m; the overlapping area of double-layer goaf of Ming Zhu gypsum mine is .11 km2, and the vertical distance is about 19–63 m
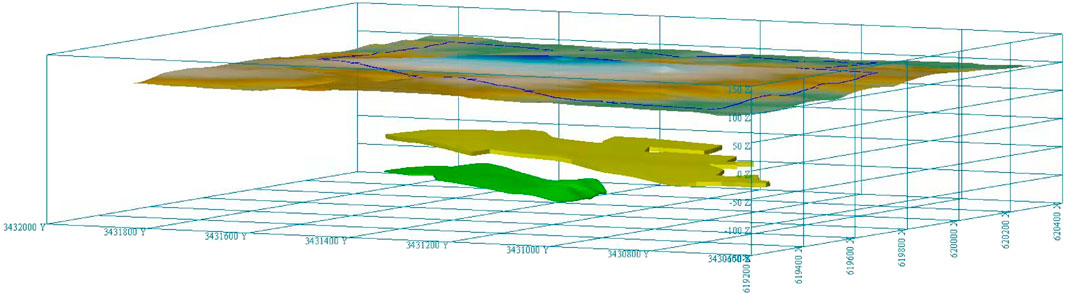
FIGURE 3. Spatial distribution diagram of Rongxing gypsum mine surface (top), X gypsum goaf (middle), VI gypsum goaf (bottom).
The material composition of the overburden in the upper part of the goaf mainly includes: Quaternary alluvium [Q] loose soil; Paleocene Lower Gongjiachong Group [E1g] very soft-soft sandstone rock group; Cretaceous Upper Runmagang Group [K2p] very soft-soft muddy siltstone and siltstone mudstone rock group. The thickness of the overburden in the upper part of the mining area is 21–245 m, and the overall thickness is thin in the North and East and thick in the south and west, and the middle part is thick in the middle and thin in the North and South, which is affected by the fault misalignment and surface undulation.
The gypsum mines in the area all adopt the shallow-hole room-and-pillar method, the backward retrieval production process, blasting drop, and light rail transportation (Zhu et al., 2019). Among them, Jinghua gypsum mine mining area inclination length 250 m, strike width 160.5 m, mine room length 70 m, width 8 m, average height 8 m, mine pillar width 4 m, interval 8 m, roof protection layer not less than 2 m; Rong Xing gypsum mine X gypsum pillar width 6–7 m, mine room width (pillar spacing) 7.5 m, mining height 6–7.5 m, roof plate not less than 2 m VI gypsum working face length 30 m, width 1.5 m, height The working face is arranged in two wings, each quarry working face is 65 m in length, 8 m in width and 6 m in height; the gypsum pillar of the X gypsum group of the Mingzhu gypsum mine is 6 m in width, the mine room is 7.5 m in width and 6 m in height, and the roof plate is 2 m thick. 6 m wide, 7.5 m wide, 6 m high and 2 m thick top plate.
The spatial structure of the goaf was initially determined according to the on-hole and off-hole control chart, mine development and utilization plan, and other related information, etc. Physical prospecting and drilling are used to verify and make corrections to the local lots, and the average values of the specifications of the mine pillar and mine house, roof thickness, and mining height are taken, and the specific results are shown in Table 3.
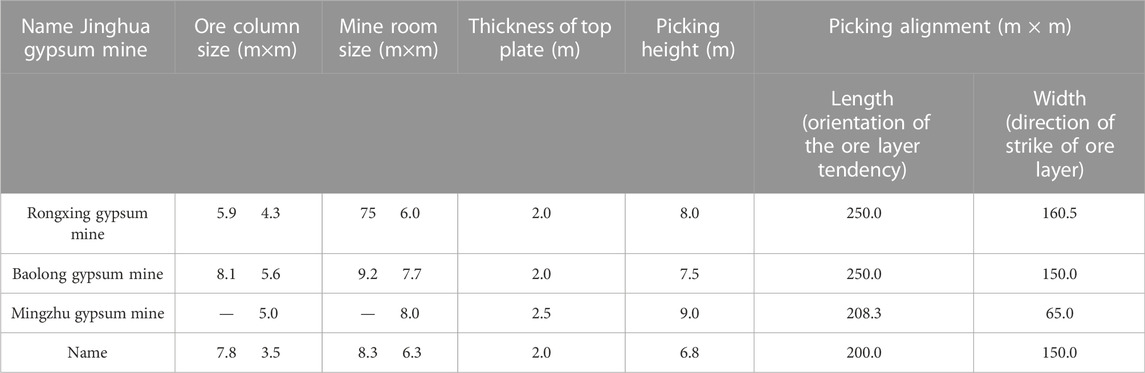
TABLE 3. Gypsum mine goaf structure survey form.
The geotechnical engineering geological types in the evaluation area are divided into the Fourth Series loose soil type and laminated soft-softer clastic rock type, two rock types and seven rock groups according to the geotechnical properties. The surrounding rocks in the goaf can be divided into four categories: Topsoil, muddy siltstone, siltstone mudstone, and gypsum rock. According to the mine survey report and with reference to the surrounding engineering geological data, the rock mechanical parameters calculated by stability analysis are shown in Table 4.
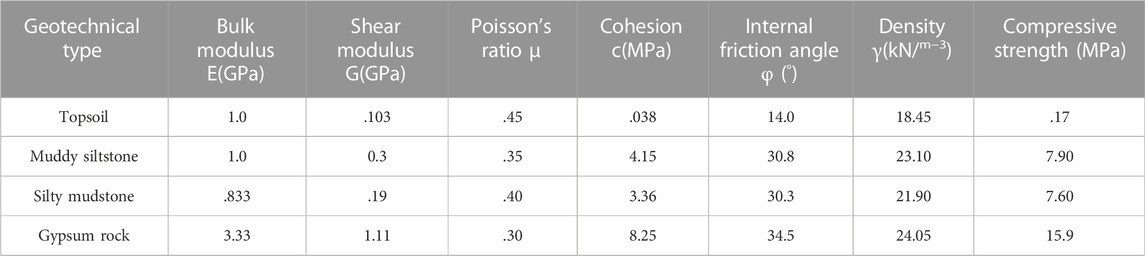
TABLE 4. Rock mechanical parameters.
As the mine has been closed in 2017, it is difficult to investigate the deformation in the goaf, and only its ground deformation can be investigated and analyzed at present. The ground deformation in the goaf is mainly manifested as ground collapse and ground cracking on a macroscopic scale, while the microscopic deformation of the ground in the goaf is difficult to observe with the naked eye, and this work mainly conducts preliminary analysis of the microscopic deformation in the extraction area through InSAR remote sensing survey and the information collected from GNSS monitoring (Del Soldato et al., 2021). InSAR and GNSS monitoring are both common methods for surface deformation monitoring in goaf, and both have obvious advantages and disadvantages. InSAR monitoring has the advantages of large range, non-contact, high density, traceability, and high cost performance, etc (Zhang and Lu, 2022). However, the results of InSAR interpretation are constrained by surface interference conditions and SAR data sources, and the horizontal displacement direction obtained from monitoring is ambiguous, and the monitoring results are relative deformation (Li et al., 2021a). GNSS monitors horizontal deformation with high accuracy, reliable results, real-time monitoring, obtains various types of data, and has the advantage of pro-disaster forecasting, but the vertical deformation accuracy is 2–3 times lower than the horizontal accuracy, and requires multiple sites for joint measurement, which is costly, complex system and poor robustness (Atanasova and Nikolov, 2020). InSAR and GNSS are used to analyze the surface deformation of the gypsum mining area in the Duodao district of Jingmen city, giving full play to the advantages of InSAR monitoring with vertical high accuracy and GNSS monitoring with horizontal high accuracy.
In this study, Sentinel-1 satellite data were acquired from April 201-June 2019 to monitor the deformation variables in the study area for the time interval April 2015-June 2019. The Sentinel-1 satellite band type is C-band, with a ground resolution of 20 m and an image number of 15 views.
In order to effectively reduce the effect of decoherence, the data were pre-processed, including: Radar data import, study area cropping, dataset alignment, mean intensity image generation, coordinate system conversion, and calculation of dataset coherence coefficients.
The DInSAR idea is to form an interferometric pair of two radar images before and after deformation in the same area with different time phases, and to obtain the deformation information by removing the interferometric phases generated by the terrain using a known external DEM of the same area. The main steps include: Image pair alignment, interferogram generation, simulated decoupling of terrain phases, extraction of deformation phases, geocoding, etc (Xu et al., 2022). Figure 4 shows the processing flow of DInSAR technology to extract the surface deformation area of the mine.
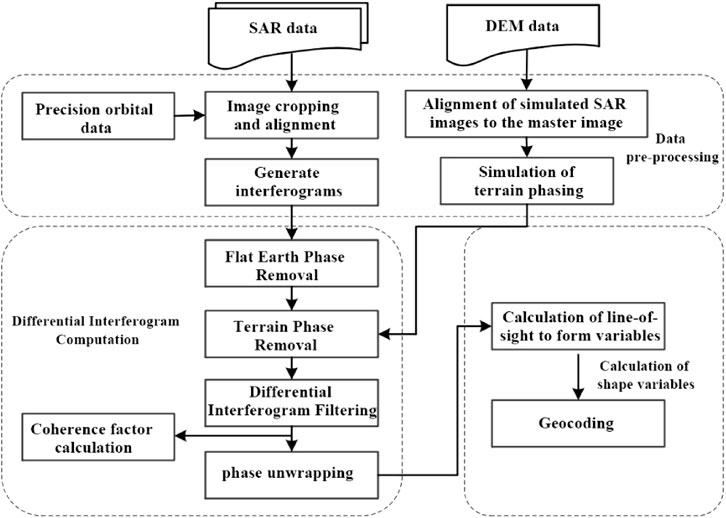
FIGURE 4. DInSAR flow chart.
The basic idea of time-series InSAR is to extract the permanent scatterer points that maintain stable scattering characteristics in time-series multi-frame images, such as artificial buildings, exposed rocks, etc., rely on discrete and sparse permanent scatterer points to construct a network, extract phase information, construct a phase function model, and adopt a reasonable modeling algorithm in order to perform accurate inversion of surface deformation (Li et al., 2021b). The specific steps include: Primary image selection, primary and secondary image alignment, baseline establishment, DEM simulation, differential interferogram generation, PS candidate point selection, sparse point phase untwisting, atmospheric delay phase estimation and removal, PS point re-selection, PS point deformation rate estimation, etc. Figure 5 below shows the processing flow of slow ground subsidence extraction by time-series InSAR technique.
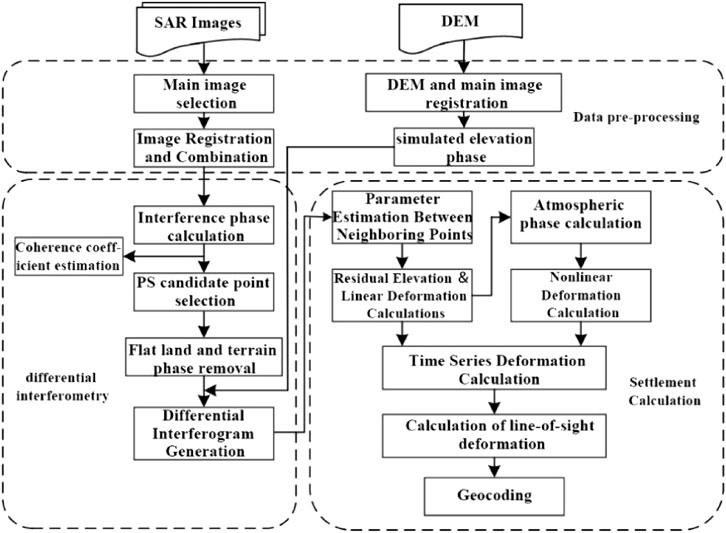
FIGURE 5. Timing InSAR flow chart.
Adopting surface macro patrol + ground crack automatic monitoring GNSS automatic monitoring + comprehensive monitoring. In February 2019, the construction of ground collapse monitoring network for a total of four gypsum mining areas in Jinghua gypsum mine, Baolong gypsum mine, Rong Xing gypsum mine and Ming Zhu gypsum mine area was completed. Among them, three monitoring points were set up in Jinghua gypsum mine, four in Rong Xing gypsum mine, 10 in Bao Long gypsum mine, one in Ming Zhu gypsum mine and one benchmark point, as shown in Figure 6.
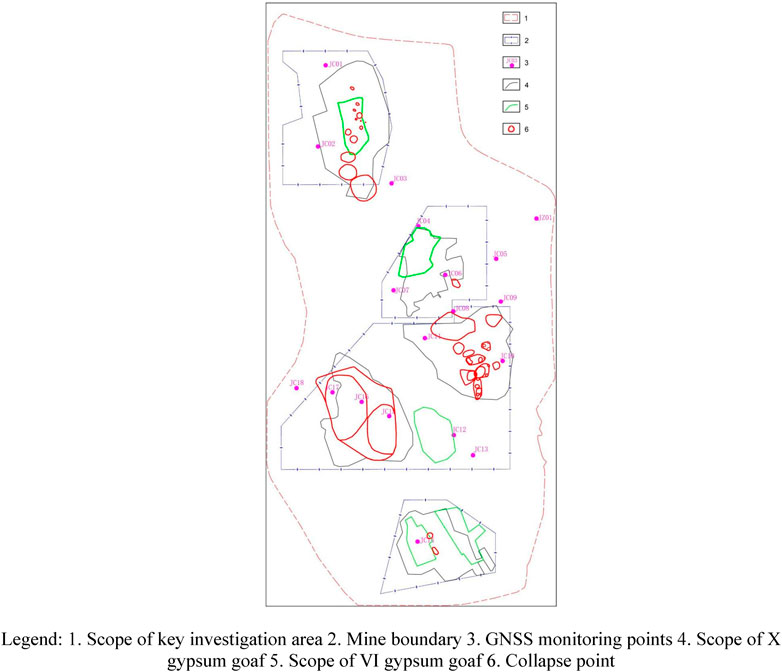
FIGURE 6. GNSS plan layout. 1. Scope of key investigation area 2. Mine boundary 3. GNSS monitoring points 4. Scope of X gypsum goaf 5. Scope of VI gypsum goaf 6. Collapse point.
The monitoring network in the district of Doujian has been in operation since 4 February 2019, with JC09 and JC18 in operation since 2 March 2019. The data for this analysis is available from 4 February 2019 until 31 October 2019.
When mining by the room and pillar method, the strength of the pillar plays a large role in the stability of the goaf (Cuello and Newcombe, 2018). The ore pillar calculation method of the gently inclined ore body is used to estimate the stability of the goaf. The relative area of the ore pillar should satisfy the following equation:
In this equation:
When the dimensions of the mine pillar and mine room are known, the pillar safety factor n can be found from the above equation.
Considering the presence of muddy siltstone in the roof of the mine, its strength is lower than that of the ore, for which the compressive strength
As a relatively weak part of the goaf, the roof plate of the goaf may collapse when the span, height and bearing condition of the empty area change, leading to mutual penetration of adjacent empty areas above and below, changing the structure of the original empty area, inducing changes in ground stress, forming local stress concentration and rock damage, and then leading to penetration and destabilization of a larger empty area. Therefore, it is important to analyze the safety thickness of the roof plate of different sizes of the goaf to evaluate the stability of the goaf.
In view of the important role of the roof of the goaf on the overall stability of the goaf, various methods are proposed to analyze the stability of the roof of the goaf in gypsum mines.
According to the practical experience of engineering and with reference to Tai’s theory, we can find the thickness of gypsum roof protection layer in the goaf h.
In this formula: B-pit width (m); H-pit height (m).
This method assumes that the load is transmitted from the center of the roof plate in a vertical line at a diffusion angle of 30–35° downward, and when the transmission line is located outside the intersection of the roof plate and the mine pillar, it is considered that the mine pillar directly supports the external load on the roof plate and the self-weight of the rock, and the roof plate is safe. The principle is shown in Figure 7.
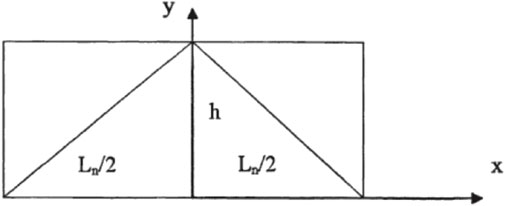
FIGURE 7. Load transfer intersection line method calculation schematic.
β is the angle between the load transfer line and the center line of the bottom plate. The safety thickness of the top plate is calculated by the formula:
In this formula: Ln—mining area span, h—top plate calculated thickness.
Pratt’s arch theory, also known as rupture arch theory, it is based on Pratt’s ground pressure theory, that after the formation of the roadway or goaf, its top plate will form a parabolic arch belt, the weight of the upper part of the empty area rock body by the arch to bear (Shang et al., 2020).
For hard rock, the top is under vertical pressure and the side gang is not under pressure, forming a natural arch; For looser and softer rock formations, the top and side gang are under pressure, forming a pressure arch; for loose strata, the sliding surface and the horizontal intersection angle after the crumbling of the sidewall in the mining area are equal to the internal friction angle of the loose rock, forming a rupture arch.
The arch height in each case is calculated by the following formula:
Natural equilibrium arch height:
Pressure arch height:
Rupture arch height:
In this formula:b-half of the width of the empty field.h-maximum height of the empty field (m).φ-the angle of internal friction of the rock.f-Rock strength factor.
For rock bodies with good integrity, the following empirical formula can be used:
In this formula:Rc-uniaxial ultimate compressive strength of the rock (MPa).
The internal stresses in the rock body before mining the gypsum layer are balanced, and in general, only vertical compressive stresses and horizontal compressive stresses exist (Jiang et al., 2021). After gypsum mining, the stability of the overlying rock layer in the goaf is judged according to the relationship between the mechanical equilibrium of gravity and the frictional resistance, as shown in Figure 8, after the hollowing of the mine layer, its overlying rock block ABCD sinks due to the action of gravity W. The wedges ABM and CDN on both sides also apply horizontal pressure P. Therefore, the two surfaces AB and CD are again resisted by the frictional resistance F due to the action of P.
In this formula:W-the total stress on the rock layer on the roof of the roadway per unit length (KN/m).P-maximum value of the principal compressive stresses acting on the AB and CD surfaces by the wedges ABM and CDN (KN/m).F-the frictional resistance of the sidewall per unit length of the roadway (KN/m).H-burial depth of the top plate of the roadway (m).B-width of the roadway (m).φ-the angle of internal friction of the rock formation (º)γ-weight of the overlying rock layer (kN/m3)
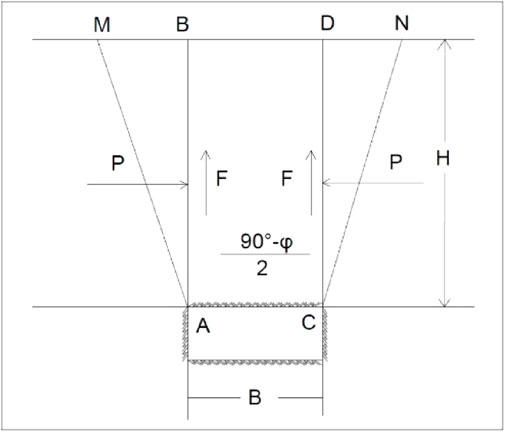
FIGURE 8. Diagram of the stability of the roof plate in the mining area.
The collapse model was determined primarily from the results of this survey and can be generalized to a 3D model drawing. The model is 1100 m long, 900 m wide, and 190 m high, in which the thickness above the ground level (the surface at elevation 0, the terrestrial level) is 90 m, and the thickness below the ground level is 100 m, totaling 190 m. The surface is Quaternary soil, the mudstone and siltstone of Gongjiachong formation below it, the goaf is gypsum-bearing mudstone, the goaf is excavated during simulation, and the 2 m roof of the goaf is gypsum-bearing mudstone. The load considered in this simulation is its own gravity and no external load is applied. The purpose of this simulation is to study the ground settlement in vertical direction, so the boundary conditions are set as follows: the side of the model restricts the horizontal movement, the bottom side restricts the vertical movement, and the top surface is free ground.
In this InSAR analysis, due to the time span of 4 years of data used, the treatment items were divided into three in order to effectively weaken the effect of decoherence.
There are 15 views of images from 7 October 2016 to 4 April 2017, and the adjacent images were processed by DInSAR to obtain a total of 14 views of results as shown in Figure 9. The area with continuous color cycle change in the result map is the deformation area (yellow ellipse circled area), and the results directly respond to the boundary of mining subsidence and the intensity of subsidence. Through the interpretation and analysis, the signs of deformation in the area of TX10 are more obvious during this time period, and the collapse occurred within 24 November 2016–18 December 2016, which coincides with the time of occurrence of TX10 (10 December 2016), while there is no obvious deformation in this area during the time period from 7 October 2016 to 24 November 2016, and there seems to be no slow pre cumulative deformation. The deformation continued from 24 November 2016 to 5 April 2017, with a trend of narrowing deformation, but due to the dense vegetation cover in spring and severe out-of-phase dryness, effective information could not be captured after April 2017.

FIGURE 9. 7 October 2016 to 5 April 2017 DInSAR decoding results graph.
There were no obvious signs of deformation in the zone during that time period, and no valid information could be captured after April 2018.
There are 16 views of images from 9 October 2018 to 7 April 2019, and the adjacent images were processed by DInSAR to obtain a total of 15 views of results as shown in Figure 10. The area with continuous color cycle change in the result map is the deformation area (yellow ellipse circled area), and the results directly respond to the boundary of mining subsidence and the intensity of subsidence. Due to the small deformation zone, the deformation information is drowned in the noise, and only some of the results can be clearly seen with color cycle changes. Through the decoding and analysis, there is one deformation zone in the time period, corresponding to the TX12-TX15, TX20-TX21 areas of the field survey results. The deformation time of TX12-TX15, TX20-TX21 areas is between October 2018 and February 2019 between October 2018 and February 2019, which coincides with the deformation time of InSAR results. Due to the dense vegetation cover in spring and severe decoherence, no valid information could be captured after April 2019.
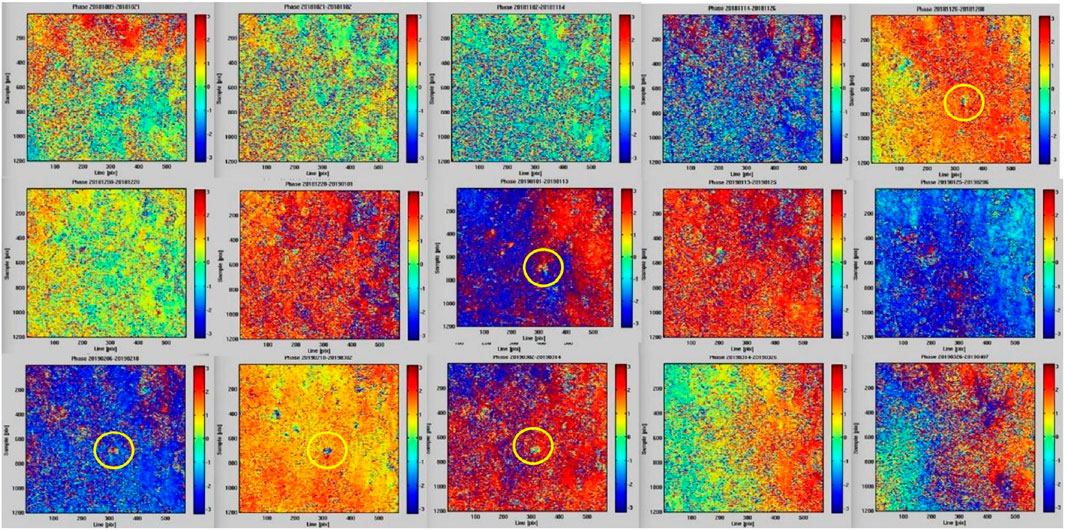
FIGURE 10. 9 October 2018 to 7 April 2019 DInSAR decoding results graph.
Time series InSAR analysis was used to calculate the surface deformation rate of the mine area between 7 October 2016 and 5 April 2017. For the slow surface deformation in the area around the mine area, surface deformation rate maps were obtained between 7 October 2016 and 5 April 2017. As shown in Figure 11, the overall regional distribution looks like a better response to the surface deformation in the monitoring area, with the deformation area located in TX10 (circled by the black oval box). Typical deformation points in the TX10 region were selected and analyzed for their time-dimensional deformation, with deformation rates up to 193 mm/year in the TX10 region.
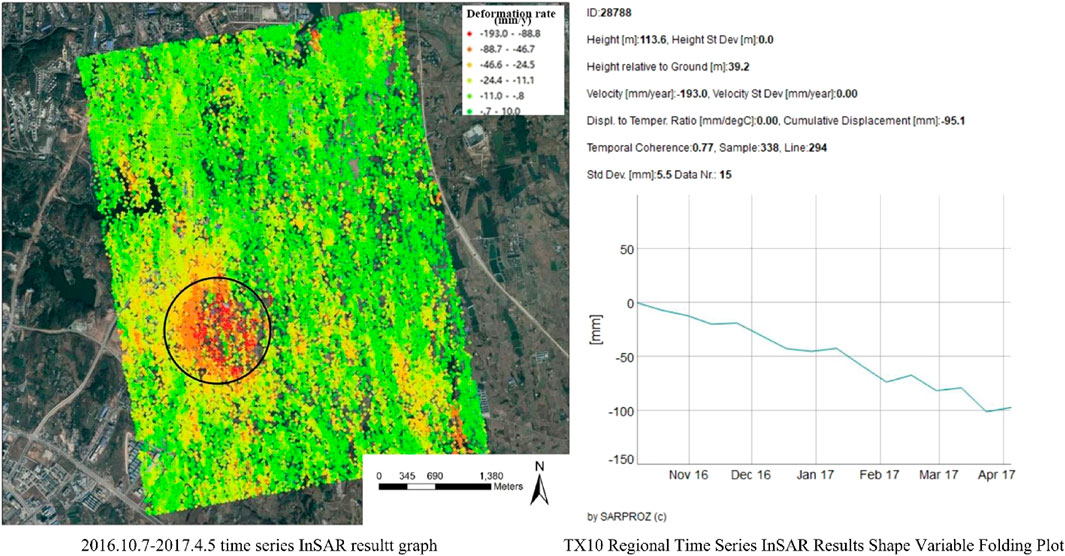
FIGURE 11. TX10 regional time series InSAR results and line graphs of shape variables.
Time series InSAR analysis was used to calculate the surface deformation rate of the mine area between 7 November 2017 and 24 April 2018. For the slow surface deformation in the area around the mine, the surface deformation rate map was obtained between 7 November 2017 and 24 April 2018. As shown in Figure 12, the overall regional distribution looks like a better response to the surface deformation in the monitoring area, with the deformation areas located in TX1-4, TX7-9 areas (circled by black oval boxes). Compared with the results from 7 October 2016 to 4 April 2017, the deformation in TX10 area becomes slower. Typical deformation points in the TX1-4, TX7-9 regions were selected and analyzed for deformation in the time dimension, with deformation rates up to 114 mm/year.
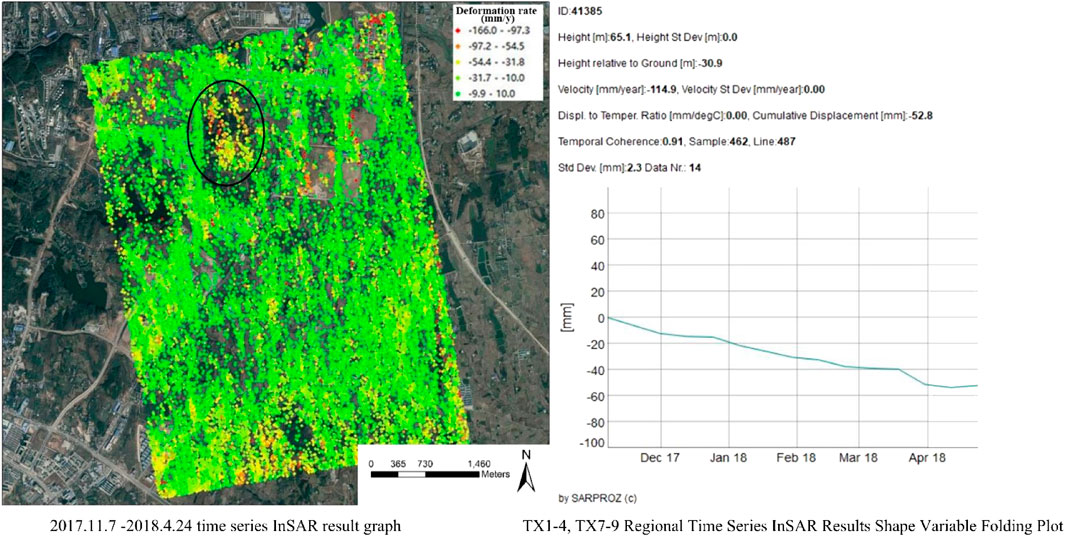
FIGURE 12. TX1-4, TX7-9 regional time series InSAR results and line graphs of shape variables.
The time series InSAR analysis method was used to calculate the surface deformation rate of the mine area between 9 October 2018 and 7 April 2019. For the slow surface deformation in the area around the mine area, the surface deformation rate map between 9 October 2018 and 7 April 2019 was obtained. As shown in Figure 13, the overall regional distribution looks like a better response to the surface deformation in the monitoring area, with the deformation areas located in TX12-15, TX20-21 areas (circled by black oval boxes). Among them, TX12-15, TX20-21 have been connected into a piece. Compared with the results from 7 November 2017–24 April 2018, the deformation of TX1-4, TX7-9 area has become slower. Typical deformation points in the TX12-15, TX20-21 regions were selected and analyzed for their time dimensional manifolds, with deformation rates up to 111 mm/year.
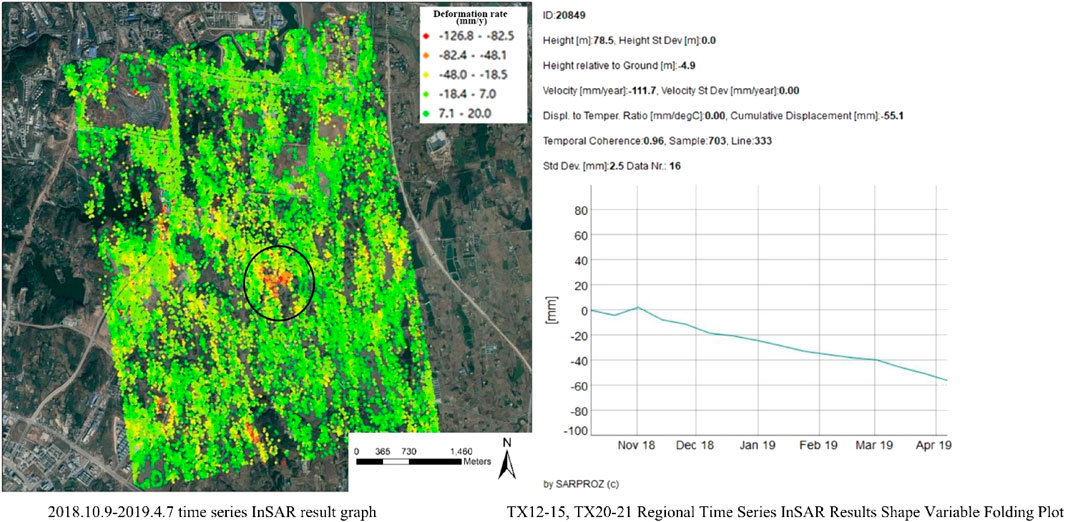
FIGURE 13. TX12-15, TX20-21 regional time series InSAR results and line graphs of shape variables.
The three time-series InSAR results obtained from the processing were further analyzed as shown in Table 5, and the deformation contours of TX10, TX1-4, TX7-9 and X12-15, TX20-21 regions were calculated to circle the influence range of deformation.
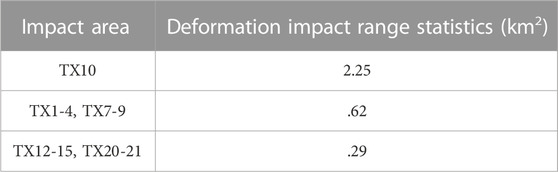
TABLE 5. Deformation zone impact area statistics.
As shown in Figure 14, the deformation areas with deformation variables greater than 20 mm/year were circled. Statistics show that the area affected by deformation in TX10 is 2.25 km2, the area affected by deformation in TX1-4 and TX7-9 is .62 km2, and the area affected by deformation in TX12-15 and TX20-21 is .29 km2.
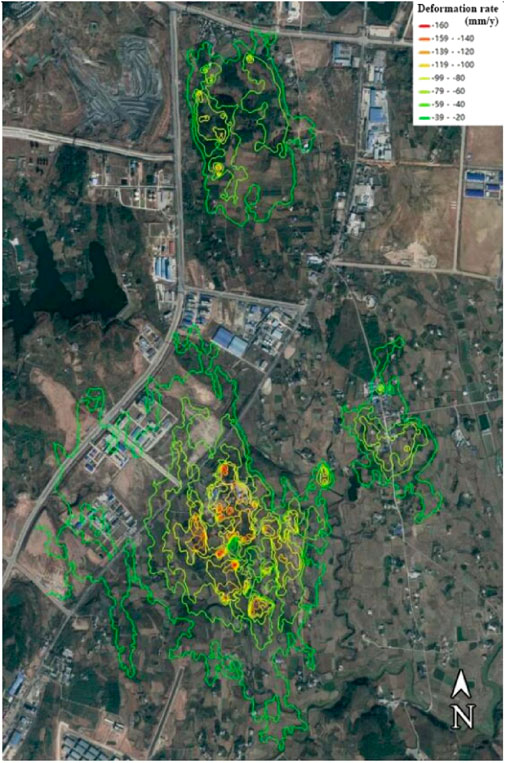
FIGURE 14. Diagram of the influence range of the deformation zone.
A total of two more obvious collapse zones were deciphered by DInSAR analysis, and three deformation zones were deciphered by time-series InSAR analysis, two of which basically overlap with the collapse zones deciphered by DInSAR, both of which are new collapse zones (western Baolong and eastern Baolong), while the other deformation zone is an old collapse zone (Jinghua gypsum mine).
The analysis of the time series InSAR results showed that the subsidence in the three deformation areas showed an overall linear variation in the time gradient over a short time period (6 months). Among them, the collapse of the Jinghua gypsum mine deformation zone occurred from July 2008 to July 2013, while its extensive deformation was monitored from November 2017 to April 2018.
The empirical settlement rate value of 20 mm/year was selected to circle the ground collapse influence range, and the influence range circled by this empirical value showed different applicability in different deformation areas, among which the range in the western part of Baolong obviously did not match the actual one, but still showed a certain trend.
The monitoring network in the district of Duodao has been in operation since 4 February 2019, with JC09 and JC18 in operation since 2 March 2019. The data for this analysis is available from 4 February 2019 until 31 October 2019.
As shown in Table 6, JC01 and JC02 located in Jinghua gypsum mine are in a relatively stable state as a whole, JC03 surface displacement has obvious changes, JC03 accumulated 16.998 mm of settlement and 18.315 mm of displacement in the Northwest direction.
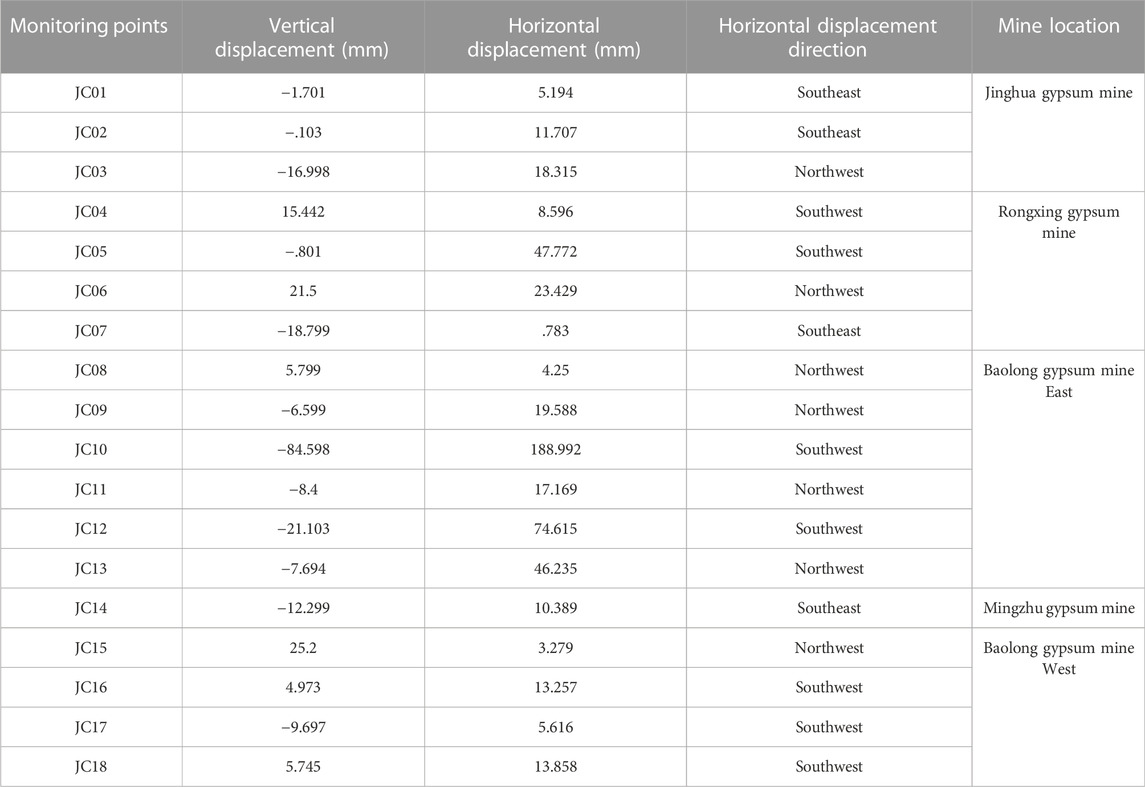
TABLE 6. GNSS surface displacement statistics of the gypsum mining area in the district of Duodao.
The surface displacement of four monitoring points located in Rongxing gypsum mine have obvious changes, among which JC04, JC05 and JC07 have obvious vertical surface displacement and JC05 and JC06 have obvious horizontal displacement.
The six monitoring points located in the east of Baolong gypsum mine, except for JC08 which is in a relatively stable state overall, all have significant changes in surface displacement, and the horizontal displacement is much larger than the vertical displacement. 84.598 mm of vertical settlement was accumulated at JC10, and 188.992 mm of displacement was accumulated towards the Southwest. During the operation of the monitoring network, ground collapse occurred in the third group of Rongxing Village on 24 July 2019 (TX24). JC10, which is about 70 m away from the collapse center in a straight line, successfully captured the change of surface displacement before and after the occurrence of the collapse; JC14, located in Mingzhu gypsum mine, was in a relatively stable state as a whole; the four monitoring points located in the west of Baolong gypsum mine were in a relatively stable state as a whole except for JC15, where the vertical displacement of the surface was obvious, and JC15 rose by 25.2 mm cumulatively.
Through the surface displacement monitoring data of the Duodao area monitoring network, the surface deformation of the goaf is analyzed.
Located in the three monitoring points of Jinghua gypsum mine, the vertical displacement of JC01 and JC0 is not obvious, mainly the horizontal displacement. The cumulative settlement of JC03 is 16.998 mm, and the levels of JC01 and JC02 both move towards the southeast. Angle, moving horizontally to the Northwest, the horizontal displacement generally points to the direction of the goaf, and the displacement has a clear correlation with the distance between the monitoring point and the overlapping area of the goaf. Therefore, it is analyzed that the ground subsidence of Jinghua gypsum mine is still deforming continuously, and a corresponding surface mobile basin is formed, and the center point of the mobile basin is in the area where the goaf of the X gypsum layer overlaps with the goaf of the VI gypsum layer.
Located at the four monitoring points of Rongxing gypsum mine, JC04 and JC06 moved upward in vertical displacement, JC05 and JC07 moved downward, and the vertical settlement of JC05 was not obvious; JC05 moved Southwestward in horizontal displacement, JC06 moved Northwestward, JC04, JC07 Horizontal displacement is not obvious. JC04 and JC06 are located at the boundary of the overlapping area between the goaf of X gypsum layer and the goaf of Ⅵ gypsum layer in Rongxing gypsum mine. After the failure of the pillars of VI gypsum layer in Rongxing gypsum mine, the roof collapsed and the upper X gypsum layer was goafed. The roof of the area is still in the stage of stress adjustment. The collapse of the roof in the goaf of the Ⅵ gypsum layer is transmitted to the surface, causing JC04 and JC06 to move upwards, but does not cause ground subsidence. JC04 and JC06 move horizontally to the overlapping area of the goaf as a whole. JC05 and JC07 are far away from the overlapping area of the mined-out area of Rongxing gypsum mine, and the horizontal displacement direction points to the center point of TX16. TX16 is a ground crack type collapse, which occurred on 23 October 2018, and the goaf was buried at a depth of 129 m. The ground fissure type collapse goaf is buried deep, and the ground deformation is not obvious at the beginning of the collapse. After the collapse, the surface deformation process is continuous and gradual deformation, and the scope of influence is huge.
For the four monitoring points located in the east of Baolong gypsum mine, JC08 moves upward in vertical displacement, and JC09, JC10, and JC11 move downward; in horizontal displacement, JC10 moves toward Southwest, and the rest move toward Northwest. On 24 July 2019, a ground subsidence (TX24) occurred at a distance of about 70 m from JC10, resulting in a huge displacement of the surface of JC10. The cumulative rainfall in June and July 2019 was 386 mm. Rainfall is the main factor for the sudden huge displacement of the surface of the goaf. The cumulative vertical settlement of JC10 is 84.598 mm, and the horizontal cumulative displacement to the Southwest direction is 188.992 mm, pointing to the center point of TX24. The vertical displacement of JC08, JC09 and JC111 is not obvious, and the horizontal displacement points to the southeast boundary of the gob of X gypsum layer in Rongxing gypsum mine. The goaf on the southeast side of the X gypsum layer is buried deeper than the gob in the east X gypsum layer of Baolong gypsum mine.
The two monitoring points located in the central part of Baolong gypsum mine, the vertical displacement of the ground surface is downward, among which JC13 vertical displacement is not obvious and JC12 accumulated 21.103 mm of settlement; JC12 horizontal displacement is 74.615 mm in the Southwest direction and JC13 horizontal displacement is 46.235 mm in the Northwest direction. The horizontal displacement points to the VI gypsum layer quarrying area in the middle of Baolong gypsum mine. The VI gypsum layer quarry area in the middle of Baolong gypsum mine is characterized by large burial depth, the failure of the mine column and the collapse of the roof plate, which did not form ground collapse when it was transmitted to the surface, but the deformation of the surface was mainly horizontal displacement, and the vertical displacement was not obvious.
The four monitoring points located in the western part of Baolong gypsum mine, the surface displacements are not obvious, among the four monitoring points, the maximum accumulated vertical displacement of JC15 is 25.2 mm, and the maximum accumulated horizontal displacement of JC18 is 13.858 mm. JC15, JC16 and JC18 move upward in vertical displacement, and JC17 moves downward; JC15 moves horizontally toward the Northwest, and the rest move toward the Southwest. JC15, JC16 and JC17 are located within TX10, and the horizontal displacement points to the center of TX10, which is a ground fracture-type collapse that occurred on 10 December 2016, and the burial depth of the mining area is 210–230 m. The surface deformation process after the formation of the ground fracture-type collapse is continuous gradual deformation, and the influence range is huge, but the collapse has been formed for a period of time, and the continuous gradual deformation However, the collapse has been formed for a period of time, and the continuous gradual deformation process is gradually weakened, which causes the displacement of monitoring points is not obvious.
One monitoring point located in Mingzhu gypsum mine, the surface displacement is not obvious, the accumulated settlement of JC14 is 12.299 mm, the accumulated displacement in the southeast direction is 10.389 mm, JC14 is located in the overlapping area between the X gypsum layer quarry area and VI gypsum layer quarry area in Mingzhu gypsum mine, the horizontal displacement points to the center point of TX19, TX19 is a ground crack type collapse, the scale of TX19 is small, and JC14 is far away from TX19. TX19 is a ground fracture type collapse, the scale of TX19 is small, and JC14 is far from TX19, which causes the surface displacement of JC14 is not obvious.
(1) Increased deformation at GNSS monitoring sites is often associated with rainfall.
(2) The closer to the goaf, the more obvious the surface deformation is, and the overall direction of horizontal displacement points to the mining area, and in the area with double-layer goaf overlap, it points to the goaf overlap area.
(3) In the area where the burial depth of the goaf is deeper, the surface deformation is mainly horizontal displacement, and the horizontal displacement direction as a whole points to the goaf, and if the ground crack type collapse has occurred in the area, the horizontal displacement direction as a whole points to the center point of the collapse.
The average safety coefficient and the minimum safety coefficient of each gypsum ore column can be calculated by the formula. The results of relevant studies show that the strength of gypsum ore will be greatly reduced after soaking in water, and the softening coefficient is about .8, and the discount factor of gypsum ore column due to rheological strength is .66, so the average safety coefficient of the column is calculated. The calculated values of each safety coefficient are shown in Table 7.
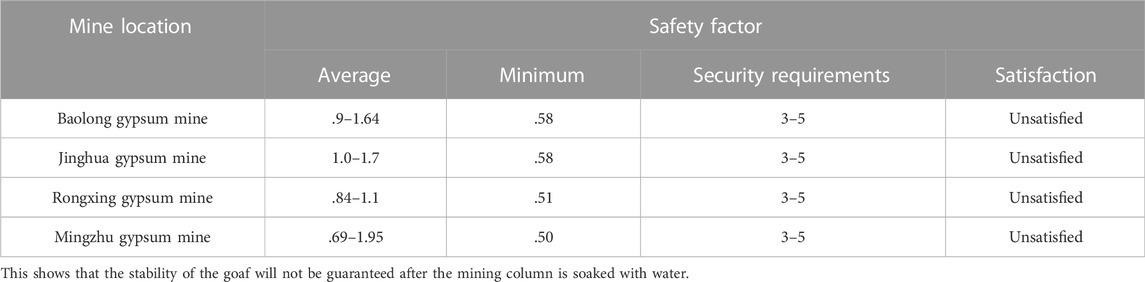
TABLE 7. Safety factor of mine column stability.
According to the engineering experience method, the load transfer interaction method and the Platts arch method, the thickness values of the roof protection layers of each gypsum mine are calculated respectively, as shown in Table 8. The results show that the thickness of the roof protection layer in the goaf of four gypsum mines is 0.5 m–3 m, which is difficult to meet the stability requirements of the goaf.
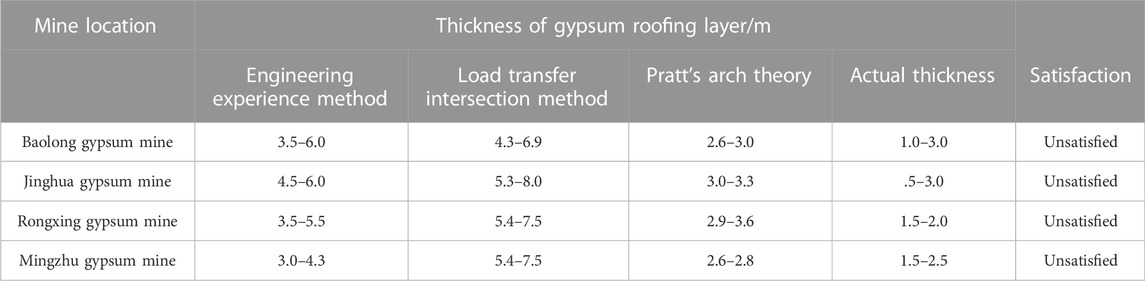
TABLE 8. Calculation table of thickness of gypsum roofing layer.
According to the force equilibrium analysis, when the burial depth of the roof of the roadway increases to a certain depth, the overlying rock layer exactly maintains the natural equilibrium state (i.e., Q = 0), at this time H is called the critical depth H0, then the critical depth calculation formula is:
The stability of the overlying rock layer can be roughly evaluated by comparing the burial depth H of the goaf with the critical depth H0. When H < H0, the overlying rock is unstable; when H0 ≤ H ≤ 1.5H0, the overlying rock is poorly stable; when H > 1.5H0, the overlying rock in the goaf was stable.
The overlying rock mass in the goaf of the gypsum mine consists of silty mudstone and silty clay from bottom to top. When calculating, φ takes the standard value of the weighted average value of the internal friction angle of the overlying rock and soil layer as the calculated value, and φ = 32°, and some areas of the above-mentioned mines did not strictly follow the mining design to reserve ore pillars, and after the mine was closed, the ore pillars were soaked in water and softened, and the muddy intensity decreased sharply, resulting in the expansion of the actual mine span. Consider the most unfavorable factors. According to the above formula, the thickness required for the stability of the overlying rock of the gypsum mine is shown in Table 9.
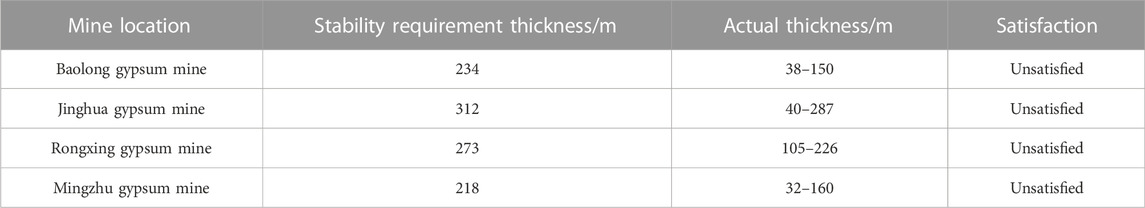
TABLE 9. Overburden thickness calculation table.
From the above specific calculation results of several parameters affecting the stability of the goaf, it can be seen that the stability of the mining area will not be guaranteed because the four gypsum mines in Duodao district of Jingmen city are mined by the room and pillar method, because the pillars are not reserved in strict accordance with the mining design, the span of the goaf is large, the mining height is high, the thickness of the cover layer of the goaf does not meet the stability requirements, and the thickness of the protective roof layer does not meet the stability requirements.
In this simulation, 12 monitoring points were arranged at 100 m intervals along the long side of the model to record the goaf surface displacement values, and 10 monitoring points were arranged at 100 m intervals along the wide side of the model to record the goaf surface displacement values.
As shown in Figure 15, the settlement map, displacement map, stress map, and plastic zone distribution of the model are obtained by numerical simulation.
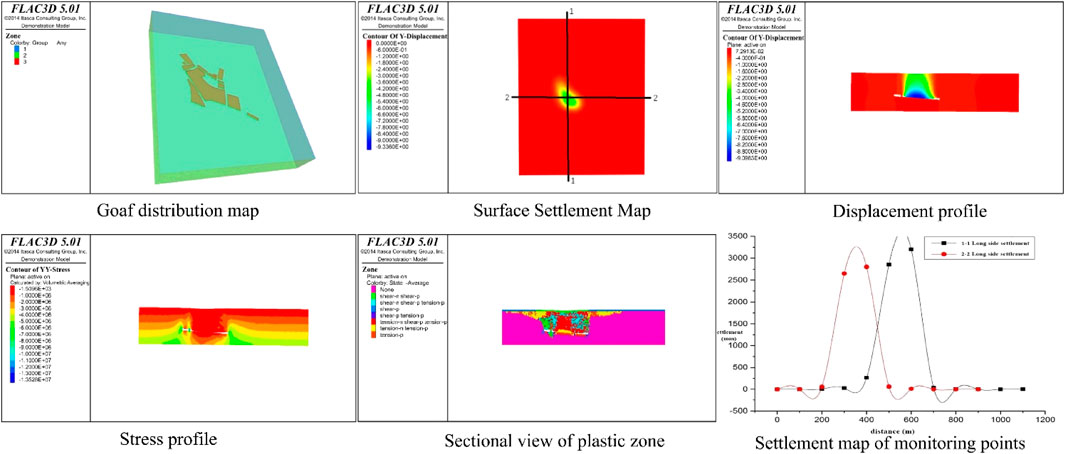
FIGURE 15. Numerical simulation images.
Through this simulation, it is found that the area of surface settlement was concentrated in the southern part of the mine area, which basically coincides with the location of the goaf, and the maximum settlement of the surface was 4.6 m, and the maximum settlement of the top plate of the goaf was 9.3 m; on the monitoring profile, the settlement value of the monitoring points arranged above the goaf in the south was larger, and the rest of the area basically does not settle; from the displacement profile, the settlement of the top plate of the goaf was the largest, and gradually extends to the surface The settlement of the surface is caused by the extension of the surface; From the stress map profile and the plastic zone profile, the stress is higher and the plastic zone is mainly concentrated near the goaf.
This paper monitors and analyzes the stability of the gypsum mine goaf, takes the ecological problems of this typical area in the Duodao district of Jingmen city as the research object, studies the planning theory and analysis methods suitable for this coal mine goaf, and draws the following conclusions:
1. A total of two more obvious collapse zones were deciphered by DInSAR analysis, and three deformation zones were deciphered by time-series InSAR analysis, two of which basically overlapped with the collapse zones deciphered by DInSAR, both of which were new collapse zones, and the other deformation zone was an old collapse zone. The time series InSAR results showed that the subsidence in the three deformation zones showed an overall linear variation in time gradient within a short period of time.
2. The increased deformation of the monitoring point is monitored by GNSS, which is often related to rainfall. The closer to the goaf, the more obvious the surface deformation is, and the horizontal displacement direction as a whole points to the goaf, and in the area with double-layer extraction area overlap, points to the goaf overlap area. In the area with deeper burial of the goaf, the surface deformation is mainly horizontal displacement, and the horizontal displacement direction as a whole points to the goaf, and if the area has experienced ground crack type collapse, the horizontal displacement direction as a whole points to the center of the collapse.
3. A numerical model of the mobile deformation of the goaf was established, and its surface settlement was analyzed by FLAC (3D) simulation calculation. It was found that the area of surface settlement was concentrated in the south of the mine area, which basically coincided with the location of the mining area, and the maximum amount of surface settlement was 4.6 m. The maximum amount of settlement of the roof of the goaf was 9.3 m. Combined with the theoretical analysis method of the stability of the roof of the goaf, the roof of the goaf and the overlying rock layer were in an unstable state.
In practice, the safety risk assessment of the goaf should not be neglected. InSAR remote sensing survey, the deformation monitoring of the goaf has only been partially attempted, and its measurement results are limited and not organically combined with ground GNSS monitoring. Therefore, how to conduct a comprehensive monitoring of the goaf as well as will be the focus of the next exploration and research. In addition, due to time constraints, the number of working conditions for numerical simulation in the evaluation of the stability of the goaf is limited, and only the deformation characteristics of the goaf under fixed burial depth conditions at different span height ratios are generally identified, and the influence of the burial depth and span height on the deformation of the goaf in different combinations is not analyzed comprehensively and deeply.
The original contributions presented in the study are included in the article/supplementary material, further inquiries can be directed to the corresponding author.
Conceptualization, methodology, data curation, and writing- original draft, ZX. Methodology, data curation, and funding acquisition, WX. Conceptualization, methodology, data curation, writing- original draft, and supervision, ZZ. Methodology and writing—review and editing, JZ. All authors have read and agreed to the published version of the manuscript.
This research was funded by 2021 Hubei Provincial Construction Science and Technology Plan Project (Item No. 63).
The authors declare that the research was conducted in the absence of any commercial or financial relationships that could be construed as a potential conflict of interest.
All claims expressed in this article are solely those of the authors and do not necessarily represent those of their affiliated organizations, or those of the publisher, the editors and the reviewers. Any product that may be evaluated in this article, or claim that may be made by its manufacturer, is not guaranteed or endorsed by the publisher.
Atanasova, M., and Nikolov, H. (2020). "Integrative use of GNSS and InSAR data: A case study of landslide on the thracian rocks coastal slope," in Proc. SPIE 11534, Earth resources and environmental RS/GIS applications XI, 115340S. doi:10.1117/12.2573641
Biggs, J., and Wright, T. J. J. (2020). How satellite InSAR has grown from opportunistic science to routine monitoring over the last decade. Nat. Commun. 11, 3863–3864. doi:10.1038/s41467-020-17587-6
Calò, F., Ardizzone, F., Castaldo, R., Lollino, P., Tizzani, P., Guzzetti, F., et al. (2014). Enhanced landslide investigations through advanced DInSAR techniques: The Ivancich case study, Assisi, Italy. Remote Sens. Environ. 142, 69–82. doi:10.1016/j.rse.2013.11.003
Casu, F., Elefante, S., Imperatore, P., Zinno, I., Manunta, M., De Luca, C., et al. (2014). SBAS-DInSAR parallel processing for deformation time-series computation. IEEE J. Sel. Top. Appl. Earth Obs. Remote Sens. 7, 3285–3296. doi:10.1109/jstars.2014.2322671
Cuello, D., and Newcombe, G. (2018). “Key geotechnical knowledge and practical mine planning guidelines in deep, high-stress, hard rock conditions for block and panel cave mining, Caving,” in Caving 2018: Proceedings of the Fourth international symposium on block and sublevel caving. Editors Y. Potvin, and J. Jakubec (Perth: Australian Centre for Geomechanics), 17–36. doi:10.36487/ACG_rep/1815_0.2_Cuello
Del Soldato, M., Confuorto, P., Bianchini, S., Sbarra, P., and Casagli, N. J. (2021). Review of works combining GNSS and InSAR in Europe. Remote Sens. (Basel). 13, 1684. doi:10.3390/rs13091684
Jiang, L.-c., Jiao, H.-z., Wang, Y.-d., and Wang, G.-g. (2021). Comprehensive safety factor of roof in goaf underdeep high stress. J. Cent. South Univ. 28, 595–603. doi:10.1007/s11771-021-4624-y
Jiang, L., Zhang, P., Chen, L., Hao, Z., Sainoki, A., Mitri, H. S., et al. (2017). Numerical approach for goaf-side entry layout and yield pillar design in fractured ground conditions. Rock Mech. Rock Eng. 50, 3049–3071. doi:10.1007/s00603-017-1277-0
Li, S., Xu, W., and Li, Z. (2021). Review of the SBAS InSAR Time-series algorithms, applications, and challenges. Geodesy Geodyn. 13, 114–126. doi:10.1016/j.geog.2021.09.007
Li, T., Zhang, H., Fan, H., Zheng, C., and Liu, J. J. (2021). Position inversion of goafs in deep coal seams based on DS-InSAR data and the probability integral methods. Remote Sens. (Basel). 13, 2898. doi:10.3390/rs13152898
Lian, X., Li, Z., Yuan, H., Hu, H., Cai, Y., and Liu, X. J. (2020). Determination of the stability of high-steep slopes by global navigation satellite system (GNSS) real-time monitoring in long wall mining. Appl. Sci. (Basel). 10, 1952. doi:10.3390/app10061952
Liu, P., Li, Z., Hoey, T., Kincal, C., Zhang, J., Zeng, Q., et al. (2013). Using advanced InSAR time series techniques to monitor landslide movements in Badong of the Three Gorges region, China. China 21, 253–264. doi:10.1016/j.jag.2011.10.010
Osmanoğlu, B., Sunar, F., Wdowinski, S., and Cabral-Cano, E. J. (2016). Time series analysis of InSAR data: Methods and trends. Methods trends 115, 90–102. doi:10.1016/j.isprsjprs.2015.10.003
Shang, B., Jin, X., Ao, G., Chen, Q., and Qiu, Q. J. E. (2020). Calculation of surrounding rock pressure of undercut subway station based on multi-factor affecting pressure arch theory. Arch. Theory 12, 59–70. doi:10.4236/eng.2020.122006
Shang, Y., Guo, Y., and Zhang, W. (2018). Numerical simulation on the deformation and failure of the goaf surrounding rock in Heiwang mine. IOP Conf. Ser. Earth Environ. Sci. 121 (5), 052034. doi:10.1088/1755-1315/121/5/052034
Wang, C., Lu, Y., Cui, B., Hao, G., and Zhang, X. J. G. (2018). Stability evaluation of old goaf treated with grouting under building load. Geotech. Geol. Eng. (Dordr). 36, 2553–2564. doi:10.1007/s10706-018-0482-2
Wang, F., Zou, P., Meng, Z., Li, A., Liu, Z., Hu, W., et al. (2019). Study on stability of goaf pillars in daqiao phosphate mine: Theoretical calculation and field investigation. Geotech. Geol. Eng. (Dordr). 37, 1483–1492. doi:10.1007/s10706-018-0701-x
Wang, G., Wu, Q., Li, P., Cui, X., Gong, Y., Zhang, J., et al. (2021). Mining subsidence prediction parameter inversion by combining GNSS and DInSAR deformation measurements. IEEE Access 9, 89043–89054. doi:10.1109/access.2021.3089820
Wang, G., Xu, Y., and Ren, H. J. (2019). Intelligent and ecological coal mining as well as clean utilization technology in China: Review and prospects. Int. J. Min. Sci. Technol. 29, 161–169. doi:10.1016/j.ijmst.2018.06.005
Xu, X., Cui, X., Liu, X., Tang, Q., Zhang, X., Sun, Y. J. G., et al. (2020). Damage analysis of soaking gypsum and safety evaluation of goaf: Based on energy dissipation theory. Geotech. Geol. Eng. (Dordr). 38, 6177–6188. doi:10.1007/s10706-020-01426-y
Xu, Z., Jiang, L., Niu, F., Guo, R., Huang, R., Zhou, Z., et al. (2022). Monitoring regional-scale surface deformation of the continuous permafrost in the qinghai–tibet plateau with time-series InSAR analysis. Remote Sens. (Basel). 14, 2987. doi:10.3390/rs14132987
Yao, J., Yao, X., and Liu, X. J. (2022). Landslide detection and mapping based on SBAS-InSAR and PS-InSAR: A case study in gongjue county, tibet, China. Remote sencing 14, 4728. doi:10.3390/rs14194728
Yu, H., Lan, Y., Yuan, Z., Xu, J., and Lee, H. J. (2019). Phase unwrapping in InSAR : A review. Phase unwrapping InSAR A Rev. 7, 40–58. doi:10.1109/mgrs.2018.2873644
Zhang, C., Zhao, Y., He, X., Guo, J., and Yan, Y. J. (2021). Space-sky-surface integrated monitoring system for overburden migration regularity in shallow-buried high-intensity mining. Bull. Eng. Geol. Environ. 80, 1403–1417. doi:10.1007/s10064-020-02026-z
Zhang, J., and Wang, B. J. (2021). Study on the bearing structure and stability of overlying strata: An interval gob in shallow buried coal mining of Northwest China. Arabian J. Geoscience 14, 255–314. doi:10.1007/s12517-021-06479-8
Zhang, L., Dai, K., Deng, J., Ge, D., Liang, R., Li, W., et al. (2021). Identifying potential landslides by stacking-InSAR in Southwestern China and its performance comparison with SBAS-InSAR. Remote sencing 13, 3662. doi:10.3390/rs13183662
Zhang, L., and Lu, Z. J. (2022). Advances in InSAR imaging and data processing. Adv. InSAR Imaging Data Process. 14, 4307. doi:10.3390/rs14174307
Zhao, C., Kang, Y., Zhang, Q., Lu, Z., and Li, B. J. (2018). Landslide identification and monitoring along the Jinsha River catchment (Wudongde reservoir area), China, using the InSAR method. Remote Sens. (Basel). 10, 993. doi:10.3390/rs10070993
Zhao, F., Meng, X., Zhang, Y., Chen, G., Su, X., and Yue, D. J. (2019). Landslide susceptibility mapping of karakorum highway combined with the application of SBAS-InSAR technology. Sensors (Basel). 19, 2685. doi:10.3390/s19122685
Zhou, N., Du, E., Li, M., Zhang, J., and Dong, C. J. (2021). Determination of the stability of residual pillars in a room-and-pillar mining goaf under eccentric load. Energy Rep. 7, 9122–9132. doi:10.1016/j.egyr.2021.11.140
Zhou, W., Zhang, W., Yang, X., and Wu, W. J. (2021). An improved GNSS and InSAR fusion method for monitoring the 3D deformation of a mining area. IEEE Access 9, 155839–155850. doi:10.1109/access.2021.3129521
Zhu, D., Tu, S., Tu, H., and Yang, Z. J. (2019). Mechanisms of support failure and prevention measures under double-layer room mining gobs – a case study: Shigetai coal mine. Shigetai coal mine 29, 955–962. doi:10.1016/j.ijmst.2018.06.006
Keywords: gypsum mine goaf, InSAR, GNSS, stability evaluation, numerical simulation
Citation: Xu Z, Xu W, Zhu Z and Zhao J (2023) Research on monitoring and stability evaluation of ground subsidence in gypsum mine goaf. Front. Environ. Sci. 10:1097874. doi: 10.3389/fenvs.2022.1097874
Received: 14 November 2022; Accepted: 12 December 2022;
Published: 04 January 2023.
Edited by:
Erhan Sener, Süleyman Demirel University, TürkiyeReviewed by:
Mehmet Özçelik, Süleyman Demirel University, TürkiyeCopyright © 2023 Xu, Xu, Zhu and Zhao. This is an open-access article distributed under the terms of the Creative Commons Attribution License (CC BY). The use, distribution or reproduction in other forums is permitted, provided the original author(s) and the copyright owner(s) are credited and that the original publication in this journal is cited, in accordance with accepted academic practice. No use, distribution or reproduction is permitted which does not comply with these terms.
*Correspondence: Wei Xu, MTYwODI4MDdAd2l0LmV0dS5jbg==
Disclaimer: All claims expressed in this article are solely those of the authors and do not necessarily represent those of their affiliated organizations, or those of the publisher, the editors and the reviewers. Any product that may be evaluated in this article or claim that may be made by its manufacturer is not guaranteed or endorsed by the publisher.
Research integrity at Frontiers
Learn more about the work of our research integrity team to safeguard the quality of each article we publish.