 Yuxuan Bian
 Yaqiong Hu
 Mingxin Li
 Jianying Li1

94% of researchers rate our articles as excellent or good
Learn more about the work of our research integrity team to safeguard the quality of each article we publish.
Find out more
ORIGINAL RESEARCH article
Front. Environ. Sci., 04 January 2023
Sec. Atmosphere and Climate
Volume 10 - 2022 | https://doi.org/10.3389/fenvs.2022.1097766
Hail hazards have caused severe losses and threatened the safety of residents in Beijing, the Chinese capital city. A refined analysis of the spatial and temporal distribution of hailstorms in Beijing can help to evaluate the risk of hail and guide the operations of hail prevention. The distribution of weather stations is relatively sparse to figure out the fine distribution of hail events. Therefore, a quality-controlled dataset of disaster information data reported from information reporters is used to analyze the fine temporal and spatial distributions of hail days and events in Beijing from 1980 to 2021 in this study. Hail events and hail days show an obvious downward trend with years from 1981 to 2010, while hail events show a strong upward trend from 2011 to 2021. The seasonal pattern of hail events shows a unimodal distribution from March to October, and the peak appears in June. Most of the hail events occurred from 14:00 to 21:00, while the highest counts appeared from 15:00 to 17:00. More and larger hails occurred in the northwestern mountains rather than southeastern plains in Beijing, highly correlated with the topography. Both total and severe hails hit the mountain area statistically earlier than the plain area. The most frequent hours of hails in the northwestern area and southeastern area were concentrated in the range of 13:00—17:00 and 16:00—20:00 CST, respectively. This time delay is due to the initiation location and movement direction of the convective storms. The influence of ENSO on warm season hails is positive in Beijing, which has a lag of 3 months or longer. The arctic oscillation has a negative correlation with hail days in each month from May to September.
Convective storms can produce several main meteorological hazards, such as wind, lightning, and hail (Wallace and Hobbs, 2006). Hail can cause significant damage to crops, vehicles, and buildings, resulting in large economic losses (Punge et al., 2014). The economic losses of hails could exceed USD 1 billion and kept increasing in recent decades (Púčik et al., 2019). Under the condition of climate change, the climatology of hail frequency, properties, and intensity show significant importance and can be applied in a lot of areas. Meteorologists need more information on hail climatology to improve the forecast accuracy of hail forecasts and early warning; economists and insurance companies evaluate the risk of insurance about hails by investigating the historical hail data; the influence of hail hazard on the novel architectural designs and energy systems (solar energy, etc.) should be considered in developing construction plans (Punge and Kunz, 2016).
Because of the significant importance of hail climatology research, in situ measurement at weather stations, radio sounding, and several kinds of remote sensing data, such as radar and satellite, have been used to analyze the temporal and spatial distributions of hails across different continentals and countries of the world (Allen et al., 2020). Given geographic differences and offsetting interactions in the environmental changes, there is spatial heterogeneity in hailstorm responses to climate change (Raupach et al., 2021). Cecil and Blankenship. (2011) estimated a global climatology of severe hailstorms by using Advanced Microwave Scanning Radiometer for Earth Observing System (AMSR-E) on satellite. Frisby and Sansom. (1967) analyzed and summarized hail frequencies and hail falling areas in the tropics (including Latin America, Africa, Arabia, India, Southeast Asia, and Australia). Cintineo et al. (2012) quantified the spatial and temporal characteristics of contiguous United States hail fall, which were derived from radar and multi sensor measurements for several years. Their results reveal the hotspots of hail falling areas across the United States. Punge and Kunz. (2016) summarized the various prevailing studies to identify regions that are most prone to hail in Europe. Lots of studies about hail climatology in European countries (Germany (Suwała and Bednorz, 2013), France (Vinet, 2001), Italy (Baldi et al., 2014), Turkey (Kahraman et al., 2015), Romania (Burcea et al., 2016), etc. (Berthet et al., 2011)) were reviewed in their research. Laviola et al. (2022) explored the hail frequency in the Mediterranean basin during the last 2 decades (1999-2021) on the basis of hail occurrences derived from the observations of the microwave radiometers on board satellites of the Global Precipitation Measurement Constellation (GPM-C).There are several studies about the climatology of hail day (Li et al., 2016), hail frequency and size (Li et al., 2018), large hail (Ni et al., 2020), and the potentially influential factors of hailstorms (Zhao et al., 2018) in China in recent decades. Historical hail records at Chinese national weather stations collected and provided by National Meteorological Information Center were the main datasets used in these studies. The results from these studies show that hotspots were concentrated in the Tibetan Plateau and the northeastern region of the North China Plain (Zou et al., 2018). Hail days, frequencies, and max hail diameters in China have a decreasing pattern in recent decades according to these studies (Li et al., 2018). Weather radar, as an important remote sensing technique, has also been used to investigate and predict the climatology and characteristics of hailstorms. With S-band radar data, Wang et al. (2018) investigated the characteristics of hail storms and cumulonimbus storms in China from 2005 to 2016.
Besides these professional observation datasets, social databases had also been used to demonstrate the characteristics of hail distributions, such as news reports, disaster addresses from insurance companies, records of the agriculture and housing industry, and statistical yearbooks. Tuovinen et al. (2009) investigated the severe hails (hail records with a diameter larger than or equal to 2 cm) in Finland by collecting newspaper, storm spotter, and eyewitness reports in 70 years. Because of the small spatial scale and short duration time of severe weather events like hails, weather stations can hardly cover most of the locations where hail events occurred. Recently, researchers have attempted to involve the general public in gathering weather observations. Some countries and organizations have begun to analyze severe weather like hails and build related datasets with information reports from trained meteorological information reporters. By cooperating with national weather services, voluntary observer networks, and persons, the European Severe Storms Laboratory (ESSL) established the European Severe Weather Database (ESWD) which is a database of severe weather events reported from crowdsources in 2002 (Dotzek et al., 2009). A European Weather Observer (EWOB) app is operated by ESSL to help people to report severe weather events near their positions. The Tornado and Storm Research Organization (TORRO) holds a website to let voluntary persons upload severe weather reports such as tornados, lightning and damaging hailstorm on the island of Britain (Webb et al., 2009). The Community Collaborative Rain, Hail and Snow Network (CoCoRaHS) is another large community of volunteers measuring and reporting precipitation in North America and is making this information broadly available (Reges et al., 2016). As of mid-2015, CoCoRaHS volunteers have submitted tens of thousands of reports of hail, heavy rain, and snow. The applications of meteorological information from crowdsources helped to improve the monitoring and recording of severe weather and analyze the spatial and temporal distributions of hailstorm weather. Meanwhile, these reports are essential for validating and improving indirect hail retrieval algorithms based on remote sensing measurements, such as radar and satellite observations.
With the gradual deepening of the hail climatology research, the research area is becoming more specific into smaller countries and cities rather than continentals and larger countries. At the urban scale, the distribution of general weather stations seems to be too sparse to evaluate the spatial distribution of hail events. Warren et al. (2020) presented a radar-based climatology of hailstorms for the major cities of Brisbane and Sydney in Australia from 2009 to 2017. A multi-year building-scale insurance dataset was used in their study to verify the hail-detection algorithm. With radar measurements, a hail spatial distribution with highly fine resolution can be retrieved. At the same time, radar-based hail detection suffers from some limitations which make the radar detection of hail less reliable, such as the assumptions in the retrieval algorithm (Stržinar and Skok, 2018). To increase the amounts of weather stations in a certain area is a useful way to measure the fine distribution of hails. Jelić et al. (2020) determined the hail climatology in the northeastern Adriatic region in Croatia. Their results were based on approximately 60 years of high spatial resolution measurements collected from 27 stations across complex terrain and showed high levels of spatial variability. Another way to improve the spatial resolution is to use the records from crowdsources. The crowdsourced hail reports gathered with the MeteoSwiss app were used to analyze the presence and approximate size of hail in Switzerland (Barras et al., 2019). This dataset has the advantage of unprecedented spatial and temporal coverage.
As the Chinese capital, Beijing is densely populated with a population of 24 million. Hail is one of the main meteorological hazards in Beijing. By damaging buildings, agricultural crops and vehicles, hailstorm poses serious threats to social productions like agriculture and the safety of people’s lives and properties. In July 2016, a case of hailstorm caused economic losses of 317 million Chinese yuan to farmland and fruit forests in Beijing’s rural area (Beijing Times, 2016). A refined analysis of the spatial and temporal distribution of hailstorms in Beijing can help to evaluate the risk of hail and guide the operations of hail prevention. Min et al. (2012) analyzed the characteristics and trends of hail variations based on 175 meteorological stations in Beijing-Tianjin-Hebei region from 1979 to 2008 and found that hail frequency in this region show a decreasing pattern in the past 30 years. However, because of the small spatial scale and short duration time of hails, the distribution of weather stations is relatively sparse to capture hail events. Presently, there are only 20 national weather stations that have hail records in Beijing (larger than 16,000 km2). Compared with stations deployed in the Adriatic study introduced above (27 stations in approximately 3,000 km2 area), the site density of weather stations in Beijing is not enough for analyzing the fine spatial distribution of hails. Therefore, high spatial resolution datasets of hail information are very important for the analysis of hail properties in Beijing. Besides the general ground-based observations, quality controlled reports uploaded by meteorological information reports can supply monitoring of strong convective weather with higher spatial and temporal distributions. A network of meteorological information reporters like ESWD has been developed by Beijing Meteorological Bureau in recent decades. Compared with observations from weather stations, the hail hazard information reported by meteorological information reporters had a much higher spatial resolution in the recent 40 years (Hu et al., 2019). Presently, this kind of information has barely used to investigate weather hazards like hailstorms in China.
In this study, a quality controlled dataset of disaster information data from crowdsources is used to analyze the fine temporal and spatial distributions of hail days and events in Beijing from 1980 to 2021. The characteristics and patterns of this climatology are investigated. The influences of several climatic conditions on hailstorms in Beijing are evaluated.
A Network of meteorological information reporters was built in the 1980s by China Meteorological Administration. The main tasks of this network include: the broadcasting of meteorological hazard warning information, the observation and collection of meteorological hazard events and special weather statements, the popularization of meteorological science, and to assist the public in hazard prevention. These reporters are mainly composed of the following types of people: county/town/village officers in rural area, district/community officers in urban area, weather modification operators, teachers, and volunteers who love weather science (China Meteorological Administration, 2013).
Disaster information data of Beijing used in this study was reported by meteorological information reporters in this network in Beijing, collected by meteorological stations, and recorded by Beijing Weather Modification Office. Several kinds of meteorological hazards (hail, typhoon, severe precipitation, thunderstorm, dust storm, etc.) were reported into this dataset by the reporters when they saw the occurrence of these hazards. The coverage of meteorological information reporters in communities and villages has been maintained at 100% in recent years. Therefore, this data was considered to be relatively consistent. However, the population of meteorological information reporters was not perfectly stable (9,017 persons by the end of 2015). In 2009, the development of this network was added into the policy of Chinese government. From 2010 to 2011, the network of meteorological information reporters expanded rapidly.
The hail records in the disaster information dataset mainly include the time of occurrence, maximum hail diameter (MHD), and locations of hail events. During the quality control of the data, the records without detailed time of occurrence were deleted along with the records whose locations cannot be verified. The occurrence location was recorded as textual descriptions initially. The coordinate information of the locations has then been verified by using google maps during the data processing. The time range of the dataset after quality control is from 1980 to 2021. The earliest hail event was occurred on March 9th (2020), and the latest event occurred on October 13th (2011). There are 1,499 records located at 484 coordinates in this dataset (locations shown in Figure 1). The time used in this study is China Standard Time (CST; UTC+8).
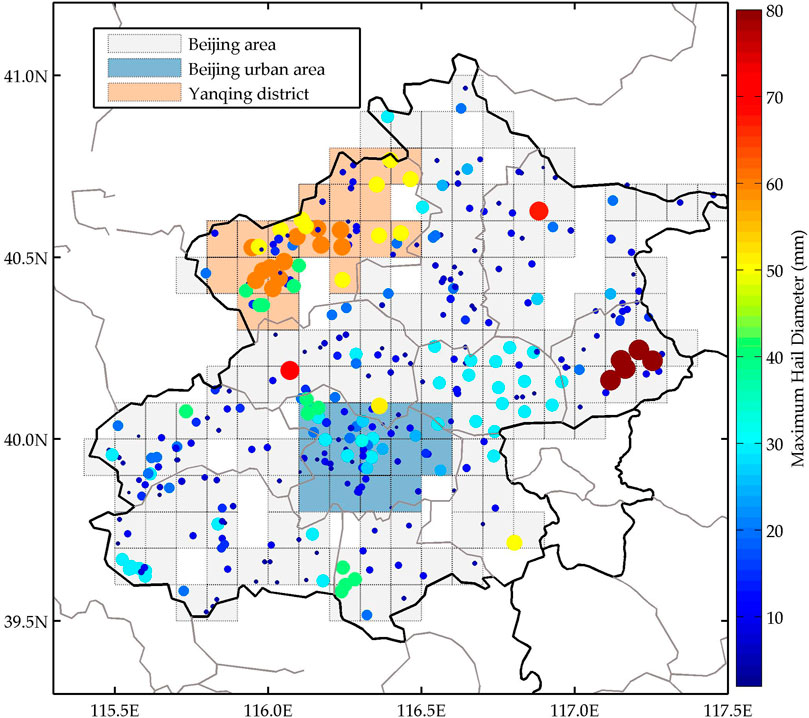
FIGURE 1. Hail reports from disaster information data and the related grid. Colored dots show every location with hail reports. The color and size of the dots show the MHDs of hail reports on each location. Shadowed squares show grids with hail events.
Due to some of the MHD records being just qualitative descriptions (Ping-pang ball, corn, etc.), they need to be converted into estimated diameter by a set of scale correspondence. Li et al. (2018) built a set of relationships between hail size descriptions and diameters by referring to the information provided by the National Meteorological Information Center (NMIC) of China. In this study, to increase the comparability across datasets, the NMIC hail size information was also used as the basis of a table of estimated hail diameter with hail size descriptions from disaster information (Table 1).
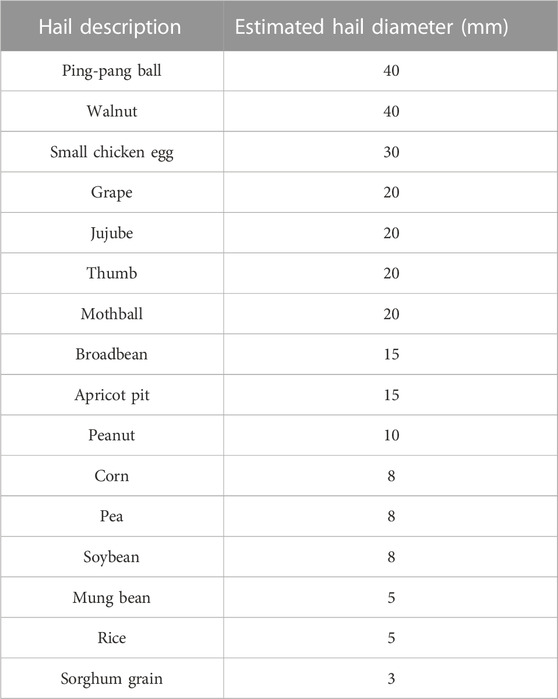
TABLE 1. Estimated hail diameter, as interpreted from disaster information.
Dots in Figure 1 show the coordinates where at least one hail record reported. The size and color of the dots show the MHD of hail record on each location. During the whole time period, hails were reported in every district in Beijing. Hail cases were most frequently reported in the urban area (blue shadows in Figure 1) and Yanqing district located on the northwest side of Beijing (orange shadows in Figure 1), while MHDs of hails that occurred in the Yanqing district were obviously larger.
To analyze the hail climatology with the disaster information data, hail day and hail event was obtained firstly in this study. A day with at least one hail record was considered to be a hail day, and a time bin with at least one hail record was considered to be a hail event. One day was separated into 48 bins which means that the bin of time was set to half an hour. The MHD of a hail event was considered as the maximum of the MHDs of the multiple records in this hail event. Hail day was calculated with a local time of 0–24 h.
To better analyze the spatial information of hails and increase the comparability of data from different regions of Beijing, a gridded method was used in this study to process the data of hail events. Firstly, considering that the coverage of villages and towns with disaster information records had been maintained at approximately 100%, Beijing was split into several grids with a spatial resolution of 0.1° × 0.1° in both latitude and longitude (Figure 1). Then all of the data points in one grid were combined and considered as the hail events of this grid. Multiple hail records happened in one time bin and one grid were considered as one event in the analysis of spatial hail distribution. The shadow blocks shown in Figure 1 are grids with the occurrence of hail event in this dataset.
Firstly, the interannual variations of hail events and days were analyzed. From Figures 2A,B, it is obvious that the disaster information data before and after 2010 has a significant difference. As introduced in section 2.1, the number of meteorological information reporters has a sharp shift from 2010 to 2011. Therefore, the interannual variations before and after 2010 should be discussed separately. By applying linear fitting to the hail events and hail days in these two time periods separately, it can be found that there is an obvious downward trend of both hail events and hail days in the years from 1981 to 2010. The average annual changes of hail events and days are -0.43 freq yr−1 and -0.39 days yr−1, respectively. Correlation coefficients R of these parameters with years are both -0.68 which indicates strong negative correlations. These trends are similar to the trends in previous studies about hail days in Beijing and northern China (Xie et al., 2008; Min et al., 2012). This trend is strongly related to the weakening Asia summer monsoon that is associated with the weakening of dynamic forcing and the decreasing of moisture supply in the warm season (Zhang et al., 2017). A strongly upward trend of hail events from 2011 to 2021 with a correlation coefficient of 0.88 can be found in Figure 2A. Simultaneously, the upward trend of hail days in the same time period is hardly observed (Figure 2B). The significant difference between trends of hail days and hail events from 2011 to 2021 is probably due to the duration and strength of hail events. In the analyzing method used in this study, if a hail event could last more than half an hour, it would be counted two times whether it moved to other grids or not. In the last decade, To validate these interannual variations and trends observed with disaster information data, measurements from 20 national weather stations in Beijing have been analyzed and compared. This data was obtained from NMIC. If a hailstorm is recorded at one of these stations on a particular day, this day is defined as a hail day for Beijing. The interannual variation of the hail days derived from weather station data is shown in Figure 2C. The patterns of hail days from two different datasets are similar to each other in both time periods, respectively. By following the process deployed to disaster information data, the trends of hail days in the two time periods were investigated. Similar trends with the analysis of disaster information data and the related R can be found. The detailed trends and related R are shown in Table 2. The possible reason of the downward trend of hails from 1980 to 2010 which is similar with previous studies have been discussed above. While the upward trend of hail events from 2011 to 2021 is probably due to the decrease in the operation of weather modification in Beijing in the recent years. According to the urban expansion, the region where the operation of artificial hail elimination has shrunk over time. Moreover, as a megacity area, there were intensively increasing flights around Beijing. These flights also occupied the area of hail elimination operations.
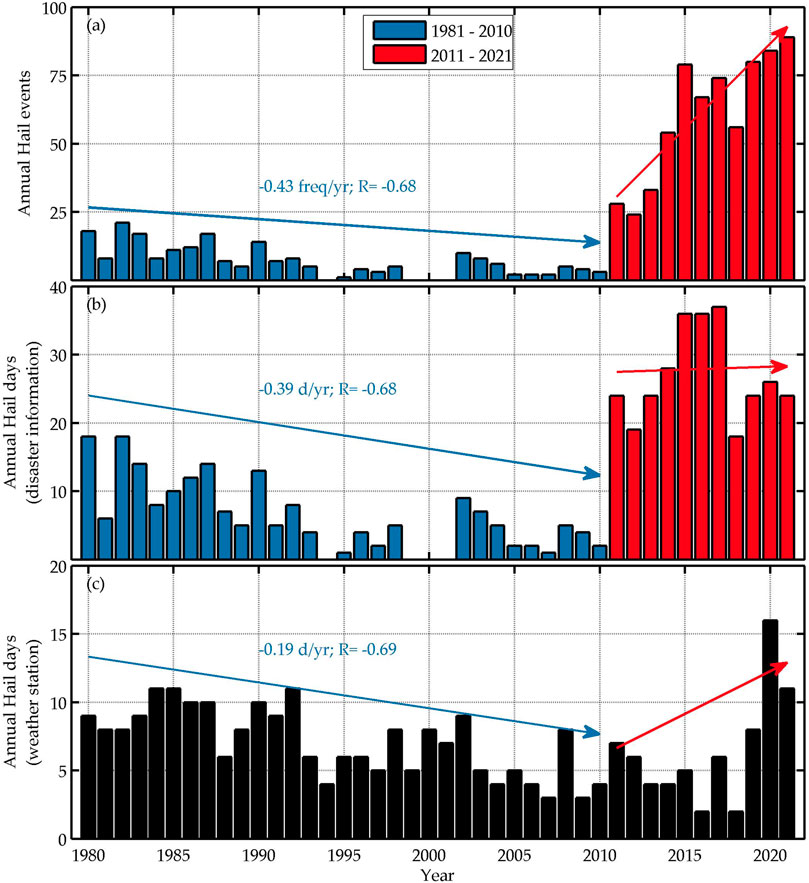
FIGURE 2. Annual variations of hail events and days in Beijing from 1980 to 2021: (A). Annual hail events collected from disaster information dataset; (B). Annual hail days collected from disaster information dataset; (C). Annual hail days collected from national weather station measurements. Blue/red bars show disaster information data in the time period of 1981–2010/2011-2021; black bars show weather station data; blue/red arrows show trends of the annual variations in the time period of 1981–2010/2011-2021, respectively.
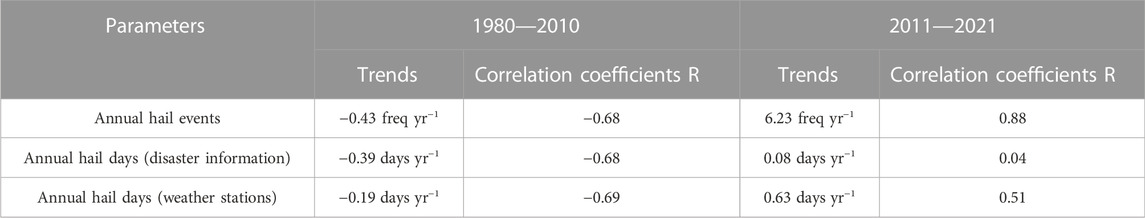
TABLE 2. Trends of hail parameters from different sources and the related correlation coefficients in the time periods of 1980–2010 and 2011-2021, respectively.
Hail can occur in several months of a year and hours of a day with a seasonal and diurnal cycle. Figure 3C shows the average hail events as a function of month and hour in Beijing from 1980 to 2021. Figures 3A,B show the seasonal and diurnal cycle of hail events in Beijing, respectively. In this time period, all of the hail events occurred from March to October. There were no hail records from November to February. The pattern of hail events with months shows a unimodal distribution, and the peak of this modal appears in June. These results keep consistent with the distributions of hail frequencies in the northern plain area and northern mountain area in China (Li et al., 2018). Just in between these two areas, Beijing is located at the edge of the North China Plain (Bian et al., 2020). The detailed pattern of hail events in Beijing is more like the pattern of hail frequency in the northern mountain area, with the second highest record appearing in July rather than May. The possible reason is that the mountain area contributes more to hail events than the plain area in Beijing.
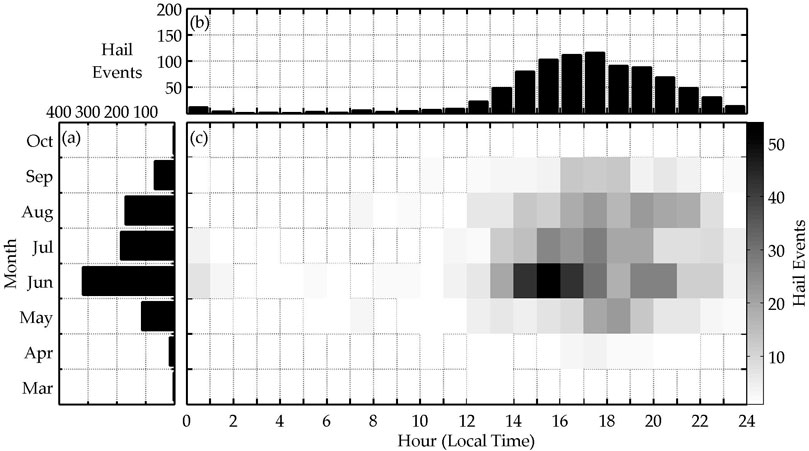
FIGURE 3. Seasonal and diurnal cycles of hail events in Beijing from 1980 to 2021: (A). Averaged seasonal cycle of hail events; (B). Averaged diurnal cycle of hail events; (C). Mean hail events against months and hours.
Generally, hail events occur more frequently in the daytime rather than at nighttime with a considerable diurnal cycle. Figure 3B shows that the highest counts of hail events appeared at 15:00—17:00 in the afternoon. It is similar to the pattern in previous studies (Zhang et al., 2017). Because the development and enhancement of the convective system which breeds hailstorms rely on the thermodynamic process, the diurnal pattern of hail events follows the variation of solar radiation and surface temperature. Although the diurnal cycle of hail events seems to be a unimodal distribution, the detailed diurnal cycles of hail events in each month, especially in June, seem to be bimodal (Figure 3A).
Besides the characteristics of total hail events, the temporal variations of hails with different sizes were investigated in this research. Severe hail is defined as hailstones having an MHD of 2 cm or more (Rädler et al., 2018). This threshold was also used in this study to separate severe hail from small hail. Figures 4A–C show the seasonal and diurnal cycles of hail events having an MHD of more than 2 cm, while Figures 4D–F show the patterns of hail events with smaller hail. Figures 4A,D represent that both large and small hails have similar seasonal patterns with total hail events. The peaks of both seasonal cycles appear in June, while the peak value of severe hail events is even higher than two times of the second highest value appeared in August.
Most severe and smaller hail events occurred from 14:00 to 21:00. The diurnal patterns shown in Figures 4B,E present bimodal distributions. The two peaks of these bimodal patterns of severe hail events appear at 14:00 and 17:00. While the peaks of smaller hail events appear 2 h later than that. The possible reason for this issue is that severe hails occurred more in mountainous areas than in urban areas, while generally, the urban area reaches its maximum surface temperature later than other areas (Zakšek and Oštir, 2012). To evaluate the influence of underlying surfaces on hails, the spatial distributions of hail events were analyzed.
Following the methodology introduced in Section 2.2, the disaster information data was converted into a gridded dataset. By analyzing this dataset, the spatial distributions of hail events and MHDs are shown in Figure 5. The contour of 100 m elevation is indicated as the red line in the figure. Because Beijing is at the edge between North China Plain and the mountains (Mount Taihang and Mount Yanshan), the topography of Beijing is complex. The northern and western parts of Beijing are considered as mountainous surfaces, while the southern and eastern parts are considered as plain surfaces. The boundary between these surfaces is set to a sea-level elevation of 100 m in this study. Almost all of the urban area is classified as plain surface. Figures 5A,B show the frequencies and sizes of hail events in Beijing, respectively. Every district had been hit by hailstorms from 1980-2022 (Figure 5A). Hailstorms hit the Yanqing district on the northwestern side most frequently, with 50–60 times of hail events in one grid. The second most frequent area is the western part of the urban area which can be considered as foothill terrain, with 40–50 times of hails events in one grid.
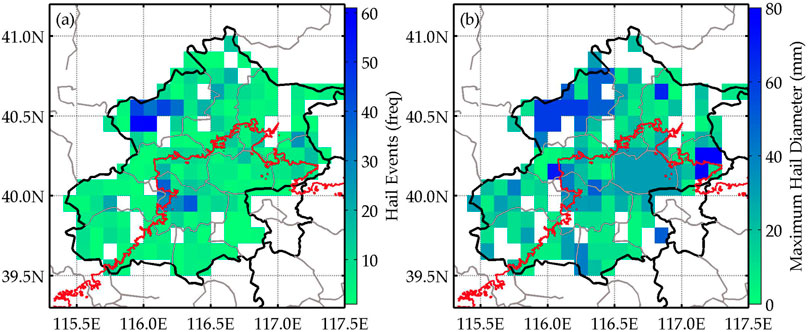
FIGURE 5. Spatial distributions of hail characteristics in Beijing from 1980 to 2021: (A). Gridded hail events data; (B). Maximum hail diameter of each grid. The red line shows the contour of 100 m elevation.
Compared with plain areas, the hails hit in northwestern mountains were also relatively larger, with MHDs of 60–80 mm (Figure 5B). Generally, more and larger hails occurred in northwestern mountain terrain, rather than southeastern plains. This spatial feature is similar to the spatial distributions of short-duration rainfall events in the warm season of central north China investigated in previous studies, which are highly correlated with the topography (Yuan et al., 2014). Furthermore, the western part of the urban area was another hotspot of hails besides mountain areas, probably correlated with the steeper nature of the terrain (Chen et al., 2012).
Spatial distributions of the hour when hail is most frequent in Beijing from 1980 to 2021 are plotted in Figure 6. Results of both total hail events (Figure 6A) and hail events with MHDs greater than or equal to 2 cm (Figure 6B) show that hails hit in Mount Taihang (northwestern area) are statistically earlier than in the plain area. The most frequent hours of hails in the northwestern area and southeastern area are mostly concentrated in the range of 13:00—17:00 and 16:00—20:00 CST, respectively. The main reason for this time delay is that convective storms frequently initiated over the northwestern mountains in the afternoon as a result of solar heating and then moved southeastward to the plains in Beijing along representative upper level flow paths (Chen et al., 2014). Besides, the most frequent hours of hails in several southern and eastern grids were during nighttime, related to the second peak of storm frequency appeared around 2:00—3:00 CST over warm seasons in the southeastern plains in North China Plain (Chen et al., 2012).
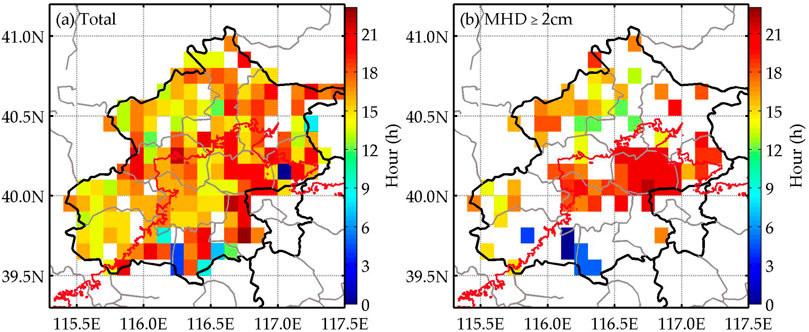
FIGURE 6. Spatial distributions of the hour when hail is most frequent in Beijing from 1980 to 2021: (A). Total hail events; (B). Hail events with an MHD equal to or larger than 2 cm.
Figures 7A,B represent the spatial distributions of the month when total hail events and severe hail events are most frequent in Beijing from 1980 to 2021, respectively. The most frequent month of hails is June at most grids, followed by July and August. Results of May and September can only be indicated at rare grids. The spatial distributions of the most frequent month were relatively uniform. Compared with plain areas (elevation lower than 100 m), the most frequent month of August appeared more in mountainous areas. These results are similar to results studied by previous research about the warm season severe convective events over North China (Ma et al., 2021).
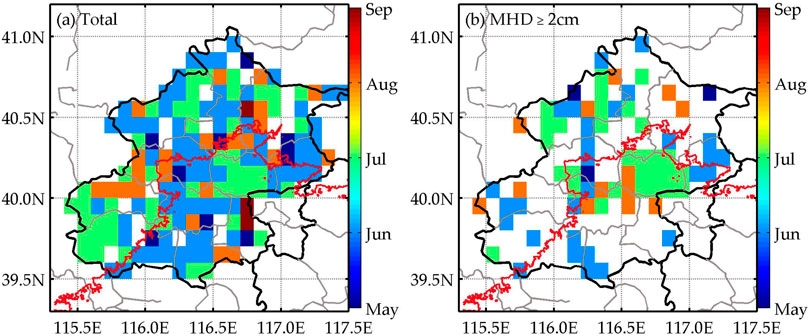
FIGURE 7. Spatial distributions of the month when hail is most frequent in Beijing from 1980 to 2021: (A). Total hail events; (B). Hail events with an MHD equal to or larger than 2 cm.
Several previous studies have examined the relationships between severe thunderstorm activities like hails and tornados and climatic conditions. These teleconnections include El Niño–Southern Oscillation (ENSO; Allen and Karoly, 2014; Jeong et al., 2021), the Arctic Oscillation (AO; Brown and Nowotarski, 2020), etc. These teleconnections could influence hail and tornado occurrences by affecting large-scale atmospheric conditions, leading to changes in variability (Allen et al., 2020). For instance, fewer tornadoes and hail events occur over the central United States during El Niño and conversely more occur during La Niña conditions (Allen et al., 2015). To better investigate the relationship between climate conditions and hails in Beijing, two typical oscillations: ENSO and AO were picked to be analyzed. Because of the expansion of meteorological information reporters in 2010, disaster information data has an obvious shift between 2010 and 2011. Therefore, only data from 2011 to 2021 was used in the correlation study in Section 3.3.
To explore the possible relationship between the hail interannual variation and ENSO, the Climate Prediction Center Oceanic Niño Index (ONI; Climate Prediction Center, 2022b) values were used to describe the ENSO state. ONI is defined as the running 3-month mean anomaly of mid-Pacific sea surface temperatures (SSTs) corresponding to the Niño 3.4 region (5°S–5°N, 170°–120°W), relative to the prior 30-year mean to remove warming signals. Because hails always occurred during the warm season in Beijing, the seasonal values of ONI were derived for three seasons: December, January, February (DJF), March, April, May (MAM) and June, July, August (JJA). To better compare the responses of ONI from different seasons to hail, only hail days in the warm seasons (June, July, August, September) were used in the correlation studies in this section.
Figure 8 shows the correlations between ONI and annual hail days. The correlation coefficients R between hail days in warm seasons and ONI (DJF), ONI (MAM), and ONI (JJA) are 0.53, 0.67, and 0.35, respectively. The hail days are better correlated with the winter and spring ONI values with a statistical significance (Figures 8A,B) rather than the summer ONI value (Figure 8C). The hail days are approximately 20%, 48%, and 4% larger for the positive ONI years compared to the negative ONI years. These results show that the influence of ENSO on hails in Beijing is positive, while it has a lag of 3 months or longer. This lagged effect is also reported in previous studies about the influence of ENSO on summer rainfalls in northern and eastern China (Hu et al., 2005; Xue and Liu, 2008; Lin, 2019). This lagged effect is a special phenomenon in East Asia, while the probable causes are quite complicated, which may include the long-lead control of the intraseasonal oscillation in the East Asian-western North Pacific region by ENSO, the enhancement of the connection between South Asian summer monsoon and East Asian summer rainfall variations, and the influence of the external circulation.
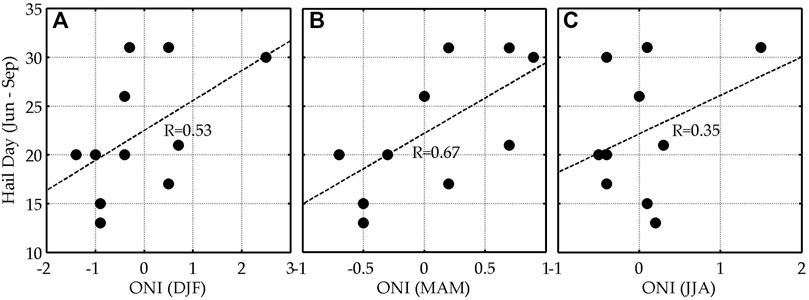
FIGURE 8. The scatterplots of ONI and annual hail days in warm seasons during 2011–2021: (A) ONI of DJF; (B) ONI of MAM; (C) ONI of JJA. Dash lines in the plots show the linear fitting line. Texts in the plots show the correlation coefficient between ONI and hail days.
The AO, as an annual mode of atmospheric circulation (Thompson and Wallace, 1998), predominates the extratropical Northern Hemisphere circulation, influencing mid-to high-latitude climate in Northern Hemisphere significantly (Thompson et al., 2000). Childs et al. (2018) reported that numbers of tornadoes in the southeastern United States have a statistically stronger relation with the AO rather than with ENSO. Brown and Nowotarski. (2020) found that the Climate Prediction Center daily AO index was relevant to tornado outbreaks in the southeastern United States across all seasons. The monthly averages of the Climate Prediction Center daily AO index (Climate Prediction Center, 2022a) were used to describe the AO state. The daily AO index is constructed by projecting the daily 1,000 hPa height anomalies poleward of 20°N onto the loading pattern of the AO. To evaluate the influences of AO on hails in different months, the hail days were averaged by month.
Figure 9 shows the correlations between monthly averaged AO indexes and hail days. The correlation coefficients R between hail days and the AO index in May, June, July, August, and September are -0.35, -0.55, -0.57, -0.02, and -0.77, respectively. All of the R show negative correlations. The slopes of linear fitting lines in Figure 9 are approximately -0.43, -1.70, -1.90, -0.11, and -1.97, respectively. These results show that hail days decreased with the AO index across these months. This negative correlation is similar to the relation between the AO and the East Asian summer rainfalls (Gong and Ho, 2003). Besides, the strongest and weakest correlation appears in September and August, respectively.
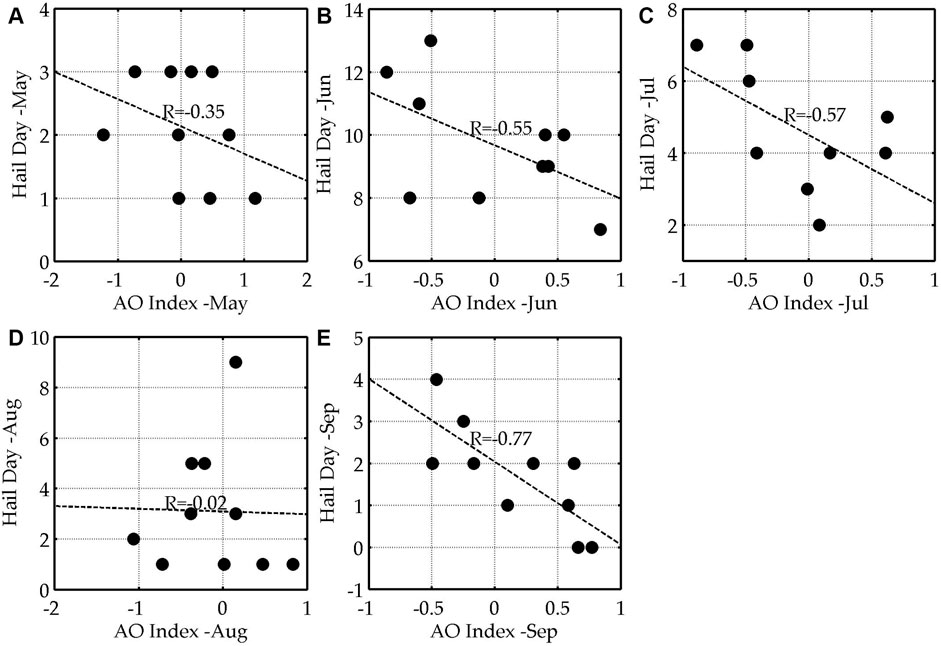
FIGURE 9. The scatterplots of monthly mean AO Index and monthly hail days in each month from 2011 to 2021: (A) in May; (B) in June; (C) in July; (D) in August; (E) in September. Dash lines in the plots show the linear fitting line. Texts in the plots show the correlation coefficient between AO Index and hail days in each month.
This study presents the climatology of hail spatial and temporal distributions in Beijing, China from 1980 to 2021 and its attributions. To better analyze the hail distributions under city scale, a quality controlled dataset of disaster information data with the high spatial resolution was used. This dataset collected data reported by trained meteorological information reporters all over Beijing and recorded by Beijing Weather Modification Office. A gridded method was used with this dataset to process the data of hail events and MHD into gridded data with a spatial resolution of 0.1° × 0.1° in both latitude and longitude. Through the analysis, we draw the following conclusions:
1) Similar to the trends in previous hail studies in northern China, there is an obvious downward trend of both hail events and hail days in the years from 1981 to 2010 (Xie et al., 2008; Min et al., 2012). A strongly upward trend of hail events from 2011 to 2021 with a correlation coefficient of 0.88 can be found, while hail days don’t have a significant trend in the same time period. This novelly found trend is probably due to the decrease in the operation of weather modification in the recent years.
2) All of the hail events occurred from March to October. There were no hail records from November to February. The pattern of hail events with months shows a unimodal distribution, and the peak of this modal appears in June. These results keep consistent with the distributions of hail frequencies in the northern plain area and northern mountain area in China reported in the previous study (Li et al., 2018). Generally, most of the hail events occurred from 14:00 to 21:00 with a considerable diurnal cycle. The highest counts of hail events appeared at 15:00—17:00 in the afternoon, following the variation of solar radiation and surface temperature. This feature is similar with the diurnal pattern of the annual-mean distribution of the number of thunderstorm events analyzed in Zhang et al. (2017).
3) Spatial distribution of hail events in Beijing is novelly reported in this research. Every district of Beijing had been hit by hailstorms from 1980-2022. More and larger hails occurred in northwestern mountain terrain with MHD of 60–80 mm and times of 50–60 in one grid, rather than southeastern plains, highly correlated with the topography. This spatial feature is similar to the spatial distribution of short-duration rainfall events in the warm season of central north China investigated in Yuan et al. (2014). The western part of the urban area near the foothills was another hotspot of hails with times of 40–50 in one grid, probably correlated with the steeper nature of terrain.
4) Results of both total and severe hail events show that hails hit in the northwestern mountain are statistically earlier than in the plain area. The most frequent hours of hails in the northwestern area and southeastern area are mostly concentrated in the range of 13:00—17:00 and 16:00 - 20:00 CST, respectively. This time delay is due to the initiation location and movement direction of the convective storms. The spatial distributions of the month with the most frequent hail events were relatively uniform across the grids. Compared with plain areas, the most frequent month of August appeared more in mountainous areas.
5) The correlation coefficients between hail days in warm seasons and ONI (DJF), ONI (MAM), and ONI (JJA) are 0.53, 0.67, and 0.35, and the hail days are approximately 20%, 48%, and 4% larger for the positive ONI years compare to the negative ONI years, respectively. These results show that the influence of ENSO on hails in Beijing is positive, while it has a lag of 3 months or longer. This lagged effect is a special phenomenon in East Asia with complicated causes. The correlation coefficients between hail days and the AO index in May, June, July, August, and September are -0.35, -0.55, -0.57, -0.02, and -0.77, respectively, indicating that hail days decreased with the AO index across these months.
These results can help predict hail distributions and guide the operation of hail prevention. The disaster information data supply a chance to investigate the fine spatial and temporal distributions of hails. However, compared with standard observations in the weather station. Climatic analysis with the disaster information data still faces some issues. The network of weather information reporters expanded with time, especially in 2010 for this case, which decreased the comparability of the dataset. The diurnal cycle of reports has to be influenced by the rest time of reporters, especially for small hail events. Further studies are still required to improve our understanding of hailstorm variations in Beijing. Besides ENSO and AO, there are some other climate conditions, such as the Madden–Julian Oscillation (MJO), which have influences on hail climatology. This dataset of disaster information data also has possible usefulness in verifying and improving the retrieval algorithm of hails with remote sensing measurements like radar and satellite.
The raw data supporting the conclusions of this article will be made available by the authors, without undue reservation.
Conceptualization, YB and YH; methodology, YB; resources, YH; writing—original draft preparation, YB; writing—review and editing, YH, ML, JL, MH, and XM; visualization, YB. All authors have read and agreed to the published version of the manuscript.
This research was funded by the National Natural Science Foundation of China (NSFC), grant number 41975043 and 42005008; and the special program of innovation and development, China Meteorological Administration, grand number CXFZ 2021J038.
The authors thank all of the meteorological reporters, as well as the numerous observers working at meteorological stations in Beijing, and all people whose sharing of eyewitness information made this climatology possible. We thank the reviewers for their constructive comments to improve the manuscript.
The authors declare that the research was conducted in the absence of any commercial or financial relationships that could be construed as a potential conflict of interest.
All claims expressed in this article are solely those of the authors and do not necessarily represent those of their affiliated organizations, or those of the publisher, the editors and the reviewers. Any product that may be evaluated in this article, or claim that may be made by its manufacturer, is not guaranteed or endorsed by the publisher.
Allen, J. T., Giammanco, I. M., Kumjian, M. R., Jurgen Punge, H., Zhang, Q., Groenemeijer, P., et al. (2020). Understanding hail in the Earth system. Rev. Geophys. 58 (1), e2019RG000665. doi:10.1029/2019rg000665
Allen, J. T., and Karoly, D. J. (2014). A climatology of Australian severe thunderstorm environments 1979–2011: Inter-annual variability and ENSO influence. Int. J. Climatol. 34 (1), 81–97. doi:10.1002/joc.3667
Allen, J. T., Tippett, M. K., and Sobel, A. H. (2015). Influence of the El niño/southern oscillation on tornado and hail frequency in the United States. Nat. Geosci. 8 (4), 278–283. doi:10.1038/ngeo2385
Baldi, M., Ciardini, V., Dalu, J. D., De Filippis, T., Maracchi, G., and Dalu, G. (2014). Hail occurrence in Italy: Towards a national database and climatology. Atmos. Res. 138, 268–277. doi:10.1016/j.atmosres.2013.11.012
Barras, H., Hering, A., Martynov, A., Noti, P.-A., Germann, U., and Martius, O. (2019). Experiences with >50, 000 crowdsourced hail reports in Switzerland. Bull. Am. Meteorological Soc. 100 (8), 1429–1440. doi:10.1175/bams-d-18-0090.1
Beijing Times (2016). Beijing's Daxing & Fangshan was hit by hail; fruits were smashed, causing hundreds of millions of losses. Available: http://pic.people.com.cn/n1/2016/0701/c1016-28515104.html.
Berthet, C., Dessens, J., and Sanchez, J. L. (2011). Regional and yearly variations of hail frequency and intensity in France. Atmos. Res. 100 (4), 391–400. doi:10.1016/j.atmosres.2010.10.008
Bian, Y., Xu, W., Hu, Y., Tao, J., Kuang, Y., and Zhao, C. (2020). Method to retrieve aerosol extinction profiles and aerosol scattering phase functions with a modified CCD laser atmospheric detection system. Opt. Express 28 (5), 6631–6647. doi:10.1364/oe.386214
Brown, M. C., and Nowotarski, C. J. (2020). Southeastern U.S. Tornado outbreak likelihood using daily climate indices. J. Clim. 33 (8), 3229–3252. doi:10.1175/jcli-d-19-0684.1
Burcea, S., Cică, R., and Bojariu, R. (2016). Hail climatology and trends in Romania: 1961–2014. Mon. Weather Rev. 144 (11), 4289–4299. doi:10.1175/mwr-d-16-0126.1
Cecil, D. J., and Blankenship, C. B. (2011). Toward a global climatology of severe hailstorms as estimated by satellite passive microwave imagers. J. Clim. 25 (2), 687–703. doi:10.1175/jcli-d-11-00130.1
Chen, M., Wang, Y., Gao, F., and Xiao, X. (2014). Diurnal evolution and distribution of warm-season convective storms in different prevailing wind regimes over contiguous North China. J. Geophys. Res. Atmos. 119 (6), 2742–2763. doi:10.1002/2013JD021145
Chen, M., Wang, Y., Gao, F., and Xiao, X. (2012). Diurnal variations in convective storm activity over contiguous North China during the warm season based on radar mosaic climatology. J. Geophys. Res. Atmos. 117 (D20), 8158. doi:10.1029/2012JD018158
Childs, S. J., Schumacher, R. S., and Allen, J. T. (2018). Cold-season tornadoes: Climatological and meteorological insights. Weather Forecast. 33 (3), 671–691. doi:10.1175/waf-d-17-0120.1
China Meteorological Administration (2013). Consolidate and develop the network of meteorological information reporter, prevent and mitigate disasters and serve the well-being of the people. Available: https://www.cma.gov.cn/2011zwxx/2011zyjgl/2011zyjgldt/201312/t20131201_232934.html.
Cintineo, J. L., Smith, T. M., Lakshmanan, V., Brooks, H. E., and Ortega, K. L. (2012). An objective high-resolution hail climatology of the contiguous United States. Weather Forecast. 27 (5), 1235–1248. doi:10.1175/waf-d-11-00151.1
Climate Prediction Center (2022a). Daily arctic oscillation index. Available: https://www.cpc.ncep.noaa.gov/products/precip/CWlink/daily_ao_index/ao_index.html.
Climate Prediction Center (2022b). Historical El nino/La nina episodes (1950-present). Available: https://origin.cpc.ncep.noaa.gov/products/analysis_monitoring/ensostuff/ONI_v5.php.
Dotzek, N., Groenemeijer, P., Feuerstein, B., and Holzer, A. M. (2009). Overview of ESSL's severe convective storms research using the European Severe Weather Database ESWD. Atmos. Res. 93 (1-3), 575–586. doi:10.1016/j.atmosres.2008.10.020
Frisby, E. M., and Sansom, H. W. (1967). Hail incidence in the tropics. J. Appl. Meteorology Climatol. 6 (2), 339–354. doi:10.1175/1520-0450(1967)006<0339:hiitt>2.0.co;2
Gong, D.-Y., and Ho, C.-H. (2003). Arctic oscillation signals in the East Asian summer monsoon. J. Geophys. Res. Atmos. 108 (D2), 4066. doi:10.1029/2002JD002193
Hu, Y., Bian, Y., Huang, M., and Ma, X. (2019). Characteristics of hailstone distribution based on disaster information in beijing from 1981 to 2017. J. Appl. Meteorological Sci. 30 (6), 710–721. doi:10.11898/1001-7313.20190607
Hu, Z.-Z., Wu, R., Kinter, J. L., and Yang, S. (2005). Connection of summer rainfall variations in South and East Asia: Role of El niño–southern oscillation. Int. J. Climatol. 25 (9), 1279–1289. doi:10.1002/joc.1159
Jelić, D., Megyeri, O. A., Malečić, B., Belušić Vozila, A., Strelec Mahović, N., and Telišman Prtenjak, M. (2020). Hail climatology along the northeastern adriatic. J. Geophys. Res. Atmos. 125 (23), e2020JD032749. doi:10.1029/2020JD032749
Jeong, J. H., Fan, J., and Homeyer, C. R. (2021). Spatial and temporal trends and variabilities of hailstones in the United States northern great plains and their possible attributions. J. Clim. 34 (16), 1–53. doi:10.1175/jcli-d-20-0245.1
Kahraman, A., Tilev-Tanriover, Ş., Kadioglu, M., Schultz, D. M., and Markowski, P. M. (2015). Severe hail climatology of Turkey. Mon. Weather Rev. 144 (1), 337–346. doi:10.1175/mwr-d-15-0337.1
Laviola, S., Monte, G., Cattani, E., and Levizzani, V. (2022). Hail climatology in the Mediterranean basin using the GPM constellation (1999-2021). Remote Sens. 14 (17), 4320. doi:10.3390/rs14174320
Li, M., Zhang, D.-L., Sun, J., and Zhang, Q. (2018a). A statistical analysis of hail events and their environmental conditions in China during 2008–15. J. Appl. Meteorology Climatol. 57 (12), 2817–2833. doi:10.1175/jamc-d-18-0109.1
Li, M., Zhang, Q., and Zhang, F. (2016). Hail day frequency trends and associated atmospheric circulation patterns over China during 1960–2012. J. Clim. 29 (19), 7027–7044. doi:10.1175/jcli-d-15-0500.1
Li, X., Zhang, Q., Zou, T., Lin, J., Kong, H., and Ren, Z. (2018b). Climatology of hail frequency and size in China, 1980–2015. J. Appl. Meteorology Climatol. 57 (4), 875–887. doi:10.1175/jamc-d-17-0208.1
Lin, H. (2019). Long-lead ENSO control of the boreal summer intraseasonal oscillation in the East Asian-western North Pacific region. npj Clim. Atmos. Sci. 2 (1), 31. doi:10.1038/s41612-019-0088-2
Ma, R., Feng, S., Jin, S., Sun, J., Fu, S., Sun, S., et al. (2021). Statistical characteristics and environmental conditions of the warm-season severe convective events over North China. Atmosphere 12 (1), 52. doi:10.3390/atmos12010052
Min, J., Cao, X., Duan, Y., Liu, H., and Wang, S. (2012). Analysis on the climate characteristics of hail and its break in Beijing, Tianjin and Hebei during recent 30 years. Meteorol. Mon. 38, 189–196. doi:10.7519/j.issn.1000-0526.2012.2.007
Ni, X., Muehlbauer, A., Allen, J. T., Zhang, Q., and Fan, J. (2020). A climatology and extreme value analysis of large hail in China. Mon. Weather Rev. 148 (4), 1431–1447. doi:10.1175/mwr-d-19-0276.1
Púčik, T., Castellano, C., Groenemeijer, P., Kühne, T., Rädler, A. T., Antonescu, B., et al. (2019). Large hail incidence and its economic and societal impacts across europe. Mon. Weather Rev. 147 (11), 3901–3916. doi:10.1175/mwr-d-19-0204.1
Punge, H. J., Bedka, K. M., Kunz, M., and Werner, A. (2014). A new physically based stochastic event catalog for hail in Europe. Nat. Hazards 73 (3), 1625–1645. doi:10.1007/s11069-014-1161-0
Punge, H. J., and Kunz, M. (2016). Hail observations and hailstorm characteristics in europe: A review. Atmos. Res. 176, 159–184. doi:10.1016/j.atmosres.2016.02.012
Rädler, A. T., Groenemeijer, P., Faust, E., and Sausen, R. (2018). Detecting severe weather trends using an additive regressive convective hazard model (AR-CHaMo). J. Appl. Meteorology Climatol. 57 (3), 569–587. doi:10.1175/jamc-d-17-0132.1
Raupach, T. H., Martius, O., Allen, J. T., Kunz, M., Lasher-Trapp, S., Mohr, S., et al. (2021). The effects of climate change on hailstorms. Nat. Rev. Earth Environ. 2 (3), 213–226. doi:10.1038/s43017-020-00133-9
Reges, H. W., Doesken, N., Turner, J., Newman, N., Bergantino, A., and Schwalbe, Z. (2016). CoCoRaHS: The evolution and accomplishments of a volunteer rain gauge network. Bull. Am. Meteorological Soc. 97 (10), 1831–1846. doi:10.1175/bams-d-14-00213.1
Stržinar, G., and Skok, G. (2018). Comparison and optimization of radar-based hail detection algorithms in Slovenia. Atmos. Res. 203, 275–285. doi:10.1016/j.atmosres.2018.01.005
Suwała, K., and Bednorz, E. (2013). Climatology of hail in central europe. Quaest. Geogr. 32 (3), 99–110. doi:10.2478/quageo-2013-0025
Thompson, D. W. J., Wallace, J. M., and Hegerl, G. C. (2000). Annular modes in the extratropical circulation. Part II: Trends. J. Clim. 13 (5), 1018–1036. doi:10.1175/1520-0442(2000)013<1018:amitec>2.0.co;2
Thompson, D. W. J., and Wallace, J. M. (1998). The Arctic oscillation signature in the wintertime geopotential height and temperature fields. Geophys. Res. Lett. 25 (9), 1297–1300. doi:10.1029/98GL00950
Tuovinen, J.-P., Punkka, A.-J., Rauhala, J., Hohti, H., and Schultz, D. M. (2009). Climatology of severe hail in Finland: 1930–2006. Mon. Weather Rev. 137 (7), 2238–2249. doi:10.1175/2008mwr2707.1
Vinet, F. (2001). Climatology of hail in France. Atmos. Res. 56 (1), 309–323. doi:10.1016/S0169-8095(00)00082-X
Wallace, J. M., and Hobbs, P. V. (2006). Atmospheric science. London, United Kingdom: Academic Press.
Wang, P., Shi, J., Hou, J., and Hu, Y. (2018). The identification of hail storms in the early stage using time series analysis. J. Geophys. Res. Atmos. 123 (2), 929–947. doi:10.1002/2017JD027449
Warren, R. A., Ramsay, H. A., Siems, S. T., Manton, M. J., Peter, J. R., Protat, A., et al. (2020). Radar-based climatology of damaging hailstorms in Brisbane and Sydney, Australia. Q. J. R. Meteorological Soc. 146 (726), 505–530. doi:10.1002/qj.3693
Webb, J. D. C., Elsom, D. M., and Meaden, G. T. (2009). Severe hailstorms in Britain and Ireland, a climatological survey and hazard assessment. Atmos. Res. 93 (1), 587–606. doi:10.1016/j.atmosres.2008.10.034
Xie, B., Zhang, Q., and Wang, Y. (2008). Trends in hail in China during 1960–2005. Geophys. Res. Lett. 35 (13), L13801. doi:10.1029/2008GL034067
Xue, F., and Liu, C. (2008). The influence of moderate ENSO on summer rainfall in eastern China and its comparison with strong ENSO. Chin. Sci. Bull. 53 (5), 791–800. doi:10.1007/s11434-008-0002-5
Yuan, W., Sun, W., Chen, H., and Yu, R. (2014). Topographic effects on spatiotemporal variations of short-duration rainfall events in warm season of central North China. J. Geophys. Res. Atmos. 119 (19), 223–234. doi:10.1002/2014JD022073
Zakšek, K., and Oštir, K. (2012). Downscaling land surface temperature for urban heat island diurnal cycle analysis. Remote Sens. Environ. 117, 114–124. doi:10.1016/j.rse.2011.05.027
Zhang, Q., Ni, X., and Zhang, F. (2017). Decreasing trend in severe weather occurrence over China during the past 50 years. Sci. Rep. 7 (1), 42310. doi:10.1038/srep42310
Zhao, W., Guo, J., Yao, Z., Yun, Y., Jia, S., Wang, W., et al. (2018). Declining hailstorm frequency in China during 1961–2015 and its potential influential factors. Int. J. Climatol. 38 (11), 4116–4126. doi:10.1002/joc.5556
Keywords: hail climatology, Beijing, disaster information data, spatial-temporal distribution, enso, arctic oscillation
Citation: Bian Y, Hu Y, Li M, Li J, Huang M and Ma X (2023) Hail climatology and its possible attributions in Beijing, China: 1980-2021. Front. Environ. Sci. 10:1097766. doi: 10.3389/fenvs.2022.1097766
Received: 14 November 2022; Accepted: 09 December 2022;
Published: 04 January 2023.
Edited by:
Dan Chen, China Meteorological Administration, ChinaReviewed by:
Helber Gomes, Federal University of Alagoas, BrazilCopyright © 2023 Bian, Hu, Li, Li, Huang and Ma. This is an open-access article distributed under the terms of the Creative Commons Attribution License (CC BY). The use, distribution or reproduction in other forums is permitted, provided the original author(s) and the copyright owner(s) are credited and that the original publication in this journal is cited, in accordance with accepted academic practice. No use, distribution or reproduction is permitted which does not comply with these terms.
*Correspondence: Yaqiong Hu, eWFxaW9uZy5odUBraXQuZWR1
Disclaimer: All claims expressed in this article are solely those of the authors and do not necessarily represent those of their affiliated organizations, or those of the publisher, the editors and the reviewers. Any product that may be evaluated in this article or claim that may be made by its manufacturer is not guaranteed or endorsed by the publisher.
Research integrity at Frontiers
Learn more about the work of our research integrity team to safeguard the quality of each article we publish.