
94% of researchers rate our articles as excellent or good
Learn more about the work of our research integrity team to safeguard the quality of each article we publish.
Find out more
ORIGINAL RESEARCH article
Front. Environ. Sci. , 11 January 2023
Sec. Environmental Economics and Management
Volume 10 - 2022 | https://doi.org/10.3389/fenvs.2022.1096650
 Min Xiao*
 Xingzhi Peng
With the continuous progress of social production, it has brought huge benefits, but also led to an increasingly prominent global warming problem. Therefore, energy conservation and emission reduction has become an important direction of national industrial development. In order to promote the effective promotion of China’s carbon emission reduction action, the study adopted the improved STIRPAT model and Granger test to analyze the factors affecting China’s energy consumption carbon emissions, combined with Johan equation and GFI decomposition to decompose the factors affecting China’s energy consumption carbon emissions, excavated the key influencing conditions of China’s energy consumption carbon emissions, and put forward policy recommendations on energy consumption carbon emissions reduction. The results show that economic growth has the greatest impact on China’s per capita carbon emissions, followed by urbanization, industrial structure and energy structure. At the same time, industrial energy intensity has an inhibitory effect on per capita carbon emissions growth. From 2019 to 2021, Shanghai, Tianjin, Guangdong and other 10 provinces will achieve good emission reduction results. Therefore, in the analysis of energy conservation and emission reduction, it is of great value to understand the influencing factors of carbon emissions, which can provide direction and guidance for exploring an effective low-carbon development path, and play an important role in promoting the realization of the “double carbon” goal.
In the face of the severe global climate and environmental situation, countries have taken corresponding countermeasures to jointly cope with the climate global crisis. In this context, a green and low-carbon transformation of society and economy is necessary. China has also made a major strategic decision of “double carbon economy,” proposing the goal of carbon peaking and carbon neutrality. It is required to control the rate of global warming by reducing carbon emissions (Yu and Li, 2021). The human activities that lead to the increase of CO2 emissions are mainly the use and consumption of carbon-related substances. Especially, the industrialized production and daily use consume a large amount of fossil energy such as oil and coal, which has caused a serious problem of excessive greenhouse gas emissions, thus causing a global warming crisis (Sharif et al., 2019). Controlling CO2 emissions from the source of energy use is an important realistic path to implement the dual carbon economy strategy. In order to curb the excessive carbon emissions caused by unreasonable energy consumption, it is necessary to analyze the characteristics of energy consumption, grasp the relevant influencing factors of carbon emissions from energy consumption, and take measures based on this as the starting point. In order to effectively implement the “double carbon” target orientation, the overall green transformation of social economy is necessary.
Many scholars have conducted in-depth studies on carbon emissions, expecting to understand the influencing conditions of carbon emissions from multiple perspectives. Dey B K and his partners studied waste and carbon emissions in product manufacturing systems and proposed an autonomous inspection system based on green technology. The experimental results showed that this technology could reduce carbon emissions by 2.81%, while the product production cycle and installation costs were also reduced by more than 10% (Dey et al., 2022). Blenkinsop S and his group have responded to the UK’s institutional climate change policy by proposing to reduce patient visits and associated pollutant emissions through virtual clinics and telemedicine (Blenkinsop et al., 2021). Ma X et al. constructed a carbon emission decomposition model to analyze the driving factors of carbon emissions in China. The results showed that China’s rapid economic development hindered the reduction of carbon emissions and the reduction of energy consumption intensity could significantly reduce urban carbon emissions (Ma et al., 2019). However, the testing model and tools of this study are relatively simple, and the scientific nature of analysis needs to be improved. Yuping L et al. used econometric methods to find that the consumption of renewable energy reduced carbon emissions, starting from the change of carbon emissions in Argentina, and used this to make relevant recommendations, expecting to reduce the total global carbon emissions (Li et al., 2021). However, this study only explored the relationship between renewable energy and carbon emissions, and lacked further exploration of specific factors affecting carbon emissions from energy consumption. Pan X and other scholars started with the carbon emissions of OECD countries, analyzed the factors affecting the carbon emission intensity of 34 OECD countries from 1995 to 2014 using the symbolic regression method, and explored the internal functional structure of the influencing factors through the symbolic regression method based on genetic planning. The results show that GDP is the most important factor (Pan et al., 2019). However, the research data used in this study is relatively old, and lacks the support of the latest data. Xue LM and his team analyzed the influencing factors of China’s carbon emission intensity from the provincial perspective, and analyzed the driving mechanism of the reduction of carbon emission intensity from the provincial perspective using the spatial Dubin model. The results show that economic and energy related emission reduction measures have the greatest impact (Xue et al., 2020). However, the study lacks in-depth analysis of China’s overall carbon emissions, and analysis and suggestions on emission reduction from an overall perspective. The literature review of previous studies is shown in Table 1.
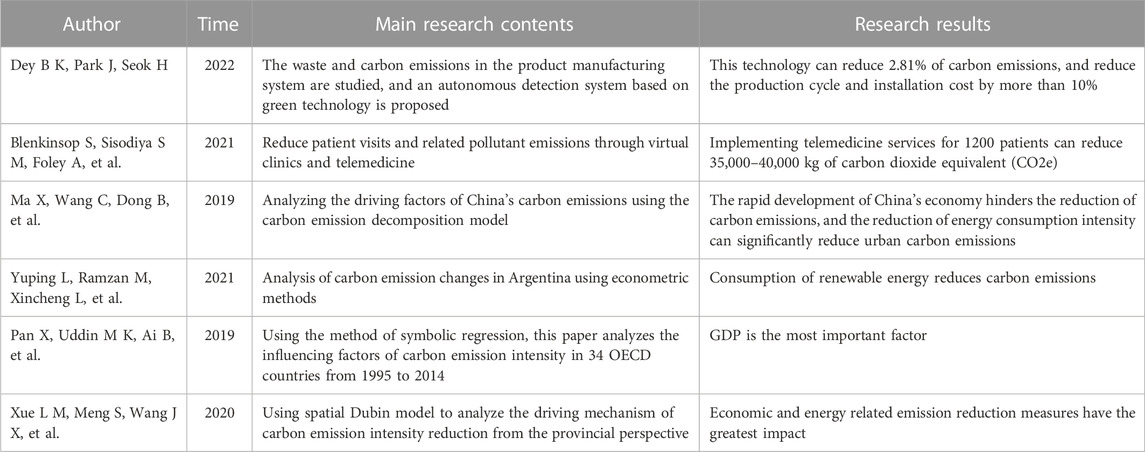
TABLE 1. Literature review.
To sum up, in recent years, there have been many studies on the factors related to carbon emissions, but the analysis is not deep enough to provide more in-depth research support and suggestions for China’s carbon emissions impact analysis. And the past research has a single analysis method, which can not provide data reference for China’s energy conservation and emission reduction actions from multiple perspectives. Therefore, the study takes energy consumption as the starting point, analyzes the influencing factors of China’s energy consumption carbon emissions by using the multi combination method, and analyzes the provincial carbon emission conditions from the perspective of spatial heterogeneity, evaluates the regional emission reduction achievements and performance, hoping to provide information reference for the ecological economic transformation under the guidance of the “dual carbon” goal, and promote the realization of China’s “dual carbon” strategic goal.
Carbon emissions are greenhouse gas emissions represented by carbon dioxide. In terms of sources, carbon emissions can be divided into renewable and non-renewable categories (Marian et al., 2021; Sabǎu et al., 2021). Renewable carbon emissions are mainly the normal carbon cycle in natural and social activities, including carbon emissions caused by environmental biological metabolism, and carbon emissions from the consumption of renewable energy sources (RenY. S.Jiang et al., 2021; Shao and Wang, 2021). Renewable carbon emissions are generally in a healthy biological cycle. Such emissions do not break the global greenhouse gas balance and do not have serious negative impacts on the global climate and environment. In contrast, non-renewable carbon emissions are carbon emissions resulting from the consumption of non-renewable energy sources such as fossil energy, which are buried in the underground environment with fossil energy. The non-renewable carbon emissions resulting from the consumption of non-renewable energy sources lead to a shock to the original state of carbon balance in the atmospheric environment and a dramatic increase in the total amount of greenhouse gases, which seriously threatens the global environment and climate stability (Li et al., 2020; Chen et al., 2021). In China’s carbon emission structure, energy consumption accounts for more than 70%, and unreasonable energy consumption activities are the direct culprits of non-renewable carbon emissions. Therefore, in order to achieve “carbon neutrality” and “carbon peaking,” and mitigate the impact of greenhouse effect on the natural atmospheric environment, non-renewable carbon emission control is the main means.
It is worth noting that carbon dioxide emissions are a major component of carbon emissions, but carbon emissions are not the same as carbon dioxide emissions. The difference lies mainly in the quantity of the two. The molecular weights of carbon and carbon dioxide are different, so the coefficients used in the process of compiling data on carbon emissions and carbon dioxide emissions are different. Therefore, it is important not to confuse carbon dioxide emissions with carbon emissions when performing data statistics and analysis of carbon emissions (Cui et al., 2022; Shah et al., 2022). The issue of carbon emissions that the study is concerned with is not only carbon dioxide emissions, but non-renewable carbon emissions caused by having fossil energy consumption, including many greenhouse gases.
In recent years, China has experienced rapid economic growth, and the income level and quality of life of the people have been continuously improved. However, what behind the rapid economic growth is a huge input of resources and energy, and a series of environmental problems have gradually come to the fore (Das et al., 2022; Lqbal et al., 2022). The study obtained data from the China Statistical Yearbook. From the perspective of energy consumption in China in the past 10 years, the total energy consumption has always kept rising. By 2021, it has exceeded 500 million tons of standard coal, with a year-on-year growth rate of 5.23%. The total energy consumption and growth in China from 2012 to 2021 are shown in Figure 1. In China’s energy consumption activities, the dominant source of consumption is the secondary industry, and industry has the highest percentage of energy consumption, which is the main industry of energy consumption in China. According to the analysis of the types of energy consumption in China, coal is the main consumption type in energy consumption. Although the proportion of coal consumption has declined in recent years, but always occupy a dominant position. Crude oil consumption and other types of consumption accounted are climbing year by year.
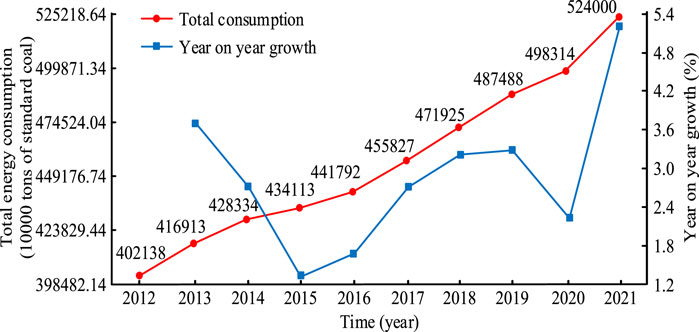
FIGURE 1. Total energy consumption and growth in China from 2012 to 2021.
The total carbon emission is an important indicator to measure the carbon emission status of a country or region. The change of China’s total carbon emission from 2012 to 2021 is shown in Figure 2. In the past 10 years, China’s carbon emissions from energy consumption have generally maintained an increase. There was a small decline in 2015, which was mainly related to the national economic situation at that time. However, since 2016, China’s total carbon emissions have grown rapidly. The carbon emissions reached 11.05 billion tons in 2021, with a year-on-year growth rate of 2.41%. The rapid socio-economic development has driven the rapid increase in energy consumption. The rapid development of China’s economy in recent years has also led to a faster growth trend of carbon emissions, with a year-on-year growth rate of 3.91% in total carbon emissions in 2018. At present, China’s energy consumption and carbon emission levels are the highest in the world. The goal of “carbon neutrality” requires the transformation of the existing huge fossil energy consumption system into a new energy pattern with relatively zero emissions within 40 years, which means that China is facing a very difficult task of carbon emission reduction. The energy industry occupies an important strategic and fundamental position in China’s economic system, directly affecting the pace of China’s economic development. Therefore, how to successfully achieve the “double carbon” target without slowing down the economic development is a huge challenge for China’s development. Therefore, it is important to scientifically assess the impact factors of energy consumption in China under the guidance of the “double carbon” target. Targeted measures are needed to transform energy consumption to low carbon.

FIGURE 2. Change in China’s total carbon emissions from 2012 to 2021.
The carbon emission of energy consumption is the main reason for the continuous improvement of China’s carbon emission intensity. Therefore, it is necessary to conduct an in-depth analysis of the influencing factors of China’s carbon emission of energy consumption to provide reference for China’s energy conservation and emission reduction. From the dual perspectives of China’s overall carbon emissions and inter provincial and regional spatial differences, the study conducted an in-depth analysis of the influencing factors of China’s energy consumption carbon emissions, combined the advantages of STIRPAT model, Johan’s identity, GFI decomposition and GWR model in influencing factors and difference analysis, and used multiple combination tools to study the influencing conditions of China’s energy consumption from multiple perspectives. STIRPAT model is an environmental impact assessment model. It explores the impact of various influencing factors on the environmental load through quantitative analysis. It has the advantages of high flexibility and expand-ability and is widely used in carbon emission impact analysis. Granger test is a common cause and effect test method in econometrics, which can analyze and judge the cause and effect relationship between time series variables. In order to obtain the relevant influencing factors of carbon emissions from energy consumption and to provide a reference for energy emission reduction, the study uses historical data on the characteristics of energy consumption as well as carbon emissions in China and the change trend of carbon emissions over the years to conduct an in-depth analysis of the influencing conditions of carbon emissions through the improved STIRPAT model. The study also combines the D-P non-linear Granger test to further verify the intrinsic effect relationship between the per capita carbon emission condition and the hypothesized influencing factors in China. The analytical model of carbon emission influencing factors is shown in Figure 3.
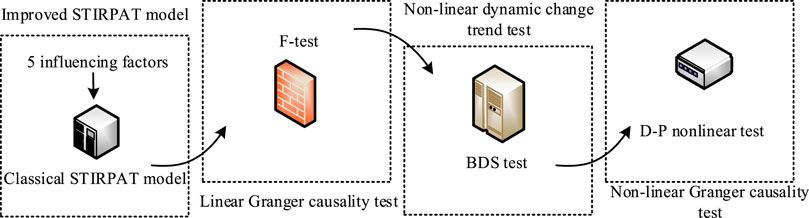
FIGURE 3. Analysis model of carbon emission influencing factors.
The IPAT model is the first model to conceptually quantify the pressures and impacts of socioeconomic behavior on the environment. It links the size of society’s population
The STIRPAT model is based on the IPAT model, which was revised and proposed by Dietz et al., in 1994. It introduces the mechanism of stochastic impact regression based on the classical IPAT model and combines the estimated indices to analyze the non-homogeneous relationships among the environmental influences (Sun and Gao, 2022). The STIRPAT model expression is shown in Eq. 2.
In Eq. 2,
In Eq. 3,
Combining linear and non-linear Granger tests to analyze the specific effect relationship of the influencing factors, the linear Granger causality test is shown in Eq. 5.
In Eq. 5,
In Equation 6,
In Eq. 8,
Whether
In Eq. 10,
In order to analyze the impact of energy consumption intensity and other influencing factors on carbon emissions at the industry level, the study uses Johan’s constant equation and Generalized Fisher Index (GFI) to construct a decomposition model of carbon emission influencing factors. The model explores the mechanism of influencing factors on carbon emissions in China from the perspective of industries and examines the intrinsic effects of changes in influencing factors on carbon emissions. The decomposition model of carbon emission impact factors is shown in Figure 4.
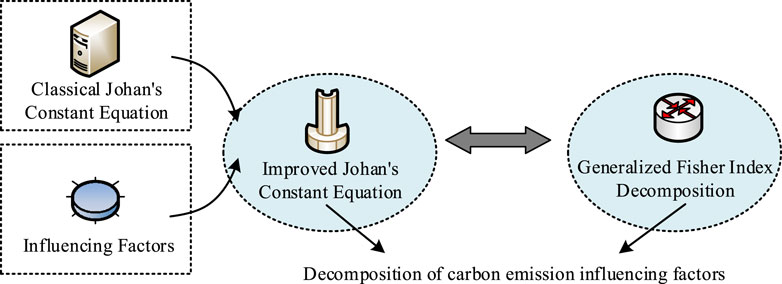
FIGURE 4. Decomposition model of carbon emission influencing factors.
Johan’s constant equation is based on the classical Kaya’s constant equation, and the formula decomposes the influencing factors of carbon emissions. The formula analyzes the influencing conditions of carbon emissions from four aspects: energy consumption intensity, consumption structure, economic level and population size. Johan’s constant equation is shown in Eq. 11.
In Equation 11,
In Equation 12,
Define the base of set
In Equation 14,
Let the per capita carbon emissions in period
Then the formula of each influencing factor is shown in Eq. 18.
Different regions have different characteristics in terms of economic development and energy consumption, and there are also differences in the effectiveness of carbon emission reduction implementation. In order to analyze energy carbon emissions in different regions and investigate the effectiveness of implementing the dual carbon targets in different provinces, the study analyzes the regional spatial performance of energy consumption carbon emissions from the perspective of spatial correlation and heterogeneity using spatial panel data models and geographically weighted regression models on the basis of the analysis of factors influencing energy consumption carbon emissions at the general and industrial levels. The spatial panel data model strengthens the control of spatial heterogeneity measures on the basis of the traditional cross-sectional model, which can obtain more data information from data variation and provide data help for the study of dynamic changes in data on time series (Fang et al., 2022; Li et al., 2022). The study used a spatial Durbin panel model to analyze the factors influencing carbon emissions, and the spatial Durbin model expression is shown in Eq. 19.
In Equation 19,
In Equation 20,
In Equation 21,
In Equation 22,
In Equation 23,
In Equation 24,
In Equation 25,
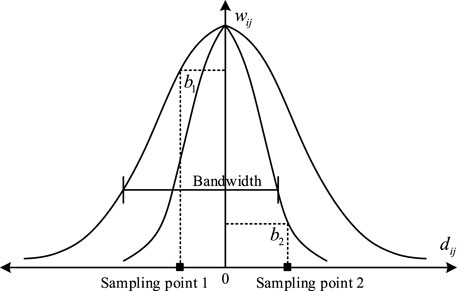
FIGURE 5. Gaussian spatial weight function.
The research and analysis data source is the annual carbon emission data released by Carbon Dioxide Information Analysis Centre (CDIAC) of Oak Ridge National Laboratory, and the carbon emission data generated by fossil energy is selected as the total carbon emission data of China’s energy consumption. China’s population data are all from the World Bank’s population database, and the selected time period for each data is 2012–2021. A linear Granger causality test is conducted to explore the linear influence relationship between carbon emissions and the influencing factors based on the smooth time series data. The results of the linear Granger causality test are shown in Table 2.
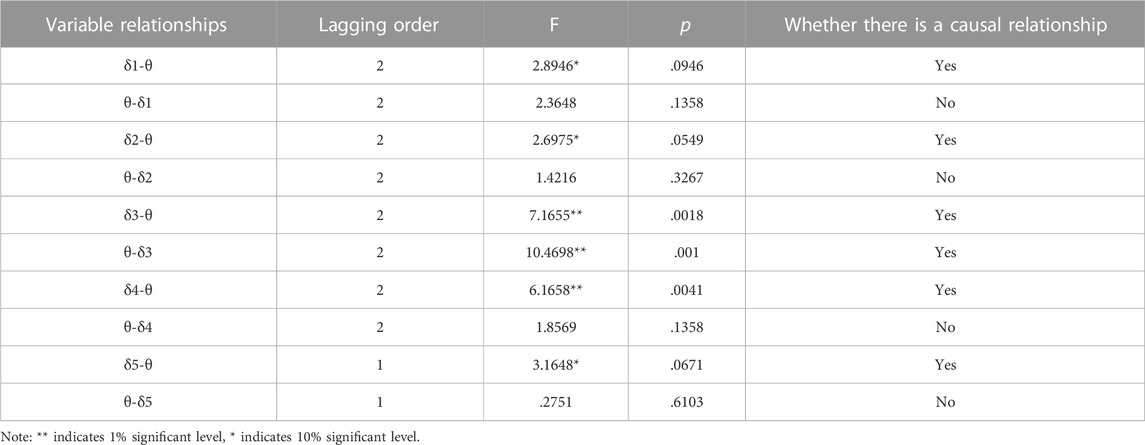
TABLE 2. Linear granger causality test results.
As can be seen in Table 2, all five influencing factors proposed by the study are linear causes of the growth of carbon emissions per capita in China. Among them, industrial structure, consumption structure, economic development and urbanization are not affected by the inverse linearity of carbon emission growth, while carbon emission per capita is the linear cause of the growth of energy consumption intensity. The results of the linear Granger causality test show that changes in the factors of industrial structure, consumption structure, consumption intensity, economic development, and urbanization have a linear effect on carbon emissions. That is, there is a linear relationship between carbon emissions and the influencing factors, and a linear regression model can be established. Based on the linear Granger test, the non-linear interaction relationship between each influencing factor and carbon emissions is further analyzed to test the non-linear dynamic change trend between the influencing factors and carbon emissions. Firstly, the carbon emission time series data are tested for normal distribution, and the normal distribution QQ diagram of total carbon emissions and per capita carbon emissions is shown in Figure 6.
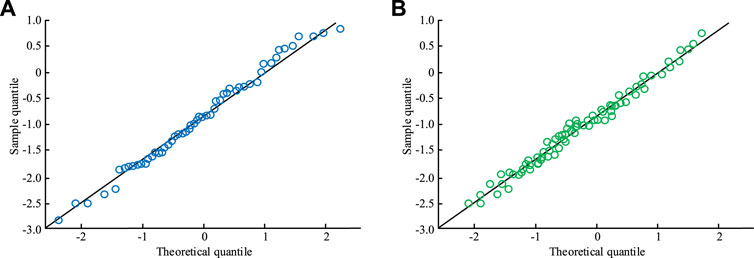
FIGURE 6. Normal distribution QQ chart of total carbon emissions and per capita carbon emissions. (A) Total carbon emissions. (B) Carbon emissions per capita.
From Figure 6, the time series of total carbon emissions and per capita carbon emissions meet normal distribution. The bandwidth is determined by Eq. 10 to filter out the influence of linear relationship between carbon emission and influencing factors, and then the filtered residual series is tested by BDS. The results of the non-linear trend test between carbon emission and influencing factors are shown in Table 3.
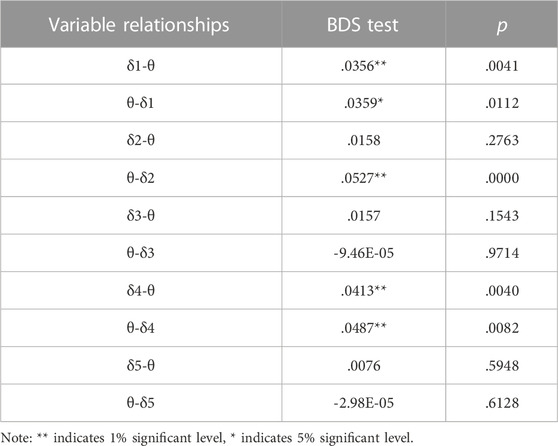
TABLE 3. Test results of non-linear change trend.
According to Table 3, the results of the explanatory and explained variables tests between energy consumption intensity and carbon emissions are not significant, and the results of the mutual explanation test between urbanization level and carbon emissions are also not significant, which proves that there is no non-linear trend between consumption intensity and urbanization level and carbon emissions growth, and there is only a linear effect on carbon emissions without non-linear effect. The results of the mutual explanation tests between industrial structure and economic development and per capita carbon emissions all show significant levels. The results of the explanatory test for the growth of carbon emissions by consumption structure are significant and the opposite is not significant, which proves that there is a non-linear dynamic trend between industrial structure, economic development and consumption structure and carbon emissions, and the next step of non-linear Granger causality test can be performed. The results of the non-linear Granger causality test between industrial structure, economic development and consumption structure and carbon emission variables are shown in Table 4.
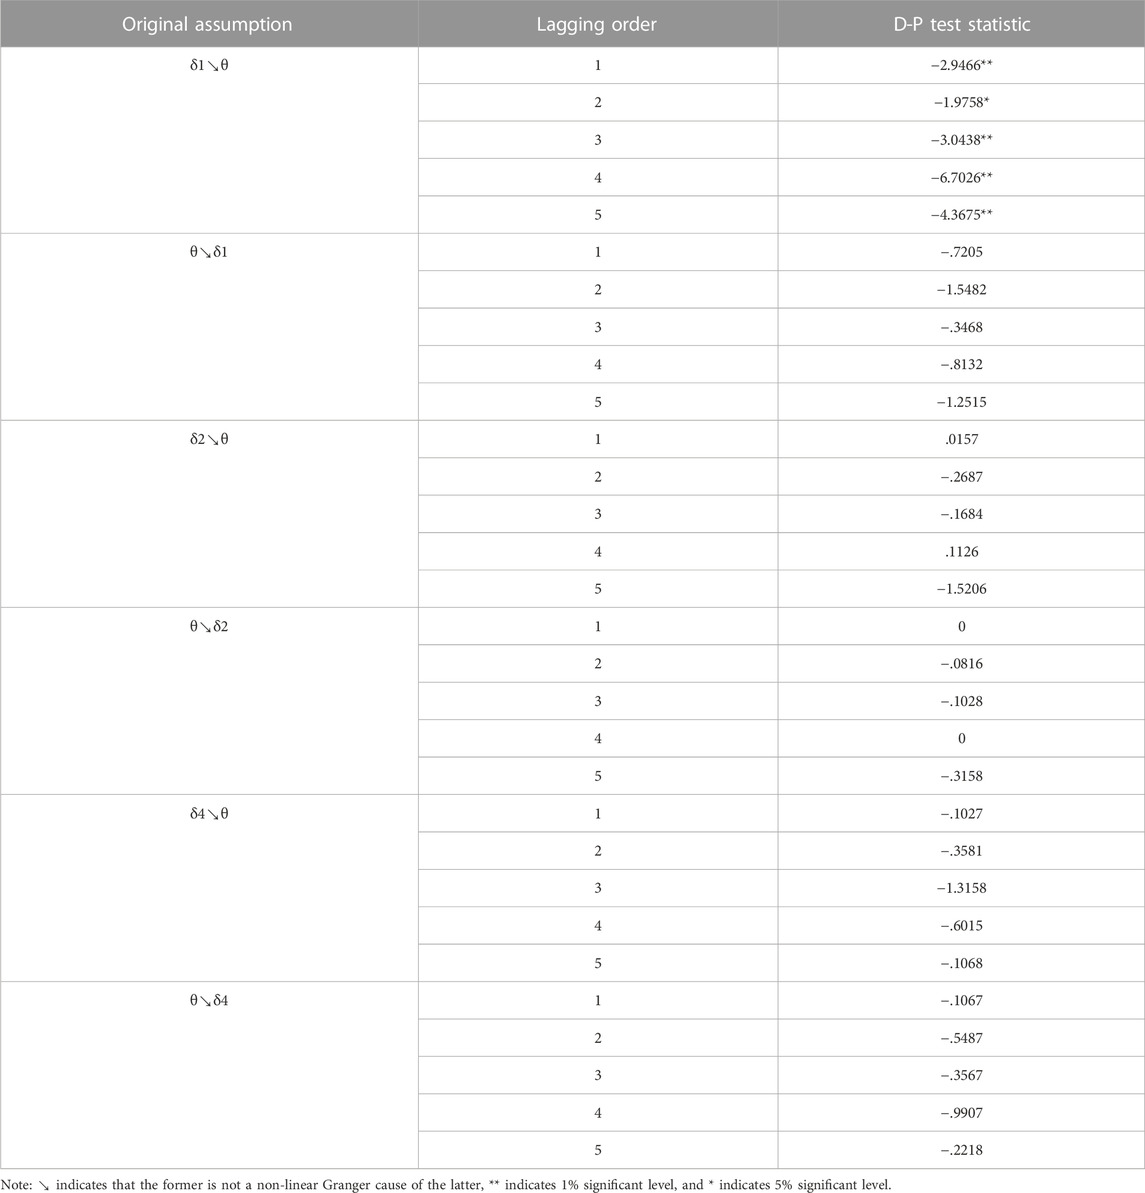
TABLE 4. Non-linear granger causality test results.
There is no non-linear Granger causality between economic development and energy consumption structure or carbon emissions, there is only a one-way linear effect on the growth of carbon emissions. Industrial structure is a non-linear cause of carbon emission changes, and industrial structure has a long-term influence on carbon emission growth, which is a non-linear driver of carbon emission growth per capita in China. However, carbon emission growth does not have a reverse non-linear causality on industrial structure change.
The GFI decomposition is used to analyze the influence relationship between the five influencing factors and per capita carbon emissions, and to decompose the influencing factors of carbon emissions from energy consumption. The carbon emission data from 2012 to 2021 are obtained from the China Statistical Yearbook, and the GFI decomposition results of carbon emission influencing factors from 2012 to 2021 are shown in Table 5.
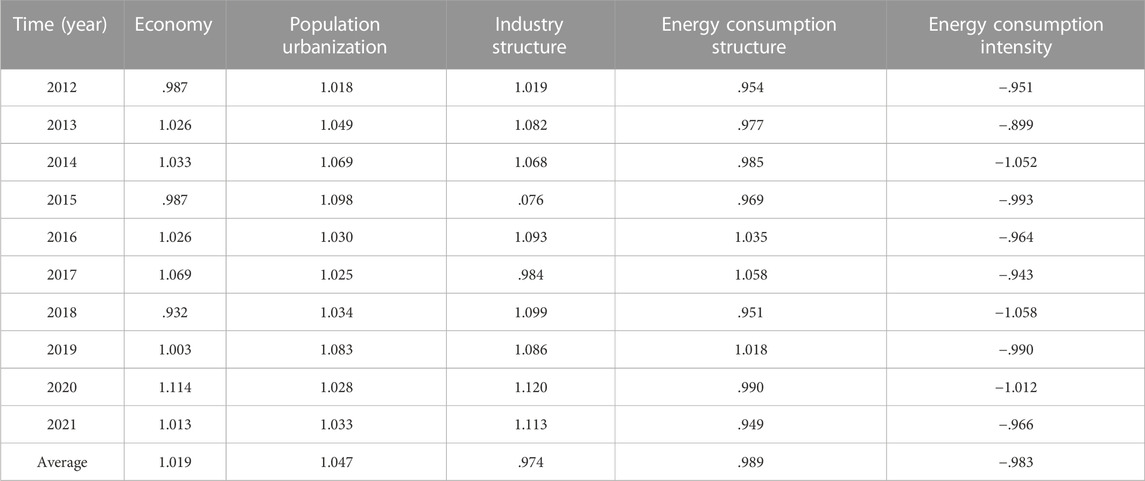
TABLE 5. GFI decomposition results of carbon emission influencing factors from 2012 to 2021.
According to Table 5, the five influencing factors proposed by the study all constitute significant effects on the change of carbon emissions per capita. Among them, industrial structure, consumption structure, economic development and urbanization level have a positive pull effect on the change of carbon emissions, while consumption intensity has a negative inhibitory effect on the change of carbon emissions. Combined with the improved Johan identity and GFI decomposition, explore the impact of influencing factors on carbon emissions. Based on the carbon emissions data from 2012 to 2021 in the China Statistical Yearbook, the statistical results of the contribution rate of influencing factors to carbon emissions from 2012 to 2021 are shown in Table 6.

TABLE 6. Contribution rate of influencing factors to carbon emissions from 2012 to 2021.
Table 6 shows that in terms of the contribution of various influencing factors to the change of carbon emissions, the economic level has the highest contribution rate to the change of carbon emissions per capita in China, which is 20.967%. Therefore, economic development is the main influencing factor for the change of carbon emissions. China is in the industrialization development stage of developing countries, and what behind the development of national economy is huge energy consumption investment, which leads to the continuous increase of carbon emissions per capita in China. Energy input is one of the main basic inputs for the economic development of developing countries. While promoting economic growth, it inevitably causes ecological and environmental problems such as carbon emissions.
The second largest contributor is the level of urbanization of the population, with 19.714%. Among the human activities that cause carbon emissions. In addition to the necessary energy consumption for process production, the consumption of energy in the production of people’s lives is also an important driver of carbon emissions growth. With the development process of urbanization of the population, the per capita carbon emissions are rising. The energy use demand of urban population is significantly higher than that of rural population, which makes the per capita carbon emission increase with the proportion of urban population. Therefore, it is necessary to raise people’s awareness of emission reduction, establish a resource-saving lifestyle and consumption patterns, and reduce the influence of urbanization level on the growth of per capita carbon emissions.
The positive contribution of industrial structure influencing factors to the growth of carbon emissions per capita in China is 19.278%. In terms of the energy consumption structure of each industry in China, the secondary industry has the greatest impact on the increase of energy consumption and carbon emissions. Industrial development needs a large amount of energy. Currently the industrial development process in China has a high percentage of non-renewable energy consumption, which leads to a large amount of carbon emissions. The tertiary industry with higher added value and lower energy consumption is in the development stage, but still cannot shake the dominant position of the secondary industry. In order to reduce carbon emissions and promote the transformation of a green and low-carbon society, The government should promote the optimization of the industrial structure of energy conservation and emission reduction, integrate resources in the field of secondary industry, promote the improvement of energy utilization efficiency of secondary industry, and actively increase the proportion of low-energy tertiary industry in the national economy.
The energy consumption structure has the fourth largest contribution to the growth of carbon emissions, at 18.686%. The carbon emission coefficients of different energy types are different, which makes the carbon emissions caused by different types of energy consumption different, so the total carbon emissions are also affected by the change of energy consumption structure. In order to reduce the level of carbon emissions per capita and achieve of the goal of “carbon neutrality”, it is necessary to optimize the energy consumption structure. The proportion of high-emission energy in the consumption structure should be reduced, and energy consumption should be upgraded to low energy consumption and low carbon. The development of clean energy, such as solar energy, should be encouraged to expand the proportion of renewable energy in the consumption structure.
Energy consumption intensity has the lowest contribution to carbon emission, which is 18.404%. Unlike the other four influencing factors, consumption intensity has a negative influence effect on carbon emissions. Due to the improvement of industrial energy utilization technology level and utilization efficiency, energy consumption intensity shows a decreasing trend, which has a negative inhibiting effect on the growth of carbon emissions from energy consumption. Therefore, improving energy utilization efficiency to reduce consumption intensity is an important measure. The government and enterprises should strengthen their R&D efforts on energy utilization, adopt advanced equipment with low energy consumption and low emissions to carry out production activities, and upgrade low-carbon industries as soon as possible.
To sum up, in order to analyze the influence relationship between the influencing factors of carbon emissions, the study conducted a linear Granger causality test on the time series data. The results show that there is a linear relationship between the influencing factors and carbon emissions, and the time series of carbon emissions meet the normal distribution, so it can enter the non-linear test. The non-linear trend test results show that there is no non-linear change trend between consumption intensity, urbanization level and carbon emissions growth, and there is a non-linear dynamic change trend between industrial structure, economic development, consumption structure and carbon emissions, which can be used for the next non-linear Granger causality test. Based on the results of linear and non-linear Granger causality tests, there is only a one-way linear relationship between energy consumption structure, economic development, urbanization level and carbon emissions growth, a two-way linear relationship between consumption intensity and carbon emissions growth, and a non-linear effect between industrial structure and carbon emissions. The results of the GFI factor decomposition of the influencing factors show that the five influencing factors have significant effects, among which the industrial structure, consumption structure, economic development and urbanization level have a positive impact, while the consumption intensity has a negative impact. The contribution of the influencing factors to the change of carbon emissions is in the order of economic level, population urbanization level, industrial structure, energy consumption structure and energy consumption intensity.
The GWR model is used to analyze the inter-provincial regional differences in the impact of carbon emissions. The elasticity coefficients of the variables of the GWR model are used to estimate the results and analyze the regional differences in the impact of the impact factors. The elasticity coefficients of the variables are positively correlated with the degree of impact. Inter-provincial regional differences in the impact of the five impact factors on carbon emissions are shown in Figure 7. All data are obtained from the energy statistical yearbook in the China Statistical Yearbook.
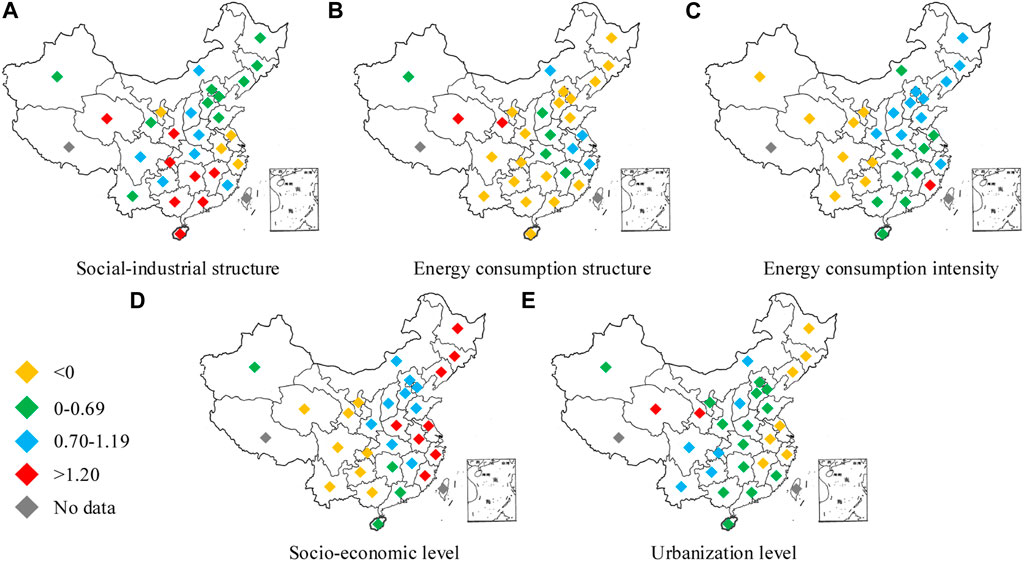
FIGURE 7. Inter-provincial differences of influence factors on carbon emissions. (A) Social-industrial structure. (B) Energy consumption structure. (C) Energy consumption intensity. (D) Socio-economic level. (E) Urbanization level.
From Figure 7, in terms of social-industrial structure, eight regions including Shaanxi, Guangxi, Hunan and Chongqing have variable elasticity coefficients over 1.2, mainly concentrated in the southern region and some northwestern regions of China, which proves that these regions are more influenced by the industrial structure. In contrast, the variable elasticity coefficients of Jiangsu, Zhejiang, Shanghai, Ningxia and Anhui are negative, which indicates that the optimization of regional industrial structure has achieved certain results, and the decreasing share of secondary industry and the improvement of energy utilization efficiency have effectively suppressed the growth of carbon emissions.
In terms of energy consumption structure factors, the positive effect of consumption structure on Qinghai, Ningxia, Zhejiang, Jiangsu and other northwest and east China regions is larger. Regions with negative effects are mainly concentrated in South China, Southwest, Northeast and North China, including Sichuan, Hunan and Guangxi. These regions are more influenced by energy consumption structure factors. They should reduce the proportion of high carbon emission energy sources such as coke and coal in energy consumption and increase the use of clean energy.
As for energy consumption intensity level, carbon emissions are positively correlated with consumption intensity in all regions. In general, the variable elasticity coefficients of each region are characterized by decreasing from east to west. Heilongjiang, Sichuan, Guizhou and Qinghai regions have smaller variable elasticity coefficients and are less influenced by consumption intensity. The central and eastern regions are more influenced by consumption intensity. They should further increase the investment in energy use R&D to curb the growth of carbon emissions.
In terms of socio-economic level, the variable elasticity coefficients of Shanghai, Jiangsu and other eastern regions and three eastern provinces are high, followed by Hebei, Shandong and other northern China and surrounding regions, which indicates that the positive influence of changes in economic development level on the growth of carbon emissions in these regions is stronger. They should actively change their high-emission socio-economic development patterns, upgrade their economic and industrial structures, and reduce the increase in carbon emissions caused by economic development.
In terms of urbanization level, Qinghai and Gansu regions have the largest elasticity coefficients of the variables, which is mainly due to the small base of population size in these two regions. Northwest, southwest and north China regions such as Shanxi, Chongqing and Yunnan are more affected by the level of urbanization. They should cultivate people’s energy-saving and emission-reducing lifestyle to reduce the impact of urbanization on carbon emissions in the context of the year-by-year urbanization process. Evaluate and analyze the provincial emission reduction performance from 2019 to 2021, and obtain the change of carbon emissions of each province from 2019 to 2021 through the China Statistical Yearbook, as shown in Figure 8.
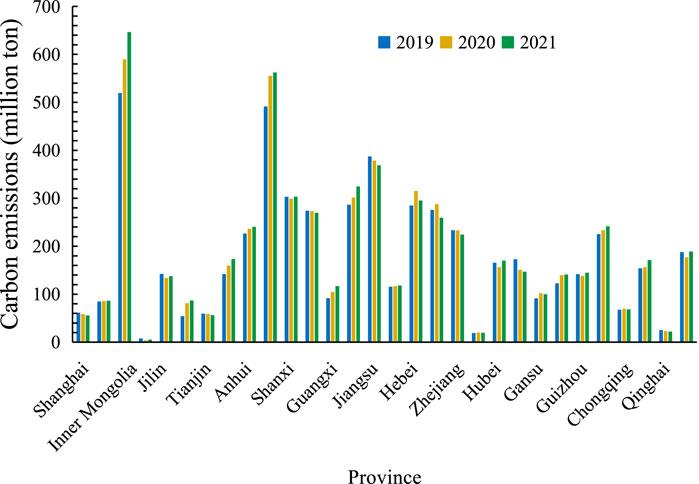
FIGURE 8. Change in Total Carbon Emissions of different Provinces.
According to Figure 8, the total carbon emissions of each province show different trends from 2019 to 2021. Some cities show a gradual decrease in carbon emissions, and some cities show a continuous increase in carbon emissions. The cities that show a significant decrease in carbon emissions are Shanghai, Tianjin, Guangdong, Jiangsu, Henan, Zhejiang and Hunan. The provinces that show a year-on-year increase in carbon emissions are Inner Mongolia, Sichuan, Ningxia, Anhui, Shandong, Guangxi, Xinjiang, Gansu, Fujian, Liaoning, and Shaanxi. The rest of the provinces do not show significant changes in carbon emissions. The above results show that the cities with decreasing carbon emissions have carried out their low-carbon actions more smoothly and strictly complied with the green and low-carbon related policies in their development. They have achieved certain results in the process of achieving the double carbon target. The reasons for the difficulty in reducing carbon emissions in the remaining provinces are more complicated. Inner Mongolia and Shandong, as the main resource provinces in China, have maintained a long-term industrial primary in energy consumption, while the single heavy industrial production has also led to an increase in their energy consumption, which in turn has led to a gradual trend of increasing carbon emissions.
Coal consumption is the main component of China’s energy consumption, and has a large impact in the carbon emissions of energy consumption. There is a certain negative correlation between carbon emissions per capita and the share of coal consumption, so optimizing and adjusting China’s energy consumption structure is necessary to achieve China’s double carbon target, and it is of great value to promote carbon emission reduction and carbon neutrality. The main reason for the growth of carbon emissions is the large use and consumption of non-renewable energy, so the optimal adjustment of industrial energy structure is effective. The share of renewable clean energy in China’s energy consumption structure should be increased, and the country should reduce its dependence on non-renewable resources with high carbon emission factors. Optimizing the industrial energy consumption structure in China can guide the clean energy utilization of industries and enterprises through relevant industrial and energy policies. In addition, the government should strictly control the consumption of highly polluting energy from the system and promote the development and utilization of renewable and clean energy according to the plan. In terms of spatial heterogeneity of carbon emissions, regions with higher dependence on fossil energy should strengthen the investment in science and technology related to renewable resources and improve energy utilization, so as to reduce carbon emissions, reach a low energy consumption structure and reduce the pressure of achieving the double carbon target.
The growth of carbon emissions in China is closely related to the secondary industry, which is the main source of fossil energy consumption in China. Therefore, in order to increase the intensity of carbon removal and reduce carbon emissions from energy consumption in China, it is urgent to promote industrial structure upgrading and adjustment. For a long time, the secondary industry has been the pillar industry of China’s socio-economic and national development, and the high economic growth is built on the cost of high energy consumption and high carbon emission. However, in order to achieve sustainable development and alleviate the ecological and environmental pressure caused by economic growth, it is necessary to upgrade the industrial structure and enhance the technology level through the integration of industry resources. The aim is to reduce the proportion of secondary industries in the industrial structure and to raise the proportion of the development of tertiary industries with the advantages of low energy consumption and high added value. The upgrading and adjustment of industrial structure can greatly reduce the dependence of China’s industrial development on fossil energy, reduce the production of high-energy-consuming industries, optimize the structure of national economic development, achieve socio-economic growth under the condition of ecological balance, and promote the “carbon peaking” and “carbon neutral” goals while maintaining the speed of economic development. Especially for some regions that rely heavily on the secondary industry, they should actively develop the low-energy tertiary industry, change the existing economic development model and mechanism, put the reliance and focus of economic growth in the tertiary industry, limit the development scale of the secondary industry, and develop a low-carbon economy.
In recent years, China’s energy consumption intensity level has remained high. In addition to the energy consumption structure factor, the low energy utilization efficiency is also an important reason for the growth of carbon emissions. Improving energy utilization technology can reduce the energy cost necessary for economic growth while enhancing the speed of industrial development, which has a significant positive effect on reducing carbon emissions. Increasing investment in energy utilization-related scientific research and encouraging the development of low-carbon technologies is an effective path for China to achieve a peaceful transition in energy restructuring under the constraint of double carbon targets. The government can encourage enterprises to actively improve their energy utilization efficiency and low-carbon technology by improving energy technology-related policies and laws, controlling the carbon emissions of the industry, and reducing the bad impact of their production activities on the environment and climate. On the other hand, the country should increase investment in research and development of energy use technologies, strengthen energy saving assessment and evaluation of secondary industry enterprises, establish strict industrial energy saving standards, and urge enterprises to adopt advanced and low energy consumption production technologies to promote their own and industrial development driven by relevant policy objectives. For regions with high energy consumption intensity, the supervision and management of enterprise energy consumption should be strengthened. Through the improvement of policy measures and assessment mechanisms, they should be urged to replace energy-intensive production equipment and improve energy use efficiency. They need to change the past poor development mechanism of exchanging environment for economy, so as to promote healthy and sustainable economic development.
Population size and urbanization level have a significant pulling effect on carbon emissions of energy consumption. Therefore, in order to build a resource conserving society and reduce the difficulty in achieving the double carbon goals, it is necessary to optimize the urban development layout planning. Under the background of the continuous increase of urbanization level of China’s social population, people’s awareness of environmental protection and emission reduction is improved through education, publicity and other measures to change the past mode of high energy consumption. Through rational and scientific urban development planning, the pressure of population urbanization on carbon emissions and the environment is reduced, and the goal of “carbon peak” can be achieved as soon as possible. The over expansion of cities and towns should be prevented, and the negative impact of urban development and human activities on the ecological environment should be controlled. In the planning and layout of future urban development, the concept of emission reduction and environmental protection should be considered as the guidance. Under the constraint of the “double carbon” goal, citizens should make rational use of urban ecology resources and environment, define the development orientation of urban industry, and establish a scientific development model that focuses on both ecological environment and economic development, so that the double carbon goal can be realized.
In order to deeply understand the impact conditions of China’s energy consumption carbon emissions, explore the development direction of achieving the dual carbon goals based on China’s carbon emissions national conditions, study and analyze the impact factors of carbon emissions by using the improved STIRPAT model and Granger test, and combine the improved Johan identity and GFI decomposition to decompose the impact factors, and analyze the regional spatial heterogeneity of carbon emissions based on spatial panel data and geographical weighted regression model, Evaluate the regional emission reduction performance. The research results show that economic growth has the highest impact on carbon emissions, with a contribution rate of 20.967%, followed by urbanization, industrial structure and energy structure. The industrial energy intensity is the lowest, and there is an inhibitory effect on per capita carbon emissions. Shanghai, Tianjin, Guangdong, Jiangsu, Henan, Zhejiang and Hunan have good emission reduction effects in 2019–2021, while Inner Mongolia, Sichuan, Ningxia, Anhui, Shandong, Guangxi, Xinjiang, Gansu, Fujian Liaoning and Shaanxi have witnessed different increases in carbon emissions, while other provinces have seen little change. Based on the analysis of influencing factors and their contributions, in order to achieve the goal of energy conservation and emission reduction, China needs to actively adjust the energy consumption structure, vigorously promote the upgrading of industrial structure, improve the efficiency of energy utilization from the perspective of energy utilization technology, optimize the urban development planning and layout, and establish an ecological development oriented city. From an international perspective, each region in the world has certain commonalities in the background and impact conditions of carbon emissions, and the response direction in terms of energy conservation and emission reduction is also consistent. The research is expected to provide reference and help from the choice of entry points of influencing factors, analysis methods, and reference of response direction.
The original contributions presented in the study are included in the article/supplementary material, further inquiries can be directed to the corresponding author.
MX: Supervision, investigation, writting; XP: Investigation.
This work was sponsored in part by Science and Technology Program Project of Ministry of Housing and Urban-Rural Development in China (2021-K-105), Scientific Research Fund of Hunan Provincial Education Department in China (18A139).
The authors declare that the research was conducted in the absence of any commercial or financial relationships that could be construed as a potential conflict of interest.
All claims expressed in this article are solely those of the authors and do not necessarily represent those of their affiliated organizations, or those of the publisher, the editors and the reviewers. Any product that may be evaluated in this article, or claim that may be made by its manufacturer, is not guaranteed or endorsed by the publisher.
Blenkinsop, S., Foley, A., Schneider, N., Fowler, H. J., Sisodiya, S. M., Blenkinsop, B., et al. (2021). Carbon emission savings and short-term health care impacts from telemedicine: An evaluation in epilepsy. Epilepsia 62 (11), 2732–2740. doi:10.1111/epi.17046
Chen, S., Conejo, A. J., and Wei, Z. (2021). Conjectural-variations equilibria in electricity, natural-gas, and carbon-emission markets. Ieee. Trans. Power. Syst. 36 (5), 4161–4171. doi:10.1109/TPWRS.2021.3066459
Chen, Y., Lu, H., Li, J., and Xia, J. (2020). Effects of land use cover change on carbon emissions and ecosystem services in Chengyu urban agglomeration, China. Stoch. Environ. Res. Risk Assess. 34 (8), 1197–1215. doi:10.1007/s00477-020-01819-8
Cui, Q., Hu, Y. X., and Yu, L. T. (2022). Can the aviation industry achieve carbon emission reduction and revenue growth simultaneously under the CNG2020 strategy? An empirical study with 25 benchmarking airlines. Energy 245, 123272. doi:10.1016/j.energy.2022.123272
Das, S., Mondal, R., Shaikh, A. A., and Bhunia, A. K. (2022). An application of control theory for imperfect production problem with carbon emission investment policy in interval environment. J. Frankl. Inst. 359 (5), 1925–1970. doi:10.1016/j.jfranklin.2022.01.035
Dey, B. K., Park, J., and Seok, H. (2022). Carbon-emission and waste reduction of a manufacturing-remanufacturing system using green technology and autonomated inspection. RAIRO- Oper. Res. 56 (4), 2801–2831. doi:10.1051/ro/2022138
Dong, K., Dong, X., and Jiang, Q. (2020). How renewable energy consumption lower global CO2 emissions? Evidence from countries with different income levels. World. Econ. 43 (6), 1665–1698. doi:10.1111/twec.12898
Du, M., Antunes, J., Wanke, P., and Chen, Z. (2022). Ecological efficiency assessment under the construction of low-carbon city: A perspective of green technology innovation. J. Environ. Plan. Manag. 65 (9), 1727–1752. doi:10.1080/09640568.2021.1945552
Du, X., Shen, L., Wong, S. W., Meng, C., and Yang, Z. (2021). Night-time light data based decoupling relationship analysis between economic growth and carbon emission in 289 Chinese cities. Sustain. Cities. Soc. 73 (1), 103119. doi:10.1016/j.scs.2021.103119
Fang, T., Fang, D., and Yu, B. (2022). Carbon emission efficiency of thermal power generation in China: Empirical evidence from the micro-perspective of power plants. Energy Policy. 165, 112955. doi:10.1016/j.enpol.2022.112955
Khan, M. K., Teng, J. Z., and Khan, M. I. (2019). Effect of energy consumption and economic growth on carbon dioxide emissions in Pakistan with dynamic ARDL simulations approach. Environ. Sci. Pollut. Res. 26 (23), 23480–23490. doi:10.1007/s11356-019-05640-x
Li, J. Y., Liu, R., and Xie, Q. W. (2022). The price fluctuation in Chinese carbon emission trading market: New evidence from adaptive Fourier decomposition. Procedia. Comput. Sci. 199 (1), 1095–1102. doi:10.1016/j.procs.2022.01.139
Li, Q. Q., Xiao, Y. J., Qiu, Y. Z., Xu, X. L., and Chai, C. C. (2020). Impact of carbon permit allocation rules on incentive contracts for carbon emission reduction. Kybernetes 49 (4), 1143–1167. doi:10.1108/K-04-2018-0169
Li, Y. A., Ramzan, M., Li, X. H., Murshed, M., Awosusi, A. A., Bah, S. L., et al. (2021). Determinants of carbon emissions in Argentina: The roles of renewable energy consumption and globalization. Energy Rep. 7, 4747–4760. doi:10.1016/j.egyr.2021.07.065
Lqbal, K., Hassan, S. T., Wang, Y. C., Shah, M. H., Syed, M., and Khurshaid, K. (2022). To achieve carbon neutrality targets in Pakistan: New insights of information and communication technology and economic globalization. Front. Environ. Sci. 9, 654–663. doi:10.3389/fenvs.2021.805360
Ma, X. J., Wang, C. X., Dong, B. Y., Gu, G. C., Chen, R. M., Li, Y. F., et al. (2019). Carbon emissions from energy consumption in China: Its measurement and driving factors. Sci. Total. Envir. 648, 1411–1420. doi:10.1016/j.scitotenv.2018.08.183
Marian, S., Dan, V. B., and Luis, F. O. S. (2021). Comparative carbon emission assessments of recycled and natural aggregate concrete: Environmental influence of cement content. Geosci. Front. 12 (6), 66–75. doi:10.1016/j.gsf.2021.101235
Pan, X., Uddin, M. K., Ai, B., Pan, X., and Saima, U. (2019). Influential factors of carbon emissions intensity in OECD countries: Evidence from symbolic regression. J. Clean. Prod. 220, 1194–1201. doi:10.1016/j.jclepro.2019.02.195
Peng, T., and Deng, H. (2021). Research on the sustainable development process of low-carbon pilot cities: The case study of Guiyang, a low-carbon pilot city in south-west China. Environ. Dev. Sustain. 23 (2), 2382–2403. doi:10.1007/s10668-020-00679-0
Ravichandran, N., and Panneerselvam, B. (2022). Floating photovoltaic system for Indian artificial reservoirs-an effective approach to reduce evaporation and carbon emission. Int. J. Environ. Sci. Technol. 19 (8), 7951–7968. doi:10.1007/s13762-021-03686-4
RenY. S., , Jiang, Y., Ma, C. Q., Liu, J. L., and Chen, J. (2021). Will tax burden be a stumbling block to carbon-emission reduction? Evidence from oecd countries. J. Syst. Sci. Inf. 9 (4), 335–355. doi:10.21078/JSSI-2021-335-21
Sabǎu, M., Dan, V. B., Silva, L. F. O., Liu, L., and Sun, C. (2021). Unveiling carbon emission attributions along sale chains. Environ. Sci. Technol. 55 (1), 220–229. doi:10.1021/acs.est.0c05798
Sadiq, M., Shinwari, R., Usman, M., Ozturk, L., and Maghyereh, A. L. (2022). Linking nuclear energy, human development and carbon emission in BRICS region: Do external debt and financial globalization protect the environment? Nucl. Eng. Technol. 54 (9), 3299–3309. doi:10.1016/j.net.2022.03.024
Shah, M. H., Ullah, L., Salem, S., Ashfaq, S., Rehman, A., Zeeshan, M., et al. (2022). Exchange rate dynamics, energy consumption, and sustainable environment in Pakistan: New evidence from nonlinear ARDL cointegration. Front. Environ. Sci. 607–617. doi:10.3389/fenvs.2021.814666
Shah, S. A. R., Naqvi, S. A. A., and Anwar, S. (2020). Exploring the linkage among energy intensity, carbon emission and urbanization in Pakistan: Fresh evidence from ecological modernization and environment transition theories. Environ. Sci. Pollut. Res. 27 (32), 40907–40929. doi:10.1007/s11356-020-09227-9
Shao, H., and Wang, Z. (2021). Spatial network structure of transportation carbon emission efficiency in China and its influencing factors. Chin. J. Popul. Resour. Environ. 19 (4), 295–303. doi:10.1016/j.cjpre.2022.01.002
Sharif, A., Raza, S. A., Ozturk, I., and Afshan, S. (2019). The dynamic relationship of renewable and nonrenewable energy consumption with carbon emission: A global study with the application of heterogeneous panel estimations. Renew. Energy. 133, 685–691. doi:10.1016/j.renene.2018.10.052
Sun, H., and Gao, G. (2022). Research on the carbon emission regulation and optimal state of market structure: Based on the perspective of evolutionary game of different stages. RAIRO-Oper. Res. 56 (4), 2351–2366. doi:10.1051/ro/2022088
Tam, V. W. Y., Le, K. N., Tran, C. N. N., and Illankoon, I. M. C. S. (2021). A review on international ecological legislation on energy consumption: Greenhouse gas emission management. Int. J. Constr. Manag. 21 (6), 631–647. doi:10.1080/15623599.2019.1576259
Xue, L. M., Meng, S., Wang, J. X., Liu, L., and Zheng, Z. X. (2020). Influential factors regarding carbon emission intensity in China: A spatial econometric analysis from a provincial perspective. Sustainability 12 (19), 8097–8122. doi:10.3390/su12198097
Keywords: energy consumption, carbon emissions, influence factors, STIRPAT, GFI, spatial panel data model
Citation: Xiao M and Peng X (2023) Decomposition of carbon emission influencing factors and research on emission reduction performance of energy consumption in China. Front. Environ. Sci. 10:1096650. doi: 10.3389/fenvs.2022.1096650
Received: 14 November 2022; Accepted: 27 December 2022;
Published: 11 January 2023.
Edited by:
Irfan Ullah, Nanjing University of Information Science and Technology, ChinaReviewed by:
Muhammad Haroon Shah, Wuxi University, ChinaCopyright © 2023 Xiao and Peng. This is an open-access article distributed under the terms of the Creative Commons Attribution License (CC BY). The use, distribution or reproduction in other forums is permitted, provided the original author(s) and the copyright owner(s) are credited and that the original publication in this journal is cited, in accordance with accepted academic practice. No use, distribution or reproduction is permitted which does not comply with these terms.
*Correspondence: Min Xiao, eGlhb21pbmhuQHNpbmEuY29t
Disclaimer: All claims expressed in this article are solely those of the authors and do not necessarily represent those of their affiliated organizations, or those of the publisher, the editors and the reviewers. Any product that may be evaluated in this article or claim that may be made by its manufacturer is not guaranteed or endorsed by the publisher.
Research integrity at Frontiers
Learn more about the work of our research integrity team to safeguard the quality of each article we publish.