
94% of researchers rate our articles as excellent or good
Learn more about the work of our research integrity team to safeguard the quality of each article we publish.
Find out more
ORIGINAL RESEARCH article
Front. Environ. Sci., 12 December 2022
Sec. Atmosphere and Climate
Volume 10 - 2022 | https://doi.org/10.3389/fenvs.2022.1094404
This article is part of the Research TopicClimate-Environment Interactions under Global WarmingView all 25 articles
 Liangke Liu1Xiaoye Zhang2
 Jizhi Wang2*Yuanqin Yang2
 Wenxing Jia2Junting Zhong2Xiaofe Jiang3
 Yaqiang Wang2
Focusing on the key air pollution regions in China by using hourly automatic weather data, ground-based and high-altitude meteorological sounding data, and near-surface O3 monitoring data, here, we try to quantify the relationship between boundary layer meteorological condition and near-surface O3 concentrations. The key meteorological element includes changes in solar zenith angle, cloud height, atmospheric condensation rate, and the associated change in the boundary layer height. We also try to better understand the mechanisms by which meteorological conditions affect near-surface O3 concentrations, and it is found that the exponential increase in near-surface O3 concentrations after sunrise (called the O3 concentration entrainment, EZ) is meaningfully associated with exceeding the threshold of a water vapor condensation rate (fc) that is often closely linked to a significant rise in the pollution boundary layer and that this proves to be diagnostically important for understanding the O3 EZ. Diurnal variations in solar zenith angle and boundary layer height are key meteorological factors influencing the large increase in near-surface O3 concentration entrainment.
• Threshold of fc for driving to the increments of O3 in the entrainment ozone (EZ) effect
• Combined spike of LCL and pollution mixing layers after sunrise favors the EZ effect
• Power exponential conversion is a favorable meteorological condition for O3 growth
With the continuous reduction of fine particle concentrations, the air quality during heavy pollution in winter has improved significantly; however, the heavy pollution events of ozone (O3) in summer have gradually increased, causing widespread concern among the scientific and technological community, government, and the public. It is well-known that O3 is driven by photochemical reactions triggered by both direct and indirect solar radiation. Nevertheless, in most cases, there is some uncertainty in the calculation of the chemical mechanism compared to the actual O3 observations. Based on the long-term observational data during 2015–2022 in three representative regions, namely, Beijing, Hangzhou, and Guangzhou, this study attempts to discuss the influence of meteorological conditions on O3.
In recent years, surface O3 pollution has tended to increase. Some progress has been made with regard to the effects of meteorological conditions on O3 concentrations near the ground (Andreas and Jochen, 2004).
With rapid economic growth, increase in O3 in the troposphere is an evident trend. Air quality observations in 74 cities of China, in recent years, linked the rise in regional O3 concentrations to weather and climate factors. Under global warming, a high O3 concentration in the lower atmosphere becomes a frequent event in the North China, Yangtze, and Pearl River deltas. In the summer of 2017, the air temperature was higher than normal across most of China. Under the persistent high temperature, O3 pollution occurred in north, northeast, and northwest of China from 17–19 July. Particularly, it lasted longer over Beijing. Based on the data from the Beijing Environmental Protection Monitoring Center starting from May 2017, O3 concentration began to increase from between 08:00 and 09:00 a.m. in the Beijing–Tianjin–Hebei region, and sometimes it continued to increase even till 12:00 p.m. lasting for about a month from 1 July, the primary pollutant over Beijing was O3. At 14:00 on 25 June 2022, the O3 concentration increased as high as 297 μg/m3, which has been achieving record O3 concentration in June for the past 10 years. The “excessively high O3 readings” became a new focus of concern. Some studies claimed that sometimes PM2.5 concentration decreases with increasing O3 concentration at the same time. Although this assertion has given some food for thought, it still lacks in-depth studies and common understanding.
Therefore, the commonality interaction of the influence of atmospheric physical processes and photochemical reactions on ozone has made some progress. Recently, some studies on the contribution of meteorological conditions to O3 concentration increase apart from chemical processes have been recognized. Using meteorological data from the period of June 2004 to July 2004 from the national park of the Tunisian coast, it is found that O3 concentration variation in summer is closely related to weather elements such as air temperature, rainfall, and wind over the coastal region. Their experimental study suggested that the local environment and meteorological conditions significantly influence temporal and spatial variations in O3 distribution (Mechergui et al., 2009). Alghamdi et al. investigated the effects of relevant meteorological variables on frequently high NO2 and O3 concentrations in the coastal cities of Saudi Arabia in 2012–2013. They discussed the influence of seasonal variations under meteorological conditions on the O3 concentration and indicated that O3 concentration values peak in the summer and drop in the winter (Andreas and Jochen 2004). In recent years, observations and calculations of heavy O3 pollution in Hangzhou in YRD, Guangzhou in PRD, Chengdu in Sichuan, and Beijing in the North China Plain have shown the importance of meteorological conditions (Wang and Chai, 2002; Li CH. et al., 2015; Li J. et al., 2015; Hu YT. et al., 2016). Using data from two observing stations in the vicinity of Hong Kong (the stations represent an inland area and an offshore sea.), Wang et al. conducted an observational study on the concentrations of major air pollutants and secondary substances (O3, NO, NO2, and SO2) on a synchronous basis.
On the basis of further studies of the composite PLAM (parameter linking air-quality to meteorological condition) index of meteorological conditions for O3 pollution and via observational data analyses, we focused on the contribution of meteorological conditions to O3 pollution in four pollution-sensitive areas: YRD, PRD, North China Plain, and Sichuan, which are frequently exposed to pollution caused by high O3 concentrations, and investigated their commonalities and influence mechanisms, and an objective description of the regional and seasonal condition was given. Recently, this study explored how meteorological conditions contributed to O3 pollution in all seasons on the basis of further studies of the PLAM index (Wang et al., 2019). Although some progress has been made in investigating the influences of meteorological conditions on air quality, in recent years, it remains in the qualitative analysis stage; model-based studies are found lacking in the objective description of the possible mechanism of meteorological contributions to O3 pollution. It is particularly noteworthy that the mechanism of the influence of atmospheric microphysical processes on near-ground ozone needs to be further explored. In recent years, it has been necessary to analyze and study the influence of high-resolution atmospheric detection information on ozone concentration.
In densely populated areas with rapid economic growth, many hydrocarbons and nitrogen oxides are emitted into the atmosphere. As a strong oxidizing agent, O3 plays an important role in several processes of atmospheric chemistry. There are many research findings about the mechanism of O3 genesis from the perspective of atmospheric chemistry, making much progress in this aspect. For example, previous reports have linked O3 to the decomposition and oxidation of organic compounds, oxidation of SO2, and transformation of NO2. However, when NO2 exists in the troposphere, it is easy to observe O3 genesis under certain atmospheric conditions (Webb and Steven, 1986). Although the impacts of clouds and aerosols on the climate have been studied for decades, it remains a complex and unsolved problem. The aerosol effect on enhancing cloud albedo is often called the first aerosol indirect effect. For climate patterns with uncertainties, the impact of atmospheric clouds is important because it is difficult to exclude the influence of different surface fluxes on turbulence dynamics, including the impact of cloud characteristics on the O3 concentrations; therefore, the influence of meteorological conditions on atmospheric surface O3 concentrations needs to be carefully studied and diagnosed (Wang and McFarquhar, 2008).
From the perspective of the traditional photochemistry-based description of O3 generation mechanism, it is well-known that O3 is driven by photochemical reactions initiated by solar radiation (for sure including direct and indirect solar radiation). Most studies with a relatively higher citation rate suggest that the discussions on photo-dissociation dynamics based on solar radiation and diurnal variation of the O3 peak value in the lower atmosphere are closely related to specific values of volatile organic compounds (VOCs) and nitrogen oxides (NOX). The solar radiation causes photo-dissociation of NO2, which is the initial reaction to form haze. A steady-state concentration of O3 is expressed as follows (Eq. 1) (Madronich and Flocke, 1999; Textor et al., 2006):
where j is the photolysis frequency of NO2, k is the rate coefficient for the NO reaction, and the brackets denote the concentrations of O3, NO2, and NO. The aforementioned relationship of NO, NO2, and O3 is called a steady-state relationship. Its dynamic equation is also given by Eq. 2 (Tang et al., 2006), which shows the solar radiation causes photo-dissociation of NO2, which is the initial reaction to form smog. Its dynamic equation is given also as follows (Tang et al., 2006):
Here, the basic photochemical cycle of NO2, NO, and O3 is the fundamental source for O3 genesis; k1 and k2 are the constants of transformation efficiency in chemical reactions;
Nevertheless, recent findings show that the observed concentration of O3 transformed from NO2 is much larger than that given in Eq. 2. This allows us to speculate that some other factors beyond photochemistry in the troposphere may contribute to the high O3 concentration.
As mentioned previously, the chemical mechanism of O3 is an approximation. Values j or k and α depend on molecular parameters (absorption cross sections and photo-dissociation quantum yields) that are specific to the photo-reaction of interest, and on the availability of solar radiation at any specific location in the atmosphere (Tang et al., 2006).
Therefore, influenced by solar radiation, the diurnal change of the atmosphere is one of the important characteristics of the influence of meteorological conditions on the spatio-temporal redistribution of aerosols. The effect of the diurnal change of the solar zenith angle on the O3 generation efficiency of light radiation in a specific region is the influence of the regional solar zenith angle diurnal meteorological conditions.
It is worth noting that Wallace and Hobbs proposed for the first time in their second edition of < Atmospheric Science > that during the destruction of the temperature inversion layer before and after sunrise, a consistency concept that the atmospheric lifting condensation level (LCL) variation in line with the height of the boundary layer (the height of the pollution mixing layer) can be increased rapidly as the solar zenith angle changes to a particular stage. They pointed out why it is closely related to the entrained O3 layer (EZ) and the height of this polluting mixed layer (Wallace and Hobbs, 2006; Wang et al., 2017). However, research and observational information in this area are very scarce.
The intensity of solar ultraviolet radiation, the atmospheric channel of sunlight, and especially the impact of near-surface atmospheric meteorological conditions are extremely important factors affecting the troposphere O3. When the solar zenith angle changes, the reflection path length of solar radiation passing through clouds with different structures naturally changes, which affects the O3 content in the atmosphere (Browning, 1973; Bohn et al., 2008). Changes in cloud structure and solar zenith angles have superimposed and feedback effects on O3 concentration. It not only drives the height change of the mixed pollution layer before and after sunrise but could also likely accompany the “EZ” process to further update the spatio-temporal distribution and change of O3 concentrations. However, there is also a lack of data and research on these aspects.
In this study, we aim to explore the relationship between cloud height, atmospheric condensation rate, and solar zenith angle change based on the analysis of high-resolution information and calculation and explore the height change of the mixed layer of atmospheric pollution and its influence on the distribution of the surface O3 concentration.
This study uses hourly resolution automatic weather station (AWS) data, ground and high-altitude observation data from the National Information Center (CMA) of the China Meteorological Administration, and atmospheric composition observations (http://www.zhb.gov.cn/hjzl/) of the Ministry of Ecology and Environment. In order to further study the spatio-temporal distribution of large-scale, persistent aerosol pollution, the parameters linking air-quality to meteorological conditions are discussed to indicate the spatial and temporal objective distribution of aerosol pollution (Wang et al., 2017). The parameters and calculation methods in this article are as follows.
Hu et al. pointed out that while planetary boundary layer (PBL) parameterization is critical for air quality studies, constrained air quality simulations by PBL parametric schemes are not well-quantified under heavy fog pollution boundary layer conditions (Hu M. et al., 2016).
Currently, the way the boundary layer describes the effects of air pollution can be easily copied and can be confusing. For example, the PBL usually refers to the large-scale Ekman dynamic boundary layer. The concept of the PBL is simply used to assess the characteristics of air pollution associated with the near-surface boundary layer that may not be rigorous enough. For the measurement of heavy haze pollution, one of the selected functions of the parameterization scheme is to determine whether the air mass at a specific location meets the wet static stable state of “high humidity” but “rain is difficult to form” (Wallace and Hobbs, 2006; Wang et al., 2017). According to the definition of the wet potential temperature θe in Eq. 3, when the property in a particular layer (expressed by P coordinate) of the atmosphere reaches saturation, the saturation mixing ratio is W (W=Ws). Since Rd/Cp (0.288) is a constant in Eq. 3, under this height of the particular layer (expressed by P), it is very conducive for the continuous mixing of pollution when the condensation function fc reaches the critical value of condensation. It should be noted that this is the threshold that needs to be captured, under the condition that the raindrops are yet to be formed.
That is, one of the functions of the air pollution meteorological conditions index is to indicate whether the local air masses are “stationary” with little variability. θe is an important parameter to characterize air mass properties (Holmboe et al., 1952; Yang et al., 1982):
where Cp, L, ws, and Rd are the meteorological parameters of specific heat with constant pressure, latent heat of water vapor condensation, saturation mixing ratio, and gas constant of the dry air, respectively.
The processes and structures of the atmospheric micro-scale flow field, condensation, and mechanisms of clouds and precipitation are intrinsically linked. Much progress has been achieved in these aspects associated with air pollution contributions, as well as the emission disturbance changes under different meteorological conditions (Gao and Zhou, 2005; Wang et al., 2012). When the fc reaches the critical value of condensation, but without raindrop formation, the atmosphere is very favorable for the continuation of pollution mixing, for the wetting of particles, and accelerating the formation of new particles for the generation of secondary pollution (Kulmala et al., 2004; Shen et al., 2016). At this time, it is necessary to pay attention to capturing “the threshold” related to humidity for a value that is high enough, but not too high. At this atmospheric layer height, the height of pollution mixing layer (H_PML), a precursor signal of air pollution, will appear (Wang et al., 2017).
where es is the saturation water vapor pressure, that is, the capturing and calculation of the precursory signal of atmospheric pollution mixing layer height.
Wallace and Hobbes proposed first in their second edition of < Atmospheric Science > that during the period before and after sunrise, destruction of the inversion layer due to warming of the strata near the atmosphere results in an increase in atmospheric lifting condensation levels (LCLs), which causes the height of the LCL and the boundary layer and the height of the pollution mixing layer to converge to the same height. The height of the pollution mixing layer increases rapidly again as the solar zenith angle changes. This illustrates why the efficiency of the EZ is closely related to the height of the contaminated mixed layer (Wallace and Hobbs, 2006; Wang et al., 2017).
Trousdell et al. (2016) pointed out that the photochemical productivity of O3 is closely related to the EZ rate of polluting mixed layers. EZ velocity is the parametric rate at which free tropospheric air is incorporated into the atmospheric boundary layer (ABL).
Zhang et al. (2005) discussed typical cases of heavy fog–haze processes and boundary layer characteristics in Beijing in 2001. The results showed that the threshold of condensation rate before and after the thick haze had a significant effect on the aerosol pollution of NO2 and SO2 concentration (see Figure 1).
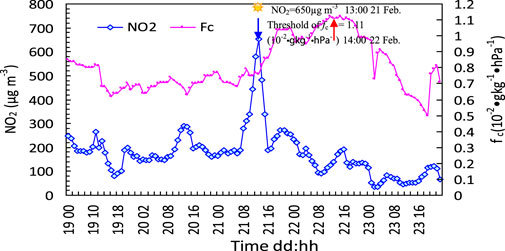
FIGURE 1. Evolution of the hourly condensation function fc and NO2 during the severe fog–haze process in Beijing in February 2001, “ ” represents the solar zenith angle for the local time (Zhang et al., 2005).
The threshold of condensation rate was captured by the decrease of NOx as the O3 precursor in the hourly resolution observations. As shown in Figure 1, from Beijing local time of 02:00 on February 20 to 08:00 on February 22 in 2001, after a period of continuous elevation of the fc for 48 h, severe haze appeared, and at 13:00 on 21 February 2002, when the solar zenith angle peaked, NO2 was as high as 650, and fc continued to increase to a threshold of up to 1.11. Subsequently, it quickly dropped to the lowest. This so called threshold value was high enough, but yet not too high (Zhang et al., 2005).
The expression of the condensation function (condensation rate) mentioned previously is given by Eq. 5 (Zhang et al., 2005):
where
where e and es are the water vapor pressure and saturated water vapor pressure, respectively. That is, for the nature of air quality, under the condition of large-scale processes, with “uniformity” and “static” (iso-θe), and associated with the microphysical process of atmospheric condensation described by the appropriate fc (threshold), the clouds, haze, and other weather conditions would occur differently. These parameters also coordinate with each other, creating a relationship of interdependence and mutual constraints (Wang et al., 2017). The studies have also suggested that the atmospheric condensation rate fc, as a wet driver of micro-meteorological conditions, can accelerate and catalyze O3 precursors to form secondary pollution. This power exponential conversion law describes changes in O3 concentrations due to special micro-scale meteorological processes that is given as (Wang et al., 2019)
χ represents the O3 precursor of NOx or VOCs, etc., ß is the condensation function (fc), and α ≈ 10.0×10³
Figure 2A shows the observed distribution of an hour-by-hour O3 in February 2022 and the hour-by-hour fluctuation in the pollution boundary layer height H_PML calculated by Eq. 4, and Figure 2B shows the observed distribution of hour-by-hour O3 and the amplified detailed distribution of the H_PML fluctuations of the pollution boundary layer in Figure 2A from February 10 to 11. Figure 2C shows a weather map of the surface at 14:00 (BJT) on February 11. The figures indicate that
1) there was a significant daily change in the H_PML (red line), that is, the H_PML increased during the day and decreased at night. The peaks of the diurnal variation corresponded to the peaks of the O3 concentration observed (green line).
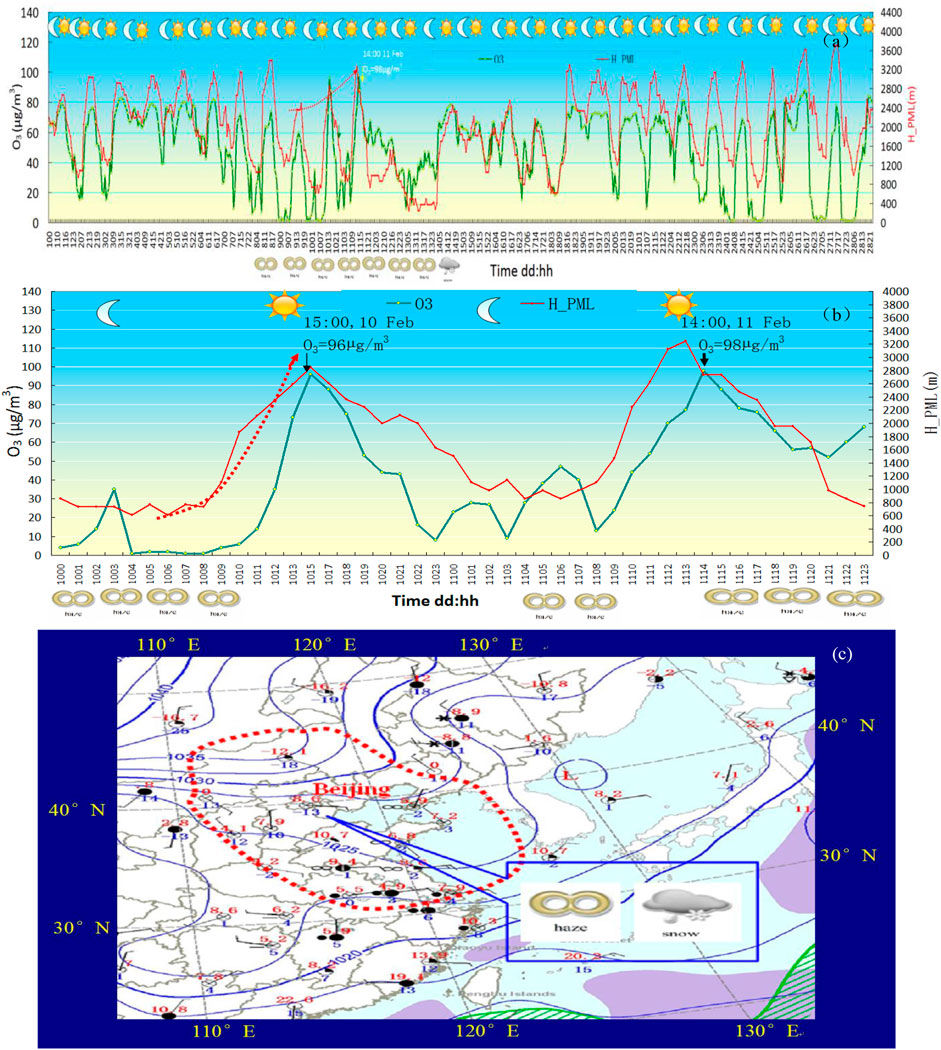
FIGURE 2. (A) Hour-by-hour O3 and H_PML changes in February 2022 in Beijing, (B) hour-by-hour detailed distribution of O3 and the height of H_PML fluctuations from December 10–11 in (A), and (C) ground weather map at 14:00 (BJT) on February 11 in Beijing.
As shown in Figure 2A, during the period February 10–15 and February 24–28, 2022, Beijing experienced two cases of smog (see the haze weather symbol at the bottom of Figure 2A), in which O3 and PM2.5 concentrations increased. There were two significantly polluted weather processes in February 2022 in Beijing, where the air quality dropped significantly. At 15:00 on 10 February 2022, an O3 concentration of 96 μg/m3 was observed, and at 14:00 on 11 February 2022, an O3 concentration of 98 μg/m3 was observed (see Figure 2B), and PM10 increased significantly. From February 8 to 13, the intermittent fog–haze weather in Beijing lasted for 120 h, and drifting snow was observed (large area of haze or snow weather occurred in and around Beijing) (see the surface weather map of Figure 2B). Beijing’s fog–haze, gloomy low-visibility conditions affected the official schedule of some of the Winter Olympics events. At that time, the schedule of some events, including the women’s U-shaped ski competition, was affected and got appropriately delayed.
2) In February 2022, in addition to the significant daily changes in the height of the boundary layer (H_PML), a long period of continuous increase was noted. For example, at 05:00 on 10 February 2022, the peak with the H_PML continued to increase from 2,400 m to 2,900 m till 15:00 on February 10. Also, from 05:00–14:00 on February 11, it increased again to 3,252 m (see the dotted line arrow in Figure 2A).
3) It can be seen from Figure 2B that from the afternoon to evening the pollution developed rapidly and the air quality dropped significantly. In Figure 2B, the detailed distribution of day-to-day fluctuations in the H_PML of the pollution boundary layer from February 10 to 11 can be seen, and pollution developed rapidly from afternoon to evening, deteriorating the air quality significantly. On February 10, at 15:00, the O3 concentration was observed to be 96 μg/m3, and from 0:00 to 10:00 on February 10, Beijing experienced continuous haze for 10 h. On February 11, from 4:00 to 23:00, the haze weather continued for nearly 20 h, the O3 concentration observed at 14:00 was 98 μg/m3 (see the weather symbol note at the bottom of Figure 2B and the haze weather symbol note at the bottom of Figure 2C, the ground weather map), the haze weather in Beijing and North China continued, and the sky conditions were obscure.
Studies indicated that during daytime over continents, when near-surface ozone (O3) usually peaks, the convective thermal energy generated by surface heating rises and penetrates into the stable layer, which divides the interface attachment between the turbulent atmospheric boundary layer (ABL), or the so-called pollution mixing layer (PML), and the free troposphere (FT) (its height is so-called LFC) above it. The continuous action of these heats permeates the laminar-covered air and falls back to the pollution boundary layer, producing an irreversible mixing process that causes the layer to grow with the layers of LFC, i.e., the H_PWL is consistent with the height of the free troposphere (LFC). The whole process is called entrainment. When the two layers contain different amounts of any scalar quantities (e.g., ozone concentration, water vapor, and entropy), this mixture is often an important contributor to scalar PWL budgets (Albrecht et al., 2016).
Lenschow et al. argued that calculating the change in mixed layer height (zi) before and after sunrise can derive the entrainment velocity of increasing O3, considering the relationship between the observed local ABL lifting rate and the average vertical velocity at the height of temperature inversion (Angevine, 1997; Lenschow et al., 1999). The aircraft-based study shows that ABL budgeting can help check regional emission rates and photochemical production rates. However, for the O3 budget, a detailed comparison with the photochemical model reveals the obvious weaknesses in the current model, including an indication about whether the difficulty lies in the kinetics (transmission) or in the chemical aspects of numerical work. Evaluation of detection accuracy and associated huge cost are also among the constraints. However, as Wallace et al. mentioned previously, during the destruction of the temperature inversion layer around sunrise, the LCL variation in line with the height of the boundary layer and the height of the pollution mixing layer increases rapidly with a change in the solar zenith angle. It is convenient and reasonable to calculate the height changes of this polluting mixed layer. Eq. 4 (for calculating the H_PML) can be used to link with the entrainment velocity of O3 growth. By using Eq.7, the increasing O3 driven by the threshold fc before and after sunrise can be calculated so that it can also be reasonable to calculate the EZ rate of polluting mixed layers, which is associated with the increased O3 concentration.
Figure 3A is a comprehensive analysis of an hour-based resolution of daily-evolution of O3 in the local time, as well as H_PML in February 2022 in Beijing, while Figure 3B shows the correlation between hourly O3 and H_PML in February 2022 in Beijing. From Figure 3, we can see the following:
1) in the winter of February 2022, the comprehensive correlation analysis of daily local-time hourly O3 and H_PML shows that as the change of the solar zenith angle has a remarkable and instant effect on the O3 concentration, H_PML increased from 2,500 m (positive anomaly 500 m, for average 2000 m) at 7:00 a.m. to 3,200 m (i.e., positive anomaly 1,200 m) at 12:00 noon (indicated by a blue dot in Figure 3A), with increase in the solar zenith angle during sunrise. Accordingly, O3 concentrations increased from 65 μg/m3 at 7:00 to 80 μg/m3 at 12:00 p.m. Peaks at nearly 100 μg/m3 were reached at 14:00 p.m. Such an O3 concentration value is not common in Beijing in February during winter. It was shown that the EZ effect contributed significantly to the increase in O3 concentrations with the sharp rise of the pollution mixing layer after sunrise.
2) Correlation analysis of H_PML and O3 concentrations in an hourly resolution in February (Figure 3B) shows that H_PML significantly positively correlated with O3 concentrations. The correlation coefficient (R2) was 0.44, which was significant at 0.001. A direct influence of the EZ effect on O3 concentrations was further confirmed by the sharp rise of the concomitant pollution mixing layer after sunrise (Figure 3A).
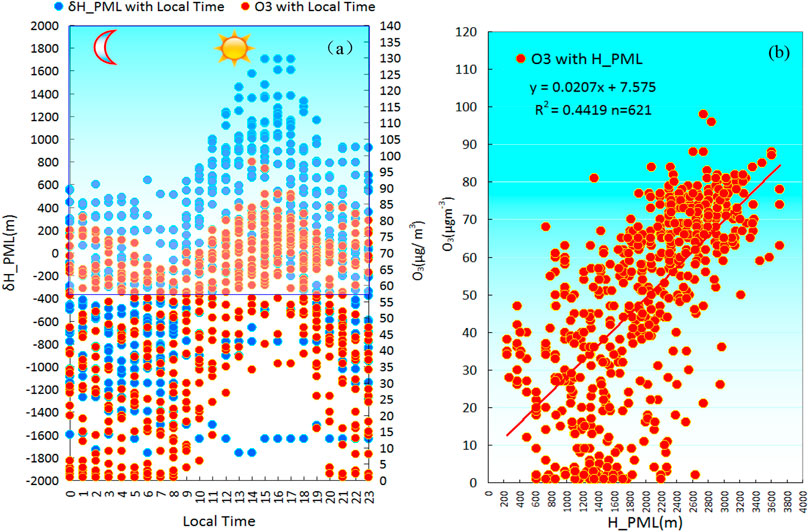
FIGURE 3. (A) Comprehensive analysis of O3 and δH_PML at hourly resolution in Beijing in February 2022, where the δH-PML is the anomaly labeled as the average value of 2000 m. (B) Analysis of O3 and H_PML with hourly resolution in Beijing in February 2022.
Figure 4A shows the hourly variations of O3 in June 2022 and the daytime fluctuations in the H_PML calculated by Eq. 4, as well as the hourly change in PM2.5. Figure 4B shows the comprehensive analysis between hourly O3 and δH_PML in June 2022 with the left ordinate being δH-PML, where the δH-PML is the anomaly labeled as the average value of 1000 m. Figure 4C is a correlation analysis of O3 and H_PML based on the hourly resolution in local time in June 2022. Figure 4 indicates that
1) the solar altitude angle changed considerably with local time daily in the summer of June 2022. O3 concentrations increased during the day and decreased at night.
2) For the typical month of heavy O3 pollution in summer, the relevant comprehensive analysis of the daily local-time hourly resolution of O3 and H_PML in June 2022 showed that the daily change of the solar zenith angle had a significant effect on the O3 concentration than those in winter. H_PML of 1,600 m at 7:00 a.m. (600 m for the positive anomaly, the average value is for 1,000 m) reached 4,200 m (namely, 3,200 m for the positive anomaly) at 12:00 noon (Figure 4A blue dot), which was 1,000 m higher than that in February, and it further rose to 4,800 m again after 3 h. During sunrise, with the change in the solar zenith angle, the height of the pollution mixing layer H_PML sharply increased, which was calculated according to Eq. 4.
3) Correspondingly, O3 concentrations increased from 150 μg/m3 at 7:00 a.m. to 220 μg/m3 at 12:00 p.m. A peak at nearly 300 μg/m3 was observed at 20:00 p.m. This O3 concentration value is rare, in recent years, in Beijing in June. It was shown that in summer, with the sharp rise of the pollution mixing layer after sunrise, the EZ effect contributed significantly to the increase in O3 concentrations.
4) Correlation analysis of H_PML and hourly O3 concentrations in June (Figure 4C) shows that H_PML significantly positively correlated with O3 concentrations. The correlation coefficient (R2) was 0.14, and it was significant at level 0.01. It is further confirmed that (Figures 4A,B) there is a sharp rise in the height of the sewage mixed layer after sunrise in summer.
5) The superimposed effect of the EZ contribution on the O3 concentrations, driven by the changes in the local solar zenith angle, is an important reason for the ultra-high O3 concentration in the summer of 2022. In Figure 4A, the increase in O3 concentration driven by the change in solar zenith angle is synchronized with the increase in O3 concentration due to the sharp rise in H_PML, and the proliferation of O3 concentration is superimposed during the second half of June. At 14:00 on June 24, at the peak moment of the solar zenith angle, the H_PML sharply rose to 3,861 m, and 24 h later, at 14:00 on June 25, the O3 concentration increased as high as 297 μg/m3, achieving the record high O3 concentration in June in the past 10 years.
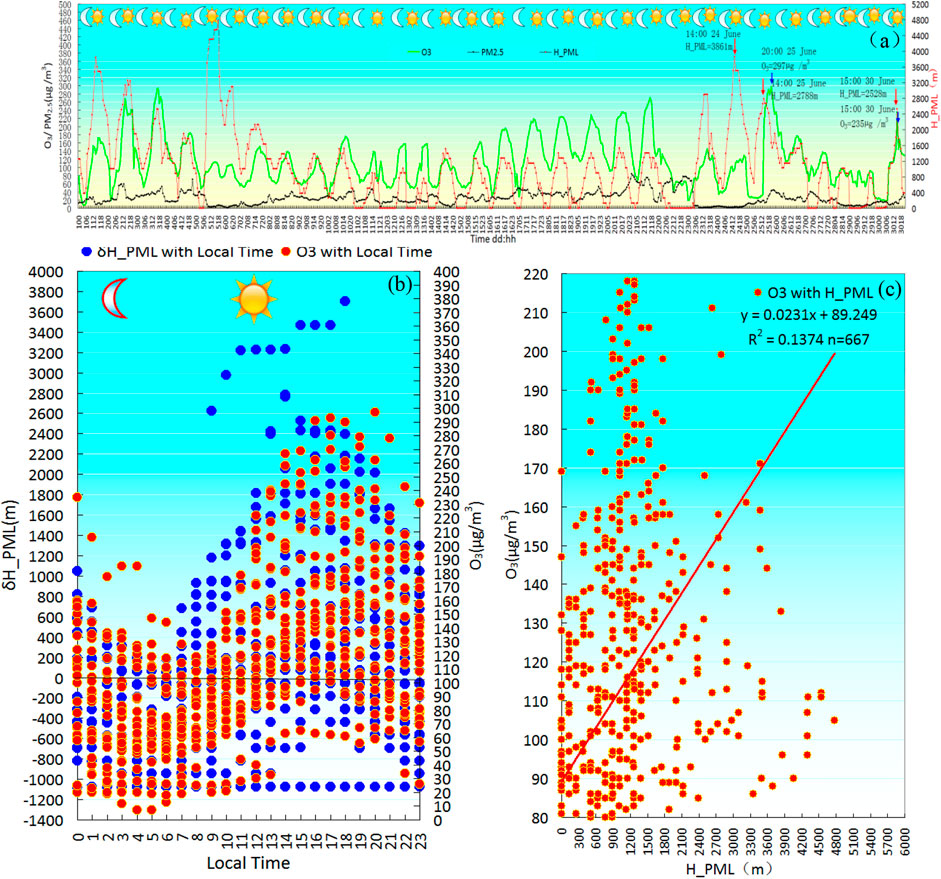
FIGURE 4. (A) Observed distribution of hour-by-hour O3 in June 2022 in Beijing and daytime fluctuations in the pollution boundary layer height H-PML calculated by Eq. 4, as well as hourly changes of PM2.5. (B) Comprehensive analysis of O3 and δH_PML at the local time of hourly resolution in June 2022 in Beijing, The ordinate (left) is for δH-PML, where the δH-PML is the anomaly labeled as the average value of 1000 m. (C) Correlation between the hourly O3 and H_PML in June 2022 in Beijing.
To explore the universal significance of the contribution of the EZ effect on the enhancement of O3 concentrations by solar zenith angle change to the height change of the pollution mixed layer, this section discusses the contribution characteristics of the EZ effect of each season at selected stations at Beijing, Hangzhou, Guangzhou, and Chengdu, which are representatives of the four typical polluted areas, i.e., North China, Yangtze River Delta, the Pearl River Delta, and Sichuan Basin. Figure 5A shows a comprehensive analysis of O3 and δNO2 in Beijing in February 2022 at local hourly resolution. The contents in Figures 5B–D are the same, showing haze in Guangzhou in the winter of 2015, Chengdu in December 2015, and the transition season (autumn) in Hangzhou in September 2015. Figure 5 shows
1) the mega-cities such as Beijing, Hangzhou, Guangzhou, and Chengdu are densely populated and are representative stations of typical areas of air pollution in China, including O3 pollution (Zhang et al., 2012). Figure 5 shows that the effects of the solar zenith angle diurnal changes to the height change of the pollution mixing layer on O3 concentration hyperplasia are common in these four typical areas. The red dot indicates the O3 concentration, and the high value appeared 3–5 h after the peak of the solar zenith angle.
2) O3 concentration as high as 100 μg/m3 in Beijing, North China, was observed in early spring and February, and in the typical winter of December 2015, O3 pollution was heavier in Chengdu Basin area, reaching 140 μg/m3 and in the Pearl River Delta reaching 90 μg/m3.
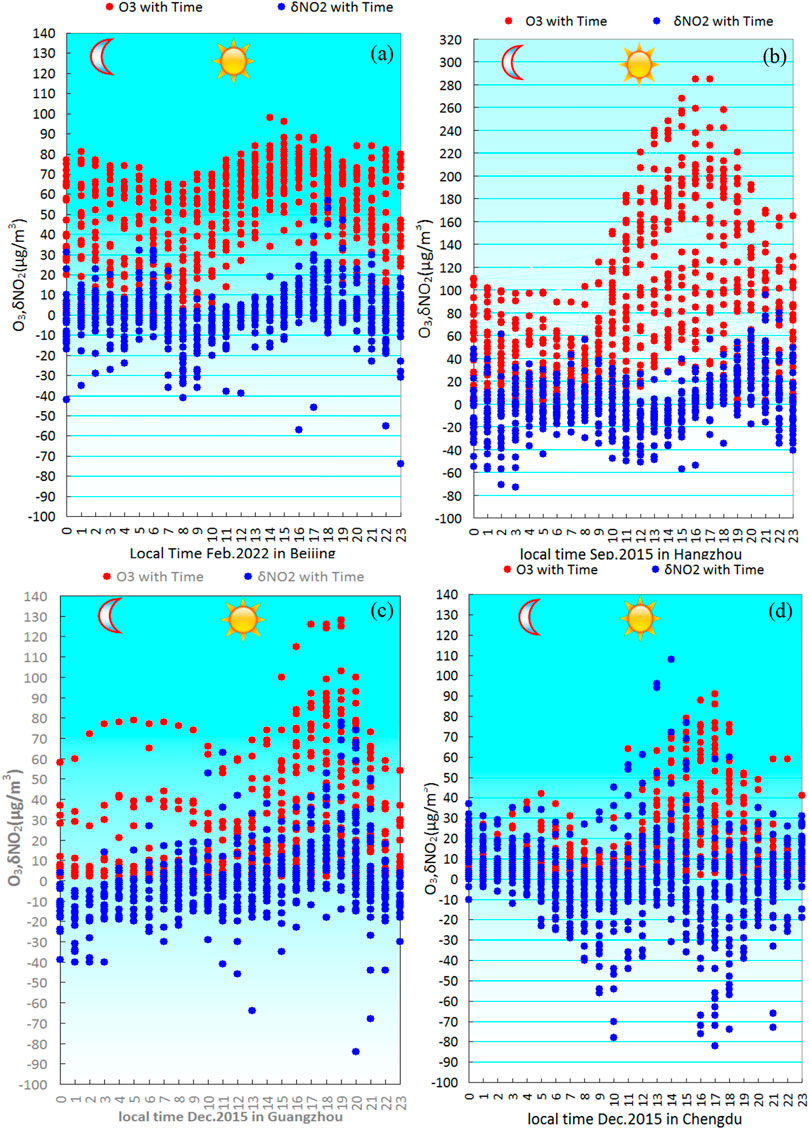
FIGURE 5. (A)Correlation comprehensive analysis of O3 and δNO2 in February 2022 hourly resolution local time in February 2022 in Beijing, (B) content is the same as (A), the place and time of the shift is Hangzhou, September 2015, (C) content is the same, but the place and time are Guangzhou, December 2015, and (D) content is the same as (A), the place and time are Chengdu in December 2015.
However, in the autumn, the concentration of O3 in the Hangzhou region of the Yangtze River Delta reached 300 μg/m3.
3) An important common feature during the temperature inversion at night is that as the NO2 concentration decreases, the O3 concentration gradually increases, and during the peak period of the solar zenith angle (at 12:00 local time), the temperature inversion is destroyed, the O3 jump is extremely rapid, and the peak of the O3 appears at 15:00–17:00 p.m. This explains the link between the high degree of the pollution mixing layer and the solar zenith angle change.
The contribution of EZ effect to the increase of O3 concentration due to the change of H_PML in the above-mentioned major impact regions of China (North China Plain, Yangtze River Delta, Pearl River Delta and Sichuan Basin), including the increase magnitude and lag time, is consistent with the variation of solar zenith angle. Thus, the meteorological impact has universal characteristics.
As mentioned previously, previous studies showed that solar radiation causes photo-dissociation of NO2. However, thorough understanding on how NO2 is influenced by meteorological conditions to generate O3, the power exponent law of NO2 conversion to O3, and the driving mechanism of the fc threshold is very important.
As given in Figure 5, an increase in O3 concentration is caused within a few hours after sunrise. According to an analysis of the meteorological conditions after sunrise, the initial decrease and subsequent increase in NO2 versus O3 concentration satisfy the law of exponent power rule, according to which seasonal and regional differences in coastal and inland areas depend on coefficients α and β (Wang et al., 2019).
As can be seen from the discussion in Sections 3.3 and 3.3.1, the power exponential increase in O3 concentration is due to the decrease of NO2 as a precursor, that is, the EZ effect that occurs near the boundary layer under the corresponding meteorological conditions. To further reveal the contribution mechanism of the EZ effect and explore the driving factors of meteorological condition, Figure 6A shows the correlation analysis of hourly O3 and pre-6 h NO2 concentration in February 2022 in Beijing, and Figure 6B shows the correlation analysis between hourly O3 and fc in February 2022 in Beijing. Figure 6 shows the following:
1) Figure 6A shows that February is the winter representative month. As an O3 precursor, NO2 showed a significant power exponent negative correlation with O3 concentration, and the correlation coefficient (R2) reached 0.33, with a significance level exceeding 0.001, that is, the low value of NO2 corresponded to the increase in O3 concentrations after 6 h, which coincides with the period of rise in the height of the mixed layer after sunrise (Figure 6). This implies that the EZ value-added effect is closely related to the exponential increase of O3 supported by the reduction of NO2 concentrations.
2) The correlation analysis of the February 2022 hourly resolution O3 and the fc observed synchronously (Figure 6B) shows that O3 increase and fc positively correlated with the e-exponent, with correlation coefficient (R2) 0.15, and significance level exceeding 0.01. The threshold (lowest value) of the fc was 0.7, which coincides with the increase in the O3 concentration as calculated in Figure 6A, and the decrease in the concentration of the precursor NO2, whose power exponent value was 0.73. Comparison of Figures 6A,B shows that, the threshold of fc 0.7 is the key value of the O3 precursor NO2 to the O3 concentration, that is, to support the value-added EZ effects.
3) As shown in Figure 6C, June is the summer representative month. It is well-known that summer is characterized by a high value of O3 concentrations everywhere. In June 2022 in Beijing, the O3 precursor NO2 was still inextricably bound to the O3 concentration, the correlation coefficient (R2) was 0.05, and the level of significance was lower than that in winter. The period of increase in the height of its mixed layer after sunrise also appeared consistently after 6 h. This shows that in summer, even if the O3 concentration increases considerably, the value-added effect of EZ and the power-exponential growth law of O3 supported by the reduction of NO2 concentration still have distinct consistent characteristics.
4) As shown in Figure 6D, the threshold (lowest value) of the fc in June was 1.85, which is more consistent with the increase in the O3 concentration calculated in Figure 6C and the decrease in the concentration of the precursor NO2, and its power exponent value of 0.21 is also more consistent. It shows that the summer threshold of fc was 1.85 in the hot, high-temperature, and high-humidity summer in Beijing, which is the key value of the O3 precursor NO2 to the O3 concentration and supports the value-added effect of EZ.
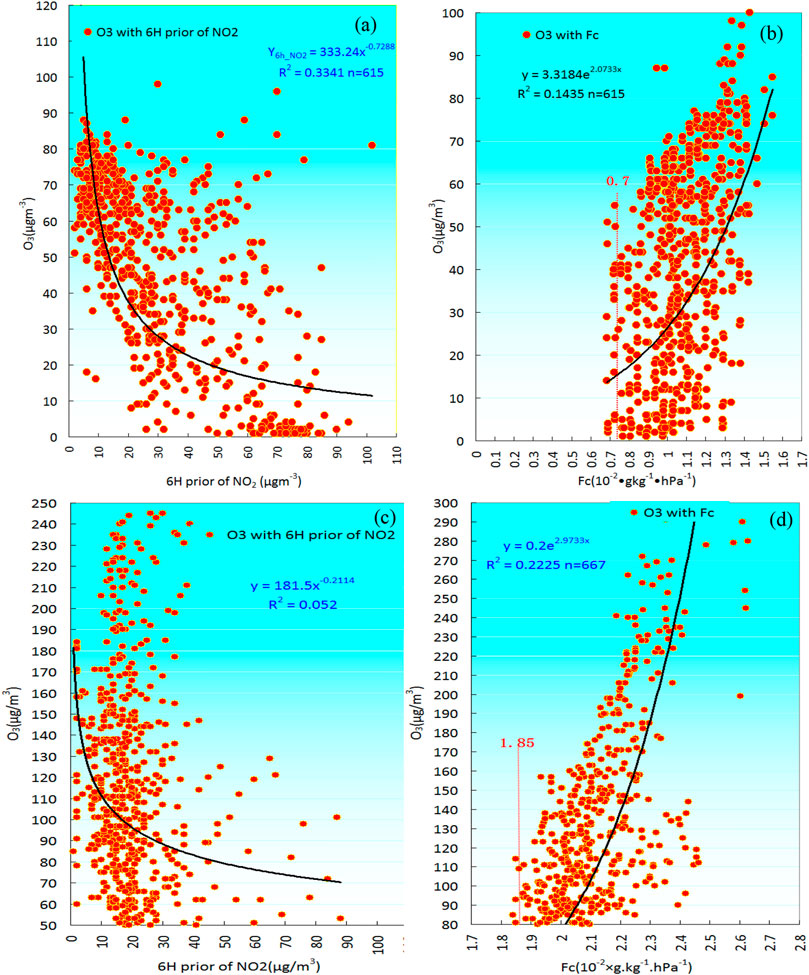
FIGURE 6. (A) Correlation analysis of the hourly resolution O3 and NO2 before 6H in Beijing in February 2022, (B) correlation analysis between the hourly resolution O3 and condensation function (fc) in February 2022, (C) content is the same as (A), but the time is June 2022 in Beijing, and (D) content is the same as (B), but the time is June 2022 in Beijing.
Comparative analysis of winter and summer confirmed that the contribution of O3 precursor NO2 to the power-exponential increase of the O3 concentration, as well as the fc threshold of the adhesion function of the pollution boundary layer, were of great significance in supporting the value-added effect of EZ (Figures 6, 7).
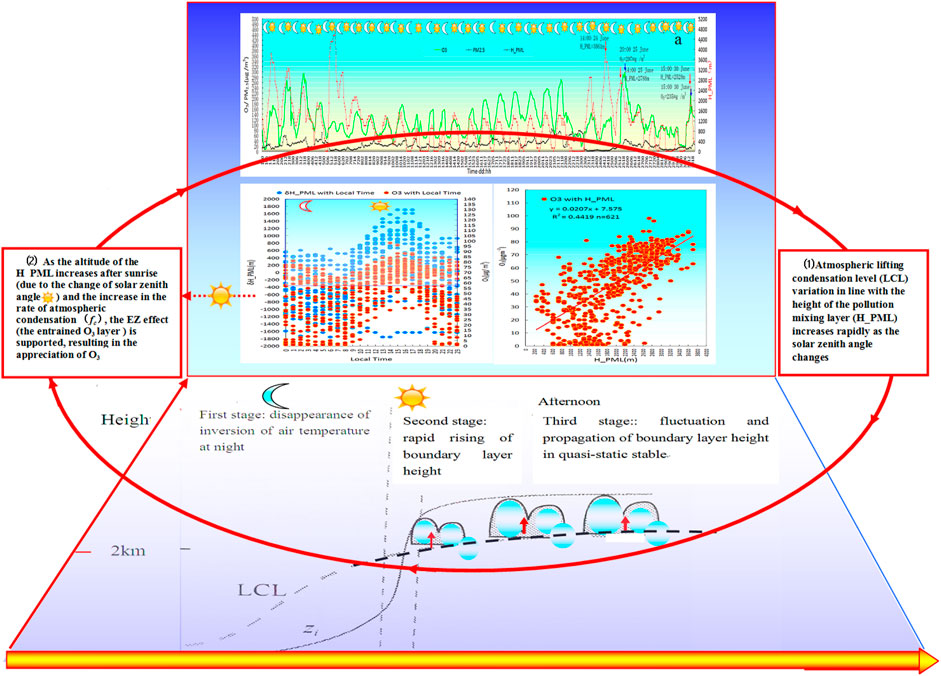
FIGURE 7. Comprehensive physical images of key meteorological factors affecting large increases in the near-surface O3 concentration entrainment (O3 EZ) due to variations in solar zenith angle and boundary layer height serve.
The preliminary findings of the current study are as follows.
In this study, the relationships among cloud height and atmospheric condensation rate and solar zenith angle change were discussed by the analysis of information based on the hourly resolution and calculation, and the height change of the mixed layer of atmospheric pollution and its influence on the distribution of the tropospheric O3 concentration was explored.
1) The results showed that the contribution of O3 precursor NO2 to the power-exponential growth of the O3 concentration is driven by the threshold of fc growth, due to the lifting of the pollution boundary layer, which has a significant impact on the value-added effect of supporting the EZ.
2) The local day–day cycle change of the height (H_PML) of the atmospheric low-altitude pollution mixing layer and the change during the solar zenith angle contributed significantly to the sharp increase in the surface O3 concentration. This is the process of photochemical O3 generation and the cross-effect with the influence of meteorological conditions, resulting in an increase in O3 concentrations.
3) Another finding of this study provided insight about the development and mechanism of the increase in O3 concentrations, that is, with the sharp increase in the height of the pollution mixing layer after sunrise, the contribution of the EZ effect (the entrained O3 layer) to O3 deposition is actually driven by the high condensation rate (fc) threshold, which helps the humidification process of O3 precursors (NOx), resulting in an enhanced O3 concentration by the power-exponent law. As shown in the graphical abstract, the process can be summarized as follows: ① atmospheric lifting condensation level (LCL) variation in line with the height of the pollution mixing layer (H_PML) increases rapidly as the solar zenith angle changes. ② As the height of the H_PML increases after sunrise (due to the change of solar zenith angle) and the increase in the rate of atmospheric condensation fc, the EZ effect is supported, resulting in the appreciation of O3.
4) The analysis of information during spring, summer, autumn, and winter seasons of the representative stations of Beijing, Hangzhou, Guangzhou, and Sichuan Basin in China further confirmed that with the daytime change of the solar zenith angle, the effect of the micro-physical processes (including the condensation rate threshold drive and the EZ effect) near the pollution mixed-boundary layer (H_PML) on the O3 concentration increases, thereby indicating its universal significance.
The original contributions presented in the study are included in the article/Supplementary Material; further inquiries can be directed to the corresponding author.
LL, XZ, and JW designed the research and led the overall scientific questions. YY, WJ, and JZ carried out data processing and analysis. YW and XJ assisted in program and software designing. LL and XZ wrote the first draft of the manuscript, which was revised by JW and XJ. All authors read and approved the final version.
This research was supported by the Major Project from Natural Science Foundation of China (42090031).
The authors declare that the research was conducted in the absence of any commercial or financial relationships that could be construed as a potential conflict of interest.
All claims expressed in this article are solely those of the authors and do not necessarily represent those of their affiliated organizations, or those of the publisher, the editors, and the reviewers. Any product that may be evaluated in this article, or claim that may be made by its manufacturer, is not guaranteed or endorsed by the publisher.
Albrecht, B., Fang, M., and Ghate, V. (2016). Exploring stratocumulus cloud-top entrainment processes and parameterizations by using Doppler cloud radar observations. J. Atmos. Sci. 73, 729–742. doi:10.1175/jas-d-15-0147.1
Andreas, G., and Jochen, S. (2004). Vertical profiles of NO3, N2O5, O3, and Nox in the nocturnal boundary layer2. Model studies on the altitude dependence of composition and chemistry. J. Geophys. Res. 109, D12307. doi:10.1029/2003jd004211
Angevine, W. (1997). MErrors in mean vertical velocities measured by boundary layer wind profilers. J. Atmos.Ocean. Tech. 14, 565–569.
Bohn, B., Corlett, G. K., Gillmann, M., Sanghavi, S., Stange, G., Tensing, E., et al. (2008). Photolysis frequency measurement techniques: Results of a comparison within the ACCENT project. Atmos. Chem. Phys. 8, 5373–5391. doi:10.5194/acp-8-5373-2008
Browning, K. A., Hardman, M. E., Harrold, T. W., and Pardoe, C. W. (1973). The structure of rainbands within a mid-latitude depression. Q. J. R. Meteorol. Soc. 99, 215–231. doi:10.1002/qj.49709942002
Gao, S. T., and Zhou, Y. S. (2005). Analyses on warm and humid weather in summer in Beijing and its dynamical identification. Sci. China 48, 128–137.
Holmboe, J., Forsythe, G. E., and Gustin, W. (1952). Dynamic meteorology. London: Chapman and Hall limited, 363.
Hu, M., Huang, J., Fuentes, J. D., Forkel, R., and Zhang, N. (2016a). Advances in boundary-layer/air pollution meteorology. Adv. Meteorology 1, 1–2. doi:10.1155/2016/2825019
Hu, Y. T., Zhao, P., Niu, J. F., Sun, Z. W., Zhu, L. W., and Ni, G. Y. (2016b). Canopy stomatal uptake of NOX, SO2 and O3 by mature urban plantations based on sap flow measurement. Atmos. Environ. 125, 165–177. doi:10.1016/j.atmosenv.2015.11.019
Kulmala, M., Vehkamäki, H., Petäjä, T., Dal, M., Lauri, M., and Kerminen, A., (2004). Formation and growth rates of ultrafine atmospheric particles: A review of observations. J. Aerosol Sci. 35 (2), 143–176. doi:10.1016/j.jaerosci.2003.10.003
Lenschow, D. H., Paluch, I. R., Bandy, A. R., Thornton, D. C., Blake, D. R., and Simpson, I. (1999). Use of a mixed-layer model to estimate dimethylsulfide flux and application to other trace gas fluxes. J. Geophys. Res. 104, 16275–16295. doi:10.1029/1998jd100090
Li, C. H., Meng, J., Guo, L. Y., and Jiang, G. M. (2015a). Effects of ozone pollution on yield and quality of winter wheat under flaxseed competition November 2015. Environ. Exp. Bot., 129–139.
Li, J., Chen, H. B., Li, Z. Q., Wang, P., Cribb, M., and Fan, X. (2015b). Low-level temperature inversions and their effect on aerosol condensation nuclei concentrations under different large-scale synoptic circulations. Adv. Atmos. Sci. 32, 898–908. doi:10.1007/s00376-014-4150-z
Madronich, S., and Flocke, S. (1999). “The role of solar radiation in atmospheric chemistry,” in The handbook of environmental chemistry (reactions and processes).
Mechergui, R., BenMansoura, A., Laffray, X., Albouchi, A., Akrimi, N., and Garrec, J. P. (2009). Ozone level assessment on the boukornine national park (Tunisia) using plant biomonitoring: Influence of altitudinal parameter and meteorological conditions. Water Air Soil Pollut. 204, 285–297. doi:10.1007/s11270-009-0045-5
Shen, X. J., Sj, Y., Zhang, X. Y., Zhang, Y. M., Zhang, L., and Fan, R. X. (2016). Key features of new particle formation events at background sites in China and their influence on cloud condensation nuclei. Front. Environ. Sci. Eng. 10 (5), 5–016. doi:10.1007/s11783-016-0833-2
Tang, X. Y., Zhang, Y. H., and Shao, M. B. H. E. P. (2006). Atmospheric environmental chemistry, 214–222.
Textor, C., Schulz, M., Guibert, S., Kinne, S., Balkanski, Y., Bauer, S., et al. (2006). Analysis and quantification of the diversities of aerosol life cycles within AeroCom. Atmos. Chem. Phys. 6, 1777–1813. doi:10.5194/acp-6-1777-2006
Trousdell, J. F., Conley, S. A., Post, A., and Faloona, I. C. (2016). Observing entrainment mixing, photochemical ozone production, and regional methane emissions by aircraft using a simple mixed-layer framework. Atmos. Chem. Phys. 16, 15433–15450. doi:10.5194/acp-16-15433-2016
Wang, H. L., and McFarquhar, G. M. (2008). Modeling aerosol effects on shallow cumulus convection under various meteorological conditions observed over the Indian Ocean and implications for development of mass-flux parameterizations for climate models. J. Geophys. Res. 113, D20201. doi:10.1029/2008jd009914
Wang, J. Z., Gong, S., Zhang, X. Y., Yang, Y. Q., Hou, Q., Zhou, C. H., et al. (2012). A parameterized method for air-quality diagnosis and its applications. Adv. Meteorology 2012, 1–10. doi:10.1155/2012/238589
Wang, J. Z., Yang, Y. Q., Zhang, X. Y., Liu, H., Che, H., Shen, X., et al. (2017). On the influence of atmospheric super-saturation layer on China's heavy haze-fog events. Atmos. Environ. 171, 261–271. doi:10.1016/j.atmosenv.2017.10.034
Wang, J. Z., Yang, Y. Q., Zhang, Y. M., Niu, T., Jiang, X. F., Wang, Y. Q., et al. (2019). Influence of meteorological conditions on explosive increase in O3 concentration in troposphere. Sci. Total Environ. 652, 1228–1241. doi:10.1016/j.scitotenv.2018.10.228
Wang, S. L., and Chai, F. H. (2002). A study on O3 pollutions in Beijing. Geo-Science (in Chin. 22, 360–364.
Webb, A. R., and Steven, M. D. (1986). Daily totals of solar UVB radiation estimated from routine meteorological measurements. J. Climatol. 6, 405–411. doi:10.1002/joc.3370060406
Yang, D. S., Liu, Y. B., and Liu, S. K. (1982). Dynamics of meteorology. 2th ed., 297–359. Chapter 2.
Zhang, G. Z., Bian, G., Wang, J. Z., and Yang, Y. Q. (2005). The boundary layer chracteristics in the heavy fog formation process over Beijing adjacent areas. Sci. China 48, 88–101.
Keywords: entrainment ozone (EZ) effect, solar zenith angle changes, height of pollution mixing layer (H_PML), O3 growth by power exponential law, the conversion of precursor of O3
Citation: Liu L, Zhang X, Wang J, Yang Y, Jia W, Zhong J, Jiang X and Wang Y (2022) Changes in the height of the pollution boundary layer and their meteorological effects on the distribution of surface ozone concentrations. Front. Environ. Sci. 10:1094404. doi: 10.3389/fenvs.2022.1094404
Received: 10 November 2022; Accepted: 24 November 2022;
Published: 12 December 2022.
Edited by:
Zhiyuan Hu, School of atmospheric sciences, Sun Yat-sen University, ChinaReviewed by:
Wei Han, CMA Earth System Modeling and Prediction Center, ChinaCopyright © 2022 Liu, Zhang, Wang, Yang, Jia, Zhong, Jiang and Wang. This is an open-access article distributed under the terms of the Creative Commons Attribution License (CC BY). The use, distribution or reproduction in other forums is permitted, provided the original author(s) and the copyright owner(s) are credited and that the original publication in this journal is cited, in accordance with accepted academic practice. No use, distribution or reproduction is permitted which does not comply with these terms.
*Correspondence: Jizhi Wang, anp3YW5nQGNtYS5nb3YuY24=
Disclaimer: All claims expressed in this article are solely those of the authors and do not necessarily represent those of their affiliated organizations, or those of the publisher, the editors and the reviewers. Any product that may be evaluated in this article or claim that may be made by its manufacturer is not guaranteed or endorsed by the publisher.
Research integrity at Frontiers
Learn more about the work of our research integrity team to safeguard the quality of each article we publish.