 Xue Ao
 Qingfei Zhai2*
94% of researchers rate our articles as excellent or good
Learn more about the work of our research integrity team to safeguard the quality of each article we publish.
Find out more
ORIGINAL RESEARCH article
Front. Environ. Sci., 16 January 2023
Sec. Atmosphere and Climate
Volume 10 - 2022 | https://doi.org/10.3389/fenvs.2022.1094169
This article is part of the Research TopicClimate-Environment Interactions under Global WarmingView all 25 articles
Based on the hourly temperature and precipitation data from China national meteorological stations and regional automatic weather stations in Shenyang, the relationship between extreme hourly precipitation (ExHP) and urban heat island Intensity (UHII) is analyzed. Results show that the UHII is higher at night and in the early morning. The ExHP events mostly occur at night in summer when the UHII is relatively high. The spatial distribution of UHII in Shenyang is consistent with the economic development and the transportation density. Denser population and transportation, and high-rise buildings in the urban center contribute to higher UHII. There are three types of ExHP, namely the abrupt-type ExHP, the growing-type ExHP and the continuous-type ExHP. The overall variation characteristics of the three types of ExHP are relatively consistent. Their UHII values are positive and relatively stable in 6–12 h before the start of ExHP. The UHII begins to increase dramatically about 6 h before the ExHP, but decreases obviously and turn negative after the precipitation begins. Before the abrupt ExHP, the UHII is relatively high and can rapidly return to positive after the ending of ExHP. The UHII of the abrupt-type ExHP is remarkably larger than that of the growing-type and continuous-type ExHP. The UHII before and after the abrupt-type ExHP differs greatly. Before the abrupt ExHP, the UHII is high in the center and low at both ends, and the high-value areas of UHII are mainly located in the urban area. After the abrupt-type EXHP, the UHII drops and turn negative in the whole area. The UHII is obviously increasing with urbanization. The diurnal variation of UHII is enormous, which is higher at night than during the daytime. The increasing UHII can cause abnormal air pressure in cities and villages. The air in the lower atmospheric layer of the city can be heated and expanded, hence resulting in lower local air pressure. Then, the lower air pressure can promote the convergence and upward movement of air, hence facilitating the establishment of UHII circulation. This phenomenon is particularly distinct at night, which is conducive to the occurrence of ExHP events.
In the context of global warming, extreme weather and climate events such as heavy rainfall, high temperatures and typhoons occur frequently. As an important part of the earth ecosystem, city has a growing impact on climate change and ecological environment. The urbanization in China is accelerating with the development of human society. The urbanization has not only changed the underlying surface of the city, but also produced a large number of pollutants and anthropogenic heat. It leads to the change of near-surface atmospheric structure, forming a local climate dominated by urbanization (Seaman et al., 1989). Shenyang City is severely impacted by climate change, and its warming rate is much higher than the global and Chinese averages. Its urbanization level and development speed have always been among the best in China. By the end of 2010, the resident population of Shenyang reached 8.106 million, including 6.24 million urban population, and the urbanization rate reached 77%. By the end of 2015, its urbanization rate increased to 80.55%, 13.2% higher than the average in China. By the end of 2020, the urbanization rate exceeded 85% (Statistical Center of Liaoning, 2021). The most obvious climate feature brought about by rapid urbanization is the enhancement of the urban heat island (UHI) effect, which leads to frequent extreme climate events and increases the vulnerability of the urban ecological environment. Therefore, it is of great significance to analyze the relationship between the variation of urban regional precipitation.
As early as in the 19th century, the possible impact of urbanization on precipitation was raised. In 1968, Changnon (1968) proposed to launch and implement the Metropolitan Meteorological Experiment (1976) and found that the impact of urbanization on precipitation mainly manifests in much more precipitation in its downwind area than in other areas. Based on the long-term precipitation data of the City of Saint Louis in the United States, Huff et al. (1972) found that the precipitation frequency over the city and its downwind area is much higher than that in the surrounding non-urban areas, especially in summer, and this phenomenon shows a trend of enhancement with urbanization. Based on the analysis of the observation data and numerical simulation in the Metropolitan Meteorological Experiment, Changnon et al. (1976; 1978; 1979; 1991) pointed out that the precipitation enhancement of urbanization on the convective precipitation with moderate or higher intensity in summer is particularly obvious, and they put forward three hypothetical mechanisms for urbanization to enhance precipitation and affect its distribution. The first mechanism is the UHI effect; the second is the friction effect of the urban underlying surface and canopy; the third is the urban condensation nuclear effect.
Daniel (2000) suggested that urbanization and industrial pollution will increase rainfall and snowfall in downwind areas. Jong et al. (2001) applied a numerical model to simulate the impact of UHII on precipitation and found a high-value precipitation center in the downwind area of the city. Yang et al. (2013; 2017; 2019) revealed that the short-term heavy precipitation has an increasing trend in recent years, which is closely related to the UHII. Wu et al. (2019) analyzed the relationship between extreme hourly precipitation (ExHP) and urbanization in the coastal areas of South China. They indicated that the strong UHII should largely enhance precipitation, especially in the inland areas of urban agglomerations with an evident UHI effect. Dou et al. (2015) showed that when the UHI effect is weak in summer, the convective systems are mainly blocked by buildings and they flow around the buildings, so there is a negative-anomaly center of precipitation in the city center and positive-anomaly centers on both sides of the city and downstream areas. Conversely, when the UHI effect is strong the thermal effect of the city stimulates or strengthens the convective system, thus causing the positive-anomaly center of precipitation in the city center.
Past studies have revealed the impact of urbanization on precipitation at different spatial and temporal scales from different perspectives. Nevertheless, most studies have analyzed precipitation processes at temporal scales longer than daily scale. There are few studies on precipitation processes at the hourly scale. Besides, past studies mainly focused on developed countries, or the Yangtze River Delta and Beijing-Tianjin-Hebei area of China, while those on the urbanization effect in Shenyang are rarely-seen, especially the urbanization impact on the ExHP of Shenyang.
In this study, the night light data, socio-economic data, urban area data and other multi-source data are used to extract the urban threshold and select the urban stations and rural stations. Based on the hourly temperature and precipitation data from national meteorological stations during 1974–2020 and from regional automatic weather stations during 2005–2020 in Shenyang, the spatio-temporal variation characteristics of UHII in Shenyang are analyzed by the urban-rural comparison method. Moreover, the relationship between ExHP and UHII is revealed, and the causes of ExHP are discussed. The conclusions have important scientific reference value for reducing the UHI effect, mitigating urban waterlogging and promoting rational urban planning. Meanwhile, it also provides a demonstration for global urban regional disaster prevention and mitigation and sustainable development.
Shenyang is a high-density mega city covering about 1.3 million square kilometers, which is located in the central part of Liaoning Province of Northeast China. The rainfalls in Shenyang are mainly concentrated in summer. Shenyang has a larger temperature difference and obvious seasonal characteristics including hot-humid summer and cold-dry winter. Shenyang includes Liaozhong District, Xinmin City, Faku County, Kangping County and the municipal district of Shenyang. Because of urban expansion, population and economic in Shenyang grow rapidly, over half of the population lives in the municipal district of Shenyang. Sub-regions of Shenyang present different urbanization patterns with the varied densities of city population and buildings as well.
This study includes five types of research data (Table 1). First, the hourly temperature and precipitation data have been applied to fix artificial error by quality control procedures such as consistency tests and climatic extreme value. The data of seven national meteorological stations are long-term continuous, and the data of 237 regional automatic weather stations are effective supplement to the data of national station (Figure 1). Second, the nighttime light data are developed specifically for the geographical characteristics of Asia, eliminating the interference of light saturation and provided convenient conditions for the analysis of urban heat island intensity in Asia (Su et al., 2011). Third, The Liaoning Statistics Yearbook records the urban land area of each city in detail for each year (Statistical Center of Liaoning, 2021). Fourth, the gross domestic product (GDP) data reflect the detailed spatial distribution of GDP in Liaoning Province, which are 1 km raster data, and each raster represents the total GDP output value within the grid range (1 square kilometer). Fifth, the spatial analysis function of geographic information system is used to construct the spatial distribution model of population, so as to generate 1 km × 1 km spatial population density data.
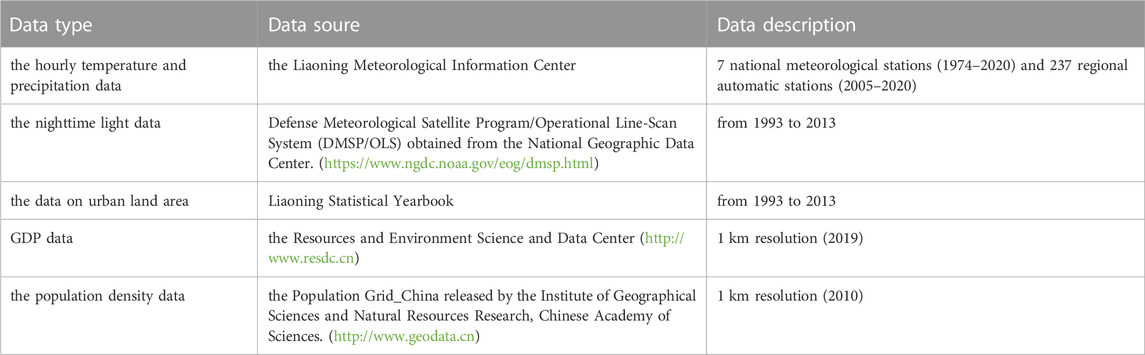
TABLE 1. Data used to analyze the relationship between extreme hourly precipitation and urban heat island.
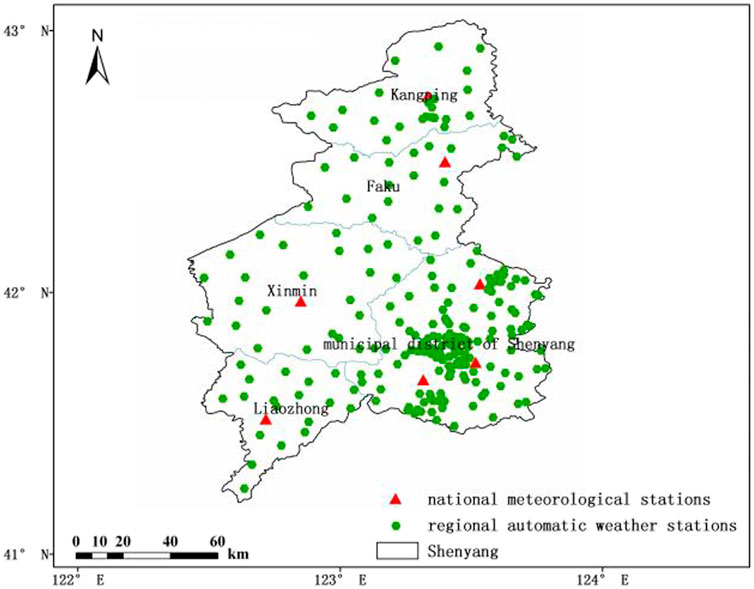
FIGURE 1. The spatial distribution of national meteorological stations and regional automatic weather stations in Shenyang.
By comparing with the statistical data, the spatial information of urban land-use in Liaoning Province is extracted based on the DMSP/OLS nighttime light data (He et al., 2006; Su et al., 2011; Ao et al., 2020a). This method is mainly based on the following two basic assumptions to extract the information. First of all, The urban land area of Shenyang extracted from DMSP/OLS data should be close to the statistical yearbook data as far as possible, because the real urban land area of Shenyang can be accurately reflected in it; Next, since the 1990s, the urban land area of Shenyang has been increasing continuously, and the urban grid points will not be reduced, which can be retained from the previous period to the next period. Based on these two assumptions, different dynamic thresholds of Shenyang were set, and the dichotomous method was adopted to constantly change the thresholds, and we calculated the urban area under each dynamic threshold. The calculated results were compared with the statistical yearbook, and the threshold value was the best one for Shenyang until the urban area value calculated by using the satellite nighttime light data was close enough to the statistical yearbook. After the optimal threshold is determined, we calculated the average value of the gray value of night light within the radius of 7 KM of each site. We considered this station to be a city station if the calculated value is greater than the threshold value (Ao et al., 2020b; Ao et al., 2022).
We found the gray value of Shenyang and some areas of Liaozhong increased from 1993 to 2003 from DMSP/OLS satellite nighttime light gray value spatial distribution map, and urbanization was obvious (Figure 2). We also found that the urbanization process of Kangping County, Faku County and Xinmin City was relatively weak combined with the data of population density and land average GDP (Figure 3). So we selected the national meteorological stations and regional automatic stations in Shenyang and Liaozhong to represent urban stations, the remaining stations represent rural stations.
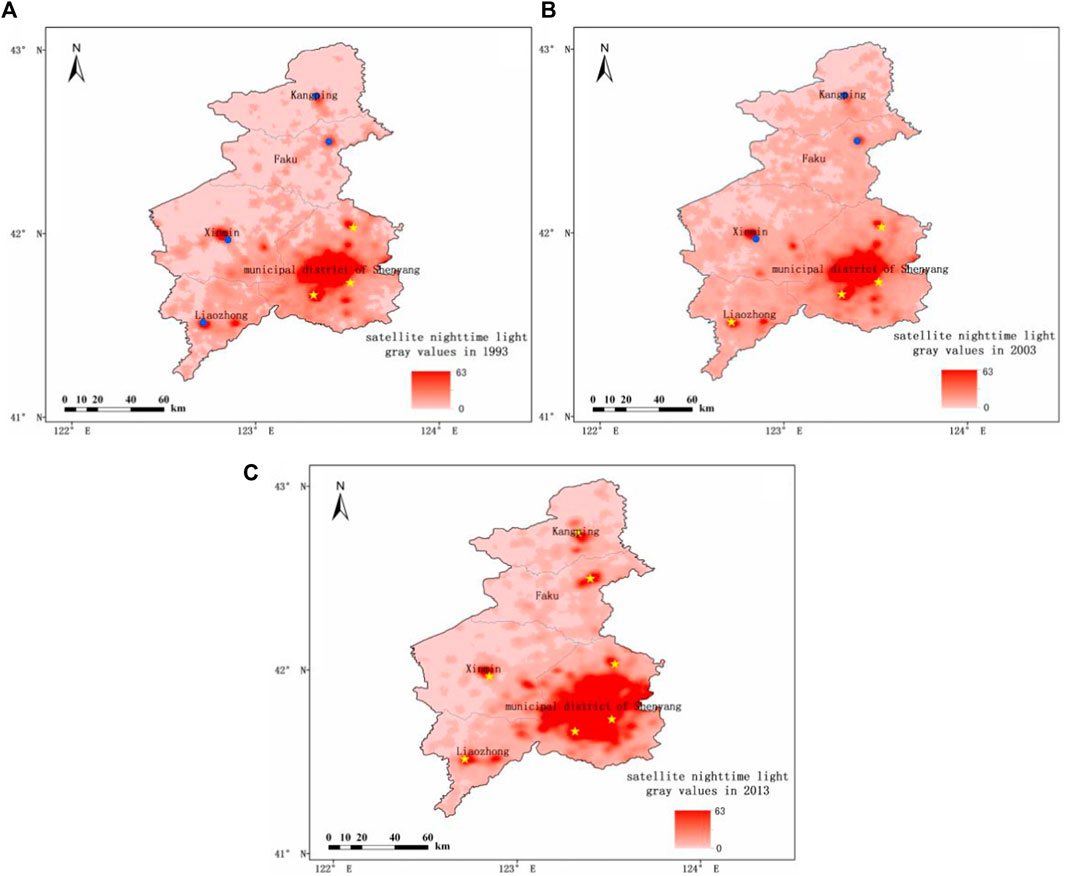
FIGURE 2. Spatial distributions of satellite nighttime light gray values in Shenyang in 1993 (A), 2003 (B), and 2013 (C) (yellow dots represent urban stations and blue dots represent rural station).
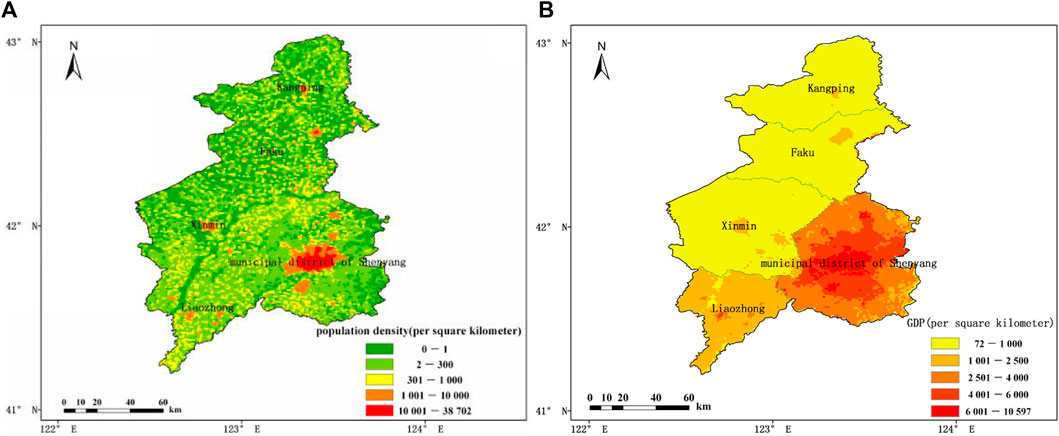
FIGURE 3. Spatial distributions of (A) population density and (B) gross domestic product per unit area in Shenyang.
In this study, the percentile method is used to determine the threshold of ExHP. The hourly precipitation data of each station from 1974 to 2020 are sorted from the weakest to the strongest. If the hourly precipitation in the 99th percentile is greater than the minimum threshold of hourly heavy precipitation defined by the National Meteorological Center (20 mm h−1), the precipitation in this percentile is defined as the threshold of ExHP at this station, otherwise, 20 mm h−1 is selected as the threshold of ExHP (Wu et al., 2019; Ao et al., 2022).
The frequency of ExHP is defined as the number of occurrences or hours of the hourly precipitation exceeding the above defined threshold. For example, the ExHP frequency is X if hourly precipitation continuously exceeds the threshold in X hours.
The intensity of ExHP is defined as the ratio of the total amount of ExHP at each station to the frequency of the ExHP. For example, the threshold of ExHP at a station is 30 mm h−1. If the hourly precipitation at a station in a certain period of time is 40 mm and 50 mm respectively, the frequency of ExHP at the station is two times, the total amount of ExHP is 90 mm, and the intensity of ExHP is 45 mm. Similarly, the same statistics were performed on 244 stations.
Based on the relationships of the hourly precipitation 3 h before the occurrence of ExHP (R−1, R−2, R−3) with the ExHP (R0), the ExHP events from 1974 to 2020 are classified into the abrupt type, growing type and continuous type (Wu et al., 2019). The classification criteria are shown in Table 2.
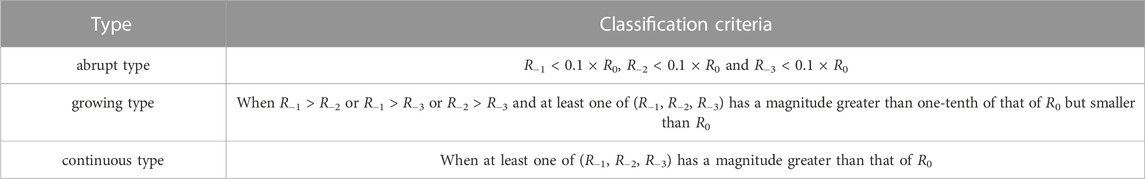
TABLE 2. Classification criteria of different types of ExHP events.
In this paper, The linear trend estimation is used for analysis. When the regression coefficient b > 0, it means that climate variable x shows an upward trend with the increase in time t. When the b < 0, it means that x shows a downward trend with the increase in time t. The magnitude of b reflects the changing rate (Wei, 2007).
The calculation formula of UHII defined in this study is as follows (Oke, 1982):
In Eq. 1, where Tu and Tr (°C) are the average hourly temperature at urban and rural stations, respectively.
Figure 4 shows the diurnal variation curves of annual averaged, monthly averaged and seasonal averaged UHII from 2005 to 2020. The monthly, seasonal and annual distributions of UHII are similar. As can be seen, all the UHII values are positive, with higher values at night and in the morning (from 19:00 local standard time (LST) to 07:00 LST) and lower values during the daytime (07:00–19:00 LST). This conclusion is consistent with the previous research results on the diurnal variations of the UHII (Wu, 2019; Yang et al., 2019). In terms of the monthly variation, the average UHII is the largest in September (0.63°C), followed by August (0.62°C), July (0.58°C) and June (0.46°C). The difference between the average UHII in June and in September is 0.17°C, and the average UHII from June to September is 0.57°C. In terms of seasonal variation, the average UHII is the largest in winter (0.85°C), followed by autumn (0.77°C), spring (0.71°C) and summer (0.55°C). The maximum UHII in winter appears in the morning (06:00 LST), reaching 1.26°C. The maximum UHII in autumn also appears in the morning (05:00 LST), reaching 1.17°C. The maximum UHII in spring appears in the early morning (04:00 LST), reaching 1.13°C. The maximum UHII in summer appears in the morning (06:00 LST), reaching 0.73°C. Overall, the maximum UHII appears earlier in spring and autumn than in winter and summer. The annual averaged UHII in Shenyang is 0.71°C, with the maximum value of 1.07°C in the early morning (06:00 LST). During the high UHII period (between 20:00 and 07:00 LST), the average UHII is 0.93°C, which is 0.42°C higher than the low UHII period. Therefore, the annual averaged UHII (0.71°C) is set as the threshold. When the UHII is greater than 0.71°C, the UHII is considered to be strong; when the UHII is less than 0.71°C, the UHII is considered to be weak. At 6 h before the EXHP event, if more than half of UHIIs are greater than 0.71°C, the precipitation is deemed to be affected by a strong UHI, and it is a strong UHI event. Conversely, it is regarded as a weak UHI event. Combined with the diurnal variations of the frequency and intensity of ExHP in Figure 5, it can be found that ExHP events mostly occur at night in summer (21:00 LST) when the corresponding UHII is relatively strong. In Singapore, it is found that 20%–30% of the precipitation occured at night is caused by the UHI effect by numerical model at 300 m resolution (Doan et al., 2021).
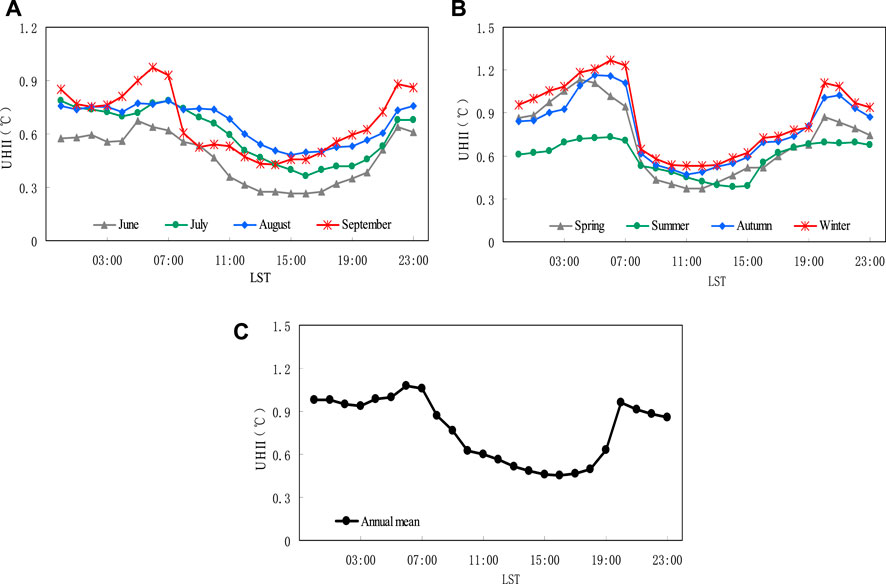
FIGURE 4. Diurnal variations of annual averaged (C), monthly averaged (A) and seasonal averaged (B) urban heat island (UHI) intensity (UHII) from 2005 to 2020.
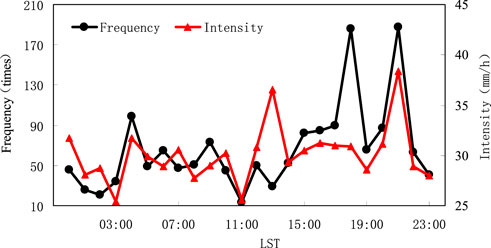
FIGURE 5. Diurnal variations of averaged frequency and intensity of extreme hourly precipitation (ExHP) in urban stations in Shenyang.
Figure 6 shows the spatial distributions of UHII in the municipal district of Shenyang. As can be seen, the spatial distribution of UHII is relatively consistent with the economic development level, transportation density and population density. In the urban areas, dense population and traffic, as well as high-rise buildings, jointly lead to higher UHII. Conversely, the UHII decreases with the increasing distance from the city center. The strong UHI areas are mainly located in the central urban area, and the UHII range from 0.71°C to 1.25°C. The maximum value appears at the regional station near the Experimental Primary School in Shenhe District. The UHII values in the south of Sujiatun and the northeast of Shenbei New District are negative, but the magnitude is relatively small.
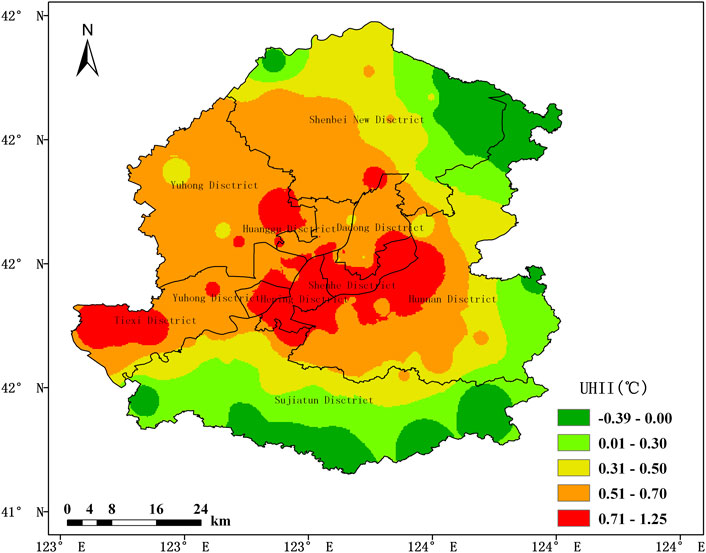
FIGURE 6. Spatial distributions of UHII in the municipal district of Shenyang averaged from 2005 to 2020.
Figure 7 shows the diurnal variation curves of UHII from 12 h before to 12 h after the beginning of the three types of ExHP. It can be seen that the overall variation characteristics for the three types of ExHP are relatively consistent. Twelve to 6 h before the beginning of precipitation, the UHII value is relatively stable and keeps positive. The UHII value increases dramatically from 6 h before the beginning of precipitation while decreases obviously when the precipitation begins (falling below 0°C). The UHII value remains negative 4 h after the beginning of precipitation and then gradually increase with time. However, there are still some differences among the three types of ExHP. The UHII of the abrupt-type of ExHP is the highest 1 h before the beginning of precipitation, which is evidently higher than that of continuous-type and growing-type, reaching 1.17°C. It is a strong UHII. Besides, the UHII shows a steady upward trend from 12 h before the precipitation to the beginning of precipitation. When the precipitation begins, the UHII decreases rapidly, reaching the lowest value 1 h after the beginning of precipitation (−0.71°C). The UHII remains negative for 4 h after the beginning of precipitation, and then it increases quickly, maintaining at about 0.50°C. For the growing-type ExHP, a strong UHII appears from eight to 3 h before the beginning of precipitation. The UHII is the highest (1.05°C) four to 3 h before the beginning of precipitation, which is obviously higher than that of the continuous-type ExHP. Unlike the abrupt-type ExHP, the UHII of the growing-type ExHP begins to decline three to 2 h before the beginning of precipitation, and reaches the lowest value (−0.52°C) at the beginning of precipitation. The UHII remains negative for 6 h after the beginning of precipitation and then turns positive with a stable value of about 0.50°C. For the continuous-type ExHP, a weak UHII appears from 12 h before the precipitation to the beginning of precipitation. The UHII shows a steady upward trend twelve to 4 h before the beginning of precipitation. The UHII reaches the maximum value of 0.69°C at 4 h before the beginning of precipitation, which is much lower than the other two types. Unlike the abrupt-type of ExHP, the UHII of the continuous-type begins to decline 4 h before the beginning of precipitation and reaches the minimum value of −0.63°C just 1 h after the beginning of precipitation. Besides, the UHII continues to be negative after the beginning of precipitation. Although it increases slowly, it remains stable below 0°C. In general, the UHII is relatively large before the abrupt-type ExHP starts, and quickly returns to a positive value after the precipitation begins. Moreover, the UHII of the abrupt-type ExHP is much higher than that of the other two types of ExHP.
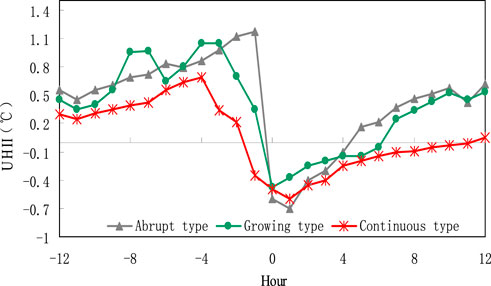
FIGURE 7. Diurnal variation curves of UHII from 12 h before to 12 h after the beginning of three types of EXHP.
Figure 8 shows the spatial distributions of UHII at 6 hours, 3 h and 1 h before and after the beginning of the abrupt-type ExHP. It can be seen that the difference of UHII before and after the precipitation is obvious. The UHII high-value areas at 6 h before the precipitation are mainly located in the central urban area (Shenhe District and Heping District), and the UHII values are within 0.71°C–1.26°C. As the distance from the city center grows, the UHII decreases. Negative UHII values are observed in the south of Sujiatun and the northeast of Shenbei New District. The UHII at 3 h before the precipitation is higher than that at 6 h before the precipitation, and the strong UHII area further increases. Shenhe District, Heping District, Yuhong District, Huanggu District, Dadong District, Tiexi District and the west of Hunnan District are all located in the strong UHII area, and the UHII values are within 0.71°C–1.31°C. The UHII values in southern Sujiatun and a small part of Shenbei New District are still negative. The UHII reaches the maximum at 1 h before the precipitation, and the strong UHII area further increases. Except for the Shenbei New Disctrict, the east of Hunnan District, the southeast of Sujiatun and the north of Yuhong District, the other areas of Shenyang is under the strong UHI effect. The UHII values range from 0.71°C to 1.42°C, with the maximum value in Shenhe District. One hour after the precipitation begins, the UHII values in the municipal district of Shenyang are negative, ranging from −0.53°C to −1.31°C. The UHII values in the central and eastern municipal district are relatively high, and the low-value areas of UHII are located in the Yuhong District, the southeast of Sujiatun and the northeast of Shenbei New District. Three hours after the precipitation, the UHII values in the whole municipal district are still negative, ranging from−0.11°C to −0.98°C. The UHII values are larger than those at 1 hour after the precipitation. The UHII values in Sujiatun, Hunnan District and the city center are relatively high, and those in Shenbei New District and Yuhong District are the lowest. The spatial distributions of UHII at 6 h after the precipitation and 3 h after the precipitation are relatively similar. The UHII values in most areas are negative, while those in the city center, the southeast of Sujiatun and the south of Hunnan District are positive, ranging from 0.01°C to 0.29°C. The lowest UHII is in Shenbei New District. In general, the spatial distributions of UHII at 6, 3, and 1 h before the precipitation are relatively consistent, showing a distribution of “high in the center and low at both ends”. After the precipitation, the UHII values decrease rapidly, turning negative in the whole area, with the lowest UHII in Shenbei New District.
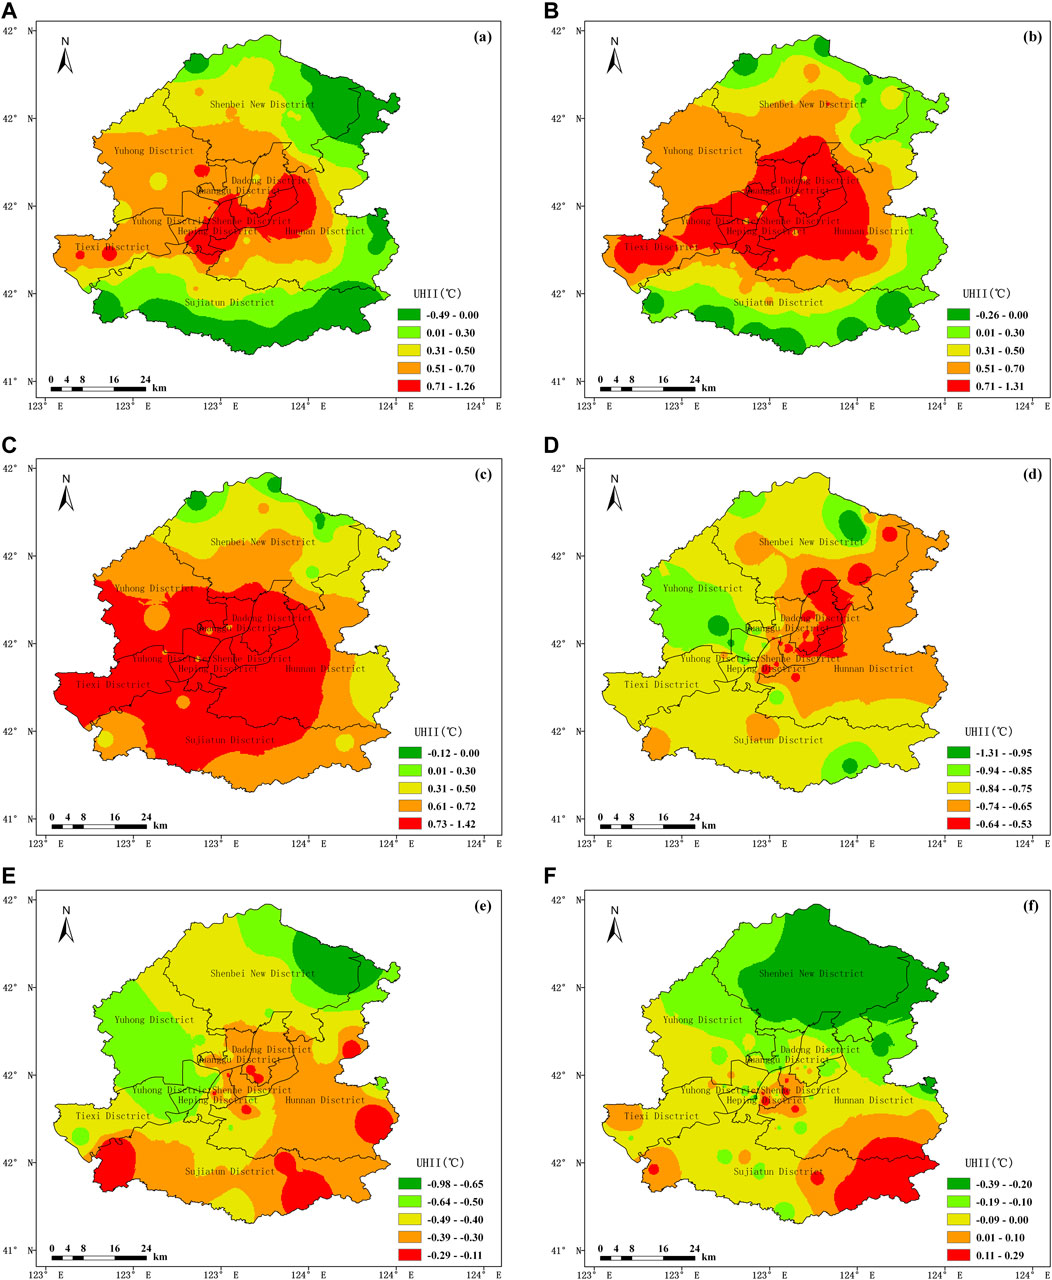
FIGURE 8. Spatial distributions of UHII at (A) 6 h, (B) 3 h, (C) 1 h before the abrupt-type ExHP and (D) 6 h, (E) 3 h and (F) 1 hour after the abrupt type ExHP.
At 19:00 on 11 July 2007, sporadic precipitation began to appear in the municipal district of Shenyang. The hourly precipitation at Shenyang station was 6.9 mm. At 20:00, the hourly precipitation increased rapidly, reaching 53.8 mm, and then it began to decrease. The hourly precipitation was 4.8 mm at 21:00 and 0.9 mm at 22:00. At 23:00, the precipitation ended. This precipitation process lasted for 4 h, which was a typical growing-type ExHP. The heavy precipitation was mainly concentrated in Hunnan District and Shenhe District. As shown in Figure 9, the temperature decreased dramatically, and the relative humidity increased in the usual strong UHI areas (the municipal district of Shenyang and Liaozhong County) from the beginning of the ExHP. Short-term ExHP events in the municipal district of Shenyang are closely related to the urbanization of Shenyang. The expansion of the city, the change in the underlying surface, human life and disordered activities (including various kinds of transportation) aggravate the energy exchange between the urban surface and the atmosphere, causing more complex atmospheric boundary layer movement and more intense convection in urban areas. Furthermore, the strong UHII leads to more convective weather in urban areas, increasing the frequency of ExHP. In recent years, many studies have also shown that urbanization has played a certain role in enhancing the frequency and intensity of ExHP (Tan et al., 2015; Yang et al., 2017; Wu, 2019).
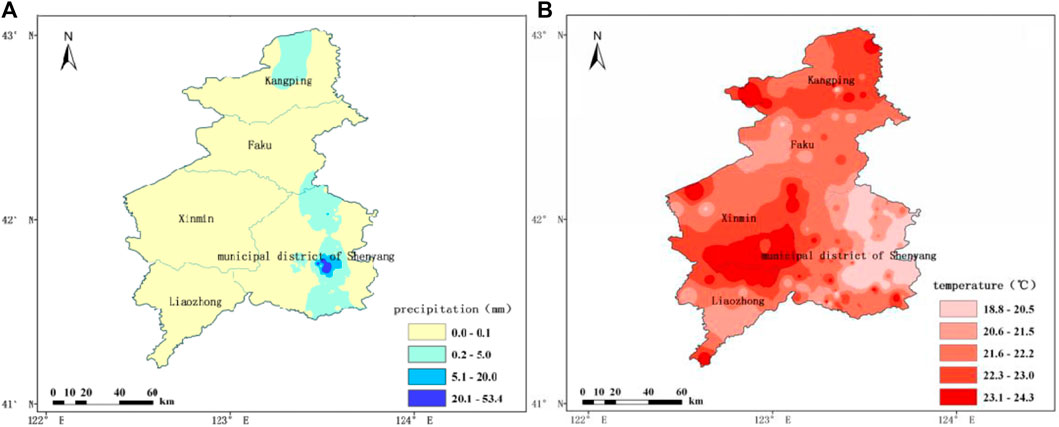
FIGURE 9. Spatial distributions of (A) precipitation and (B) temperature at 20:00 on 11 July 2007.
Figure 10 shows the distributions of convective available potential energy, 500 hPa height field and 850 hPa wind field at 20:00 on 11 July 2007. As can be seen, the impact system of this case is a high-level trough. In terms of energy, the convective available potential energy over Shenyang reached 1124 J kg−1, indicating a favorable energy condition. The 500 hPa 588-iosline was located near the Bohai Sea, close to the south of Dalian. At 850 hPa, the shear line at 850 hPa was obvious, and the southwesterly wind was relatively strong at 850 hPa, which transports much water vapor to Shenyang.
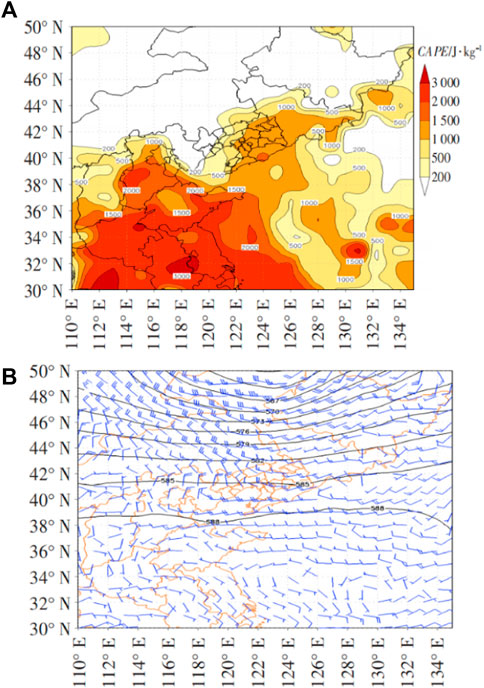
FIGURE 10. The distributions of (A) convective available potential energy, and (B) 500 hPa geopotential height and 850 hPa wind at 20:00 on 11 July 2007.
Figure 11 shows the radar echo maps of Shenyang station on 11 July 2007. A strong echo appeared in Shenyang at about 19:00 LST that day, with a maximum value of about 35–40 dBZ. Before 19:00 LST, there were no obvious echoes in the upstream areas of Shenyang. So, the echo was locally initiated, and it gradually dissipated after 20:00 LST.
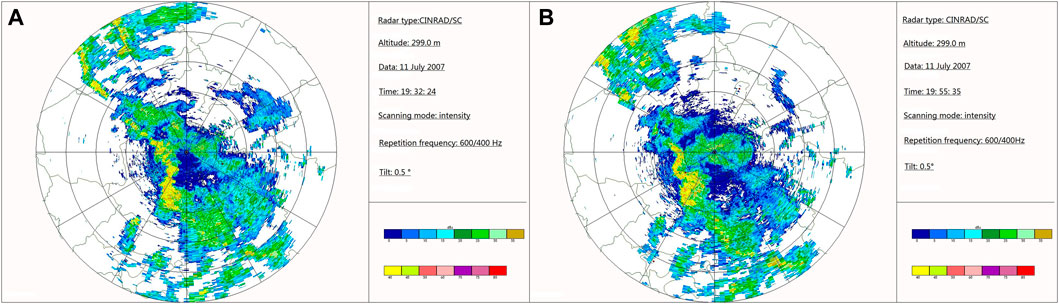
FIGURE 11. Radar echo maps of Shenyang station at (A) 19:32 LST and (B) 19:55 LST on 11 July 2007.
Figure 12 shows the spatial distribution of UHII in the municipal district of Shenyang at 16:00 LST on 11 July 2007. As can be seen, the high-value areas of UHII corresponded to the areas where the ExHP occurred. The areas with a small amount of precipitation, such as Shenbei New District and Sujiatun, were also within the range of strong UHII. The temperature of most national and regional stations with precipitation reached the maximum at 16:00 LST. There are often high temperature, high humidity and strong UHI effect in urban areas before the ExHP events.
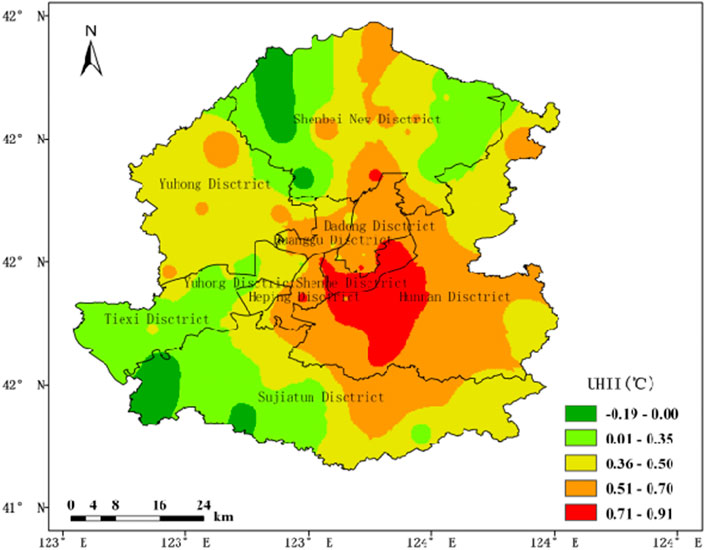
FIGURE 12. Spatial distributions of UHII in the municipal district of Shenyang at 16:00 LST on 11 July 2007.
Figure 13 shows the diurnal variations of UHII from 12 h before to 12 h after the beginning of the ExHP at Shenyang station. As can be seen, the positive UHII values were relatively stable from 12 h to 6 h before the beginning of the precipitation, with the UHII values greater than 0.5°C. Since 6 h before the beginning of the precipitation, the UHII increased obviously. Shenyang station was in the strong UHII, and the UHII reached a maximum of 0.91°C at 4 h before the precipitation. This precipitation process belonged to the growing-type ExHP, and there was sporadic precipitation before the beginning of the ExHP. Therefore, the UHII began to decline at 3 h before the precipitation and fell below 0°C at 1 hour before the precipitation. When the ExHP began, the UHII reached the minimum value of −1.9°C, and the UHII values turned negative at 4 h after the beginning of precipitation. With time going, they gradually increased and stabilized at about 0.5°C.
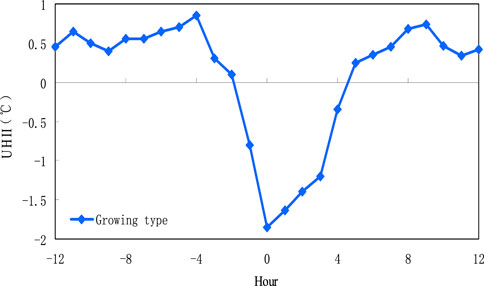
FIGURE 13. Diurnal variations of UHII from 12 h before to 12 h after the beginning of the ExHP at Shenyang station.
The above analyses show that before the ExHP, there were favorable precipitation conditions in Shenyang. The UHII caused the uneven heating of the ground surface, and further led to local temperature difference. Thus, the local vertical circulation was established and the ExHP event occurred. In previous research, it was found that the influence of cities on precipitation is related to the strength of weather system through the study of precipitation in Beijing (Li et al., 2011a). The influence of cities is more significant when the large-scale precipitation system is weak or the local precipitation system is strong. Jiang et al. (2020, 2021) find that the thermal low pressure is formed near the surface of the city to strengthen the rising movement through the Urban Heat Island effect, which induces convective and finally produces heavy precipitation. It is consistent with the research in this paper.
Figure 14 shows the spatial distributions of the average temperature in Shenyang from 1974 to 1990 and from 1991 to 2020. It can be seen that the temperature in the municipal district of Shenyang is much higher than that in other areas in both periods. The temperature gradient in the urban area is unobvious from 1974 to 1990 (Figure 14A), while that between the urban areas of Shenyang and other areas increases after 1991 (Figure 14B), indicating that the difference in thermal conditions between the urban area and suburbs becomes more and more distinct. Figure 15 shows the annual variation of the daily maximum temperature of ExHP events. The daily maximum temperature of ExHP events at both urban and rural stations shows an increasing trend. The trend at urban stations (0.34°C/10a) is more obvious than at rural stations (0.15°C/10a). Before 1995, the difference between urban and rural stations is unobvious. After 1995, due to the influence of the urban underlying surface, the urban area has higher temperature on ExHP days. With sufficient water vapor, the higher temperature strengthens the water storage capacity of the air, hence intensifying the potential precipitation. With urbanization, the UHII in the municipal district of Shenyang has also gradually enhanced. Various factors such as human activities intensify the energy exchange between the urban surface and the atmosphere. The atmospheric boundary layer movement becomes more complex, hence the more intense convection in the municipal district of Shenyang. Strong UHII leads to the increase of convective weather in urban areas, and the frequency of ExHP events increases.
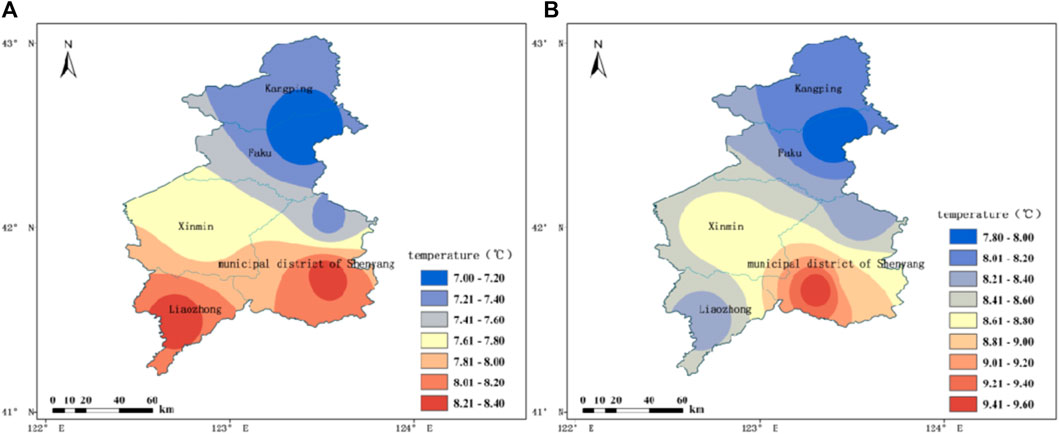
FIGURE 14. Spatial distributions of average temperature in Shenyang (A) from 1974 to 1990 and (B) from 1991 to 2020.
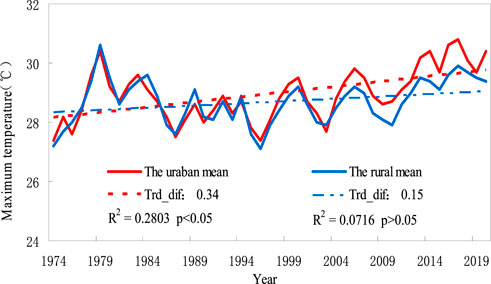
FIGURE 15. Variations of maximum temperature at urban and rural stations on the ExHP days.
Past studies revealed that both the frequency and intensity of ExHP at urban stations are much higher than those at rural stations, and the peak values of ExHP at urban and rural stations mainly occur at night. To further explain this phenomenon, the 6-h resolution temperature and pressure data are used to analyze the pressure anomaly caused by the diurnal variation of the UHI effect. The UHI effect has obvious diurnal variation characteristics, with the highest UHII at night and in the early morning, but the lowest UHII at morning and noon. The atmospheric pressure anomaly caused by the diurnal variation of UHII presents similar variation characteristics.
Figure 16 shows the variations of UHII and urban-rural pressure difference from 1974 to 2020. As can be seen, the UHII has an evident increasing trend from 1974 to 2020, reaching 0.17°C/10a which has passed the significance test at 95% confidence level. Especially, with rapid urbanization, the UHII exceeds 0.6°C after the 21st century. Moreover, the diurnal variation characteristics of UHII become increasingly obvious. In the early days, when urban development was relatively slow, there were no obvious diurnal variation characteristics of UHII. However, since the 1990s, the diurnal variation of UHII has become more distinct. After 2003, the diurnal UHII range could reach more than 0.5°C. The increasing UHII will cause local pressure changes in urban areas, as shown in Figure 16B. When the urbanization is slow, the pressure difference between urban and other areas fluctuates around zero, and there is no obvious diurnal variation feature. However, corresponding to the sharp increase of UHII, the pressure difference between urban and rural areas has also increased sharply since 1995. The pressure in urban areas has begun to be much lower than in rural areas, especially in the 21st century. Its diurnal range changes with the diurnal UHII range.
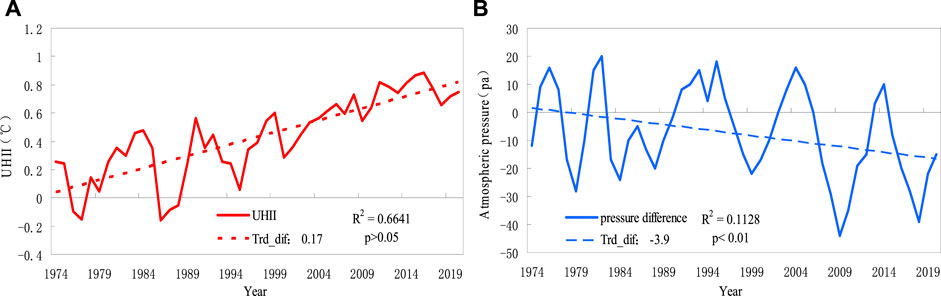
FIGURE 16. Variations of (A) UHII and (B) urban-rural pressure difference from 1974 to 2020.
Therefore, the more ExHP events in urban areas than in rural areas from late afternoon to late night can be explained. From afternoon to night, the UHII increases, which means the temperature difference in urban and rural areas will increase. Then, the urban-rural pressure difference gets larger when the temperature difference reaches the maximum at night. In the low pressure in urban areas, the airflow will converge and ascend. Meanwhile, the pressure in rural areas is relatively high, thus forming an urban-rural thermal circulation. The circulation is the strongest from nightfall to midnight. The low level atmosphere becomes unstable due to the strong UHI effect. With sufficient water vapor, the ExHP event is likely to occur in urban. Moreover, the circulation characteristics caused by the UHI effect in the Shenyang municipal district are also seen in Beijing, Shanghai, Jiangshu and other areas (Zhang, 2012; Zhu et al., 2018; Hou et al., 2019).
Besides UHI, urban canopy and aerosol are also essential factors in the occurrence and development of ExHP. The UHI can enhance the near-surface temperature disturbance and trigger deep wet convection, thus increasing the intensity and frequency of ExHP in urban area and its downwind area. The urban canopy makes the surface rougher, disturbing the boundary layer water vapor and energy processes and blocking the movement of the precipitation system. Therefore, the precipitation events are prolonged and the precipitation intensity is increased (Zhang et al., 2014). In addition, by increasing the surface friction, the urban canopy can cause the convergence of near surface wind, triggering the high-intensity convective precipitation (Miao et al., 2011). On the other hand, the enhanced human activities bring more aerosols in urban areas, which can promote the occurrence of ExHP in the rain season through increasing condensation nuclei, lengthening the retention time of cloud droplets in the air, inhibiting the downdraft, and enhancing the upward motion by the latent heat release in the ice phase processes (Khain et al., 2005; Qian et al., 2009; Li et al., 2011b).
Based on the multi-source meteorological and socio-economic data, urban and rural stations are classified by the satellite remote sensing classification method. The UHII diurnal variation in Shenyang and the relationship between ExHP and UHII are analyzed, Moreover, the causes of ExHP are discussed.
Our analysis in this paper shows that the process of urbanization influencing ExHP is often accompanied by the UHI effect, which has a feedback effect with it. Generally, there is a strong UHII 1–6 h before the start of ExHP. The UHI increases the air temperature near the surface and makes the stratification more unstable. The heat island circulation generated by UHI causes convection, which promotes the formation and movement of precipitation. The energy change caused by precipitation also affects the urban thermal environment. Shepherd et al. (2002) used TRMM satellite precipitation data to study urbanization precipitation, and they pointed out that the UHI circulation make the air flow to downwind areas and generate convective clouds. Through the study of precipitation in large coastal cities, it is found that the interaction of sea-land breeze, topography, urban environment and atmosphere affects precipitation together, but UHI is the main reason for the increase of precipitation (Shepherd et al., 2003). Sun et al. (2007) studied the influence of UHII on precipitation in winter and summer by using the observation data from 1975 to 2004 in Beijing. The results showed that southerly airflow is prevalent in Beijing in summer, the UHII has been strengthened, and the precipitation process in the north has an increasing tended. In terms of Shenyang, the influence of UHI on the abrupt-type ExHP is relatively clear. The strong UHII before the abrupt-type ExHP enhances the vertical shear in the urban boundary layer, which intensifies low-level convergence and makes the ExHP center prone to appear in the urban or suburban area. However, other changes brought about by urbanization, such as the change of land types, the increase of surface roughness, and the decrease of in water vapor mixing ratio, also have important effects on ExHP. By changing land use types, urbanization causes low surface albedo, strong UHII, high surface roughness and low surface permeability. As a result, the surface-air flux exchange, water cycle and energy cycle may change accordingly, thus affecting the radiative forcing and ExHP (Zhang et al., 2009; Wang et al., 2012). Shi et al. (2012) made attribution analysis on the spatial distribution characteristics of precipitation in Beijing from June to September during 2006–2010. The study pointed out that when the UHI is strong, the precipitation is mainly distributed in the urban and suburban areas, and the maximum rainfall intensity occurres in the downwind side of the city. When there is no UHI effect, the distribution of precipitation is only affected by topography. The relevant conclusions were also been found by Li et al. (2011a) in their research.
This study found that ExHP events mostly occur at night in summer when the corresponding UHII is strong. The strong nighttime UHII caused by rapid urbanization of Shenyang, combined with the slowdown of the movement of the weather system by buildings and the increase of condensation nuclei, have enhanced nighttime precipitation. Dixon et al. (2003) studied the types and causes of precipitation caused by urban heat island effect in Atlanta, and found that the most precipitation events caused by the urban heat island were in July, with local precipitation peaked in the nighttime. This is mainly due to low level moisture and urban heat island effect.
The spatial span of the municipal district of Shenyang is relatively small, and the center of the municipal district is highly developed. Therefore, whether the increase in surface roughness brought about by urbanization will strengthen local convergence (Changnon et al., 1981), increase sensible heat flux (Bornstein et al., 2000) and the instability of the boundary layer (Shepherd et al., 2002)? Whether these problems may cause the variations of ExHP? These questions need to be further investigated. In the future, remote sensing, numerical simulation and other analysis means are to be used to carry out long-series and high-resolution simulation research on the climate effect of urbanization, so as to clarify the consistency and difference of urbanization effect between various urban agglomerations and various climatic regions. These studies can further improve and enrich the research on ExHP variation and its relationship with urbanization.
The distributions of monthly averaged, seasonal averaged and annual averaged UHII in Shenyang are similar. The UHII values in Shenyang are basically positive, higher at night and in the morning but lower in the daytime. ExHP events mostly occur at night (21:00 LST) in summer when the UHII is relatively strong. The spatial distribution of UHII is relatively consistent with the economic development level and the transportation and population density. Dense population and transportation, as well as high-rise buildings, in the city center lead to higher UHII. Conversely, the UHII decreases with the distance from the city center.
The overall UHII variation characteristics for the three types of ExHP are relatively consistent. The UHII values are relatively stable and positive from 12 h to 6 h before the beginning of precipitation. The UHII values have increased evidently since 6 h before the beginning of precipitation. However, they decline dramatically from the beginning of precipitation (falling below 0°C). The UHII values remain negative for 4 h after the beginning of precipitation and gradually increase with time. For the abrupt-type ExHP, the UHII is relatively large before the precipitation, and the UHII can quickly return to a positive value after the precipitation ends. The UHII of abrupt-type ExHP is much higher than that of the growing-type and continuous-type ExHP.
The difference of UHII between before and after the abrupt-type ExHP is large. The spatial distributions of UHII values at 6 h, 3 h and 1 h before the precipitation are relatively consistent, showing a distribution of “high in the center and low at both ends”. The high-value areas of UHII are mainly located in the central urban area. After the beginning of the precipitation, the UHII values decrease rapidly, turning negative in the whole area, with the lowest value in Shenbei New District.
When a certain level of urbanization is reached, the temperature on ExHP days in urban areas is higher than that in rural areas, and ExHP events are more likely to occur. It may be caused by the UHI effect. The UHII shows an obvious increasing trend with urbanization, and there is obvious diurnal UHII range. The UHII at night is higher than that during the daytime. The increasing UHII can cause abnormal air pressure in urban and rural areas. The heating in the lower layer of the urban area can lower the local air pressure, causing the air to converge and rise and forming the urban and rural thermal circulation. This phenomenon is particularly evident at night, which is conducive to the occurrence of ExHP events (Principal Investigators of Project METROMEX, 1976; Yang et al., 2011; Yang et al., 2014).
Publicly available datasets were analyzed in this study. This data can be found here: https://www.ngdc.noaa.gov/eog/dmsp.html http://www.resdc.cn.
Conceptualization, XA and QZ; methodology, CZ; formal analysis, YC; data curation, XZ; writing—original draft preparation, XA; writing—review and editing, QZ; visualization, ML; supervision, JL. All authors have read and agreed to the published version of the manuscript.
This research was funded by the Scientific research project of liaoning Meteorological. Bureau in 2021 (No. 202108) and the Science and Technology Plan Project in Liaoning Province (No. 2019-MS-199).
We thank Nanjing Hurricane Translation for reviewing the English language quality of this paper.
The authors declare that the research was conducted in the absence of any commercial or financial relationships that could be construed as a potential conflict of interest.
All claims expressed in this article are solely those of the authors and do not necessarily represent those of their affiliated organizations, or those of the publisher, the editors and the reviewers. Any product that may be evaluated in this article, or claim that may be made by its manufacturer, is not guaranteed or endorsed by the publisher.
Ao, X., Cui, Y., and Zhai, Q. F. (2020b). Effect of urbanization on the temperature trend of Liaoning Province, China. J. Glaciol. Geocryol. 42, 1067–1076.
Ao, X., Zhai, Q. F., and Cui, Y. (2020a). Analysis of urbanization effect on near-surface wind speed change in Liaoning Province, China. Meteorol. Mon. 46, 1153–1164.
Ao, X., Zhai, Q. F., Zhao, C. Y., Cui, Y., Zhou, X. Y., Li, J. W., et al. (2022). Influence of urbanization on spatio-temporal characteristics of extreme hourly precipitation in Shenyang. Land 11, 1487. doi:10.3390/land11091487
Bornstein, R., and Lin, Q. (2000). Urban heat islands and summertime convective thunderstorms in Atlanta. Three case studies. Atmos. Envron. 34, 507–516. doi:10.1016/s1352-2310(99)00374-x
Changnon, S. A. (1979). Rainfall changes in summer caused by St. Louis. Science 205, 402–404. doi:10.1126/science.205.4404.402
Changnon, S. A., Semonin, R. G., Auer, A. H., Braham, R. R., and Hales, J. (1981). Metromex: A reviewand summary. Meteor. Monogr. 40, 181.
Changnon, S. A., Semonin, R. G., and Huff, F. A. (1976). A hypothesis for urban rainfall anomalies. J. Appl. Meteorol. 15, 544–560. doi:10.1175/1520-0450(1976)015<0544:ahfura>2.0.co;2
Changnon, S. A., Shealy, R. T., and Scott, R. W. (1991). Precipitation changes in fall, winter, and spring caused by St. Louis. J. Appl. Meteorol. 30, 126–134. doi:10.1175/1520-0450(1991)030<0126:pcifwa>2.0.co;2
Changnon, S. A. (1968). The La Porte weather anomaly-fact or fiction? Bull. Amer. Meteorol. Soc. 49, 4–11. doi:10.1175/1520-0477-49.1.4
Changnon, S. A. (1978). Urban effects on severe local storms at St. Louis. J. Appl. Meteorol. 17, 578–586. doi:10.1175/1520-0450(1978)017<0578:ueosls>2.0.co;2
Danie, R. (2000). Suppression of rain and snow by urban and industrial air pollution. Science 287 (10), 1793–1796. doi:10.1126/science.287.5459.1793
Dixon, P. G., and Mote, L. T. (2003). Patterns and causes of atlanta's urban heat island–initiated precipitation. J. Appl. Meteor. 9, 1273–1284. doi:10.1175/1520-0450(2003)042<1273:pacoau>2.0.co;2
Doan, Q. V., Dipankar, A., Simón-Moral, A., Sanchez, C., Prasanna, V., Roth, M., et al. (2021). Urban induced modifications to the diurnal cycle of rainfall over a tropical city. Q. J. R. Meteorological Soc. 147 (735), 1189–1201. doi:10.1002/qj.3966
Dou, J., Wang, Y., Bornstein, R., and Miao, S. (2015). Observed spatial characteristics of Beijing urban climate impacts on summer thunderstorms. J. Appl. Meteor. Climatol. 54, 94–105. doi:10.1175/JAMC-D-13-0355.1
He, C. Y., Shi, P. J., Li, J. G., Chen, D., Pan, Y. Z., Li, D., et al. (2006). Restoring urbanization process in China in the 1990s by using non-radian cecalibrated DMSP/OLS nighttime light lmagery and statistical data. Chin. Sci. Bull. 51, 856–861.
Hou, Y. L., and Chen, B. D. (2019). Diurnal variations of summer precipitation in Shanghai. J. Trop. Meteorol. 25, 414–420.
Huff, F. A., and Changnon, S. A. (1972). Climatological assessment of urban effects on precipitation at St. Louis. J. Appl. Meteorol. 11, 823–842. doi:10.1175/1520-0450(1972)011<0823:caoueo>2.0.co;2
Jiang, X. l., Luo, Y. L., Zhang, D. L., and Wu, M. W. (2020). Urbanization enhanced summertime extreme hourly precipitation over the Yangtze River Delta. J. Clim. 33 (13), 5809–5826. doi:10.1175/JCLI-D-19-0884.1
Jiang, X. l. (2021). On the characteristics of the summertime extreme hourly precipitation over the Yangtze River Delta and its relationship to urbanization. Beijing, China: University of Chinese Academy of Sciences Press.
Jong, J. B., Yeon, H. K., and Hye, Y. C. (2001). Dry and moist convection forced by an urban heat island. J. Appl. Meteor. 40, 1462–1475. doi:10.1175/1520-0450(2001)040<1462:damcfb>2.0.co;2
Khain, A., Rosenfeld, D., and Pokrovsky, A. (2005). Aerosol impact on the dynamics and microphysics of deep convective clouds. Q. J. R. Meteorological Soc. 131 (611), 2639–2663. doi:10.1256/qj.04.62
Li, S. Y., and Ma, J. J. (2011a). Impact of urbanization on precipitation in Beijing area. J. Meteorological Sci. 4, 414–421.
Li, Z., Niu, F., Fan, J. W., Liu, Y. G., Rosenfeld, D., and Ding, Y. N. (2011b). Long-term impacts of aerosols on the vertical development of clouds and precipitation. Nat. Geosci. 4 (12), 888–894. doi:10.1038/NGEO1313
Miao, S., Chen, F., Li, Q., and Fan, S. Y. (2011). Impacts of urban processes and urbanization on summer precipitation: A case study of heavy rainfall in beijing on 1 August 2006. J. Appl. Meteorology Climatol. 50 (4), 806–825. doi:10.1175/2010JAMC2513.1
Oke, T. R. (1982). The energetic basis of the urban heat island. Q. J. R. Meteorological Soc. 108 (455), 1–24. doi:10.1002/qj.49710845502
Principal Investigators of Project METROMEX (1976). METROMEX update. Bull. Amer. Meteorol. Soc. 57, 304–308. Availabile At: https://www.jstor.org/stable/26216207.
Qian, Y., Gong, D., Fan, J., Leung, L. R., Bennartz, R., Chen, D. L., et al. (2009). Heavy pollution suppresses light rain in China: Observations and modeling. J. Geophys. Res. - Atmos. 114 (D7), D00K02. doi:10.1029/2008JD011575
Seaman, N. L., Ludwig, F. L., Donall, E. G., Warnerc, T. T., and Bhumralkar, C. M. (1989). Numerical studies of urban planetary boundary-layer structure under realistic synoptic conditions. J. Appl. Meteor. 28 (8), 760–781. doi:10.1175/1520-0450(1989)028<0760:nsoupb>2.0.co;2
Shepherd, J. M., and Burian, S. J. (2003). Detection of urban-induced rainfall anomalies in a major coastal city. Earth Interact. 7 (4), 1–17. doi:10.1175/1087-3562(2003)007<0001:douira>2.0.co;2
Shepherd, J. M., Pierce, H., and Negri, A. J. (2002). Rainfall modification by major urban areas: Observations from spaceborne rain radar on the TRMM satellite. J. Appl. Meteor. 41, 689–701. doi:10.1175/1520-0450(2002)041<0689:rmbmua>2.0.co;2
Shi, S. Y., Sun, J. S., and Wang, G. R. (2012). The possible effect of urbanization and low-level wind on the spatial variability during the rainny season in Beijing. Chinese Meteorological Society. Proceedings of the The 29th annual meeting of China meteorological society, Shenyang, Liaoning province, China, 192–203.
Shu, S., Yu, B. L., Wu, J. P., and Liu, G. X. (2011). Methods for deriving urban built-up area using night-lingt data: Assessment and application. Remote Sens. Tech. Appl. 26, 169–176. doi:10.11873/j.issn.1004-0323.2011.2.169
Sun, J. S., and Shu, W. J. (2007). The effect of Urban Heat Island on winter and summer precipitation in Beijing region. Chin. J. Atmos. Sci. 2, 311–320.
Tan, J. G., and Gu, W. Research (2015). Progress on urban-induced rainfall effect, China. Adv. Meteorol. Sci. Technol. 5, 17–22. doi:10.3969/j.issn.2095-1973.2015.06.003
Wang, J., Feng, J. M., Yan, Z. W., Hu, Y. H., and Jia, G. S. (2012). Nested high-resolution modeling of the impact of urbanization on regional climate in three vast urban agglomerations in China. J. Geophys. Res. 117 (D21), 21103–21110. doi:10.1029/2012JD018226
Wei, F. Y. (2007). Climatological statistical diagnosis and prediction Technology. Beijing, China: Meteorological Press, 23–104.
Wu, M. W., Luo, Y. L., Chen, F., and Wong, W. K. (2019). Observed link of extreme hourly precipitation changes to urbanization over coastal south China. J. Appl. Meteorol. Climatol. 58 (4), 1799–1819. doi:10.1175/JAMC-D-18-0284.1
Wu, M. W. (2019). Synoptic situations of extreme hourly precipition over China and its observed link to urbanization. Beijing, China: University of Chinese Academy of Sciences Press.
Yang, L., Smith, J. A., Baeck, M. L., Jessup, S. M., Tian, F. Q., Hu, H. P., et al. (2014). Impact of urbanization on heavy convective precipitation under strong large-scale forcing: A case study over the milwaukee-lake Michigan region. J. Hydrometeorol. 15 (1), 261–278. doi:10.1175/JHM-D-13-020.1
Yang, P., Ren, G. Y., Hou, W., and Liu, W. D. (2013). Spatial and diurnal characteristics of summer rainfall over Beijing municipality based on a high-density AWS dataset. Int. J. Climatol. 33, 2769–2780. doi:10.1002/joc.3622
Yang, P., Ren, G. Y., Hou, W., and Liu, W. (2019). Impact of daytime precipitation duration on urban heat island intensity over Beijing city. Urban Clim. 28, 100463. doi:10.1016/j.uclim.2019.100463
Yang, P., Ren, G. Y., and Yan, P. C. (2017). Evidence for a strong association of short-duration intense rainfall with urbanization in the Beijing urban area. J. Clim. 30, 5851–5870. doi:10.1175/JCLI-D-16-0671.1
Yang, X. C., Hou, Y. L., and Chen, B. D. (2011). Observed surface warming induced by urbanization in east China. J. Geophys. Res. 116, D14113. doi:10.1029/2010jd015452
Zhang, C. L., Chen, F., Miao, S. G., Li, Q. C., Xia, X. A., and Xuan, C. Y. (2009). Impacts of urban expansion and future green planting on summer precipitation in the Beijing metropolitan area. J. Geophys. Res. 114 (D2), D02116. doi:10.1029/2008JD010328
Zhang, F. (2012). The analysis of the impact of urbanization on summer precipition in Jiangsu province. Nanjing, China: Nanjing University of Information Science and Technology Press.
Keywords: extreme hourly precipitation, urban heat island intensity, cause analysis, sumer, Shenyang
Citation: Ao X, Zhai Q, Zhao C, Cui Y, Zhou X, Li M and Li J (2023) Cause analysis of the extreme hourly precipitation and its relationship with the urban heat island intensity in Shenyang, China. Front. Environ. Sci. 10:1094169. doi: 10.3389/fenvs.2022.1094169
Received: 09 November 2022; Accepted: 19 December 2022;
Published: 16 January 2023.
Edited by:
Haipeng Yu, Northwest Institute of Eco-Environment and Resources (CAS), ChinaReviewed by:
Guicai Ning, The Chinese University of Hong Kong, ChinaCopyright © 2023 Ao, Zhai, Zhao, Cui, Zhou, Li and Li. This is an open-access article distributed under the terms of the Creative Commons Attribution License (CC BY). The use, distribution or reproduction in other forums is permitted, provided the original author(s) and the copyright owner(s) are credited and that the original publication in this journal is cited, in accordance with accepted academic practice. No use, distribution or reproduction is permitted which does not comply with these terms.
*Correspondence: Qingfei Zhai, MTU4NDAzMjI0OTVAMTYzLmNvbQ==
Disclaimer: All claims expressed in this article are solely those of the authors and do not necessarily represent those of their affiliated organizations, or those of the publisher, the editors and the reviewers. Any product that may be evaluated in this article or claim that may be made by its manufacturer is not guaranteed or endorsed by the publisher.
Research integrity at Frontiers
Learn more about the work of our research integrity team to safeguard the quality of each article we publish.