 Qingping Cheng
 Mingda Zhang4*
94% of researchers rate our articles as excellent or good
Learn more about the work of our research integrity team to safeguard the quality of each article we publish.
Find out more
ORIGINAL RESEARCH article
Front. Environ. Sci., 09 December 2022
Sec. Atmosphere and Climate
Volume 10 - 2022 | https://doi.org/10.3389/fenvs.2022.1091985
Soil temperature change has considerable impact on land surface energy and water balances, and hence on changes in weather/climate, surface/subsurface hydrology, and ecosystems. However, little is known regarding the spatiotemporal variations and influencing factors of changes in hourly soil temperature (depth: 5–320 cm) in low-latitude highland areas. This study analyzed the hourly soil temperature at each hour during 2004–2020 and at 08:00, 14:00, and 20:00 (Beijing Time) during 1961–2020. The results revealed the following. 1) As soil depth increased, average soil temperature increased in autumn and winter, and decreased annually and in spring and summer. It exhibited significant increase during 00:00–23:00 annually, seasonally, and monthly, especially at depths of 40–320 cm during 2004–2020. Average soil temperature increased at 08:00 and decreased at 14:00 and 20:00 with increasing soil depth, but the opposite trend was found annually, seasonally, and monthly at 08:00, 14:00, and 20:00 during 1961–2020. 2) With increasing elevation, average soil temperature decreased at 08:00, 14:00, and 20:00 at depths of 5–20 cm, and showed significant increase trend at 08:00 and 14:00 at depths of 10–20 cm (except at 14:00 at 10-cm depth). 3) At 5-cm depth, the critical accumulated soil temperature of ≥12°C and 14°C extended the potential growing season during 1961–2020. 5) Significant uptrend of hourly soil temperature annually, seasonally, and monthly potentially leads to additional release of carbon to the atmosphere and increased soil respiration, reinforcing climate warming. These findings contribute to better understanding of the variation of shallow soil temperatures and land–atmosphere interactions in low-latitude highland areas.
Soil temperature plays an important role in the physical, biological, and microbiological processes that occur in soil, but it is rarely reported as an indicator of climate change because such data generally have limited spatiotemporal coverage (Qian et al., 2011; Bai et al., 2014; Sviličić et al., 2016; Wang et al., 2020). The structure, function, productivity, and stability of an ecosystem largely depend on the soil temperature regime because soil temperature affects the germination of seedling emergence, early developmental and growth processes, tree species distribution and forest composition, and crop yield by changing the carbon and nutrient cycles, fertility, and productivity of the soil (Linderholm., 2006; Curiel et al., 2007; Kurylyk et al., 2014; Zhang et al., 2016; Hu et al., 2019; Oogathoo et al., 2022). Meanwhile, as important thermal and hydrological factors of the ground at any given location, soil temperature and soil moisture respond quickly to the effects of climate change and interact with the overlying atmosphere through the surface energy, water balance, and carbon cycles, substantially promoting feedback to regional climate (Albergel et al., 2015; Zhu et al., 2021; Liu et al., 2022). Soil temperature is also an important indicator of climate change and a critical parameter in numerical weather forecasting and climate prediction (Holmes et al., 2008; Qian et al., 2011; Albergel et al., 2015; Li et al., 2022; Song et al., 2022). It is currently unknown whether global soil temperatures experienced the same hiatus in rise as that shown in global air temperatures in the early 21st century (Wang et al., 2018). Soil surface and air temperatures might change in different ways (Zhang et al., 2001; Qian et al., 2011; Liu et al., 2017); therefore, exploring the trends of both could improve understanding of regional environmental/climatological conditions and further elucidate the effects of anthropogenic global warming (Liu et al., 2017).
The research on soil temperature in different soil layers has attracted extensive attention of scholars at home and abroad (0–320 cm), e.g., globally and on the national scale (Jacobs et al., 2011; Sviličić et al., 2016; Leeper et al., 2021; Oogathoo et al., 2022), on the regional scale (Chudinova et al., 2006; Knight et al., 2018), and in China (Zhang et al., 2016; Wang et al., 2018; Wang et al., 2021; Shi and Chen., 2021) and its subregions (Luo et al., 2016; Liu et al., 2017; Yang et al., 2018; Zhu et al., 2018; Wang et al., 2020; Fang et al., 2021; Shi et al., 2021). Such studies have achieved many valuable results regarding the spatiotemporal evolutionary mechanisms and influencing mechanisms of soil temperature in different soil layers. Generally, the main finding is that the temperature of different soil layers shows an obvious warming trend, although the trend of change among different soil layers is not consistent, and there is obvious seasonal and regional heterogeneity. Moreover, the relationships between the trend of warming of soil temperature and precipitation, air temperature, vegetation, and snowfall are also obviously different. However, there has been little research on the annual, seasonal, and monthly trends of change in soil temperature and their influencing factors from the hourly scale, especially in low-latitude plateau areas with complex terrain and biodiversity (i.e., Yunnan Province, China).
To the best of our knowledge, there has been no relevant research of the characteristics of temperature change at different soil depths in Southwest China. You et al. (2013) performed analysis of the trend of soil temperature at one station in the Ailaoshan Nature Reserve (Yunnan Province, China), but little is known regarding the variation of soil temperature in low-latitude highland areas. Therefore, the objectives of this study were as follows: 1) to quantify the three-dimensional dynamic variation (i.e., temporal, spatial, and vertical) of temperature in different soil layers (5–320 cm) annually, seasonally, and monthly on the hourly scale during 1961 (2004)–2020; 2) to examine the spatiotemporal variations of the 5-cm critical accumulated soil temperature of ≥12 and 14°C for daily scales. This study represents the first analysis of soil temperature variations at depths of 5–320 cm in the low-latitude plateau area of Yunnan Province. The results of this study will provide important reference for further study of hourly soil temperature, weather forecasting, climate prediction, biodiversity conservation (ecological models), and agricultural production in other low-latitude plateau areas.
Yunnan Province is a typical low-latitude plateau region in Southwest China, the northern part of which encompasses high mountains belonging to the southern extension of the Qinghai–Tibet Plateau (Figure 1). Mountains, plateaus, and basins account for 84%, 10%, and 6% of the total area of the province, respectively (Ma et al., 2021). The special geographic location and unique geomorphic environment of Yunnan Province produce obvious regional differences in climate with prominent three-dimensional climatic characteristics. The northern high mountains have a barrier effect on precipitation, and the deep valleys in the west provide a North–South corridor for the movement of warm humid air from the ocean (Wu et al., 2012). The average/maximum/minimum temperature, average precipitation, and relative humidity in Yunnan Province from 1961 to 2020 were 16.5°C (102 stations)/23.1°C (102 stations)/11.9°C (102 stations), 1,105 mm (105 stations), and 74.3% (102 stations), respectively.
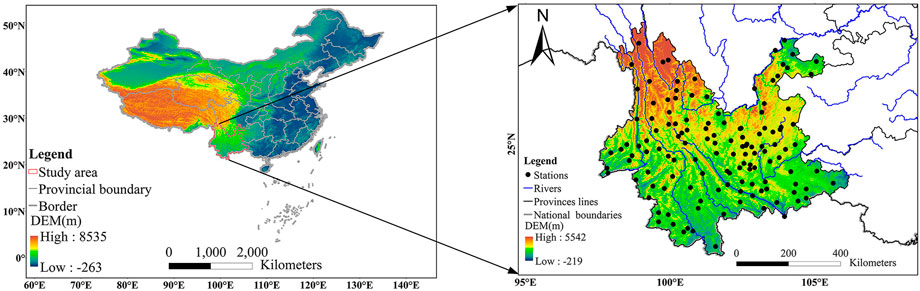
FIGURE 1. Location and digital elevation model (DEM) of the study area, and locations of the meteorological stations in Yunnan.
This study used two data time series obtained from the Yunnan Meteorological Bureau (http://yn.cma.gov.cn/) for analysis of shallow (5, 10, 15, and 20 cm) and deep (40–320 cm) soil temperature (Table 1). The first dataset comprised measurements recorded at 08:00, 14:00, and 20:00 Beijing Time (owing to the prevalence of errors in data recorded at 02:00, they are not considered here) from 1 January 1961 to 28 February 2021; the second dataset included each hour observations from 1 January 2004 to 28 February 2021. The quality of the data is strictly controlled, i.e., station data are discarded if there are missing/erroneous values for more than 5 days continuously in each month for the first dataset and for more than 1 day for the second dataset. Overall, there were few stations with data series that failed quality control. Station migration is the main factor causing sudden change in soil temperature data series. To further guarantee data quality, the following conditions were adopted when selecting the stations for inclusion in the study: 1) Stations with migration distance of no greater than 20 km and vertical height displacement of no greater than 100 m during 1961–2020 were retained, as long as the station underwent no more than two relocations. 2) Missing soil temperature data were replaced by applying linear regression to data of different elevations and from neighboring stations. Shuttle Radar Topography Mission data with 30-m resolution were derived from the Geospatial Data Cloud for China (https://www.gscloud.cn/).
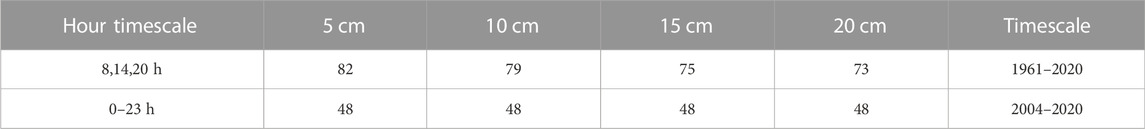
TABLE 1. Numbers of stations and timescales of the time series data of different soil layers used in this study.
Soil temperature indexes might offer helpful estimations of plant growth owing to the strong physiological link between underground temperatures and aboveground phenology, therefore, soil temperature data have also been suggested as indicators of seasonal change (Baldocchi et al., 2005; Leeper et al., 2021). Generally, the minimum temperature index required for the suitable sowing date of crops is determined by the temperature 5 cm above the ground surface. However, a stable 5-cm soil temperature of 12°C–14°C is also indicative of a time suitable for sowing spring maize (Du et al., 2019). In this study, the average 5-cm soil temperature at three times (i.e., 08:00, 14:00, and 20:00) was taken as the daily scale, and the accumulated temperature from 1961 to 2020 was >12°C and 14°C. The 5-day moving average method was used to determine the beginning and end days, duration, and accumulated soil temperature when the average 5-cm soil temperature was consistently above 12°C and 14°C (Yan, 2001), and the active accumulated temperature was calculated between the beginning and end days as the accumulated temperature of ≥12°C and 14°C. The 5-cm soil temperature data of ≥12 and 14°C in Yunnan Province were established using the arithmetic mean method, including the beginning and end days, duration, and accumulated soil temperature. The multiyear average value was taken as the average value of the climate reference period, i.e., 1981–2000.
Hourly soil temperature data were interpolated using a digital elevation model (DEM) into a raster with 1-km resolution using an ensemble of six algorithms (i.e., boosted regression tree, neural network, generalized additive model, multivariate adaptive regression spline, support vector machine, and random forest) using the R “Machisplin” package. During model tuning, each algorithm was systematically weighted from 0 to 1 and the fit of the ensemble model was evaluated. The best-performing model was determined through k-fold cross validation (k = 10), and the model with the lowest residual sum of squares for the test data was chosen. After determining the best model algorithm and weightings, the final model was created using the full training dataset. Residuals of the final model were calculated from the full training dataset and these values were interpolated using thin-plate-smoothing splines. However, if the R2 value of the final correction was greater than the R2 value of the ensemble, the final correction was discarded (R2 values >0.8 for 00:00–23:00). For more detailed information on the parameters of the interpolation, see the Supplementary Material S1.
Sen’s slope estimator and the modified Mann–Kendall test using the trend-free prewhitening method were used to determine the trends and the magnitude of the slopes for hour and (Mann, 1945; Pettitt, 1979; Theil, 1992; Yue and Wang, 2002). Additionally, Spearman correlation analysis was performed between the annual values of temperature in the different soil layers and climate factors.
The annual and seasonal soil temperatures averaged over the period of 2004–2020 across Yunnan Province are illustrated in Figures 2A–E. It can be seen that the annual and seasonal shallow soil temperatures change considerably, whereas the annual average deep soil temperatures (40–320 cm) change little; the hourly maximum temperature is 23.9°C (15:00) at 5-cm depth and 19.6°C at 160- and 320-cm depth (00:00–23:00). With increase of the soil layer, the hourly average soil temperature in spring and summer decreases. In spring, the highest soil temperature is 26.0°C (15:00) at 5-cm depth and the lowest soil temperature is 18.0°C (00:00–01:00) at 5-cm depth; in summer, the highest soil temperature is 28.3°C (15:00) at 5-cm depth and the lowest soil temperature is 19.9°C (00:00–23:00) at 320-cm depth. The average hourly soil temperature in autumn and winter increases with increase of the soil layer (the hourly soil temperature is the same for each layer and at each hour at depths of 80–320 cm). In autumn, the highest temperature is 23.7°C (15:00) at 5-cm depth and the lowest temperature is 21.1°C (00:00–23:00) at 320-cm depth. In winter, the highest temperature is 19.3°C (00:00–04:00) at 5-cm depth and the lowest temperature is 10.2°C at 320-cm depth (00:00–23:00).
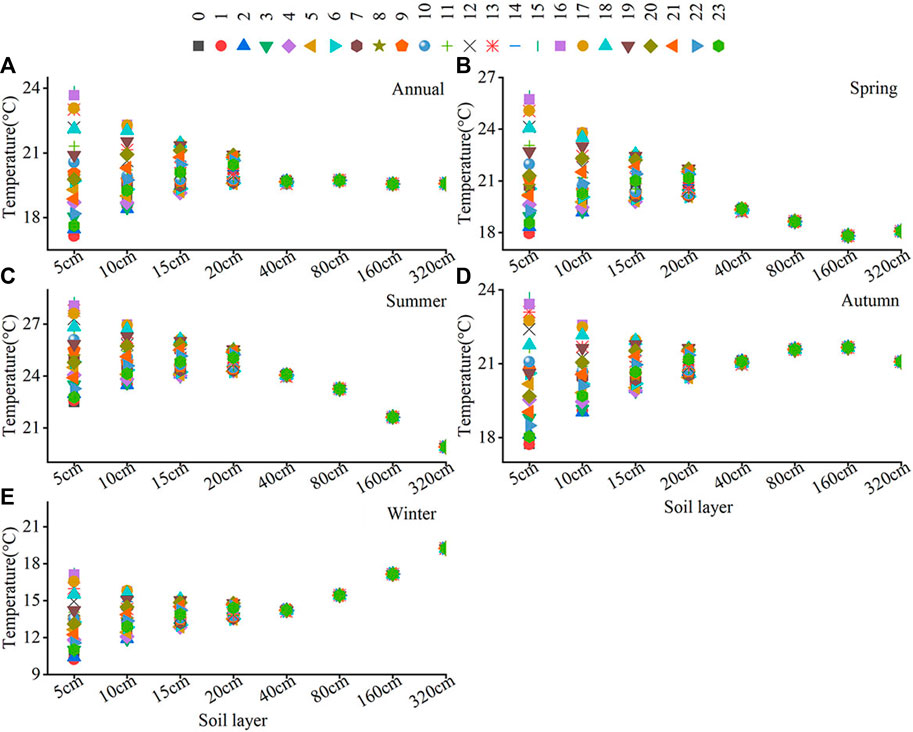
FIGURE 2. Annual (A), Spring (B), Summer (C), Autumn (D) and Winter (E) variations of hourly average soil temperature in Yunnan.
The trends of change in annual and seasonal hourly soil temperatures during 2004–2020 display a large range at depths of 5–20 cm, whereas the amplitude of the significant trend of change in hourly temperature in deep soil layers (40–320 cm) is largely constant and significant (except for individual hours in winter). Specifically, the trend of change annually and in spring is most consistent, whereas the hourly trend of warming in summer is more significant than that in other seasons (Figure 3). Meanwhile, annually, the slope of the trend ranges from −0.61°C to 0.84°C/year at 5-cm depth, −0.32°C–0.92°C/year at 10-cm depth, −0.17°C–0.36°C/year at 15-cm depth, and −0.10°C to 0.23°C/year at 20-cm depth. In spring, the slope of the trend ranges from −0.64°C to 0.92°C/year at 5-cm depth, −0.32°C–0.59°C/year at 10-cm depth, −0.16°C–0.40°C/year at 15-cm depth, and −0.08 to 0.25°C/year at 20-cm depth. In summer, the slope of the trend ranges from −0.57 to 0.76°C/year at 5-cm depth, −0.32°C–0.50°C/year at 10-cm depth, −0.18°C–0.33°C/year at 15-cm depth, and −0.10°C to 0.21°C/year at 20-cm depth. In autumn, the slope of the trend ranges from −0.56°C to 0.72°C/year at 5-cm depth, −0.33°C–0.48°C/year at 10-cm depth, −0.17°C–0.33°C/year at 15-cm depth, and −0.10°C to 0.20°C/year at 20-cm depth. In winter, the slope of the trend ranges from −0.66°C to 0.89°C/year at 5-cm depth, −0.35°C–0.53°C/year at 10-cm depth, −0.18°C–0.35°C/year at 15-cm depth, and −010°C to 0.22°C/year at 20-cm depth for each hour. Additionally, annually and seasonally, the trend is upward at 02:00–11:00 (significant) and downward at both 00:00–01:00 (significant) and 12:00–23:00 (insignificant) at 5-cm depth. The trend is upward at 04:00–13:00 (significant, except in autumn) and downward at both 00:00–02:00 (significant) and 15:00–23:00 (insignificant, annually and in spring; significant, in summer, autumn, and winter) at 10-cm depth. The trend is upward at 05:00–15:00 (significant, annually and in spring and summer; 06:00–15:00 significant, in autumn and winter) and downward at both 00:00–03:00 (significant) and 16:00–23:00 (insignificant, annually and in spring; significant, in summer, autumn, and winter) at 15-cm depth. The trend is upward at 06:00–17:00 (significant, annually and in spring; 07:00–16:00 significant, in summer and autumn; 08:00–16:00 significant, in winter) and downward at both 00:00–05:00 (00:00–02:00 significant, annually and seasonally) and 18:00–23:00 (20:00–23:00 significant, annually and in winter; 19:00–23:00 significant, in summer and autumn) at 20-cm depth. Furthermore, temperature change at depths of 0–20 cm is mainly dominated by a significant upward trend at the majority of stations, and mainly concentrated during 03:00–11:00, 04:00–13:00, 06:00–14:00, and 08:00–15:00 at depths of 5, 10, 15, and 20 cm, respectively, whereas deep soil temperature is mainly dominated by a significant downward trend, although it is evident only at a relatively small percentage of stations annually and in spring. In summer, autumn, and winter, the significant upward trend in shallow soil temperature is mainly concentrated during 02:00–17:00 for average timescales and the majority of stations, while the significant downward trend is mainly concentrated during 13:00–23:00. The percentage of stations with significant upward and downward trends in deep soil temperature is lower than that for shallow layers both annually and seasonally (Figure 4).
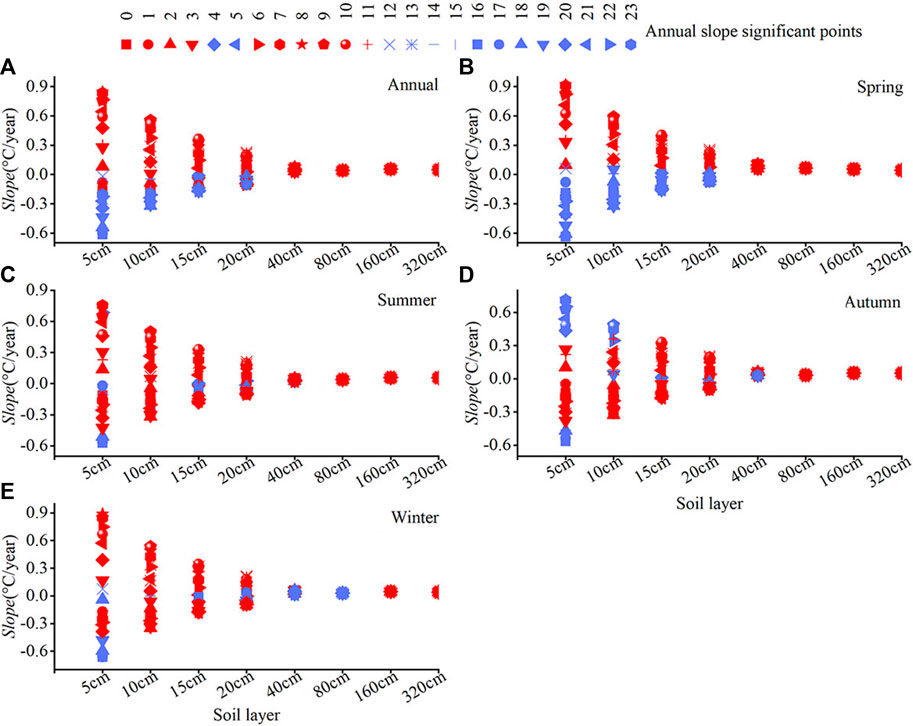
FIGURE 3. Annual (A), Spring (B), Summer (C), Autumn (D) and Winter (E) hourly average soil temperature slope during 2004–2020 (red symbol indicates significance at the ≤0.05 level).
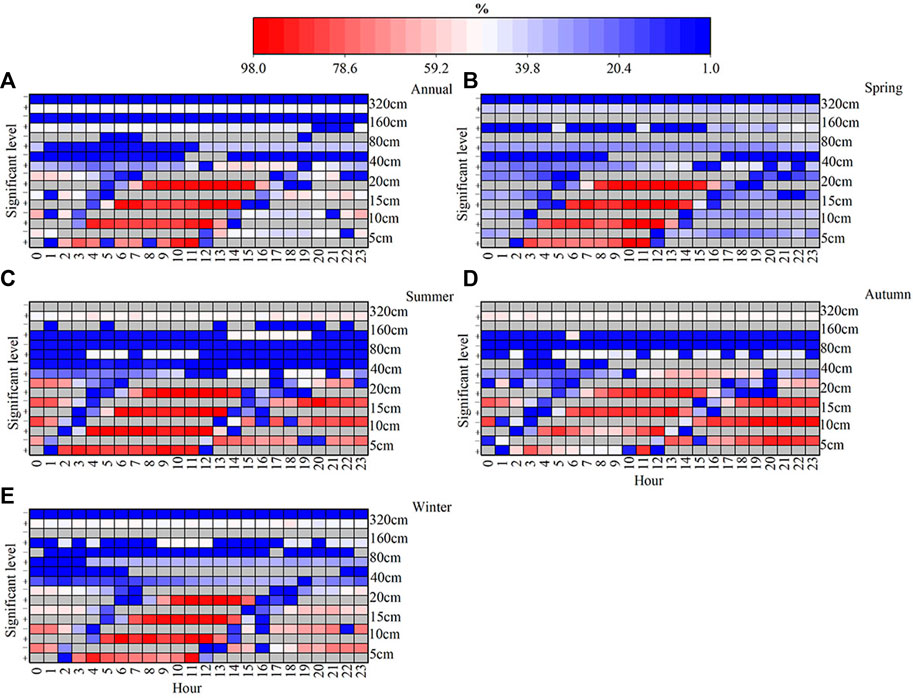
FIGURE 4. Station percentages of annual (A), Spring (B), Summer (C), Autumn (D) and Winter (E) soil temperature change trend at depths of 5–320 cm during 2004–2020 in Yunnan (plus sign indicates significant percentage increase, minus sign indicates significant percentage decrease, and gray shading indicates percentage without significant increase or decrease).
Figure 5 presents the temporal distributions of soil temperature at depths of 5–320 cm on the monthly scale during 2004–2020, which show marked variation. The range of fluctuation of shallow soil temperature (depth: 5–20 cm) is large during February–November, especially at depths of 5–10 cm. Conversely, the deep soil temperature (depth: 40–320 cm) is almost the same every hour without fluctuation, but it also shows different characteristics. The deep soil temperature increases with increase of the soil layer during January–February and November–December, especially during January–February. During April–September, the deep soil temperature decreases with increase of the soil layer. Meanwhile, we note that the trend of monthly soil temperature change is inconsistent with the average soil temperature (Figure 6). The magnitude of the rate of change of the shallow soil temperature (depth: 5–10 cm) fluctuates greatly, while the hourly rate of change of the deep soil temperature varies little, showing a significant trend of increase, especially during April–June and in August and December. Overall, the significant trend of change of hourly soil temperature in January, May–August, and November–December is more obvious than that in other months, whereas the significant trend of change in February is weaker. It can be seen from Figure 7 that the percentage of stations with a significant uptrend or downtrend in soil temperature in shallow layers is higher than that of stations with a significant uptrend or downtrend in deep soil temperature. Shallow soil temperature exhibits an upward trend from February–May, mainly concentrated during 02:00–15:00. In other months, the temperature in each soil layer exhibits a significant uptrend at a higher percentage of stations than in the previous period, and then a significant downtrend at a higher percentage of stations in the subsequent period. Furthermore, the deep soil temperature shows significant increase and decrease in the percentage of stations with little or no significant decrease from January–December in all soil layers.
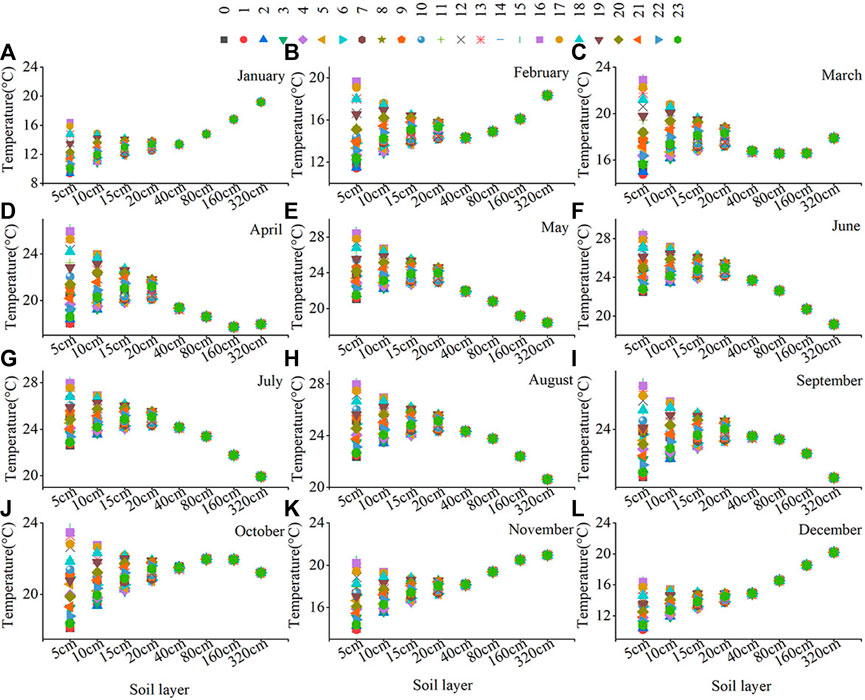
FIGURE 5. January (A), February (B), March (C), April (D), May (E), June (F), July (G), August (H), September (I), October (J), November (K), December (L) hourly average soil temperature during 2004–2020 in Yunnan.
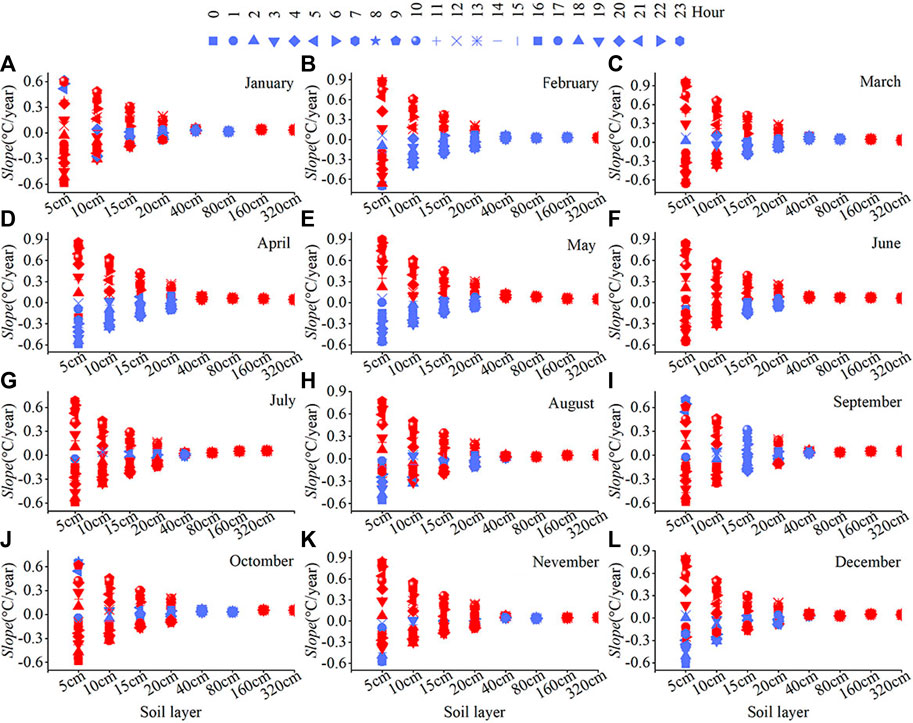
FIGURE 6. January (A), February (B), March (C), April (D), May (E), June (F), July (G), August (H), September (I), October (J), November (K), December (L) hourly average soil temperature slope during 2004–2020 in Yunnan (the red symbol indicates ≤0.05 significant).

FIGURE 7. Station percentages of January (A), February (B), March (C), April (D), May (E), June (F), July (G), August (H), September (I), October (J), November (K), December (L) soil temperature change trend at depths of 5–320 cm during 2004–2020 in Yunnan (plus sign indicates significant percentage increase, minus sign indicates significant percentage decrease, and gray shading indicates percentage without significant increase or decrease).
Considering the 1-km DEM, the 08:00, 14:00, and 20:00 soil temperatures at depths of 5–320 cm averaged over 2004–2020 were interpolated using six types of machine learning (the optimal model, ensemble weights (%), and R2 are detailed in Supplementary Tables S1–S3. Except for a few values of R2 < 0.8, the other values of >0.8 indicated that the interpolation results were ideal and could be used for spatial interpolation). The spatial variation of soil temperature at depths of 5–320 cm is characterized (only the map of the spatial distribution at depth of 5 cm is shown) by lower values in northwestern and northeastern parts of Yunnan Province and higher values in the south, especially in the dry and hot valley areas (Supplementary Figure S1).
Because soil temperature observations at 02:00 and in deeper layers (40–320 cm) are insufficient for further analyses, we investigated the changes in soil temperature during 1961–2020 at three specific times: 08:00; 14:00, and 20:00. As can be seen from Figure 8, the higher values of soil temperature at the three specific times are mainly concentrated in April–September, the highest value in the 10-cm soil layer is at 20:00, and the rate of change of soil temperature at the three times varies less at 10 and 15 cm than at 5 and 20 cm. The magnitudes of the rate of change in soil temperature at the three times at depths of 5–20 cm during May–October (wet season) are smaller than in other months (Supplementary Figure S2), especially from July–September, indicating that the increase in soil temperature during the wet season is smaller than that in the dry season.
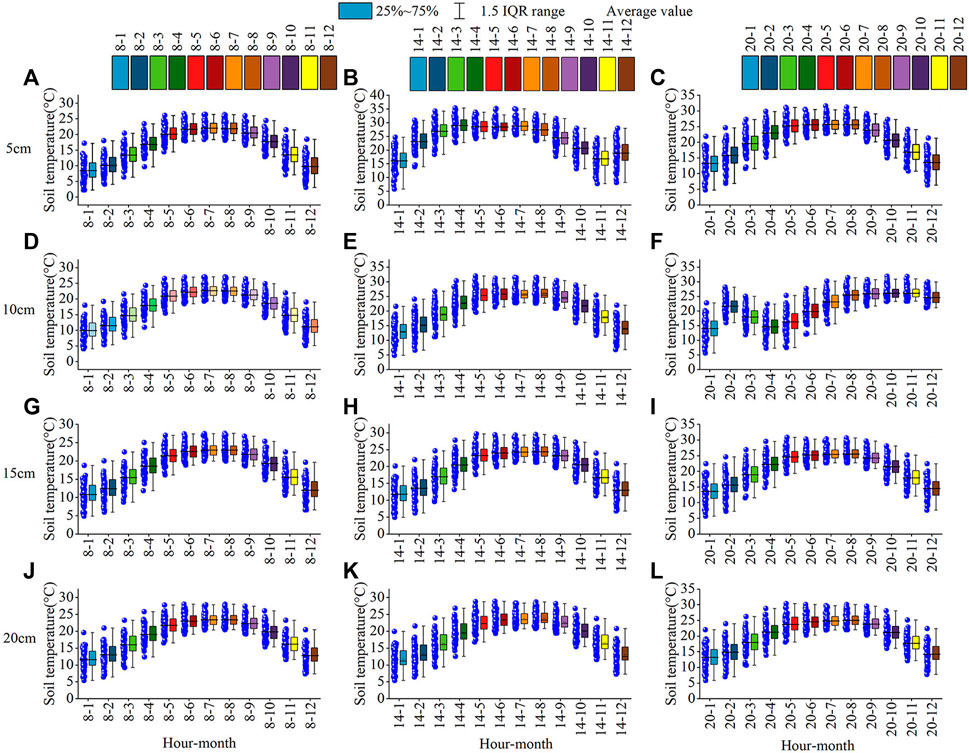
FIGURE 8. Monthly variation in hourly average temperature at depths of 5–20 cm at 08:00, 14:00, and 20:00 in Yunnan during 1961–2020 [(A,D,G,J) denotes at 08:00; (B,E,H,K) denotes at 14:00; (C,F,I,L) denotes at 20:00].
It can be seen from Figure 9 that the annual and seasonal soil temperature increases with increase of the soil layer (average of all station values), and that the values in spring and summer are higher than those in autumn and winter (Figure 9A) at 08:00 during 1961–2020. From the rate of change, it can be seen that the magnitude of fluctuation in winter is larger than that annually and in other seasons at depths of 5–20 cm at 08:00 (Figure 9B). Meanwhile, the annual and seasonal soil temperature decreases with increase of the soil layer (Figure 9C), whereas the trend of change of annual and seasonal soil temperature increases with increase of the soil layer (Figure 9D). Furthermore, the annual and seasonal fluctuations of soil temperature are relatively stable, except in spring and summer when the soil temperature is higher (Figure 9E), while the rate of change of annual and seasonal soil temperature shows an uptrend with increase of the soil layer (Figure 9F). In terms of abrupt change points, annual and seasonal soil temperature show abrupt change mainly in the 1990s and early 2000s at depths of 5–20 cm at 08:00, 14:00, and 20:00 (Supplementary Figure S3).
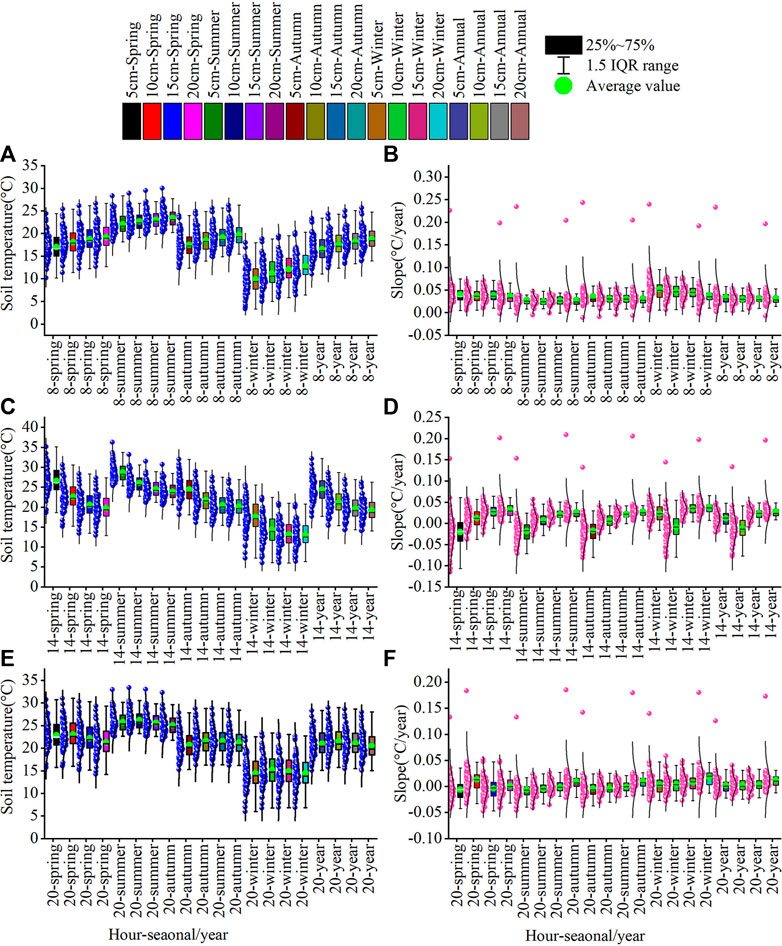
FIGURE 9. Annual and seasonal hourly average temperatures (A,C,E) and slopes (B,D,F) at depths of 5, 10, 15, and 20 cm at 08:00, 14:00, and 20:00 in Yunnan.
The annual and seasonal spatial variation of hourly soil temperature at depths of 5–20 cm at 08:00, 14:00, and 20:00 is the same as that shown in Figure 10 (only the annual spatial variation is shown) during 1961–2020. At 08:00, the percentages of stations with a significant uptrend in the rate of change of annual/spring/summer/autumn/winter hourly soil temperature are 91.5%/80.5%/93.9%/80.5%/87.8%, 82.3%/77.2%/86.1%/77.2%/89.9%, 88.0%/78.7%/82.7%/77.3%/93.3%, and 90.4%/80.8%/90.4%/87.8%/95.9% at depths of 5, 10, 15, and 20 cm, respectively. At 14:00, the percentages of stations with a significant uptrend in the rate of change of annual/spring/summer/autumn/winter hourly soil temperature are 2.4%/3.7%/2.4%/1.2%/2.4%, 36.7%/32.9%/31.6%/26.6%/53.2%, 61.3%/54.7%/66.7%/66.7%/82.7%, and 78.1%/64.4%/76.7%/74.0%/89.0% for depths of 5, 10, 15, and 20 cm, respectively. At 20:00, the percentages of stations with a significant uptrend in the rate of change of annual/spring/summer/autumn/winter hourly soil temperature are 3.7%/6.1%/2.4%/2.4%/2.4%, 6.3%/5.1%/0/0/0, 12.0%/10.7%/4.0%/1.3%/17.3%, and 37.0%/32.9%/23.3%/34.2%/52.1% at depths of 5, 10, 15, and 20 cm, respectively. A significant downtrend is more obvious at depths of 5–10 cm (except annually), and a significant uptrend is more obvious at depths of 15–20 cm annually and seasonally (except in autumn).
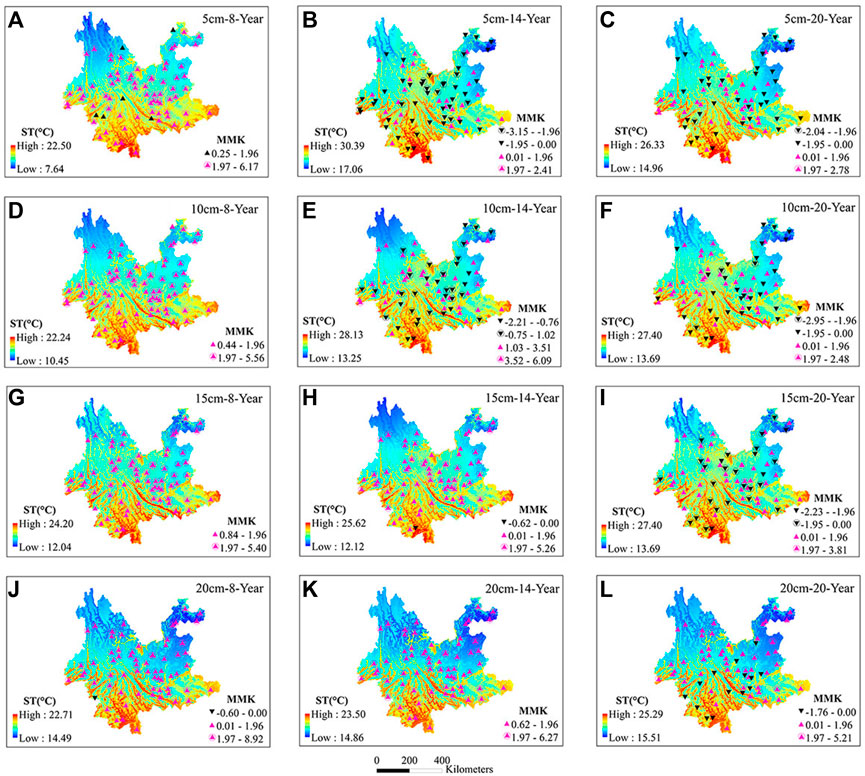
FIGURE 10. Spatial variation of annual hourly average temperature and slope at depths of 5–20 cm at 08:00, 14:00, and 20:00 in Yunnan.
Spatial patterns for the 08:00, 14:00 and 20:00 soil temperatures at depths of 5–20 cm shows in Figure 11. The results of the weighted averages of the six types of machine learning were taken, and then the average value and rate of variation were calculated for elevation zones with 100-m intervals. We found that the average soil temperature decreases with increasing elevation, the average soil temperature decreases at the three specific times, the average soil temperature is higher at 14:00 than at both 08:00 and 20:00 at the depth of 5 cm, and the average soil temperature is higher at 20:00 than at both 08:00 and 14:00 at depths of 10, 15, and 20 cm. Furthermore, the slope of the trend gradually changes from an uptrend to a downtrend at 14:00 and 20:00 with increase of elevation and is mainly insignificant, while the magnitude of the uptrend at 08:00 also decreases with increase of elevation but does not change to a negative trend, and the significant uptrend is mainly concentrated at elevations of 92–2,692 m at 5-cm depth. The magnitude of the uptrend increases with the increase of elevation at 08:00 and 14:00, the significant uptrend is more obvious at 08:00 than at 14:00, and the slope first increases and then changes to a negative trend with the increase of elevation at 20:00 at the depth of 10 cm. The magnitude of the significant uptrend (except in individual lower-elevation zones at 14:00) at 08:00 and 14:00 increases with the increase of elevation, and the slope shows an upward trend with a small range of fluctuation (except in elevation zones in the range 92–692 m, which display a downtrend) that is insignificant at 20:00 at depth of 15 cm. The magnitude of the significant uptrend (insignificant for elevation zones in the range 892–1992 m) decreases for elevation zones in the range 92–1892 m and then increases with further increase in elevation at 08:00, 14:00, and 20:00 at depth of 20 cm.
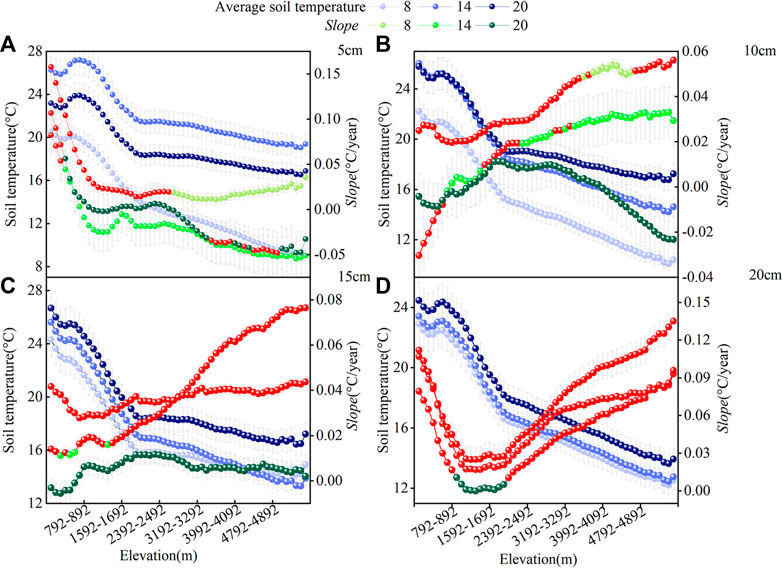
FIGURE 11. Average value and slope soil temperature at depths of 5 (A), 10 (B), 15 (C), 20 (D) cm in different elevation zones from 1961 to 2020 (the red symbol indicates ≤0.05 significant).
We further investigated the percentages of pixels with significant uptrend and downtrends at different elevations (Figure 12). The results show significant decrease in percentages with the increase of elevation (except elevation zones in the range 192–2192 m at 08:00 and 92–582 m at 14:00 and 20:00) at 08:00, 14:00, and 20:00 at depth of 5 cm, significant increase at 08:00 and 14:00 (except elevation zones in the range 92–1,392 m), and significant decrease at 20:00 at depth of 10 cm. The percentages mainly reflect significant increase at 08:00, 14:00, and 20:00 (except significant decrease at 20:00 at depths of 15 and 20 cm in elevation zones in the range 992–1892 m) at depths of 15 and 20 cm.
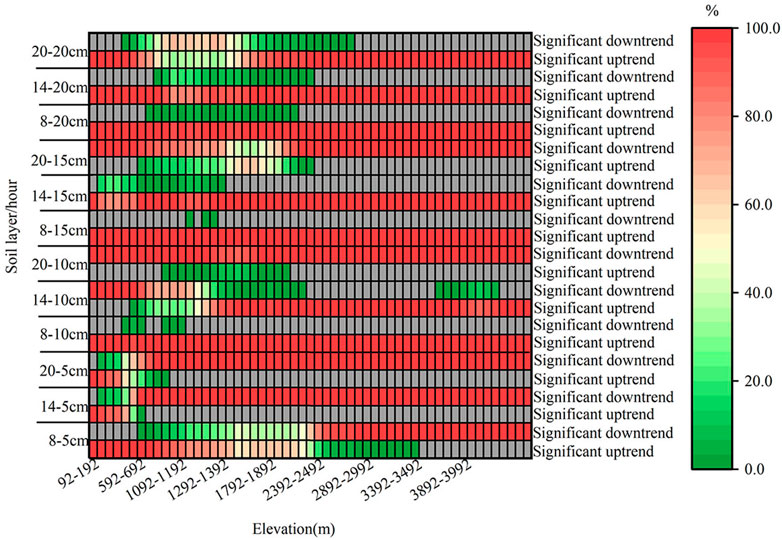
FIGURE 12. Percentage of 5–20-cm soil temperatures with significant uptrend and downtrend at different elevations from 1961 to 2020 (gray shaded area indicates the percentage without significant uptrend and downtrend).
Figure 13 shows that the beginning date has a significant trend of advance with a rate of −0.22/year for accumulated soil temperature of 12°C and −0.24/year for accumulated soil temperature of 14°C, while the end date has a significant trend of delay with a rate of 0.13/year for accumulated soil temperature of 12°C and 0.18/year for accumulated soil temperature of 14°C. The duration shows an obvious trend of extension with a rate of 0.33 days/year for accumulated soil temperature of 12°C and 0.40 days/year for accumulated soil temperature of 14°C. The accumulated soil temperature shows a significant uptrend with a rate of 11.76°C/year for accumulated soil temperature of 12°C and 12.75°C/year for accumulated soil temperature of 14°C. Meanwhile, the years with abrupt changes in the trends of the beginning date, end date, duration, and accumulated soil temperature of 12 and 14°C are mainly concentrated during 1993–1997.
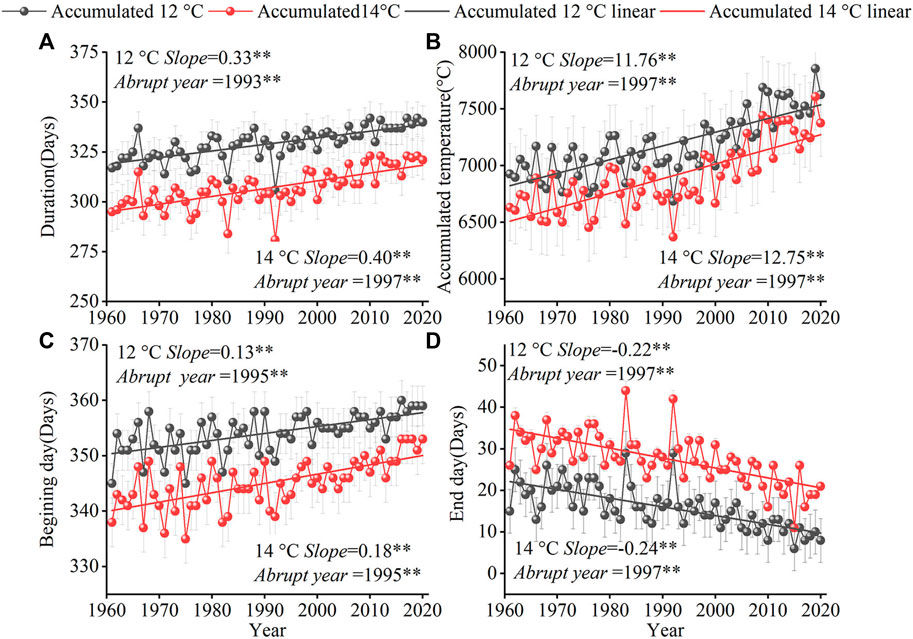
FIGURE 13. Temporal variation of (A) beginning date, (B) end date, (C) duration, and (D) accumulated temperature of daily soil temperature ≥12 and 14°C at 5-cm depth.
From the perspective of spatial distribution (Figure 14), except in Northwest and Northeast Yunnan Province, the beginning date for accumulated soil temperature of 12°C (14°C) is mostly concentrated in the period January 3–10 (April 7); the latest date is March 4 at Weixi station in Northwest Yunnan. The percentage of stations with a significant downtrend is 51.2% (70.7%) for accumulated soil temperature of 12°C (14°C). Furthermore, the higher value areas of end date, duration, and accumulated soil temperature are mainly concentrated in the dry hot valley areas in northern, central, and southern parts of Yunnan Province. Specifically, the earliest end date, shortest duration, and lowest accumulated soil temperature occur in Northwest Yunnan Province (Wei station), and the latest end date, longest duration, and highest accumulated soil temperature occur in Southwest Yunnan Province (the end date is the same for18 (6) stations, the duration is same for 16 (2)stations, the highest accumulated soil temperature is at Yuanjiang station (dry hot valley), and lowest accumulated soil temperature is at Weixi station for accumulated soil temperature of 12°C (14°C). The percentage of stations with a significant uptrend for the end date is 36.6% (48.8%), the percentage of stations with a significant uptrend for duration is 52.4% (59.8%), and the percentage of stations with a significant uptrend for accumulated soil temperature is 76.8% (73.2%) for accumulated soil temperature of 12°C (14°C).
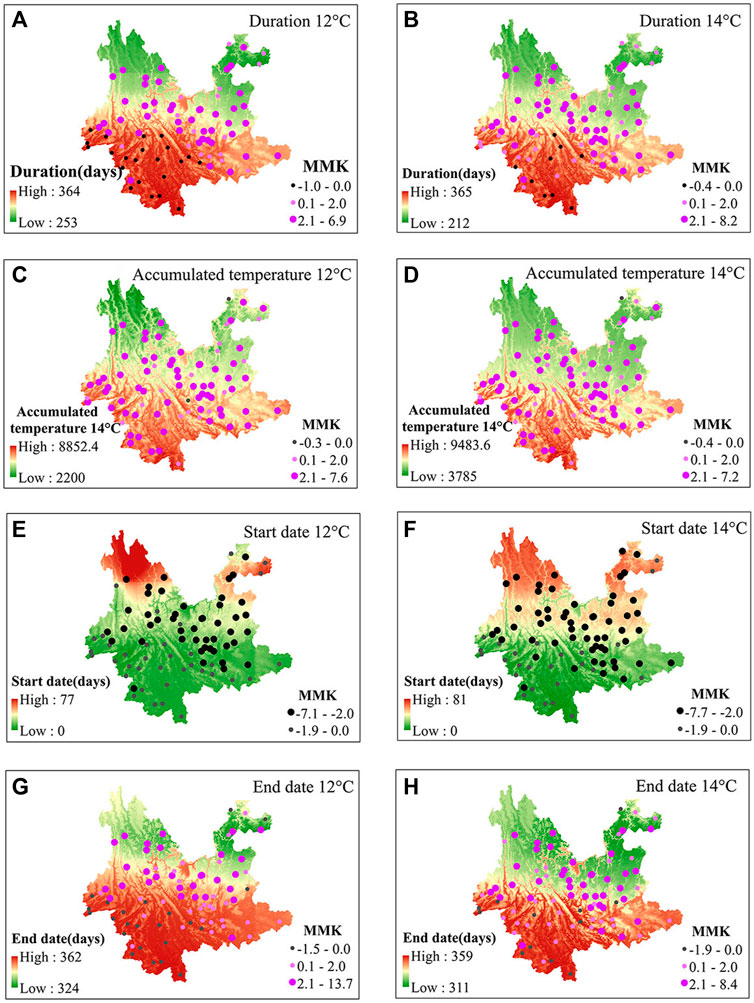
FIGURE 14. Spatial variation of (A,B) beginning date, (C,D) end date (E,F) duration, and (G,H) accumulated temperature of daily soil temperature ≥12 and 14°C at 5-cm depth.
Figure 15 shows the Spearman correlation coefficients for 00:00–23:00 soil temperature with climatic factors during 2004–2020. The results indicate that soil temperature has significant negative correlation with latitude and elevation. The coefficient of correlation with elevation is highest, but there is significant positive correlation (>0.9) with surface temperature (AST0, MaxAST0, and MinAST0) and air temperature (AT, MaxAT, and MinAT), whereas no correlation is found with relative humidity (RH) (depth: 40–320 cm) and wind speed (WS) (depth: 5–320 cm). We also note significant positive correlation of soil temperature at depths of 5–20 cm with total precipitation (TP) and daytime precipitation (DP) (except 13:00–18:00 at 5-cm depth), and at depths of 40 and 320 cm with DP.
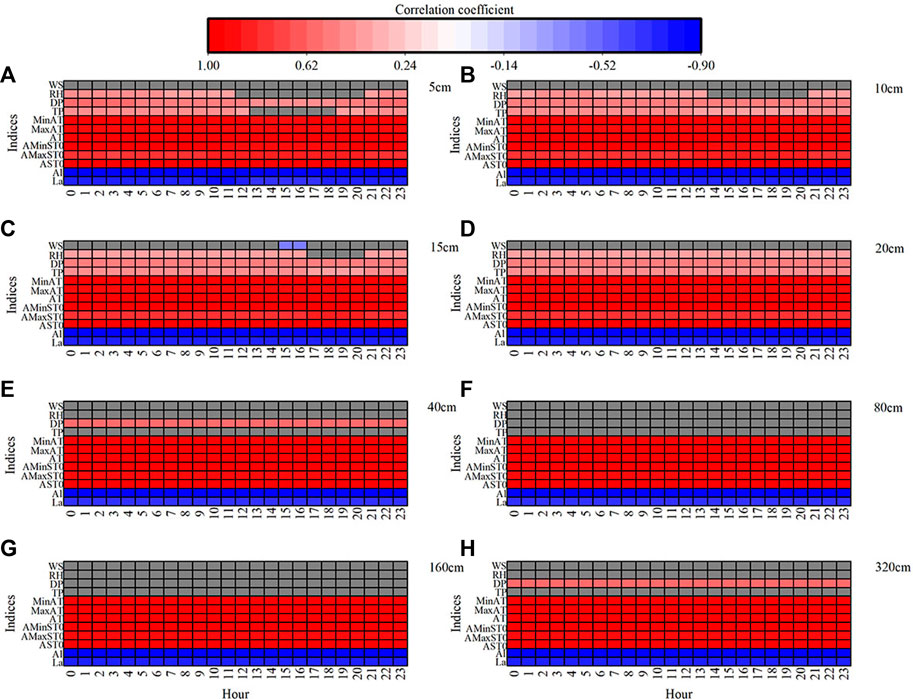
FIGURE 15. Spearman correlation coefficients between soil temperature at depths of 5 (A), 10 (B), 15 (C), 20 (D), 40 (E), 80 (F), 160 (G), 320 (H) cm and climatic factors at 00:00–23:00 for average values of 2004–2020 (La, latitude; Al, altitude; AST0, 0 cm average surface temperature; MaxST0, 0 cm average maximum surface temperature; MinST0, 0 cm average minimum surface temperature; AT, average air temperature; MaxAT, average maximum air temperature; MinAT, average air minimum temperature; TP, total precipitation; DP, daytime precipitation; RH, relative humidity; WS, average wind speed; gray shading indicates no correlation).
Similar to the results for 00:00–23:00 (Figure 15), soil temperature at depths of 5–20 cm at 08:00, 14:00, and 20:00 has significant negative correlation with latitude and elevation, weaker significant correlation with longitude annually and seasonally for some soil layers, significant positive correlation with surface temperature (AST0, Max AST0, and Min AST0) and air temperature (AT, MaxAT, and MinAT), significant negative correlation with WS annually and seasonally, and insignificant correlation with SD (except in autumn at 5-cm depth). Overall, significant correlation with precipitation (TP, DP, and nighttime precipitation (NP) and RH is not obvious, except in some soil layers at individual stations annually and seasonally (Supplementary Figure S4).
Furthermore, we also investigated the correlation between the soil temperature of different soil layers and climatic elements during 00:00–23:00 during 2004–2020 and 8:00, 14:00, 20:00 during 1961–2020 on the station scale. Supplementary Table S1 shows the number of stations with the largest significant positive correlation (negative correlation in parentheses) during 00:00–23:00. Similar to Figure 15, the results show that the soil temperature of the different soil layers has the largest significant positive correlation with surface temperature (AST0, MaxST0, and MinST0), air temperature (AT, ATAMax, and ATAMin), TP, and WS in comparison with other climatic elements during 00:00–23:00 annually and seasonally (Supplementary Figure S4), and that there are more stations with large significant positive correlation, especially at depths of 5–20 cm during 2004–2020. Moreover, SD, DP, and NP have the largest significant negative correlation at most stations; RH has the largest significant correlation at a few stations, but it does not appear in all soil layers. The largest significant correlations at 08:00, 14:00, and 20:00 during 1961–2020 are broadly the same as during 00:00–23:00 (Supplementary Table S2); however, TP has large significant correlation at almost no stations. Contrary to the correlations during 00:00–23:00, SD has more stations with large significant positive correlation, WS shows more stations with large negative correlation, and RH has large significant positive correlation at most stations in spring and in all soil layers (annual and in other seasons, stations with the most significant negative correlation do not appear in all soil layers).
A change in soil temperature might alter the physical properties of soil, which could then impart substantial impact on the physical, chemical, and biological processes occurring both above and below ground (Davidson and Janssens., 2006; Giardina et al., 2014; Hartley., 2014; Zhang et al., 2016; Li et al., 2022). Understanding the variations of soil temperature is of great importance for assessing energy exchange between the soil and the atmosphere in relation to climate change (Du et al., 2017; Shen et al., 2020; Liu et al., 2022; Oogathoo et al., 2022; Song et al., 2022). This study found a significant seasonal pattern contrary to the variation of average shallow and deep soil temperature, i.e., it decreases (increases) with increasing soil depth in spring and summer (autumn and winter) at 00:00–23:00. This finding is the same as that reported for Jiangsu Province, China (Shi and Chen, 2021), and eastern Australia (Knight et al., 2018) for daily soil temperature, showing that soil temperature is sensitive to short-term weather processes in terms of land–atmosphere exchange. In spring and summer, the land surface acts as an energy source and the deep soil acts as an energy receiver; in autumn and winter, their relations are reversed (Hu and Feng, 2003). Such reversed vertical energy processes result in the reversal of the vertical pattern of soil temperature (Shi and Chen, 2021). Previous research based on the daily soil temperature shallow and deep soil temperature revealed rising soil temperatures annually and seasonally in eastern Australia (Knight et al., 2018), metropolitan cities of Korea (Cheon et al., 2014), Croatia (Sviličić et al., 2016), the Tibetan Plateau, China (Zhu et al., 2018; Fang et al., 2019; Wang et al., 2020), Jiangsu Province (Shi et al., 2021) and China (Wang et al., 2018, 2021; Shi et al., 2021), and our results are consistent. Importantly, we found that the trend of change in shallow soil temperature (0–20 cm) fluctuates greatly, while the marked trend of change in deep soil temperature (40–320 cm) is almost the same at annual, seasonal, and monthly scales on average during the time series. However, the trend of change in annual, seasonal, and monthly hourly shallow soil temperature (0–20 cm) is obvious for most stations, whereas the corresponding changes in deep soil temperature (40–320 cm) are not, which means that deeper strata are probably affected less by meteorological fluctuations in Yunnan Province. Furthermore, the trend of spatiotemporal change in shallow soil temperature is very obvious. Therefore, it is necessary to consider the increase in soil respiration and the change in carbon sinks in aboveground and underground biomass when calculating the carbon balance of an ecosystem (Zhang et al., 2016), especially in Yunnan Province, which has rich biodiversity.
We also revealed the vertical variation of the average soil temperature with elevation. The average soil temperature decreases at the three specific times (08:00, 14:00, and 20:00), and the average soil temperatures are different at depths of 5 and 10–20 cm. Moreover, the average soil temperatures are higher at 14:00 than at 08:00 and 20:00 at 5-cm depth, whereas the values are higher at 20:00 than at 08:00 and 14:00 at depths of 10–20 cm. The increase in soil temperature in different soil layers with elevation is significant except at 5-cm depth, and rate of change is significant at 08:00 and 14:00 at depths of 15–20 cm; the change is significant at depth of 20 cm in all elevation zones, except at some elevations at 20:00. We first revealed the vertical gradient change in shallow soil temperature in low-latitude highland areas (Yunnan Province), which has not been reported before and might have some relevance for regional climate modeling and ecosystem modeling.
Different plant species have their own biological minimum during their growth cycle, germination, and emergence, which is very important for growth (Sviličić et al., 2016). If soil temperature drops below a certain threshold, the amounts of water and nutrients that roots can absorb decrease, which can lead to delay in certain developmental stages of plants (Porter and Gawith, 1999; Sviličić et al., 2016). Soil temperature accounted for approximately 90% of the change in net photosynthesis (Schwarz et al., 1997). Similarly, soil temperature is associated with limited underground plant (i.e., root) growth and development, which accounts for 50%–90% of all terrestrial plant growth (Ruess et al., 2003; Steinaker and Wilson, 2008). Therefore, soil temperature plays a key role in crop growth. Furthermore, a stable soil temperature above 12°C–14°C is suitable for sowing spring maize (Du et al., 2019). Meanwhile, Leeper et al. (2021) also highlighted that start of season estimates based on 5-cm soil temperature not only had lower measures of error than the traditional start of season based on 0-cm surface temperature, but also were a better match with the start of season based on NDVI for 41.3% (27.2%) of stations in years when 5-cm soil temperature (air temperature) measurements were available. In this study, we found that the start date has advanced, the end date has become delayed, duration has extended, and the critical accumulated soil temperature of ≥12 and 14°C at 5-cm depth has an upward trend, which are characteristics conducive to the emergence of crops and to the growth of strong seedlings and roots. For example, such changes can advance the date of sowing of early spring maize and support robust growth (Du et al., 2019). There is no doubt that the 5-cm soil temperature has undergone substantial change, and that plant phenology, vegetation shift, niche variety, and ecosystem stability are all likely to be impacted by soil warming, together with other ecological processes. This finding could support the government of Yunnan Province in adjusting the local agricultural structure and reasonably formulating appropriate sowing dates for corn, potatoes, and other crops. However, higher soil temperatures can be detrimental to some agricultural crops, causing many plant diseases and pests to become activated and microbiological activity to become reduced (Sviličić et al., 2016).
Air temperature and precipitation are the main factors that determine the variation in soil temperature (Helama et al., 2011; Yang et al., 2018; Zhang et al., 2021; Zhao et al., 2021). However, large-scale atmospheric or boundary conditions might contribute to the change in nighttime soil surface temperatures (Wang et al., 2018). We found that soil temperature has significant negative correlation with elevation and latitude at 00:00–23:00 during 2004–2020 and at 08:00, 14:00, and 20:00 annually and seasonally during 1961–2020. Conversely, Zhu et al. (2018), Cuo et al. (2013), and You et al. (2010) all argued that the correlation between the uptrend in soil temperature and station elevation is non-significant. Albergel et al. (2015) found that incorporating orography data in a forecast system had strong impact on the outcomes of the performance evaluation of soil temperature forecasts. This seems contradictory and the discrepancy might be attributable to different dataset types, different methods, and different study periods (Pepin et al., 2015; Zhu et al., 2018), and more obvious spatial heterogeneity, all of which need further study. We found significant positive correlation between soil temperature and both surface temperature (AST0, AMaxST0, and AMinST0) and air temperature (AT, ATAMax, and ATAMin), and between soil temperature at the majority of stations and both WS and SD at 00:00–23:00 and at 08:00, 14:00, and 20:00, but with the opposite characteristics. Most stations have significant negative (positive) correlation with SD (WS) at 00:00–23:00 at depths of 5–320 cm, whereas most stations have significant positive (negative) correlation with SD (WS) at 08:00, 14:00, and 20:00 at depths of 5–20 cm on annual and seasonal timescales. Furthermore, the correlation between soil temperature and precipitation (TP, DP, and NP) and RH is weaker at 00:00–23:00 (except TP) and at 08:00, 14:00, and 20:00 on annual and seasonal timescales. Significant correlation with air temperature and snow cover was also found in China (Wang et al., 2018; Zhang et al., 2021); however, on the Tibetan Plateau, Fang et al. (2019) identified the central role of air temperature in soil warming, whilst also highlighting that the relationship between soil temperature and precipitation is complicated owing to the presence of frozen ground in the area. Higher precipitation also induced higher soil temperature (0–320 cm), while inhibiting the impact of the freeze–thaw process on soil temperature in summer during 1960–2014 for 66 stations. Wang et al. (2020) found that soil temperature (0–20 cm) variability was strongly correlated with the change in air temperature but weakly correlated with precipitation during 1965–2014 for 56 stations. It can be seen that, even in the same area, different results will be obtained by revealing those factors that affect the change in temperature of different soil layers. Therefore, it remains necessary to further explore the driving factors of temperature change in different soil layers in different regions using various methods.
One of the limitations of this study is the uncertainty regarding the influencing factors. For example, even for the same location (Tibetan Plateau), the results obtained can differ from those reported in the literature (Fang et al., 2019; Wang et al., 2020). Furthermore, we used six machine learning methods to interpolate the spatial distribution of hourly soil temperature, and the interpolation parameters are relatively ideal (please see Supplementary Material S1); however, other influencing factors such as snow cover and vegetation also need further consideration.
At the same time, more stations also need to further collect, so that the interpolation is more accurate. Additionally, Wang et al. (2018) indicated that the effects of urbanization on soil temperature are small, whereas Cheon et al. (2014) revealed that the soil temperature in metropolitan cities increases with the increase of anthropogenic urban heat. Therefore, in future research, many other variables such as land use, the urban heat island, snow cover, vegetation growth, the soil microbial community, and soil properties should also be considered. Meanwhile, field studies should be conducted to improve our understanding of the response of soil temperature to climate change (Wang et al., 2020).
For the first time, we revealed the spatiotemporal variations of soil temperature at depths of 5–320 cm during 00:00–23:00 during 2004–2020 and at three specific times (08:00, 14:00, and 20:00) during 1961–2020, and the possible influencing factors in the low-latitude highlands of Yunnan Province, China. The main conclusion derived are as follows.
1) Synchronous with global change, hourly soil temperature shows an obvious warming trend, especially the deep soil temperature (40–320 cm) at annual, seasonal, and monthly scales. Hourly soil temperature at different depths showed significant uptrend at 00:00–23:00 during 2004–2020 at depths of 5–320 cm and at 08:00, 14:00, and 20:00 at depths of 5–20 cm during 1961–2020 annually, seasonally, and monthly.
2) The hourly average soil temperature at 0–20 cm at 08:00, 14:00, and 20:00 showed a consistent trend of decrease with increase in elevation, but the trend of change was not synchronous. With increasing elevation, average soil temperature decreased at 08:00, 14:00, and 20:00 at depths of 5–20 cm during 1961–2020. The trend of change with increasing elevation showed a significant uptrend at 08:00 and 14:00 at depths of 10–20 cm, which was especially significant at depth of 20 cm at 08:00, 14:00, and 20:00 in all elevation zones (except 892–1992 m).
3) The critical accumulated soil temperature of ≥12 and 14°C at 5-cm depth showed an uptrend during 1961–2020, and the start date was advanced, the end date was delayed, and the duration was extended. This might have heterogeneous impact on the crops and ecosystem function in Yunnan Province.
4) Elevation and latitude have significant negative correlation with soil temperature. At most stations, air temperature (AT, ATAMax, and ATAMin), surface temperature (AST0, AMaxST0, and AMinST0), and AWS have significant positive correlation with soil temperature.
Based on station data, this study revealed for the first time the hourly soil temperature changes in low-latitude highland areas, and the results could provide reference for analysis, comparison, and prediction of hourly soil temperature changes in other similar areas in the context of climate change.
The original contributions presented in the study are included in the article/Supplementary Material, further inquiries can be directed to the corresponding author.
QC and MZ: Conceptualization, methodology, writing–original draft, supervision, funding acquisition. HJ and QC: Methodology, validation. HJ and YR: Data curation, formal analysis. QC and MZ: Writing–review and editing.
This study was supported by the Yunnan Fundamental Research Projects (Grant No. 202201AU070064), Yunnan Innovative Research Team (Grant No. 202005AE160017), and Strategic Priority Research Program of the Chinese Academy of Sciences (Grant No. XDA20100104).
The authors declare that the research was conducted in the absence of any commercial or financial relationships that could be construed as a potential conflict of interest.
All claims expressed in this article are solely those of the authors and do not necessarily represent those of their affiliated organizations, or those of the publisher, the editors and the reviewers. Any product that may be evaluated in this article, or claim that may be made by its manufacturer, is not guaranteed or endorsed by the publisher.
The Supplementary Material for this article can be found online at: https://www.frontiersin.org/articles/10.3389/fenvs.2022.1091985/full#supplementary-material
Albergel, C., Dutra, E., Muñoz-Sabater, J., Haiden, T., Balsamo, G., Beljaars, A., et al. (2015). Soil temperature at ECMWF: An assessment using ground-based observations. J. Geophys. Res. Atmos. 120, 1361–1373. doi:10.1002/2014JD022505
Bai, Y., Scott, T. A., and Min, Q. (2014). Climate change implications of soil temperature in the Mojave Desert, USA. Front. Earth Sci. 8, 302–308. doi:10.1007/S11707-013-0398-3
Baldocchi, D. D., Black, T. A., Curtis, P., Falge, E., Fuentes, J. D., Granier, A., et al. (2005). Predicting the onset of net carbon uptake by deciduous forests with soil temperature and climate data: A synthesis of FLUXNET data. Int. J. Biometeorol. 49, 377–387. doi:10.1007/s00484-005-0256-4
Cheon, J. Y., Ham, B. S., Lee, J. Y., Park, Y. Y., and Lee, K. K. (2014). Soil temperatures in four metropolitan cities of Korea from 1960 to 2010: Implications for climate change and urban heat. Environ. Earth Sci. 71, 5215–5230. doi:10.1007/S12665-013-2924-8
Chudinova, S. M., Frauenfeld, O. W., Barry, R. G., Zhang, T. J., and Sorokovikov, V. A. (2006). Relationship between air and soil temperature trends and periodicities in the permafrost regions of Russia. J. Geophys. Res. 111, F02008. doi:10.1029/2005JF000342
Cuo, L., Zhang, Y. X., Wang, Q. C., Zhang, L. L., Zhou, B. R., Hao, Z. C., et al. (2013). Climate change on the northern Tibetan Plateau during 1957-2009: Spatial patterns and possible mechanisms. J. Clim. 26, 85–109. doi:10.1175/JCLI-D-11-00738.1
Curiel, Y. J., Baldocchi, D. D., Gershenson, A., Goldstein, A., Misson, L., and Wong, S. (2007). Microbial soil respiration and its dependency on carbon inputs, soil temperature and moisture. Glob. Chang. Biol. 13, 2018–2035. doi:10.1111/J.1365-2486.2007.01415.X
Davidson, E. A., and Janssens, I. A. (2006). Temperature sensitivity of soil carbon decomposition and feedbacks to climate change. Nature 440, 165–173. doi:10.1038/nature04514
Du, J., Hu, J., and Nimaji, C. (2019). Spatial-temporal change of mean soil temperature and its critical temperature at 5 cm depth in the region of the Yarlung Zangbo River and its two tributaries of Tibet during 1981-2017. Acta. Geogr. Sin. 74, 1821–1834. doi:10.11821/DLXB201909009
Du, J., Wang, K., Wang, J., and Ma, Q. (2017). Contributions of surface solar radiation and precipitation to the spatiotemporal patterns of surface and air warming in China from 1960 to 2003. Atmos. Chem. Phys. 17, 4931–4944. doi:10.5194/acp-17-4931-2017
Fang, X. W., Luo, S. Q., Lyu, S., Cheng, C., Li, Z. G., and Zhang, S. B. (2021). Numerical modeling of the responses of soil temperature and soil moisture to climate change over the Tibetan Plateau, 1961–2010. Int. J. Climatol. 41, 4134–4150. doi:10.1002/JOC.7062
Fang, X., Luo, S., and Lyu, S. (2019). Observed soil temperature trends associated with climate change in the Tibetan Plateau, 1960–2014. Theor. Appl. Climatol. 135, 169–181. doi:10.1007/S00704-017-2337-9
Giardina, C. P., Litton, C. M., Crow, S. E., and Asner, G. P. (2014). Warming-related increases in soil CO2 efflux are explained by increased below-ground carbon flux. Nat. Clim. Chang. 4, 822–827. doi:10.1038/nclimate2322
Hartley, I. (2014). Resisting climate change. Nat. Clim. Chang. 4, 760–761. doi:10.1038/nclimate2356
Helama, S., Tuomenvirta, H., and Venäläinen, A. (2011). Boreal and subarctic soils under climatic change. Glob. Planet. Change 79 (1-2), 37–47. doi:10.1016/J.GLOPLACHA.2011.08.001
Holmes, T. R. H., Owe, M., De-Jeu, R. A. M., and Kooi, H. (2008). Estimating the soil temperature profile from a single depth observation: A simple empirical heatflow solution. Water Resour. Res. 44, W02412. doi:10.1029/2007WR005994
Hu, G. J., Zhao, L., Li, R., Wu, X. D., Wu, T. H., Xie, C. W., et al. (2019). Variations in soil temperature from 1980 to 2015 in permafrost regions on the Qinghai-Tibetan Plateau based on observed and reanalysis products. Geoderma 337, 893–905. doi:10.1016/J.GEODERMA.2018.10.044
Hu, Q., and Feng, S. (2003). A daily soil temperature dataset and soil temperature climatology of the contiguous United States. J. Appl. Meteor. 42, 1139–1156. doi:10.1175/1520-0450(2003)042<1139:adstda>2.0.co;2
Jacobs, A. F. G., Heusinkveld, B. G., and Holtslag, A. A. M. (2011). Long-term record and analysis of soil temperatures and soil heat fluxes in a grassland area, The Netherlands. Agric. For. Meteorol. 151, 774–780. doi:10.1016/J.AGRFORMET.2011.01.002
Knight, J. H., Minasny, B., McBratney, A. B., Koen, T., and Murphy, B. (2018). Soil temperature increase in eastern Australia for the past 50 years. Geoderma 313, 241–249. doi:10.1016/J.GEODERMA.2017.11.015
Kurylyk, B. L., MacQuarrie, K. T. B., and McKenzie, J. M. (2014). Climate change impacts on groundwater and soil temperatures in cold and temperate regions: Implications, mathematical theory, and emerging simulation tools. Earth. Sci. Rev. 138, 313–334. doi:10.1016/J.EARSCIREV.2014.06.006
Leeper, R. D., Matthews, J. L., Cesarini, M. S., and Bell, J. E. (2021). Evaluation of air and soil temperatures for determining the onset of growing season. JGR. Biogeosciences 126, e2020JG006171. doi:10.1029/2020jg006171
Li, K., Zhang, J., Wu, L., Yang, K., and Li, S. (2022). The role of soil temperature feedbacks for summer air temperature variability under climate change over East Asia. Earth's. Future 10, e2021EF002377. doi:10.1029/2021EF002377
Linderholm, H. W. (2006). Growing season changes in the last century. Agric. For. Meteorol. 137, 1–14. doi:10.1016/j.agrformet.2006.03.006
Liu, B., Henderson, M., Wang, L., Shen, X., Zhou, D., and Chen, X. (2017). Climatology and trends of air and soil surface temperatures in the temperate steppe region of North China. Int. J. Climatol. 37, 1199–1209. doi:10.1002/JOC.5076
Liu, B., Zhou, W., Henderson, M., Sun, Y., and Shen, X. (2022). Climatology of the soil surface diurnal temperature range in a warming world: Annual cycles, regional patterns, and trends in China. Earth's. Future 10, e2021EF002220. doi:10.1029/2021EF002220
Luo, D., Jin, H., Lü, L., and Zhou, J. (2016). Spatiotemporal changes in extreme ground surface temperatures and the relationship with air temperatures in the Three-River Source Regions during 1980–2013. Theor. Appl. Climatol. 123, 885–897. doi:10.1007/S00704-015-1543-6
Ma, S. Y., Zhang, S. Q., Wang, N. L., Chang, H., and Wang, X. (2021). Prolonged duration and increased severity of agricultural droughts during 1978 to 2016 detected by ESA CCI SM in the humid Yunnan Province, Southwest China. Catena 198, 105036. doi:10.1016/J.CATENA.2020.105036
Mann, H. B. (1945). Nonparametric tests against trend. Econometrica 13, 245–259. doi:10.2307/1907187
Oogathoo, S., Houle, D., Duchesne, L., and Kneeshaw, D. (2022). Evaluation of simulated soil moisture and temperature for a Canadian boreal forest. Agric. For. Meteorol. 323, 109078. doi:10.1016/j.agrformet.2022.109078
Pepin, N., Bradley, R. S., Diaz, H. F., Baraer, E. B., Caceres, N., Forsythe, H., et al. (2015). Elevation-dependent warming in mountain regions of the world. Nat. Clim. Chang. 5, 424–430. doi:10.1038/NCLIMATE2563
Pettitt, A. N. (1979). A non-parametric approach to the change-point problem. Appl. Stat. 28, 126–135. doi:10.2307/2346729
Porter, J. R., and Gawith, M. (1999). Temperatures and the growth and development of wheat: A review. Eur. J. Agron. 10, 23–36. doi:10.1016/S1161-0301(98)00047-1
Qian, B. D., Gregorich, E. G., Gameda, S., Hopkins, A. W., and Wang, X. L. (2011). Observed soil temperature trends associated with climate change in Canada. J. Geophys. Res. 116, D02106. doi:10.1029/2010JD015012
Ruess, R. W., Hendrick, R., Burton, A. J., Pregitzer, K. S., Sveinbjornsson, B., Allen, M. F., et al. (2003). Coupling fine root dynamics with ecosystem carbon cycling in black spruce forests of interior Alaska. Ecol. Monogr. 73 (4), 643–662. doi:10.1890/02-4032
Schwarz, P., Fahey, T. J., and Dawson, T. E. (1997). Seasonal air and soil temperature effects on photosynthesis in red spruce (Picea rubens) saplings. Tree Physiol. 17 (3), 187–194. doi:10.1093/treephys/17.3.187
Shen, X., Liu, B., Jiang, M., and Lu, X. (2020). Marshland loss warms local land surface temperature in China. Geophys. Res. Lett. 47 (6), e2020GL087648. doi:10.1029/2020gl087648
Shi, X., and Chen, J. (2021). Trends in the differences between homogenized ground surface temperature and surface air temperature in China during 1961–2016 and its possible causes. Theor. Appl. Climatol. 144, 41–54. doi:10.1007/S00704-021-03531-1
Shi, X., Wang, G., Chen, T., Li, S., Lu, J., and Hagan, D. F. T. (2021). Long-term changes in layered soil temperature based on ground measurements in Jiangsu Province, China. Int. J. Climatol. 41 (5), 2996–3009. doi:10.1002/joc.7001
Song, Y., Huang, A., and Chen, H. (2022). The persistence and reemergence of atmospheric anomaly signals in soil temperature. JGR. Atmos. 127, e2022JD037218. doi:10.1029/2022JD037218
Steinaker, D. F., and Wilson, S. D. (2008). Scale and density dependent relationships among roots, mycorrhizal fungi and collembola in grassland and forest. Oikos 117 (5), 703–710. doi:10.1111/j.0030-1299.2008.16452.x
Sviličić, P., Fra, G., Mandića, D., and Smolić, Ante. (2016). Soil temperature regime and vulnerability due to extreme soil temperatures in Croatia. Theor. Appl. Climatol. 126, 247–263. doi:10.1007/s00704-015-1558-z
Theil, H. (1992). A rank-invariant method of linear and polynomial regression analysis. Adv. Studies” Theor. And. Appl. Econ. 23, 345–381. doi:10.1007/978-94-011-2546-8_20
Wang, L., Henderson, M., Liu, B., Shen, X. J., Chen, X. W., Lian, L. Y., et al. (2018). Maximum and minimum soil surface temperature trends over China, 1965–2014. J. Geophys. Res. Atmos. 123, 2004–2016. doi:10.1002/2017JD027283
Wang, X. Q., Chen, R. S., Han, C. T., Yang, Y., Liu, J. F., Liu, Z. W., et al. (2021). Soil temperature change and its regional differences under different vegetation regions across China. Int. J. Climatol. 41, E2310–E2320. doi:10.1002/JOC.6847
Wang, X., Chen, R., Han, C., Yang, Y., Liu, J., Liu, Z., et al. (2020). Response of shallow soil temperature to climate change on the Qinghai–Tibetan Plateau. Int. J. Climatol. 41 (1), 1–16. doi:10.1002/joc.6605
Wu, S. H., Pan, T., Cao, J., He, D. M., and Xiao, Z. N. (2012). Barrier-corridor effect of longitudinal range-gorge terrain on monsoons in Southwest China. Geogr. Res. 31, 1–13. doi:10.1007/s11783-011-0280-z
Yang, Y., Wu, Z. F., He, H. S., Du, H. B., Wang, L., Guo, X. Y., et al. (2018). Differences of the changes in soil temperature of cold and mid-temperate zones, Northeast China. Theor. Appl. Climatol. 134, 633–643. doi:10.1007/S00704-017-2297-0
You, G. Y., Zhang, Y. P., Schaefer, D., Sha, L. Q., Liu, Y. H., Gong, H. D., et al. (2013). Observed air/soil temperature trends in open land and understory of a subtropical mountain forest, SW China. Int. J. Climatol. 33, 1308–1316. doi:10.1002/JOC.3494
You, Q. L., Kang, S. C., Pepin, N., Flügel, W. A., Yan, Y. P., Houshang, B., et al. (2010). Relationship between temperature trend magnitude, elevation and mean temperature in the Tibetan Plateau from homogenized surface stations and reanalysis data. Glob. Planet. Change 71, 124–133. doi:10.1016/J.GLOPLACHA.2010.01.020
Yue, S., and Wang, C. Y. (2002). Applicability of prewhitening to eliminate the influence of serial correlation on the Mann-Kendall test. Water Resour. Res. 38, 4. doi:10.1029/2001WR000861
Zhang, H. X., Yuan, N. M., Ma, Z. G., and Huang, Y. (2021). Understanding the soil temperature variability at different depths: Effects of surface air temperature, snow cover, and the soil memory. Adv. Atmos. Sci. 38, 493–503. doi:10.1007/S00376-020-0074-Y
Zhang, H., Wang, E. l., Zhou, D. W., Luo, Z. K., and Zhang, Z. X. (2016). Rising soil temperature in China and its potential ecological impact. Sci. Rep. 6, 35530. doi:10.1038/SREP35530
Zhang, T., Barry, R. G., Gilichinsky, D., Bykhovet, S. S., Sorokovikov, V. A., and Ye, J. P. (2001). An amplified signal of climatic change in soil temperatures during the last century at Irkutsk, Russia. Clim. Change 49, 41–76. doi:10.1023/A:1010790203146
Zhao, L., Hu, G. J., Wu, X. D., Wu, R. L., Pang, Q. Q., Zou, D. F., et al. (2021). Dynamics and characteristics of soil temperature and moisture of active layer in the central Tibetan Plateau. Geoderma 400, 115083. doi:10.1016/J.GEODERMA.2021.115083
Zhu, F. X., Cuo, L., Zhang, Y. X., Luo, J. J., Lettenmaier, D. P., Lin, Y. M., et al. (2018). Spatiotemporal variations of annual shallow soil temperature on the Tibetan Plateau during 1983–2013. Clim. Dyn. 51, 2209–2227. doi:10.1007/S00382-017-4008-Z
Keywords: soil temperature, different soil layers, spatiotemporal variation, low-latitude highlands, yunnan
Citation: Cheng Q, Zhang M, Jin H and Ren Y (2022) Spatiotemporal variation characteristics of hourly soil temperature in different layers in the low-latitude plateau of China. Front. Environ. Sci. 10:1091985. doi: 10.3389/fenvs.2022.1091985
Received: 07 November 2022; Accepted: 29 November 2022;
Published: 09 December 2022.
Edited by:
Jing Luo, Northwest Institute of Eco-Environment and Resources (CAS), ChinaReviewed by:
Kang Wang, East China Normal University, ChinaCopyright © 2022 Cheng, Zhang, Jin and Ren. This is an open-access article distributed under the terms of the Creative Commons Attribution License (CC BY). The use, distribution or reproduction in other forums is permitted, provided the original author(s) and the copyright owner(s) are credited and that the original publication in this journal is cited, in accordance with accepted academic practice. No use, distribution or reproduction is permitted which does not comply with these terms.
*Correspondence: Qingping Cheng, cXBjaGVuZ3R5bGlAZm94bWFpbC5jb20=; Mingda Zhang, cm9ja2VyZGFkYUAxNjMuY29t
Disclaimer: All claims expressed in this article are solely those of the authors and do not necessarily represent those of their affiliated organizations, or those of the publisher, the editors and the reviewers. Any product that may be evaluated in this article or claim that may be made by its manufacturer is not guaranteed or endorsed by the publisher.
Research integrity at Frontiers
Learn more about the work of our research integrity team to safeguard the quality of each article we publish.