 Wei Li
 Shanshan Liu
 Yicheng Wang1
 Tianling Qin
 Xin Zhang
 Chenhao Li
 Jianming Feng
95% of researchers rate our articles as excellent or good
Learn more about the work of our research integrity team to safeguard the quality of each article we publish.
Find out more
ORIGINAL RESEARCH article
Front. Environ. Sci. , 24 January 2023
Sec. Drylands
Volume 10 - 2022 | https://doi.org/10.3389/fenvs.2022.1090604
This article is part of the Research Topic Hydrological Connectivity and Sustainable Watershed Management in a Changing Environment View all 13 articles
Introduction: Droughts and flooding occur frequently due to climate change and human activities, which have significantly affected the ecological environment of farmland and crop production. Rock wool (RW) has some properties like high porosity and water retention capacity, and it is widely used in green roofing and agricultural production to reduce flood and drought disaster.
Methods: We set 24 artificial rainfall experiments to analyze the impact of RW on the farmland runoff, soil water storage capacity (SWSC), nitrogen and phosphorus loss and crop growth. Finally, the Critic-Entropy comprehensive evaluation method was used to select the best solution for RW embedding.
Results: The result shows that RW could reduce the runoff by 49.6%–93.3%, and it made the SWSC increase by .2%–11% Vol in the 10–70 cm depth. During the runoff process, the concentration of nitrogen and phosphorus decreased with the increase of the RW volume, while the nitrogen and phosphorus loss reduced by 51.9%–96.6% and 72.4%–96.4% respectively when RW was buried in the farmland, so RW could effectively promote soil and water conservation. Finally, RW increased the plant biomass and yield by a maximum of 12.1% and 20.4% respectively due to the large retention of water and nutrients. Therefore, combined with the above experimental result, this study indicates that RW could obtain the best comprehensive benefit in the embedding volume of 536.73 m3/ha.
Discussion: When the volume of RW embedding was too large, RW easily caused insufficient water storage in short-duration rainfall or irrigation, which made the RW unable to release water to alleviate the soil water deficit during the critical growth period, which may result in drought events being aggravated and crop yield reduced. Overall, this study is conducive to clarifying the comprehensive application effect of RW in agricultural production, pollution control, and urban landscape, and it provides an important basis for expanding its application field and promoting the stability of farmland ecosystems.
Climate change and human activities result in the frequent occurrence of extreme hydrological events such as droughts and floods in farmland (Swain et al., 2018; Arunrat et al., 2021; Meresa et al., 2022), which makes the extreme hydrological events gradually increase in frequency, intensity, timing, and duration, while the extensive use of pesticides and fertilizers has caused serious agricultural non-point source pollution, both of them have seriously damaged the farmland ecological environment and the food production system (Dai et al., 2018; Li et al., 2018). For example, Li concluded that the future precipitation and temperature increase in Thailand under different climate models will lead to some negative effects on crops such as rice, and it also presents the same characteristics of high risk in Northeast, North, Central, and Southwest China (Du et al., 2022; Li J. N. et al., 2022). Therefore, how to alleviate the risk of drought and flood disasters without threatening the environment and natural resources, and promote the stability of farmland ecosystems and sustainable development has become a difficult problem that needs to be solved urgently (Liu et al., 2020).
Rock wool (RW) is composed of natural mineral rocks, which are melted at 1,600°C, centrifuged at a high speed, and sprayed with a special reagent (Lv et al., 2020). After the hydrophilic rock wool was found in 1969, people found RW have properties similar to biochar, including high porosity, and water retention capacity, and Choi studied indicating that rock wool could rapidly absorb and drain water, so RW is widely used in green roofing and agricultural production to reduce flood and drought disaster (Choi and Shin., 2019; Gu et al., 2020). The above-mentioned structural properties of rock wool show better benefits in soil and water conservation. Some studies show that: RW increases soil infiltration by 5.1%–79.2%, improves the wetting front advance rate by 0.5%–4.5%, and reduces runoff by 11.2%–62.5%, which can improve soil water holding capacity and reduce the risk of drought and flooding on farmland (Lv et al., 2020; Lv et al., 2021). Moreover, RW acts as a water storage module in the green roof, and it reduces the risk of urban flooding and the concentration of nitrogen and phosphorus in the runoff due to its stronger adsorption for nitrogen and phosphorus elements, so it has a wide range of applications in pollution prevention and urban landscape (Vijayaraghavan and Raja, 2014; Choi and Shin, 2019). In addition, RW alters water and nutrient cycling processes in farmland, it indirectly changes the composition and structure of soil microbial communities and key processes such as carbon and nutrient conversion, and then enhances the microbial activity and crop root growth in the root environment, thus supporting photosynthesis and crop growth in the upper part of the plant (Li S. P. et al., 2021; Hawrot-Paw et al., 2022). Therefore, RW may play an excellent role in soil and water conservation, soil remediation and agricultural production, etc (He et al., 2019; Yu et al., 2019). However, most of the above studies are simulations of a single element and a single process in a short time, while there is only a little attention has been paid to the comprehensive effect of RW on farmland soil erosion and crop growth (Pu et al., 2019; Cai et al., 2020; Libutti et al., 2021), which needs to be urgently explored and expand its application. To solve the above problem, we assume that rock wool (RW) can improve the soil structure, adjust the distribution of soil moisture, and then change the law of farmland runoff and nutrients migration, and ultimately affect the growth of crops, thereby maintaining the stability of the farmland ecosystem.
The Huaibei Plain is the largest distribution area of lime concretion black soil in China. The poor soil structure and the high groundwater level cause the soil to be easily saturated and waterlogging, while the ability of capillary water upward is weak, which is very prone to drought (Zhang et al., 2001). Therefore, we explore the effect of RW on soil improvement through artificial rainfall experiments. The main research purposes are: 1) to evaluate the effect of RW embedding on soil moisture, nitrogen and phosphorus loss, and crop growth; 2) to explore the best multi-objective RW deployment scheme.
The experiment was conducted at the Wudaogou Experimental Station (117°21′E, 33°09′N) in Anhui Province, which is located in the Huai River Basin. This area experiences the northern subtropical and warm temperate semi-humid monsoon climate zones. The climate is rainy and hot in summer and cold and dry in winter. The local average annual rainfall and temperature are 890 mm and 14°C, respectively, and the average yearly rainfall-runoff depth is 240.2 mm (Li W. et al., 2022). In this area, the average soil bulk density is 1.5 g/cm3, and the average soil saturated water content, field capacity, and wilting point are about 45%, 34%, and 15%Vol, respectively, and the soil porosity is about 49.7%. The above data show that there is poor soil structure, soil bulk density varies from 1.41 g/cm3 to 1.53 g/cm3, and organic matter content from 5 g/kg to 15 g/kg, which easily aggravates the risk of droughts and floods disaster, resulting in crop reduction (Liu et al., 2017; Bi et al., 2020; Lv et al., 2020).
RW, an advanced product for rainfall regulation and storage, is made of natural mineral rocks as raw material, which is melted at 1,600°C, centrifuged at a high speed, and sprayed with a special reagent (www.hydrorock.com). Because of its stability, high porosity, and strong water retention, RW is widely used in sponge cities and green roofs (Table 1). More specifically, rainfall water will quickly enter the interior of the RW during rainfall due to RW with the strong water absorption capability. After the rain, RW will continuously release water to alleviate the soil water deficit, which is conducive to the consumption of rainwater and surface water (Figure 1.) (Lv et al., 2020; Li J. N. et al., 2022).
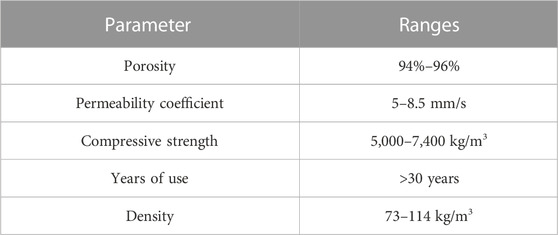
TABLE 1. The parameter of RW.
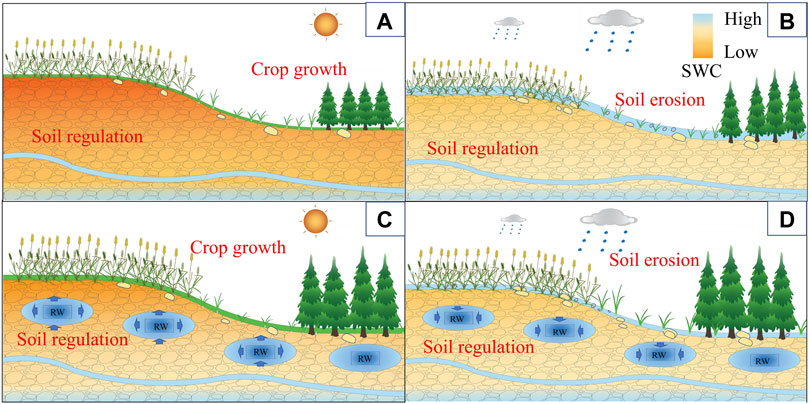
FIGURE 1. RW embedding in the farmland increases soil porosity, which benefits from reducing runoff, thereby improving soil water and nutrient distribution, and ultimately promoting crop production. Pictures (B, D) represent RW can absorb the rainwater and reduce the runoff owing to its high porosity. Pictures (A, C) represent the soil water will be infiltrated, evaporated, or absorbed by the vegetation, and the water in the RW will be released to the surrounding soil and alleviate the soil moisture deficit, which makes the wheat grow well during a drought.
This study set three variables including the rainfall intensity, RW volume, and growth period, with a total of eight experiment plots and 24 rainfall experiments (Table 2) (Li W. et al., 2022). The RW volume was set to increase the soil porosity of the experimental plot by 0%, 5%, 10%, and 15%. The rainfall intensity was set according to the rainfall event records of the typical dry, normal, and wet years of the experimental station, their return periods were 100 and 30 years in the Huaibei plain and all represented a grade of heavy rain (the historical maximum rainfall intensity was 92 mm/h), and the single rainfall amount was set at averagely 150 mm based on the total rainfall during the growth period of winter wheat (Lv et al., 2020).
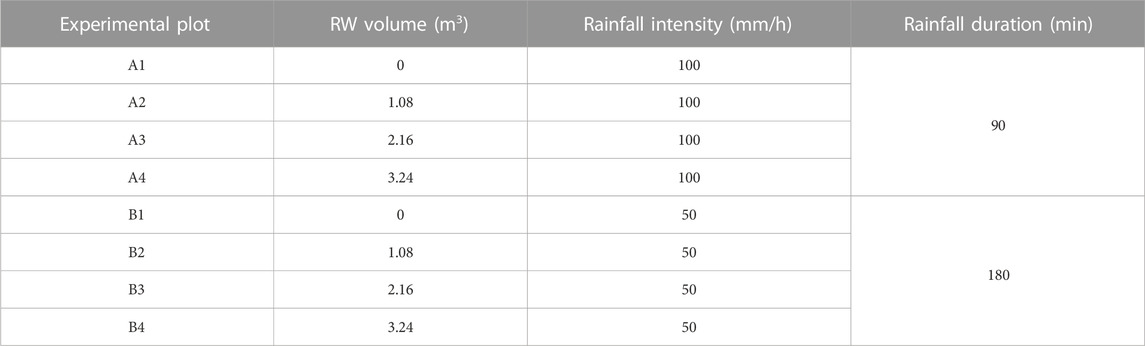
TABLE 2. Experiment design.
This study includes eight experimental plots in the greenhouse, the size of each plot is 5.3 × 3.8 m with a north-south slope with a slope of 3° (Figure 2). The effective depth of the local soil is 100 mm, so the RW is embedded in a depth of 30–70 cm. The devices in every plot includes artificial rainfall devices (Figure 3A): four conical nozzles are evenly distributed over each experimental plot; Wind dodger Figure 3B: polyethylene curtain is installed in the east-west direction of the experimental plots, which aims to reduce the influence of wind; Water-stop sheep Figure 3C: each experimental cell is isolated by a 1 m deep steel plate to mitigate the horizontal soil moisture exchange within the effective depth; Rain trap Figure 3D: it is mainly used to prevent rainfall splash into the experimental plot; Runoff canal Figure 3E: a baffle with a certain inclination is laid flat at the bottom of the slope to make the runoff flow to the outlet section; Water tank Figure 3F: we set up the exit section of the experimental plot to collect the runoff; Moisture sensor Figure 3G: FDR sensors are buried at 0.2, 0.4, and 0.6 m in the center of each experimental plot respectively, which is to monitor the variation of soil moisture (Lv et al., 2020; Li J. N. et al., 2022).
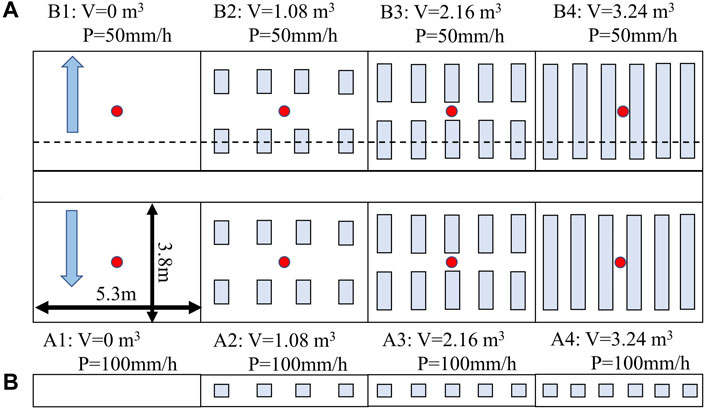
FIGURE 2. Picture (A) and (B) represent the plane and sectional figure of RW embedding, respectively. Red circles indicate soil moisture sensors in the center of every experiment plot, A1–A4 and B1–B4 represent the number of the experimental groups, V represents the volume of RW embedding in the soil, P represents the rainfall intensity.
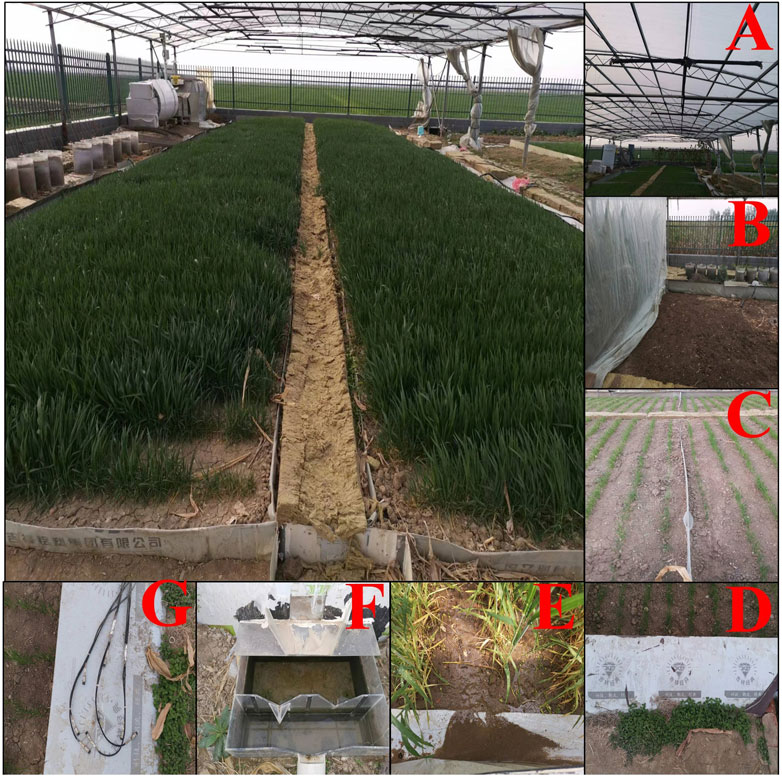
FIGURE 3. The experimental plot and its composition. [Figure (A–G) represent the composition of the whole experimental group, it includes artificial rainfall devices (A), wind dodge (B), water-stop sheep (C), rain trap (D), runoff canal (E), water tank (F) and moisture sensor (G)].
We reference to local planting experience, winter wheat was sown at 675 kg/ha, sown in rows with a spacing of about 28 cm per row, and winter wheat sown on 1 November 2020. Fertilizer was applied a few days before sowing, with 750 kg/ha of compound fertilizer (24%N, 15%P2O5, and 6%K2O) and 150 kg/ha (46%N) of urea, while fertilizer was chased at 75 kg/ha of urea during the regreening period. In detail, fertilizer was fully mixed with the soil in the tillage layer by manual plowing before crop planting. The soil water was rehydrated before the re-greening period according to the average daily rainfall, and then rainfall experiments were conducted at the heading stage (3.25), flowering stage (4.15), and grain-filling stage (5.10). The winter wheat was harvested on 31 May 2021, and the yield indicators (plant biomass, plant density, grain number per spike, thousand-grain weight, etc.) were measured at the time of harvest.
We monitored the soil moisture at 8 a.m. and 8 p.m. The artificial rainfall was performed when the surface soil moisture content (0.2 m) reached 23% ± 2% Vol, which can satisfy the need of wheat in the whole growth period based on the local agricultural observations.
During the rainfall, the runoff process was recorded according to a fixed time interval (5 min), and the indicators included the stream flow and time. The total runoff is as follows:
Where R represents the total runoff, mm; n represents the total number of periods; ri represents the value of stream flow at the time i, cm3/s; T represents the time interval, s; F represents the area value of the experimental plot, m2.
During rainfall, we collected the sample of runoff water at regular intervals (10 or 30 min), which aimed to measure the concentrations of nitrogen and phosphorus. Total nitrogen was determined by the alkaline potassium persulfate digestion method, while total phosphorus and soluble phosphorus were determined by ammonium molybdate spectrophotometry (Wu et al., 2021; Yan et al., 2021; Wang et al., 2022). The total loss of nitrogen and phosphorus is as follows:
Where Q represents the total loss of nitrogen and phosphorus elements in a rainfall-runoff process, mg; qi represents the concentration of nitrogen and phosphorus at the time i, mg/L;
We observed the variety of the plant morphological characteristics and divided the growth period of winter wheat. The indicators included plant biomass, number of plants, grains number per spike, and grain weight. Plants from eight rows in each experimental group (.5 m long peer line) were harvested at maturity (early June) for grain yield determination. In this process, the yield components, plant biomass, plant density (PD), grain number per spike (SGN), thousand-grain weight (TGW), were determined by sampling randomly 50 plants from each plot (excluding those in border plants) (Wu et al., 2015; Fan et al., 2015; Zhao et al., 2019). The formula of theoretical yield is as follows:
Where TY represents the theoretical yield, kg/m2; SGN represents grain number peer ear; TGW represents the thousand-grain weight, g; PD represents the plant density, plant/m2.
In this study, data were analyzed by SPSS, Excel, and Origin. The statistical significance was set at p < .05 (Zhang et al., 2021). We evaluated the impact of RW on the farmland’s ecosystem, the content of which mainly included the difference between the soil runoff process, nitrogen and phosphorus loss, and crop growth in different external environmental conditions. Based on the experiment data, we analyzed RW’s mechanism of action. Finally, we selected the best RW embedding plan by the entropy-critic comprehensive evaluation method.
To reduce human subjective factors and enhance the relative importance of indicators, we used the Critic-Entropy weight method (CEWM) to empower the evaluation index, it could analyze the internal and related relationship between the evaluation indexes, and at the same time, it considered the discrete degree of every evaluation index (Lu et al., 2022). We took the runoff, water storage capacity, the concentration of the TN and TP, the loss of the TN and TP, plant biomass, and yield as the evaluation indicators, which formed the evaluation eigenvalue matrix X=(xij), and calculated the relative membership degree. The formula is as follows (Lu et al., 2022):
Where rij represents the relative membership degree of the index i in the scheme j; xi max represents the maximum value of the index i in the scheme; xi min represents the minimum value of the index i in the scheme; xij represents the value corresponding to the index i in the scheme j.
We normalized the matrix of the evaluation index to obtain matrix R=(rij) by applying Eqs 4, 5). The entropy value Hi of the evaluation index i is (Xia et al., 2021):
Where fij = rij/∑rij, k = 1⁄ln m. If fij = 0, and ln fij = 0.
Where wei represents the entropy weight of the evaluation index i; Hi represents the entropy value of the evaluation index i.
The degree of contrast was measured by the correlation between indicators, while the conflict was measured by the standard deviation within the indicators. The calculation formula is shown (Lu et al., 2022).
Where wci represents the objective weight of index i determined by CWM; Ci represents the amount of information contained in indicator I; Rij represents the correlation coefficient between indicators i and j; Si represents the standard deviation of the relative affiliation of indicator i.
The formula for calculating the comprehensive weight is shown below:
Where wi represents the comprehensive weight, while wei and wci represent the objective weight determined by the EWM and CWM, respectively.
The comprehensive effect scores for each experimental group are:
Where Zl represents the total score for the farmland ecology when RW is embedded in the soil, l is the number of experiment groups, and wli and sli are the local weight and score data for the lth experiment groups, and ith. In this process, we classified the relative membership degree of every indicator into five levels and assign the appropriate score, the detail is as follows (Table 3) (Zhu, 2020):
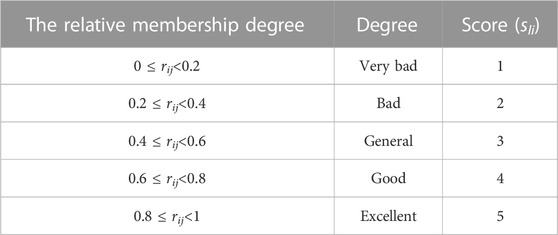
TABLE 3. Assignment scale.
During the growth period of winter wheat, the A2–A4 experimental groups decreased runoff by 67.1%, 59.2%, and 49.6% respectively, compared with the control group (Figure 4). But in the 50 mm/h, the runoff of the B2–B4 experimental groups decreased by 89.4%, 59.7%, and 93.3% respectively. Therefore, the RW embedding can effectively reduce the runoff water, but the runoff water is incompletely decreased with the increase of the volume of RW embedding.
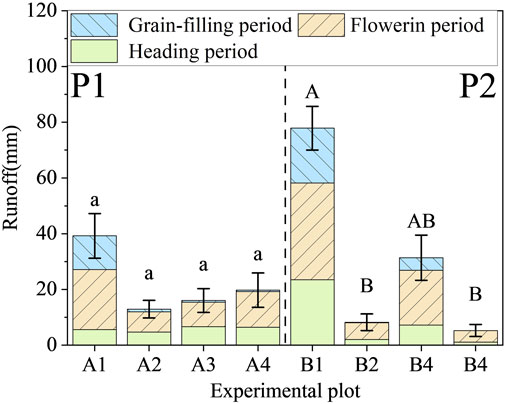
FIGURE 4. Observed runoff in different plots and growth periods under 100 mm/h (left) and 50 mm/h (right) rainfall intensities. P1 represents the experimental plots under 100 mm/h rainfall intensity; P2 represents the experimental plots under 50 mm/h rainfall intensity, a–d and A–D indicate the significant difference between the different groups at 0.05 in 100 and 50 mm/h, respectively.
RW adjusts the distribution of soil moisture and increases the water storage capacity. In this study, the soil moisture decreased rapidly within 0–6 h after the rain, and the maximum reduction in the control group could reach 6.4% Vol (Figure 5). In addition, when the RW was embedded in the soil, the soil water storage capacity of the A2–A4 and B2–B4 groups decreased by 2.5%–6.3% Vol and 0.3%–2.6% Vol in 10–30 cm, compared with the control group, respectively. But in the depth of 30–50 and 30–50 cm, the water storage capacity of RW groups increased by 1.6%–16.3% Vol and −0.7%–17% Vol. To sum up, RW embedding made the water-storage capacity higher than the control groups by 0.2%–11% Vol in the depth of 10–70 cm (except for the A3 group reduced by 1.8%Vol). Therefore, RW embedding can effectively improve the water storage capacity.
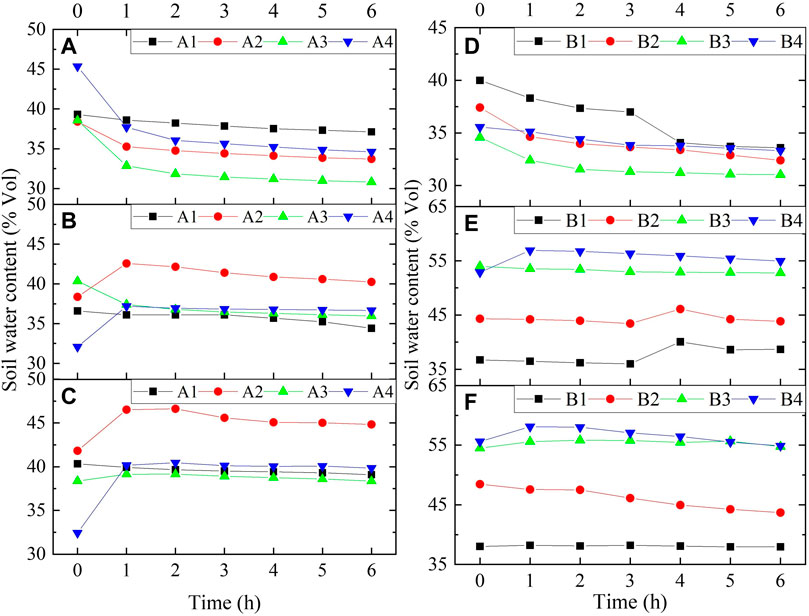
FIGURE 5. Redistributions of soil water content in experimental plots at 10–70 cm depth from 1 to 6 h after rainfall ended [(A–C) indict the SWC in the 10–30, 30–50, and 50–70 cm soil under 100 mm/h rainfall intensity, respectively, while (D–F) indict the SWC under 50 mm/h rainfall intensity].
RW could reduce the nitrogen and phosphorus concentration of runoff water. In general, under the 100 mm/h rainfall event, RW embedding decreased the average concentrations of TN, TP, and DTP by 7.1%–18.1%, 32.9%–45.2%, and 3.1%–55.1%, respectively. While under the 50 mm/h rainfall event, the average concentration of RW groups reduced by 35.2%–56%, 14.5%–35.5%, and 34.4%–46.7%, similarly (Figure 6). The average concentration of nitrogen and phosphorus in the runoff water was negatively correlated with the volume of RW (R2 > .81).
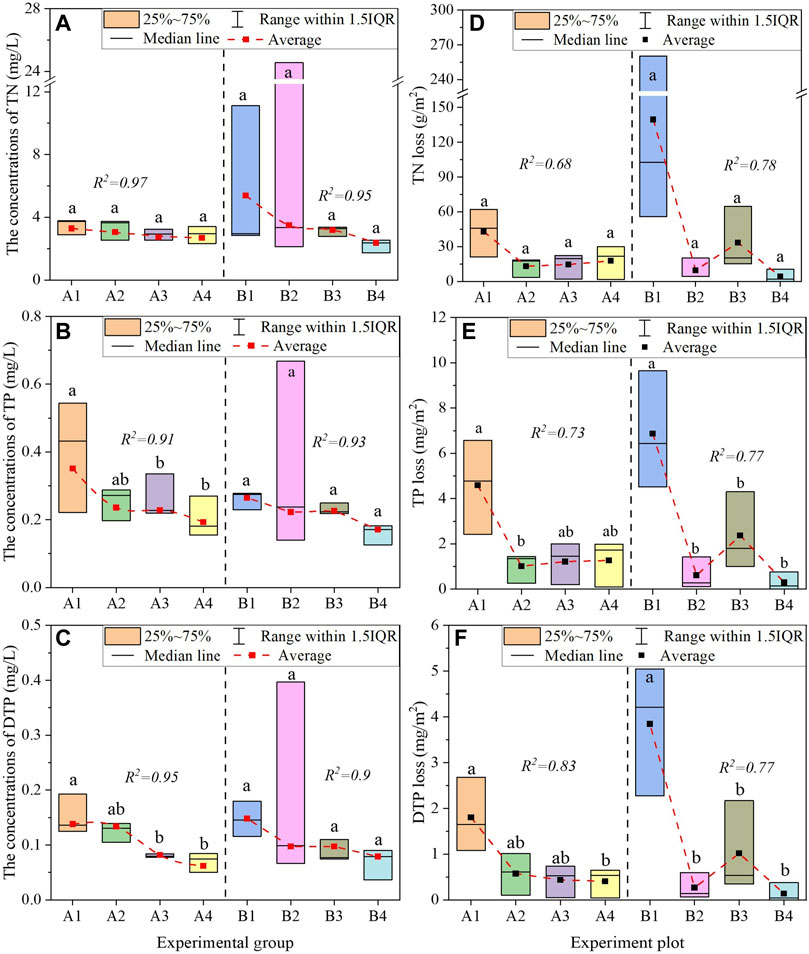
FIGURE 6. Nitrogen and phosphorus loss [(A–C) represent the average concentrations of TN, TP, and DTP during the rainfall in the growth period of winter wheat, respectively. While (D–F) represent the loss of TN, TP, and DTP, respectively. a–d indicates the significant difference between the different groups at 0.05.
RW embedding effectively reduced the total loss of nitrogen and phosphorus. In general, under 100 mm/h, the RW embedding reduced the total loss of TN, TP, and DTP by 51.9%–70.3%, 72.4%–77.9%, and 68.1%–77.4%, compared with the control groups, respectively. The total loss of TN and TP in different experimental groups was A1>A4>A3>A2. Non-etheless, RW embedding made the total loss of TN, TP, and DTP decrease by 92.3%–96.6%, 73.6%–96.4%, and 73.6%–96.4% in the 50 mm/h, respectively. The loss of TN and TP was incompletely decreased with the RW volume increase. In addition, RW embedding had a higher reduction ratio of nitrogen and phosphorus loss under long-duration rainfall.
RW promotes the accumulation of plant biomass. The biomass of winter wheat in the mature period was 3.21–3.51 g/plant (Figure 7), and RW made the biomass per plant of winter wheat higher than the control groups by 1.6%–7.7%. On the whole, the biomass of the RW groups increased by 0.3%–12.1%, compared with the control groups. Therefore, the biomass of winter wheat increased first and then decreased with the increase of RW embedding volume. To sum up, RW embedding can effectively prompt dry matter accumulation.
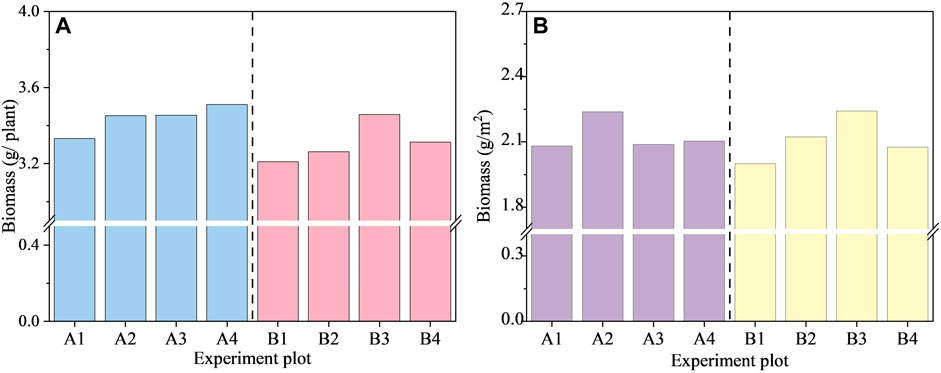
FIGURE 7. Variation of plant biomass [(A) represents the biomass in a plant, and (B) represents the biomass in the unit area].
RW embedding prompts the proliferation and tiller of winter wheat. In the jointing period, the plant density (PD) of winter wheat increased with the increase of the RW embedding volume (R2 = .43 and 0.97, Figure 8). The number of tillers in RW experimental groups increased by 0.5%–15.3%, compared with the control group. Therefore, RW embedding was conducive to the proliferation and tillering of winter wheat.
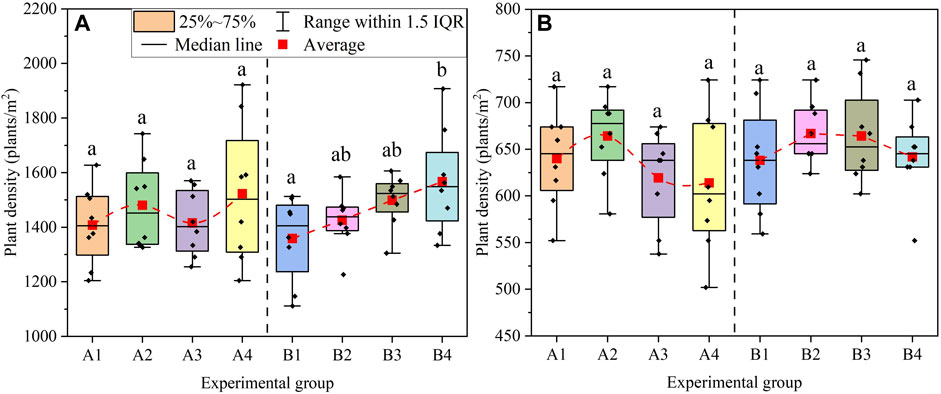
FIGURE 8. Plant density [(A, B) represent the jointing periods and mature periods, respectively, and a and b indicate the significant difference between different RW volumes].
In the mature period, the PD increased first and then decreased with the increase of the RW embedding volume. The PD of the A2–A4 and B2–B4 groups increased by (3.8%, −3.2%, −4.1%) and (4.5%, 4.1%, and 0.6%), respectively. This was that PD increased first and then decreased with the increase of RW embedding volume (p > 0.05). To sum up, RW embedding can increase PD, but it may cause negative effects in high-intensity and short-duration irrigation events.
RW increases the spike grain number (SGN) of winter wheat. In the mature period, the SGN of the A2-A4 and B2–B4 groups increased by (7.1%, −0.4%, 3.5%) and (5.4%, 5.8%, 9.2%), compared with the control group, respectively (Figure 9). The overall trend was increasing, and the SGN had a positive correlation with the volume of RW embedding (R2 = .9) in the long-duration irrigation events (It only had a significant difference between the B1 and B4 group, p < .05).
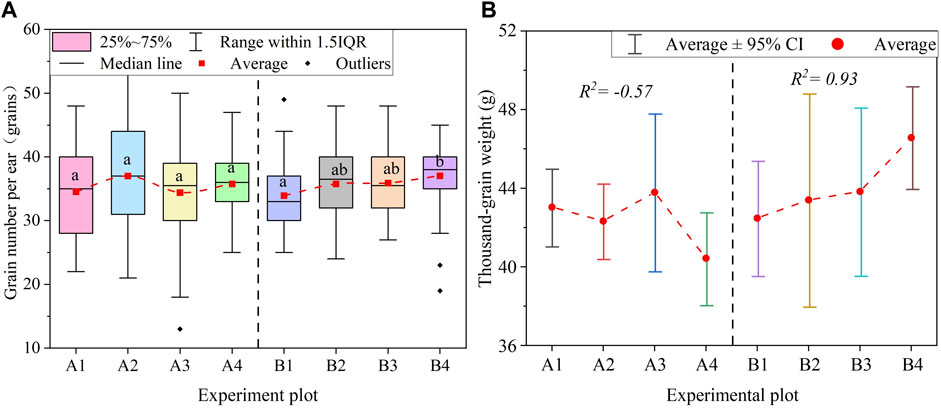
FIGURE 9. Grain number and thousand-grain weight in different experiment groups [(A, B) indicate the significant difference between different RW volumes, p < .05].
The irrigation deeply affects the thousand-grain weight (TGW) of the winter wheat in the grain-filling period. In the 100 mm/h irrigation event, the TGW of the A2 and A4 groups decreased by 1.6% and 6%, compared with the A1 control groups, respectively, but the A3 group increased by 1.8% in turn (Figure 9). RW may inhabit the grain filling under short-duration irrigation. On the contrary, in the 50 mm/h irrigation event, RW embedding prompted the growth of winter wheat grain biomass. The TGW of B2 - B4 groups increased by 2.2%–9.6%, compared with the B1 group, and the TGW had a positive correlation with the different volumes of RW embedding (R2 = .93). Overall, RW has a better appliance for grain filling in low rainfall intensity and long-duration irrigation events.
There is an interaction between RW embedding volume and irrigation method, which jointly affects the yield of winter wheat. In short-duration irrigation, the theoretical yield (TY)of winter wheat increased first and then decreased with the increase of RW volume. The change rate of TY at the A2–A4 experimental plot was 9.4%, −1.9%, and −6.7%, compared with the control group, respectively (Figure 10). It would hold back the growth of yield when the RW is buried in the soil excessively. On the contrary, it had a positive correlation between the volume of RW embedding and TY in long-duration irrigation events (R2 = .89), and the variation ranged from 12.7% to 20.4%. Therefore, when the RW was buried in the soil excessively, it was easy to make the yield increase or decrease in a large range by the influence of irrigation way.
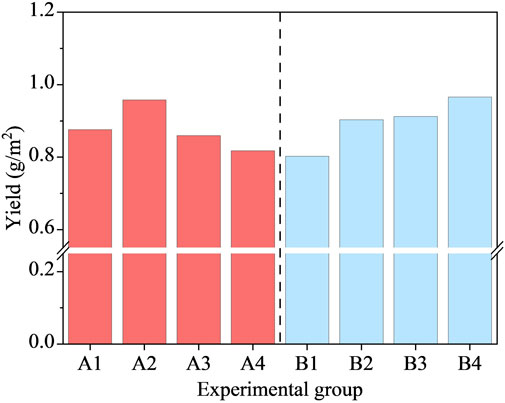
FIGURE 10. Theoretical yield.
According to the experiment on the impact of RW on farmland ecology, the comprehensive weight was (0.147.0.393.0.211.0.081.0.081.0.086). The results showed that the weights of the indicators are: biomass > SWSC > yield > TP loss ≈ TN loss ≈ runoff, so the biomass was most drastically affected by the volume of RW embedding, while yield, nitrogen, and phosphorus loss were relatively less affected. In addition, Comparing the CWM, EWM, and CEWM, the evaluation and rank results had some difference in the A1, A2, A3, and B4 experiment groups, the results of which changed all within ±10.7%, compared with the mean value, while other experiment groups varied with ±4.2%. The comprehensive evaluation ranking is: B3>A2>B2>B4>A4>A1>A3>B1 (Table 4), so the comprehensive benefits are influenced by the rainfall intensity or rainfall duration, while the appropriate amount of RW embedding could help promote the stability of farmland ecosystems. Moreover, under natural conditions, high rainfall intensity and short-duration rainfall events can cause weaker impacts on farmland ecosystems than long-duration rainfall events. Finally, we considered the comprehensive application effect in two rainfall events, and RW could obtain the best comprehensive benefit in the embedding volume of the A2 and B2 groups (536.73 m3/ha).
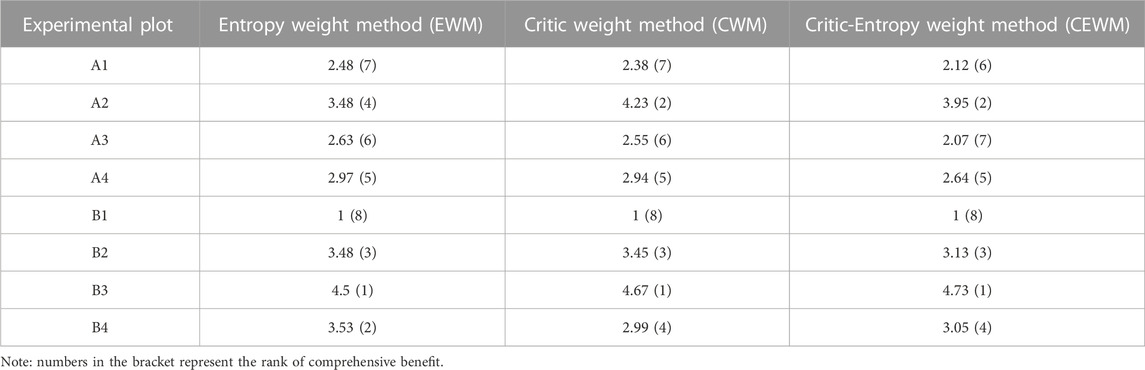
TABLE 4. Comprehensive evaluation and rank.
RW embedding can increase infiltration and decrease surface runoff (Lv et al., 2020), because the RW improves the soil structure, and increases the specific surface area and soil porosity (Sandoval et al., 2017). At the same time, the huge pore can provide sufficient space for water storage, which easily changes the movement path of the soil water and absorbs a large amount of free water (Libutti et al., 2021). So, RW embedding is beneficial for the local consumption of rainfall water or surface ponding. When the soil moisture gradually decreased to an unsaturated state after rainfall, the RW continuously exuded water to alleviate the soil moisture deficit (Lv et al., 2020; Li W. et al., 2022).
RW can effectively reduce nitrogen and phosphorus loss. Soil erosion often occurs on the surface of the soil, due to the limitation of RW embedding depth, RW cannot directly affect the runoff water quality, and it may indirectly affect the nitrogen and phosphorus content in the topsoil by increasing infiltration (Wang et al., 2020). However, the concentrations of TN and TP in the RW groups may be lower than in the control groups, because the concentrations of TN and TP in the runoff water often reach their peaks within a short period after the runoff starts (Li J. N. et al., 2022). As the runoff continues, the dilution effect plays an increasingly important role in the runoff process, which results in nitrogen and phosphorus elements infiltrating the soil profile with the movement of water, and the concentrations of TN and TP decrease continuously with the delay of the rainfall duration (Li et al., 2017; Yan et al., 2021). Thus RW delayed the runoff process and may have increased the nitrogen and phosphorus concentration.
RW reduces nitrogen and phosphorus concentration, but the difference of which in RW groups was within ±8%. The above phenomenon may be related to the form of nitrogen and phosphorus. The previous study showed that phosphorus is in a mostly granular state in the runoff, while nitrogen was mostly lost by NO3−(Zhou et al., 2021). Some scholars think raindrops with high kinetic energy directly hit the surface and transfer some of the kinetic energy to the soil and cause a splash effect, and soil particles are lost with surface runoff after runoff is formed (Ao et al., 2019), which makes it easier for the phosphorus in the topsoil to lose, while the loss of nitrogen is not sensitive to rainfall intensity, and there is no significant difference in TN concentration under different rainfall intensity (de Almeida et al., 2021; Li X. N. et al., 2021). When the runoff process continues, a large amount of nitrogen begins to dissolve, and the nitrogen content in the runoff water increases within a certain period (Yan et al., 2021). Therefore, the TN concentration under long-duration rainfall may be greater than under short-duration rainfall. When the runoff continues, the dilution effect makes the TN concentration continue to decline, that is, the phosphorus loss is more sensitive to the rainfall intensity, while the nitrogen element is more affected by the rainfall duration (Yan et al., 2021).
RW embedding promotes early crop proliferation and tillering. In the jointing period, the number of tillers in RW experimental groups increased by 0.5%–15.3%. It has a positive correlation between the RW embedding volume and the number of tillers (R2 = .43 and .99), because the RW improves soil water storage capacity and promotes crop root water absorption (Choi and Shin, 2019; Gu et al., 2021). However, the water absorption capacity of hydrophilic RW increased with irrigation time (Choi and Shin, 2019). When extreme rainfall events occur frequently, RW can fully play its advantages of rapid water absorption and drainage, which can effectively reduce soil erosion and nutrient loss, and promote root material absorption and photosynthesis (Lee et al., 2015). In addition, on account of the rainfall duration and the applicability of RW, RW cannot fully absorb sufficient water in short-duration and high-rainfall irrigation events, which may result in insufficient water released in drought seasons to alleviate soil water deficit (VanWoert et al., 2005; Yu et al., 2018). For example, the grain-filling period is the key water-requiring period for crop growth, and the TGW and PD have a certain downward trend due to the applicability of RW, which may cause crop failure in the A3 and A4 groups (Chen et al., 2021). To sum up, RW can promote water drainage, water, and nutrient retention, which is beneficial to crop photosynthesis and biomass accumulation. However, when the volume of RW embedding is too large, likely, the properties of rock wool cannot be fully utilized in short-duration rainfall events. The result of the above phenomenon easily exacerbates the risk of farmland drought and crop failure, which seriously destabilizes the farmland ecosystem.
Different evaluation methods result in different indicator weights (Liu et al., 2021). RW significantly reduces runoff and nitrogen and phosphorus loss, the variation of which is above 50%, so the above indexes relatively present the characteristics of high mean value and small variance (Figure 11). Some objective weighting methods consider that the above indexes contain less information or more repeated information, so the weighting is significantly lower than that of other indicators (Lu et al., 2022). Nevertheless, the different response degrees of RW embedding for different indicators, makes the distribution of normalized index significantly different, and it represents some characteristics like low mean value and high variance.
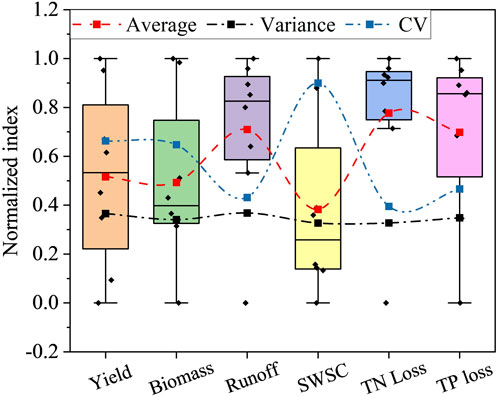
FIGURE 11. The distribution of the normalized index.
Different indicator weights make the evaluation results various. The evaluation results in EWM objectively reflect the comprehensive benefits to some extent, but there is little change in the evaluation result of the A2 and B4 groups when we used the CWM and EWM respectively, because the effect of RW on the biomass and SWSC made the evaluation results significantly different, and the weights of the above two indicators increase. The objective method mostly relies on the laws of the data to respond to the amount of information, and the CEWM considers the contrast intensity, dispersion degree, and conflict, which is more reasonable than the other evaluation systems (Lu et al., 2022). In this study, the evaluation results are the same basically when using singularly the EWM and CWM, while the SWSC and biomass have the higher weighting so the importance of both in the CEWM is significantly increased, which causes the weighting of the TN and TP loss to have a certain decrease, and resulting in some changes in the evaluation results when RW has the excellent effect in this index, such as the A1, A2, A3, and B4 groups. The response of each index to RW is influenced by various external conditions, which may make the RW embedding different in other application scenarios.
When RW with appropriate volume is buried in the winter wheat farmland, it can obtain the highest comprehensive benefits like soil and water conservation and farmland production in different conditions, but we must know the expense of RW restricted its application on a large scale at present, and the average price of a RW ranges from ¥1,000 to ¥2,000 m−3, so we can use it in intensive agriculture or economic crop planting. In addition, we must realize that RW cannot create water or reduce the soil water consumption of farmland, and it only plays a role in enhancing soil water storage capacity to delay drought events (Li W. et al., 2022). To sum up, we should consider the application of RW in long periods and multiple environments like agricultural production, flower cultivation, and urban greening, and the effectiveness and feasibility of RW in complex environments should be investigated through models or field studies, which aim to expand the production of RW and achieve comprehensive applications under multiple scenarios and objectives.
RW embedding affects farmland soil structure, which influences the farmland runoff process, nitrogen and phosphorus loss, and crop growth in turn. Based on the above assumption, we took winter wheat as the experimental object to explore the impact of RW on the farmland’s ecological environment. The results show that RW could reduce runoff and enhance the soil water storage capacity, which effectively alleviates the risk of drought and flood disasters in farmland. When extreme rainfall occurs, RW reduces the total amount of nitrogen and phosphorus losses by 51.9%–70.3% and 72.4%–77.9%, by reducing runoff, the TN, and TP concentration. The above effects generally increase with the increase of RW volume. Finally, plant biomass and yield increase by a maximum of 12.1% and 20.4%, respectively. To sum up, based on the Entropy-Critic comprehensive evaluation method, it is concluded that RW could obtain the highest comprehensive benefit under the embedding volume of 536.73 m3/ha. Overall, this study is conducive to clarifying the comprehensive application effect of RW in agricultural production, pollution control, and urban landscape. It provides an important basis for expanding its application field and promoting the stability of farmland ecosystems.
The datasets presented in this article are not readily available because this is confidential data. Requests to access the datasets should be directed to weil01234@163.com.
WL, SL, and TQ conceived the main idea of this manuscript and performed the experiment. YW helped to revise this manuscript. WL wrote the manuscript and all authors contributed to the article and approved the submitted version.
This research was supported by the National Science Fund Project (Grant No. 52130907) and the National Science Fund Project for Distinguished Young Scholars (Grant No. 51725905).
We thank the reviewers for their useful comments and suggestions.
The authors declare that the research was conducted in the absence of any commercial or financial relationships that could be construed as a potential conflict of interest.
All claims expressed in this article are solely those of the authors and do not necessarily represent those of their affiliated organizations, or those of the publisher, the editors and the reviewers. Any product that may be evaluated in this article, or claim that may be made by its manufacturer, is not guaranteed or endorsed by the publisher.
Ao, C., Yang, P. L., Zeng, W. Z., Chen, W. L., Xu, Y., Xu, H. L., et al. (2019). Impact of raindrop diameter and polyacrylamide application on runoff, soil and nitrogen loss via raindrop splashing. Geoderma 353, 372–381. doi:10.1016/j.geoderma.2019.07.026
Arunrat, N., Sereenonchai, S., Chaowiwat, W., and Wang, C. (2021). Climate change impact on major crop yield and water footprint under CMIP6 climate projections in repeated drought and flood areas in Thailand. Sci. Total Environ. 807 (2), 150741. doi:10.1016/j.scitotenv.2021.150741
Bi, W. X., Weng, B. S., Yan, D. H., Wang, M. K., Wang, H., Wang, J. J., et al. (2020). Effects of drought-flood abrupt alternation on phosphorus in summer maize farmland systems. Geoderma 363, 114147–114212. doi:10.1016/j.geoderma.2019.114147
Cai, W. L., Huang, H., Chen, P. N., Huang, X. L., Gaurav, S., Pan, Z., et al. (2020). Effects of biochar from invasive weed on soil erosion under varying compaction and slope conditions: Comprehensive study using flume experiments. Biomass Convers. Biorefinery. doi:10.1007/s13399-020-00943-3
Chen, X. Y., Zhu, Y., Ding, Y., Pan, R. M., Shen, W. Y., Yu, X. R., et al. (2021). The relationship between characteristics of root morphology and grain filling in wheat under drought stress. Peerj 9, e12015. doi:10.7717/peerj.12015
Choi, Y. B., and Shin, J. H. (2019). Analysis of the changes in medium moisture content according to a crop irrigation strategy and the medium properties for precise moisture content control in rock wool. Hortic. Environ. Biotechnol. 60 (3), 337–343. doi:10.1007/s13580-019-00134-8
Dai, C. T., Liu, Y. J., Wang, T. W., Li, Z. X., and Zhou, Y. W. (2018). Exploring optimal measures to reduce soil erosion and nutrient losses in southern China. Agric. Water Manag. 210, 41–48. doi:10.1016/j.agwat.2018.07.032
De Almeida, W. S., Seitz, S., de Oliveira, L. F. C., and de Carvalho, D. F. (2021). Duration and intensity of rainfall events with the same erosivity change sediment yield and runoff rates. Int. Soil Water Conservation Res. 9 (1), 69–75. doi:10.1016/j.iswcr.2020.10.004
Du, X., Jian, J. S., Du, C., and Stewart, R. D. (2022). Conservation management decreases surface runoff and soil erosion. Int. Soil Water Conservation Res. 10 (2), 188–196. doi:10.1016/j.iswcr.2021.08.001
Fan, Y. H., Tian, M. Y., Jing, Q., Tian, Z. W., Han, H. M., Jiang, D., et al. (2015). Winter night warming improves pre-anthesis crop growth and post-anthesis photosynthesis involved in grain yield of winter wheat (Triticum aestivum L). Field Crops Res. 178, 100–108. doi:10.1016/j.fcr.2015.04.001
Gu, J. Y., Fang, W., Gao, J., Yan, S. X., Feng, G. L., Liu, C. X., et al. (2020). Improving soil water retention capacity of economic forest using rock wool in hilly area. Agric. Res. Arid Areas 38 (3), 10–18. doi:10.7606/j.issn.1000-7601.2020.03.02
Gu, J. Y., Shao, S., Deng, Y. J., Yu, C. B., Chen, J. H., Qin, H., et al. (2021). Response of growth and physiological indicators of Lycopersicone sculentum to water stress relieved by rock wool. J. Zhejiang A&F Univ. 38 (2), 311–319. doi:10.11833/j.issn.2095-0756.20200221
Hawrot-Paw, M., Mikiciuk, M., Koniuszy, A., and Meller, E. (2022). Influence of organomineral fertiliser from sewage sludge on soil microbiome and physiological parameters of maize (Zea mays L). Agronomy-Basel 12 (5), 1114. doi:10.3390/agronomy12051114
He, L. Z., Zhong, H., Liu, G. X., Dai, Z. M., Brookes, P. C., and Xu, J. (2019). Remediation of heavy metal contaminated soils by biochar: Mechanisms, potential risks and applications in China. Environ. Pollut. 252, 846–855. doi:10.1016/j.envpol.2019.05.151
Lee, S. S., Shah, H. S., Awad, Y. M., Kumar, S., and Ok, Y. S. (2015). Synergy effects of biochar and polyacrylamide on plants growth and soil erosion control. Environ. Earth Sci. 74 (3), 2463–2473. doi:10.1007/s12665-015-4262-5
Li, J. N., Chou, J., M., Zhao, W. X., Xu, Y., Hao, Y. D., and Li, Y. M. (2022). Future drought and flood vulnerability and risk prediction of China’s agroecosystem under climate change. Sustainability 14 (16), 10069. doi:10.3390/su141610069
Li, J. Y., Tong, J. X., Xia, C. N., Hu, B. X., Zhu, H., Yang, R., et al. (2017). Numerical simulation and experimental study on farmland nitrogen loss to surface runoff in a raindrop driven process. J. Hydrology 549, 754–768. doi:10.1016/j.jhydrol.2017.01.035
Li, S. P., Li, Z. L., Feng, X., Zhou, F. W., Wang, J. P., and Li, Y. (2021). Effects of biochar additions on the soil chemical properties, bacterial community structure and rape growth in an acid purple soil. Plant Soil Environ. 67 (3), 121–129. doi:10.17221/390/2020-pse
Li, W., Liu, S. S., Qin, T. L., Xiao, S. B., Li, C. H., Zhang, X., et al. (2022). Experiment study of porous fiber material on infiltration and runoff of winter wheat farmland in Huaibei Plain, China. Front. Earth Sci. 10. doi:10.3389/feart.2022.817084
Li, X. N., Zhang, W. W., Wu, J. Y., Li, H. J., Zhao, T. K., Zhao, C. Q., et al. (2021). Loss of nitrogen and phosphorus from farmland runoff and the interception effect of an ecological drainage ditch in the North China Plain-A field study in a modern agricultural park. Ecol. Eng. 169, 106310. doi:10.1016/j.ecoleng.2021.106310
Li, Y., Mei, L. P., Zhou, S. L., Jia, Z. Y., Wang, J. X., Li, B. J., et al. (2018). Analysis of historical sources of heavy metals in lake taihu based on the positive matrix factorization model. Int. J. Environ. Res. Public Health 15 (7), 1540. doi:10.3390/ijerph15071540
Libutti, A., Francavilla, M., and Monteleone, M. (2021). Hydrological properties of a clay loam soil as affected by biochar application in a pot experiment. Agronomy-Basel 11 (3), 489. doi:10.3390/agronomy11030489
Liu, S. M., Wang, H., Yan, D. H., Qin, T. L., Wang, Z. L., and Wang, F. X. (2017). Crop growth characteristics and waterlogging risk analysis of Huaibei Plain in Anhui Province, China. J. Irrigation Drainage Eng. 143 (10), 04017042. doi:10.1061/(asce)ir.1943-4774.0001219
Liu, X. Q., Liu, Z. J., Zhong, H. M., Jian, Y. Q., and Shi, L. N. (2021). Multi-dimension evaluation of rural development degree and its uncertainties: A comparison analysis based on three different weighting assignment methods. Ecol. Indic. 130, 108096. doi:10.1016/j.ecolind.2021.108096
Liu, Y. F., Sun, D. S., Wang, H. J., Wang, X. J., Yu, G. Q., and Zhao, X. J. (2020). An evaluation of China’s agricultural green production: 1978–2017. J. Clean. Prod. 243, 118483. doi:10.1016/j.jclepro.2019.118483
Lu, H. A., Zhao, Y. M., Zhou, X., and Wei, Z. K. (2022). Selection of agricultural machinery based on improved CRITIC-entropy weight and GRA-TOPSIS method. Processes 10 (2), 266. doi:10.3390/pr10020266
Lv, Z. Y., Qin, T. L., Liu, S. S., Nie, H. J., Liu, F., and Wang, J. W. (2020). Porous-fiber module increases infiltration and reduces runoff. Agron. J. 112 (5), 4420–4436. doi:10.1002/agj2.20317
Lv, Z. Y., Qin, T. L., Wang, Y., Liu, S. S., Nie, H. J., and Wang, J. W. (2021). Hydraulic properties of the porous-fiber module and its effects on infiltration and runoff. Agron. J. 113 (3), 2913–2925. doi:10.1002/agj2.20630
Meresa, H., Tischbein, B., and Mekonnen, T. (2022). Climate change impact on extreme precipitation and peak flood magnitude and frequency: Observations from CMIP6 and hydrological models. Nat. Hazards 111 (3), 2649–2679. doi:10.1007/s11069-021-05152-3
Pu, S. H., Li, G. Y., Tang, G. M., Zhang, Y. S., Xu, W. L., Li, P., et al. (2019). Effects of biochar on water movement characteristics in sandy soil under drip irrigation. J. Arid Land 11 (5), 740–753. doi:10.1007/s40333-019-0106-6
Sandoval, V., Bonilla, C. A., Gironas, J., Vera, S., Victorero, F., Bustamante, W., et al. (2017). Porous media characterization to simulate water and heat transport through green roof substrates. Vadose Zone J. 16 (4), 1–14. doi:10.2136/vzj2016.10.0101
Swain, D. L., Langenbrunner, B., Neelin, J. D., and Hall, A. (2018). Increasing precipitation volatility in twenty-first-century California. Nat. Clim. Change 8 (5), 427–433. doi:10.1038/s41558-018-0140-y
VanWoert, N. D., Rowe, D. B., Andresen, J. A., Rugh, C. L., and Xiao, L. (2005). Watering regime and green roof substrate design affect Sedum plant growth. Hortscience 40 (3), 659–664. doi:10.21273/hortsci.40.3.659
Vijayaraghavan, K., and Raja, F. D. (2014). Design and development of green roof substrate to improve runoff water quality: Plant growth experiments and adsorption. Water Res. 63, 94–101. doi:10.1016/j.watres.2014.06.012
Wang, R., Min, J., Kronzucker, H. J., Li, Y. L., and Shi, W. M. (2020). N and P runoff losses in China's vegetable production systems: Loss characteristics, impact, and management practices. Sci. Total Environ. 698, 971–979. doi:10.1016/j.scitotenv.2019.01.368
Wang, T., Xiao, W. F., Huang, Z. L., and Zeng, L. X. (2022). Interflow pattern govern nitrogen loss from tea orchard slopes in response to rainfall pattern in Three Gorges Reservoir Area. Agric. Water Manag. 269, 107684. doi:10.1016/j.agwat.2022.107684
Wu, L., Liu, X., and Ma, X. Y. (2021). How biochar, horizontal ridge, and grass affect runoff phosphorus fractions and possible tradeoffs under consecutive rainstorms in loessial sloping land? Agric. Water Manag. 256, 107121. doi:10.1016/j.agwat.2021.107121
Wu, X. L., Tang, Y. L., Li, C. S., Wu, C., and Huang, G. (2015). Chlorophyll fluorescence and yield responses of winter wheat to waterlogging at different growth stages. Plant Prod. Sci. 18 (3), 284–294. doi:10.1626/pps.18.284
Xia, M., Jia, K., Zhao, W. W., Liu, S. L., Wei, X. Q., and Wang, B. (2021). Spatio-temporal changes of ecological vulnerability across the Qinghai-Tibetan Plateau. Ecol. Indic. 123, 107274. doi:10.1016/j.ecolind.2020.107274
Yan, L., Xue, L. H., Petropoulos, E., Qian, C., Hou, P. F., Xu, D. F., et al. (2021). Nutrient loss by runoff from rice-wheat rotation during the wheat season is dictated by rainfall duration. Environ. Pollut. 285, 117382. doi:10.1016/j.envpol.2021.117382
Yu, H. Q., Zhang, Q., Sun, P., and Song, C. Q. (2018). Impact of droughts on winter wheat yield in different growth stages during 2001-2016 in eastern China. Int. J. Disaster Risk Sci. 9 (3), 376–391. doi:10.1007/s13753-018-0187-4
Yu, H. W., Zou, W. X., Chen, J. J., Chen, H., Yu, Z. B., Huang, J., et al. (2019). Biochar amendment improves crop production in problem soils: A review. J. Environ. Manag. 232, 8–21. doi:10.1016/j.jenvman.2018.10.117
Zhang, C., Huang, X., Zhang, X. W., Wan, L., and Wang, Z. H. (2021). Effects of biochar application on soil nitrogen and phosphorous leaching loss and oil peony growth. Agric. Water Manag. 255, 107022. doi:10.1016/j.agwat.2021.107022
Zhang, Y. F., Wang, Y. F., and Liu, L. X. (2001). Function mechanism between the drought and waterlogging disaster and the soil-structure of the shajiang soil in Huaibei Plain. Prog. Geogr. 20 (2), 169–176.
Zhao, J., Khan, S., Anwar, S., Mo, F., Min, S., Yu, S., et al. (2019). Plastic Film-mulching with appropriate seeding rate enhances yield and water use effciency of dryland winter wheat in loess plateau, China. Appl. Ecol. Environ. Res. 18 (1), 1107–1127. doi:10.15666/aeer/1801_11071127
Zhou, P. G., Zhang, D. H., Zhuang, L., Zhang, L., Yuan, W. R., and Singh, R. P. (2021). Assessment of runoff nutrients loss in Phyllostachys praecox cv. prevernalis forest land under simulated rainfall conditions. Environ. Sci. Pollut. Res. 28 (17), 21874–21886. doi:10.1007/s11356-020-11871-0
Keywords: rock wool, runoff, soil water storage capacity, nitrogen and phosphorus loss, crop growth
Citation: Li W, Liu S, Wang Y, Qin T, Zhang X, Li C and Feng J (2023) Experimental study of rock wool on the farmland soil erosion and crop growth of winter wheat and its comprehensive evaluation. Front. Environ. Sci. 10:1090604. doi: 10.3389/fenvs.2022.1090604
Received: 05 November 2022; Accepted: 29 December 2022;
Published: 24 January 2023.
Edited by:
Omer Yetemen, Istanbul Technical University, TürkiyeCopyright © 2023 Li, Liu, Wang, Qin, Zhang, Li and Feng. This is an open-access article distributed under the terms of the Creative Commons Attribution License (CC BY). The use, distribution or reproduction in other forums is permitted, provided the original author(s) and the copyright owner(s) are credited and that the original publication in this journal is cited, in accordance with accepted academic practice. No use, distribution or reproduction is permitted which does not comply with these terms.
*Correspondence: Tianling Qin, cWludGxAaXdoci5jb20=
Disclaimer: All claims expressed in this article are solely those of the authors and do not necessarily represent those of their affiliated organizations, or those of the publisher, the editors and the reviewers. Any product that may be evaluated in this article or claim that may be made by its manufacturer is not guaranteed or endorsed by the publisher.
Research integrity at Frontiers
Learn more about the work of our research integrity team to safeguard the quality of each article we publish.