 Qiang Xu
 Yuyang Liu
- School of Architecture and Civil Engineering, Liaocheng University, Liaocheng, China
Using green technology by building materials manufacturers to produce low-carbon building materials is an effective way to control carbon emissions and promote traditional industries’ green and low-carbon development. Based on the government, small and medium-sized building materials manufacturers, and scientific research institutes, this paper sets 15 variables that affect the strategy selection of game participants, establishes an evolutionary game model under the constraint of the carbon tax, explores the behavioral strategies of the three parties in the industry life cycle to produce low-carbon building materials, and analyzes the sensitivity of critical factors. Results: The government plays a leading role in the initial stage, which is gradually replaced by the market-leading mechanism as the low-carbon building materials industry develops to maturity. The government’s decision-making behavior is almost unaffected by the two, and appropriate subsidies and carbon tax penalties at each stage of the industry life cycle can help improve the enthusiasm of the other two parties to participate in low-carbon behavior. Establishing a reasonable income distribution coefficient between small and medium-sized building materials manufacturers and scientific research institutes is more conducive to speeding up the stable state than transferring and selling technology.
1 Introduction
With urbanization’s rapid development, global warming has been widely concerned (Chen et al., 2017). Carbon emissions from energy consumption are a vital contributor to global warming, and countries are now committed to achieving carbon neutrality (Teng and Pan, 2020). The building materials industry is one of the largest industrial sectors of carbon dioxide emission, which accounts for more than 10% of the national carbon emission. The building materials industry shouldered the historical responsibility (Jin et al., 2021).
As the national carbon market coverage expands to the building materials industry, it will undoubtedly impact building materials enterprises (Wang et al., 2022). It is found that compared with the whole process of producing ordinary cement, the entire process of making slag Portland cement can realize saving and reduce carbon emissions by 236 kg/t (carbon emission reduction by 26%) (Song et al., 2012). Compared with the replacement of natural aggregate, biomass recycled aggregate synthesized from agricultural waste coconut shells can reduce CO2 emissions by 2% (Ni et al., 2022). If the fly ash-to-cement ratio is partially replaced, the carbon emission can be significantly reduced (Khan et al., 2020). The above literature and research results have proved that green building materials will reduce carbon and bring higher efficiency. Thus, promoting the green and low-carbon transformation of the building materials industry is one of the significant measures to control carbon emissions and cope with global climate change (Jiang et al., 2022).
In the past decade, to achieve carbon reduction targets, governments in many countries have established relevant supervision institutions (Shen et al., 2016). Governments have adopted corresponding incentive measures, such as financial subsidies, carbon tax penalties, market guidance, and technical support, to encourage enterprises to pay attention to green products and continuously improve innovation capacity (Liu et al., 2022). Many scholars have conducted in-depth studies on the rationality and effectiveness of these policies. For example, Fan et al. (2022) build different information interaction mechanisms based on the evolutionary game model of complex networks to study the dynamic impact of government policies on the diffusion of green innovation in enterprises. Olubunmi et al. (2016) show that incentives can be divided into external and internal stimuli and further discuss the effectiveness of the current incentive mechanism. Fan and Hui. (2020) used quantitative methods to illustrate motivation points and participants’ strategic changes.
In the research and development of small and medium-sized enterprises (SMEs), due to information asymmetry and substantial resource constraints, independent innovation has uncertain risks (Barbaroux, 2014). Therefore, R&D cooperation with research institutes is crucial to overcome the lack of internal business resources of SMEs and improving their innovation ability and competitiveness (Aristei et al., 2016). At the same time, to guarantee the respective rights and interests of SMEs and the research institute, a perfect contract system should be established between the two parties. In this research field, Zhou and Cai. (2016) study the operation risk and prevention strategies of the public service contract purchase and put forward healthy and sustainable development suggestions for public service contract purchase in China. Li. (2016) theoretically discussed the structural characteristics and element composition of the governance mechanism of the “contract system”.
Although the existing literature has carried out theoretical research on Low-carbon building materials (LBM) production using evolutionary game theory (EGT), it also provides ideas for reference for the analysis of this paper. However, the research on the four-stage production LBM behavior strategy based on the industry life cycle (ILC) is still lacking and still in its infancy. In particular, systematic studies incorporating SMEs’ limitations into EGT are less well known. At the same time, the R&D cooperation attitude of the contract system of research institutes is included in the variable hypothesis, which distinguishes other R&D cooperation modes and provides a quantitative basis for the distribution of innovation income. Under the assumption of limited rationality and finite assumptions, this work applies EGT to progressively arrive at an ideal equilibrium state through communication and cooperation of all parties and suggests a number of equilibrium conditions and policy recommendations. It is hoped that the research in this paper will work as a theoretical guide for the government guides small and medium-sized (SM) building materials manufacturers to produce LBM by forecasting the development history of SM building material manufacturers in the LBM industry. Therefore, by establishing a triple evolutionary game model of the government, SM materials manufacturers, and scientific research institutes, this paper analyzes the basic conditions for the tripartite subjects to evolve to the equilibrium state based on ILC to deeply explore the forward-looking issue of how small and medium-sized building materials manufacturers can independently transform in the LBM industry to maintain their stable development.
2 Literature review
2.1 Effect of government incentive policies
The government has much capacity to encourage the green growth of the building industry because it is the prominent owner of that sector (He and Chen, 2021). Studies in the past have explored various aspects of government incentive programs, including literature reviews (Olubunmi et al., 2016), strategic decisions (Hu et al., 2020), cost-benefit analyses (Wu and Ma, 2022), and non-cooperative games (Zhou et al., 2022). Through a thorough literature analysis, Wasserbaur et al. (2022) extensively defined the connection between governmental initiatives and company models. Green development is encouraged by government subsidies, and contributions to diverse causes will have a variety of positive societal effects. The incentive effect better serves consumers than developers (He and Chen, 2021). In addition, the way incentive programs are constructed will have both direct and indirect impacts on stakeholders’ choice of government. Fan and Wu. (2020) created a causal loop diagram to illustrate government incentives and evaluated the cost-effectiveness of government in terms of importance and money value using transaction cost analysis and hierarchical analysis. It was discovered that transaction costs—such as those associated with monitoring, approval, coordination, and other processes—are factors that influence how governments make decisions. Under the non-cooperative game, Amiri-Pebdani et al. (2022) constructed a Stackelberg model with the government as the dominant player and manufacturers and retailers as the followers to analyze the impact of government environmental incentives on firms’ green technology innovation.
However, little research has been conducted on stakeholder behavior and decision-making under the restrictions of the carbon tax or the effects of government incentives at various stages within the ILC (Zhou et al., 2022). Due to this, evolutionary game theory modeling is a well-known and effective method for evaluating stakeholders’ choices (Shan et al., 2021).
2.2 Enterprise green technology innovation
In the past decade, stakeholder behavior in green technology innovation has been a concern, and green technology investment has been the focus of scholars’ research. To determine the best course of action for investing in green technology to reduce carbon emissions, Hussain et al. (2022) suggested considering the monopoly market of carbon-emitting businesses and using an optimization model based on simulation. Government management policies and corporate green technology innovation are intimately intertwined, and Zhou et al. (2022) assessed the long-term effect of green technology advancement on renewable energy consumption under government supervision. In their study, Mohsin et al. (2021) compared the equilibrium solutions of differential games played under centralized and decentralized decision-making under government control and concluded that under centralized decision-making, the level of green technology and the total profit of green channels were higher. To identify an efficient market regulatory system to encourage the development of green technology innovation, Li and Gao. (2022) created a three-way evolutionary game model between two types of enterprises with varied R&D capabilities and banks. As a foundation for how governments can create the best subsidy plans to encourage managers’ green technology innovation behavior, Liu et al. (2021) explored how managers can achieve the best green technology investment-production strategies in the supply chain.
In contrast, previous studies have ignored many SM enterprises and their technical limitations, which need to be developed with innovative institutions. To fill this research gap, this paper discusses the evolution mechanism of the ILC low-carbon transition from the perspective of government subsidies and attitudes of research institutes.
2.3 Study government and enterprise behaviors under environmental regulation of carbon emission reduction by using traditional game
In introducing game theory to study economic problems, the government and enterprises are regarded as game subjects to review the strategic choices of both sides. Zhao et al. (2012) applied game theory to non-cooperative game analysis to examine the methods manufacturers utilized to lower environmental risks and carbon emissions over the material life cycle. To determine the applicable indirect green tax for the Iranian economy, Norouzi et al. (2022) develop a suitable model and employ a game-theoretic methodology. According to Ji. (2021) research, creating a global carbon emissions trading model is a successful strategy for reducing global warming using market processes. By considering various environmental regulatory measures, Yenipazarli. (2016) investigates the pricing game between enterprises and their economic or environmental advantages. To study how government environmental behavior affects business green technology innovation, Madani and Rasti-Barzoki. (2017) created a Stackelberg model with the government as the leader and manufacturers and retailers as the followers. By developing a three-stage Stackelberg model, Long et al. (2019) explored the effect of governmental behavior policies on corporate strategy.
As a result, previous research has primarily used the Gounod and Stackelberg game model to examine the behavioral tactics used by businesses subject to environmental legislation. In contrast to the assumption of completely rational conduct in game theoretic models, the assumption of bounded rationality in evolutionary game theory is more pertinent (Madani and Rasti-Barzoki, 2017).
In conclusion, to address the previous research gaps, this paper will fill the aforementioned gaps from the following points: firstly, this paper takes into account the limited innovation capacity of low-carbon technologies and includes both SM building material manufacturers and research institutes in the evolutionary game model, and incorporates the revenue allocation coefficients into the variable assumptions in order to maintain the stability of their cooperation. Second, the four stages of ILC theory are introduced into the EGT. Based on the analysis of government subsidies and carbon tax, the influence of other influencing factors on the evolution of tripartite subjects is further explored.
Drawing on EGT, the three objectives of this study are stated as follows:
1) To reduce carbon emissions, should the government provide subsidies to SM building material manufacturers to encourage the production of LBM? Or would it be more effective to impose a so-called carbon tax on products that harm the environment?
2) What is the government’s role in each stage of ILC for low-carbon building materials?
3) Under different carbon tax and subsidy combinations, is the size of the income distribution coefficient between SM building material manufacturers and scientific research institutes conducive to encouraging manufacturers to produce LBM?
3 Evolutionary game model
3.1 Assumptions
Hypothesis 1: As shown in Figure 1, this study involves three participants: the government, SM building material manufacturers, and scientific research institutes. The strategy of government departments is
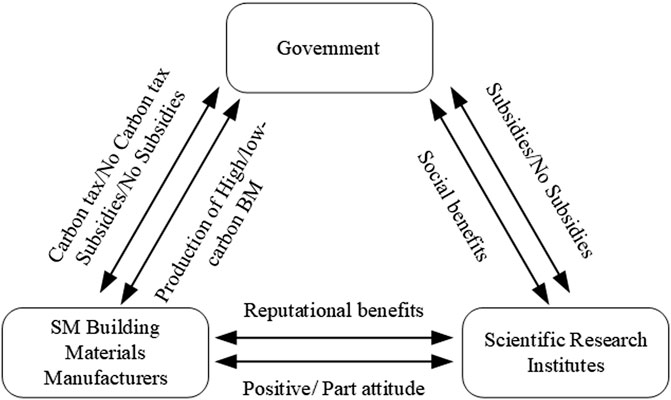
FIGURE 1. Game relationship among government, SM building material manufacturers, and scientific research institutes.
Hypothesis 2: The probability of absolute policy support by the government is
Hypothesis 3: The cost of absolute policy support for the government is
Hypothesis 4: SM building materials manufacturers do not have strong technical conditions and the ability to develop low-carbon and environmental protection alone, so they can only buy from scientific research institutes or sign cooperation contracts. The revenue of LBM production is
Hypothesis 5: The cost of implementing part of the attitude of scientific research institutes is
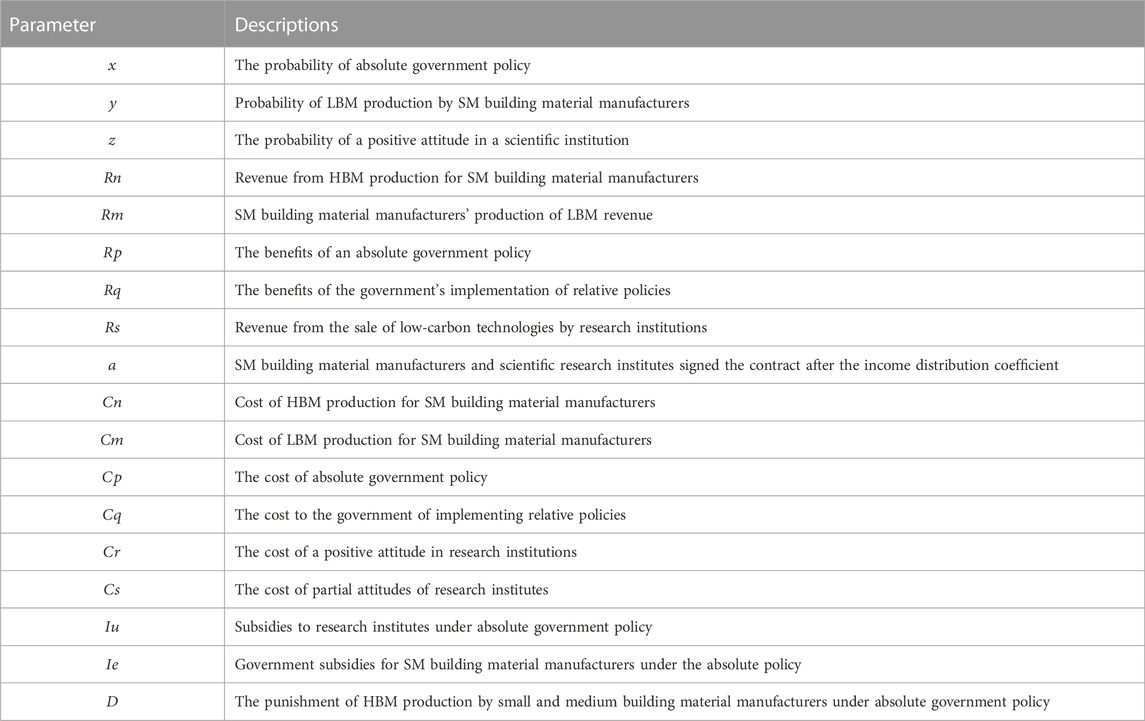
TABLE 1. Description of significant parameters.
3.2 Establishment of income model
The payoff matrix of the evolutionary game model can be obtained according to the basic assumptions and the setting of the payoff and loss parameters, as shown in Table 2.
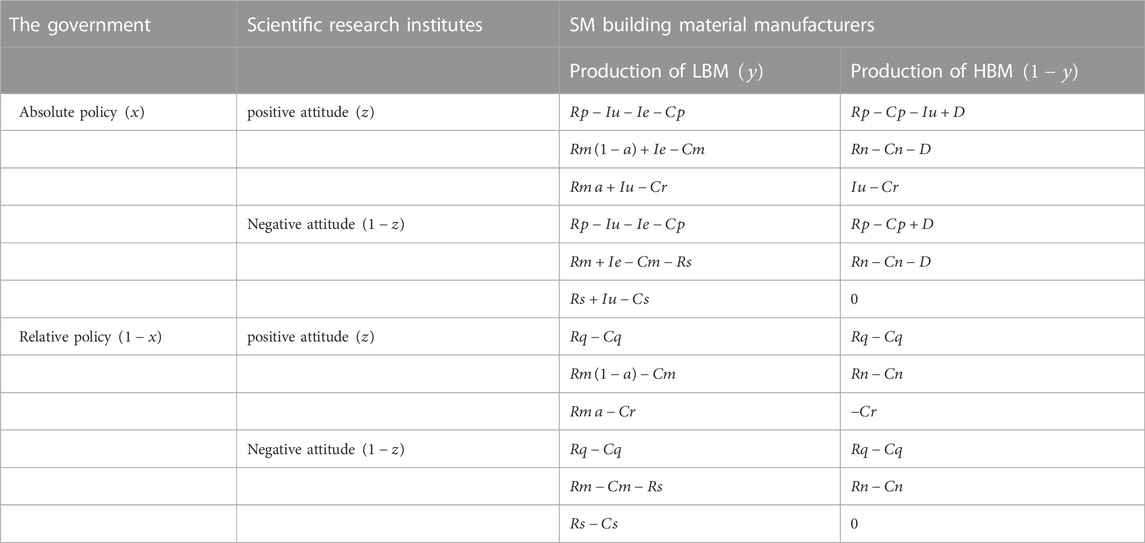
TABLE 2. Payoff matrix of the three-party game mode.
3.2.1 Expected revenue for the government
As shown in Table 2, when the government adopts an absolute incentive policy (
According to Equations 1–3, the dynamic replication equation of the government is denoted as
Let’s set it equal to 0:
Taking the first derivative leads to the following:`
According to the stability theorem of differential equations, the probability of the government choosing absolute policies in a stable state must meet the following requirements:
Proposition 1
1) If
2) If
3) If
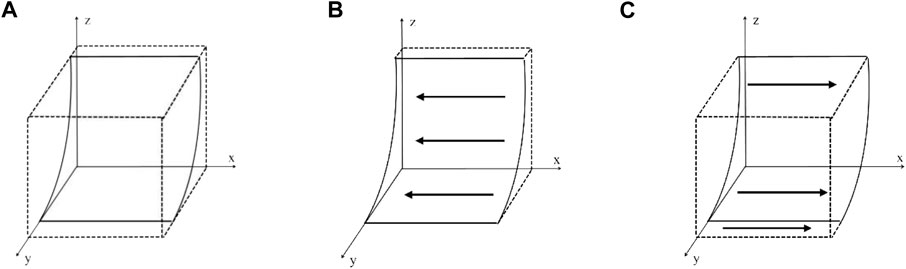
FIGURE 2. Dynamic evolution phase diagrams of government.
3.2.2 Expected revenue for SM building material manufacturers
SM building materials manufacturers produce LBM
Based on Equations 6–8, the dynamic replication equations of SM building material manufacturers are denoted as
Let’s set it equal to 0:
Taking the first derivative leads to the following:
According to the stability theorem of a differential equation, the probability of LBM production by SM building material manufacturers in a stable state must meet the following requirements:
Proposition 2
1) If
2) If
3) If
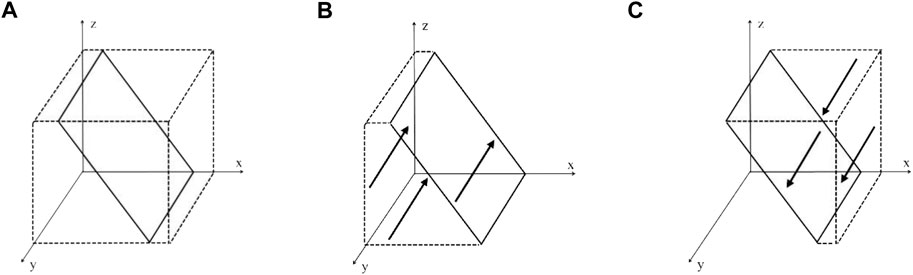
FIGURE 3. Dynamic evolution phase diagrams of SM building material manufacturers.
3.2.3 Expected revenue for research institutes
When the research institute has a positive attitude
According to Equations 11–13, the dynamic replication equation of scientific research institutes is denoted as
Let’s set it equal to 0:
Taking the first derivative leads to the following:
According to the stability theorem of a differential equation, the probability of a positive attitude in a scientific research institute in a stable state must meet the following requirements:
Proposition 3
1) If
2) If
3) If
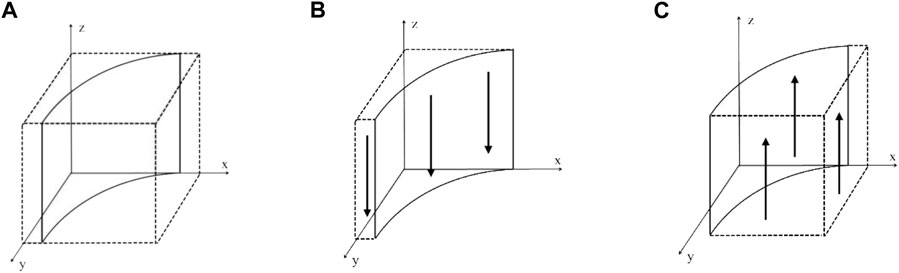
FIGURE 4. Dynamic evolution phase diagrams of research institutes.
3.3 Analysis of the game trend of evolutionary game theory
In conclusion, the Jacobian matrix
Let
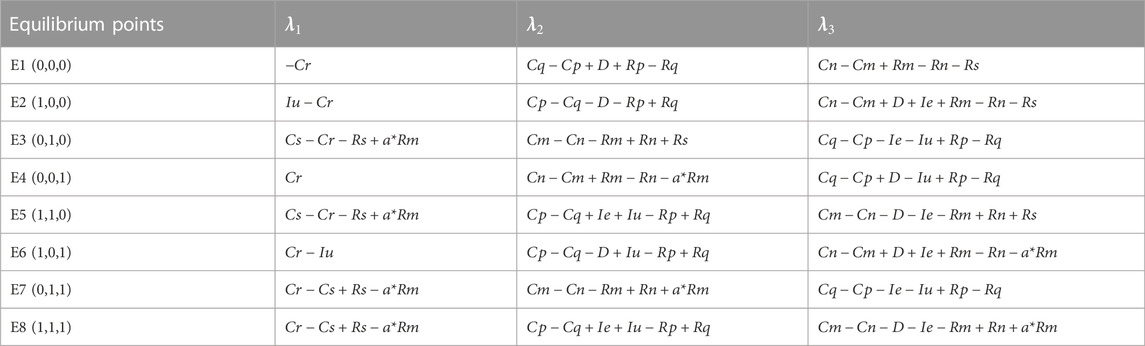
TABLE 3. Eigenvalues of Jacobian matrix at eight equilibrium points.
According to modern control theory, the equilibrium point is asymptotically stable when all
According to the industry development theory, the stability and evolution process of SM building material manufacturers should be considered from the perspective of ILC. The industry life cycle is defined as the process from emergence to complete withdrawal from social and economic activities. Including initial period, rapid growth, steady development, and maturity (Cucculelli and Peruzzi, 2020). This study aims to divide ILC in the LBM industry into four stages.
Stage I: Initial phase. At this stage, SM building material manufacturers and scientific research institutes, LBM’s R&D and production costs are higher than the profits, and the policy intensity is low. The government has realized that it should play its leading role and adopt a series of incentive and punishment policies to promote the development of the LBM industry. Specifically, the net utility of the government when implementing relative policies is greater than the net utility of implementing relative policies (i.e.
Stage II: Rapid growth. At this stage, due to the government’s vigorous publicity and the application of incentive policies, SM building material manufacturers began to produce LBM actively. Specifically, the net utility of the government’s relative policies is less than the benefits of the government’s absolute policies minus costs and subsidies (i.e.
Stage III: Steady development. At this stage, as the production of LBM by SM building material manufacturers has grown and begun to take shape, scientific research institutes also actively pursue more excellent benefits. In particular, the government reaped considerable benefits from promoting low-carbon behavior (i.e.
Stage IV: Mature phase. At this stage, the LBM industry has developed economies of scale. The government has been able to retreat from its dominant position. Specifically, under the premise that the government’s absolute policy provides subsidy incentives, the benefits of the government’s implementation of absolute policy minus costs and subsidies are smaller than the net utility of the government’s implementation of relative policies (i.e.
4 Numerical simulation
In this section, we use MATLAB R2016a to conduct numerical simulation experiments. Considering that many variables and parameters are involved, and the relationship between them is complex, it is not easy to measure in actual cases, so this study does not set values according to specific topics. The initial parameters were assessed through a questionnaire survey, inquiry of industry experts, and reference of previous papers published in similar research. On this basis, the initial value Settings are shown in Table 4.
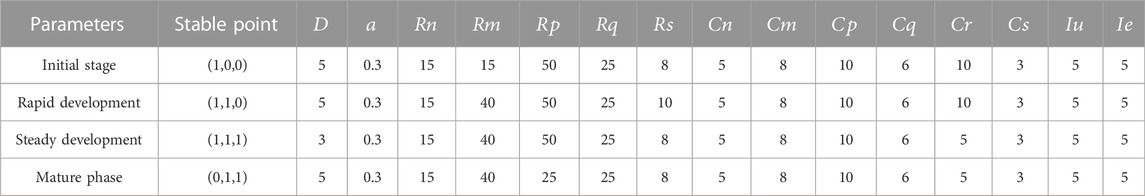
TABLE 4. Parameter values of each stage in the evolutionary game model.
4.1 Multi-stage dynamic evolution results
4.1.1 Dynamic evolution of stakeholders in the initial stage
Following the stability conditions calculated above in the initial phase (i.e.
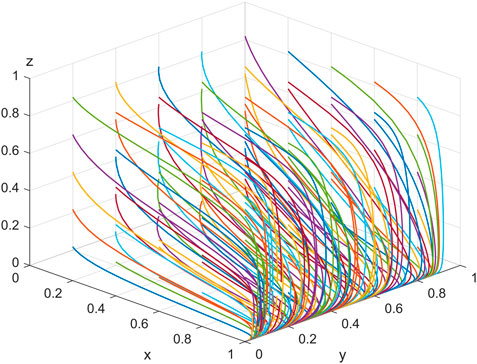
FIGURE 5. System evolution in the initial stage.
4.1.2 Dynamic evolution of stakeholders in the rapid development stage
Similarly, the simulation is performed using stability conditions (i.e.
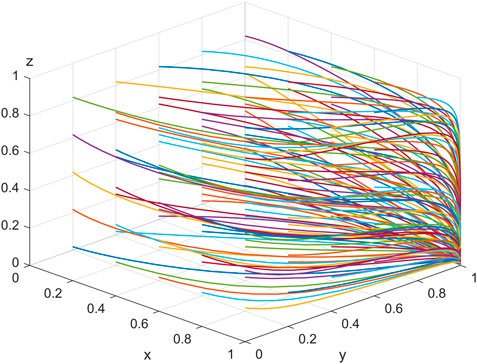
FIGURE 6. System evolution process in the rapid development stage.
4.1.3 The dynamic evolution of stakeholders in the stable development stage
According to the stable development stage shown in Table 4, the corresponding stability conditions of each parameter value include (
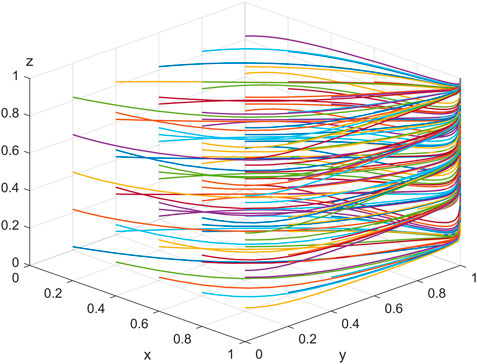
FIGURE 7. System evolution process in the steady development stage.
4.1.4 The dynamic evolution of stakeholders in the mature stage
Based on the stability conditions at maturity (i.e.
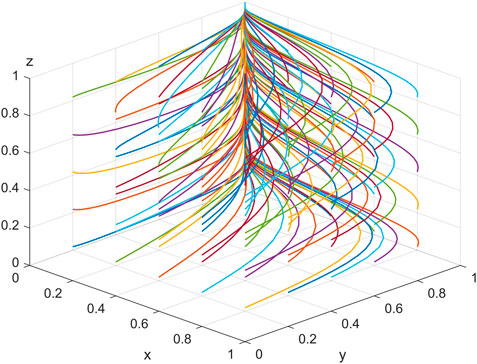
FIGURE 8. System evolution process at a mature stage.
4.2 Impact of a carbon tax on the path
The carbon tax
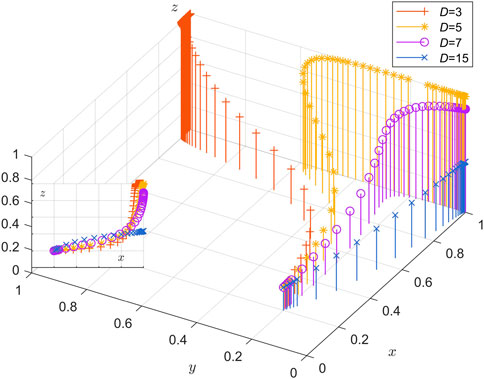
FIGURE 9. Impact of a carbon tax
4.3 The size of government input cost under the absolute policy
The absolute policy cost to the government is a significant obstacle to monitoring the LBM industry. To this end, the simulation results are shown in Figure 10 for four values of
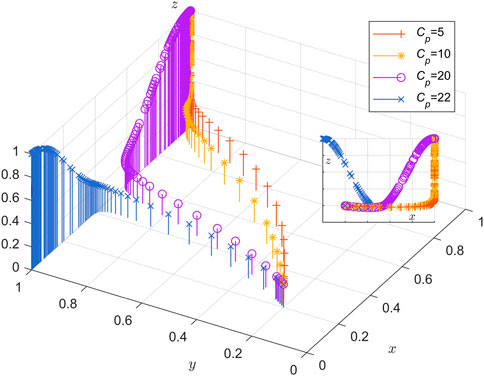
FIGURE 10. Impact of cost
4.4 Green subsidies for SM building material manufacturers under the absolute attitude of the government
See Figure 11. Numerical simulations were performed for
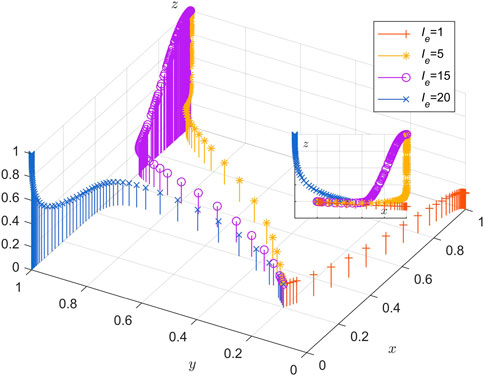
FIGURE 11. The influence of subsidized
4.5 Revenue from selling technology of research institutes under relative attitude
Part of the attitude of research institutes to sell
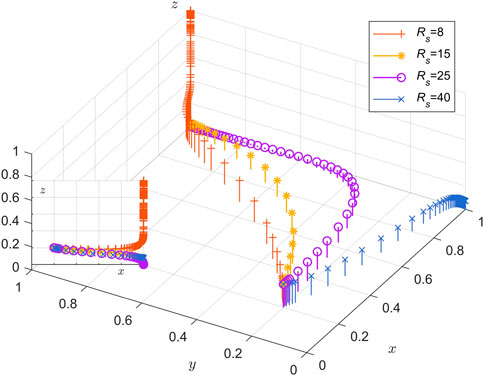
FIGURE 12. The impact of revenue
4.6 Size of distribution coefficient
We set
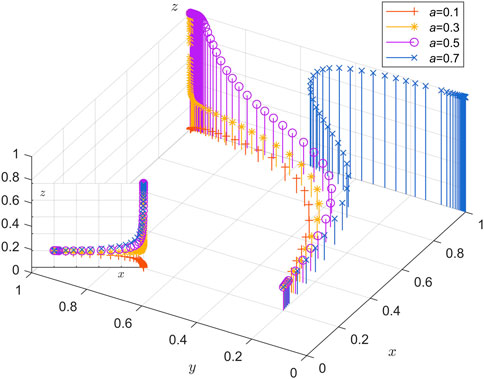
FIGURE 13. Influence of coefficient
5 Discussion and policy recommendations
5.1 Low-carbon building materials industry promotion mechanism
In the initial stage, the LBM industry is in its infancy, and the market is full of unknowns in terms of capital and technology. At this time, the government should play a leading role. The immaturity of the technology and the shortage of capital lead to higher costs, which largely hinder the development intention of SM building materials manufacturers. Firstly, the government should vigorously promote the advantages of green and low-carbon and raise the low-carbon awareness of manufacturers, therefore, the government can introduce a series of subsidies, guidance policies, and other incentive measures. Secondly, the government should develop punitive measures by introducing carbon emission taxes and environmental pollution fines for those SM building materials manufacturers who still produce HBM. Since research institutes do not see the prospective market for LBM. In this regard, the future development of the LBM market should be promoted through effective government.
In the stage of rapid and steady development, SM building materials manufacturers, with the assistance of government and research institutes, become the main body leading the whole market. Firstly, in order to reduce the investment of government regulation costs, the government should change to a relative attitude. Secondly, continue to stimulate and guide SM building materials manufacturers and research institutes to actively cooperate and join the LBM industry. Encourage the transformation from the original supply chain model of purchasing technology to the green service model of signing contracts between the two parties, and link the benefits of both through the revenue allocation coefficient to motivate research institutes to optimize their technology and avoid opportunistic behavior.
In the mature stage, the LBM industry has developed according to certain economic laws, and both sides of the cooperation have clarified their respective costs and benefits. At this stage, it is more important to focus on the institutional aspect, especially the market-oriented rules, standards, and even laws for LBM should be further established and improved. The previous incentive of allowance should be gradually changed to the institutional incentive to reduce the dependence of the LBM industry on the government. Secondly, guiding the establishment of public supervision behavior to regulate the development behavior of both sides of the cooperation is more helpful to the future development of the industry.
5.2 Policy recommendations
1) The government gives subsidy incentives and carbon tax penalties
At the early stage of industry development, fully motivate SM building materials manufacturers and research institutes to participate in LBM, so that the development of LBM becomes a carbon reduction project with the participation of multiple entities. However, we should adhere to the principle of moderation of subsidies and carbon tax penalties, and the amount is not the more the better. The amount of subsidy is too low and cannot play an incentive role for enterprises and research institutes, while the amount is too high will disturb the stability of the market price system and lead to unfair social distribution.
2) The government establishes a sound market development mechanism
The government establishes a reasonable and healthy market development mechanism to attract more SMEs to join it. Gradually change from allowance incentives to system incentives to reduce the dependence of the LBM industry on the government and promote the high-quality and independent rapid development of the LBM industry.
3) Establishment of a social monitoring system by the government
For research institutes to supervise their performance in developing LBM technologies through credit upgrades and downgrades related to their brand value and social image in the research community can help reduce the cost of government oversight. The formation of an autonomous LBM market dominated by SM building materials manufacturers through social oversight, as well as the establishment of public oversight to regulate the development behavior of both partners is more conducive to the future development of the LBM industry.
6 Conclusion
Using green technology to produce LBM is one of the effective ways to control carbon emissions and achieve carbon neutrality. This paper not only considers the limitations of SM building material manufacturers under the constraint of the carbon tax but also considers four stages of LBM production: initial period, rapid growth, steady development, and maturity, and realizes the industry life cycle analysis of LBM, which is more comprehensive than previous studies. Based on the simulation analysis results, the following conclusions are obtained.
This paper considers the industry life cycle process. It obtains: 1) in the initial stage, under the premise of high uncertainty of the market prospect, the government is dominant. Implementing appropriate subsidy incentives and carbon tax penalties under high financial pressure can promote the low-carbon transformation of the other two sides. 2) In the stage of rapid development and stable development, combined with the path evolution slope of
This study discusses the influence of some critical parameters through numerical simulation. The results show that: 1) Lower and higher carbon taxes penalty is not conducive to improving the willingness of SM building material manufacturers and scientific research institutes to choose the low-carbon industry. An appropriate carbon tax penalty can accelerate the production of LBM to a stable state. 2) There is an interdependent relationship between the government and research institutes. In the early stage, the sensitivity of research institutes to cost is similar to that of the government. However, as the government input cost continues to increase, research institutes are full of confidence in the LBM market. They can obtain more social and economic benefits so that the sensitivity will be significantly improved. 3) The subsidy amount of the LBM industry is not the more, the better. The subsidy amount is too low to stimulate enterprises and research institutes, while the subsidy amount is too high to disturb the stability of the market price system, resulting in social distribution injustice. 4) Combined with the path evolution slope of
Although the paper has contributed to the theoretical research, it has some limitations: for data acquisition, there are problems such as time limit and objective reality. The real market situation is much more complex than the simulated game model, and this study is limited to abstracting the three primary agents in LBM production to simplify the model. In contrast, more agents and variables may need to be considered in the real market. Therefore, it is necessary to carry out further numerical simulation research on this aspect.
Data availability statement
The original contributions presented in the study are included in the article/supplementary material, further inquiries can be directed to the corresponding author.
Author contributions
QX and YL: Conceptualization, first draft writing, and approach are handled. CC: oversight and formal evaluation. Variable construction, FL: Data management.
Conflict of interest
The authors declare that the research was conducted in the absence of any commercial or financial relationships that could be construed as a potential conflict of interest.
Publisher’s note
All claims expressed in this article are solely those of the authors and do not necessarily represent those of their affiliated organizations, or those of the publisher, the editors and the reviewers. Any product that may be evaluated in this article, or claim that may be made by its manufacturer, is not guaranteed or endorsed by the publisher.
References
Amiri-Pebdani, S., Alinaghian, M., and Safarzadeh, S. (2022). Time-of-use pricing in an energy sustainable supply chain with government interventions: A game theory approach. Energy 255, 124380. doi:10.1016/j.energy.2022.124380
Aristei, D., Vecchi, M., and Venturini, F. (2016). University and inter-firm R&D collaborations: Propensity and intensity of cooperation in Europe. J. Technol. Transf. 41 (4), 841–871. doi:10.1007/s10961-015-9403-1
Barbaroux, P. (2014). From market failures to market opportunities: Managing innovation under asymmetric information. J. Innovation Entrepreneursh. 3 (1), 5. doi:10.1186/2192-5372-3-5
Chen, J., Shen, L., Song, X., Shi, Q., and Li, S. (2017). An empirical study on the CO2 emissions in the Chinese construction industry. J. Clean. Prod. 168, 645–654. doi:10.1016/j.jclepro.2017.09.072
Cucculelli, M., and Peruzzi, V. (2020). Innovation over the industry life-cycle. Does ownership matter? Res. Policy 49 (1), 103878. doi:10.1016/j.respol.2019.103878
Fan, K., and Hui, E. C. M. (2020). Evolutionary game theory analysis for understanding the decision-making mechanisms of governments and developers on green building incentives. Build. Environ. 179, 106972. doi:10.1016/j.buildenv.2020.106972
Fan, K., and Wu, Z. (2020). Incentive mechanism design for promoting high-level green buildings. Build. Environ. 184, 107230. doi:10.1016/j.buildenv.2020.107230
Fan, R., Wang, Y., Chen, F., Du, K., and Wang, Y. (2022). How do government policies affect the diffusion of green innovation among peer enterprises? - an evolutionary-game model in complex networks. J. Clean. Prod. 364, 132711. doi:10.1016/j.jclepro.2022.132711
He, L., and Chen, L. (2021). The incentive effects of different government subsidy policies on green buildings. Renew. Sustain. Energy Rev. 135, 110123. doi:10.1016/j.rser.2020.110123
Hu, S., Yan, D., Azar, E., and Guo, F. (2020). A systematic review of occupant behavior in building energy policy. Build. Environ. 175, 106807. doi:10.1016/j.buildenv.2020.106807
Hussain, J., Lee, C.-C., and Chen, Y. (2022). Optimal green technology investment and emission reduction in emissions generating companies under the support of green bond and subsidy. Technol. Forecast. Soc. Change 183, 121952. doi:10.1016/j.techfore.2022.121952
Ji, M. (2021). Game analysis on constructing the model of an international carbon emissions trading model. Chin. J. Popul. Resour. Environ. 19 (1), 82–87. doi:10.1016/j.cjpre.2021.12.008
Jiang, N., Feng, Y., and Wang, X. (2022). Fractional-order evolutionary game of green and low-carbon innovation in manufacturing enterprises. Alexandria Eng. J. 61 (12), 12673–12687. doi:10.1016/j.aej.2022.06.040
Jin, H., Hang, Y., and Li, Y. (2021). Carbon Dumping, Carbon Neutral: The ambition of a great nation, the building materials industry must take charge. China Build. Mater. 2, 26–33. doi:10.16291/j.cnki.zgjc.2021.02.006
Khan, S., Maheshwari, N., Aglave, G., and Arora, R. (2020). Experimental design of green concrete and assessing its suitability as a sustainable building material. Mater. Today Proc. 26, 1126–1130. doi:10.1016/j.matpr.2020.02.225
Li, M., and Gao, X. (2022). Implementation of enterprises’ green technology innovation under market-based environmental regulation: An evolutionary game approach. J. Environ. Manag. 308, 114570. doi:10.1016/j.jenvman.2022.114570
Li, Z. (2016). Exploring contractual governance mechanisms for government public service purchases. China Adm. 02, 45–50.
Liu, L., Wang, Z., and Zhang, Z. (2021). Matching-game approach for green technology investment strategies in a supply chain under environmental regulations. Sustain. Prod. Consum. 28, 371–390. doi:10.1016/j.spc.2021.06.001
Liu, Z., Qian, Q., Hu, B., Shang, W.-L., Li, L., Zhao, Y., et al. (2022). Government regulation to promote coordinated emission reduction among enterprises in the green supply chain based on evolutionary game analysis. Resour. Conservation Recycl. 182, 106290. doi:10.1016/j.resconrec.2022.106290
Long, R., Yang, J., Chen, H., Li, Q., Fang, W., and Wang, L. (2019). Co-evolutionary simulation study of multiple stakeholders in the take-out waste recycling industry chain. J. Environ. Manag. 231, 701–713. doi:10.1016/j.jenvman.2018.10.061
Madani, S. R., and Rasti-Barzoki, M. (2017). Sustainable supply chain management with pricing, greening and governmental tariffs determining strategies: A game-theoretic approach. Comput. Industrial Eng. 105, 287–298. doi:10.1016/j.cie.2017.01.017
Mohsin, A. K. M., Far Abid Hossain, S., Tushar, H., Iqbal, M. M., and Hossain, A. (2021). Differential game model and coordination model for green supply chain based on green technology research and development. Heliyon 7 (8), e07811. doi:10.1016/j.heliyon.2021.e07811
Ni, S., Liu, H., Li, Q., Quan, H., Gheibi, M., Fathollahi-Fard, A. M., et al. (2022). Assessment of the engineering properties, carbon dioxide emission and economic of biomass recycled aggregate concrete: A novel approach for building green concretes. J. Clean. Prod. 365, 132780. doi:10.1016/j.jclepro.2022.132780
Norouzi, N., Fani, M., and Talebi, S. (2022). Green tax as a path to greener economy: A game theory approach on energy and final goods in Iran. Renew. Sustain. Energy Rev. 156, 111968. doi:10.1016/j.rser.2021.111968
Olubunmi, O. A., Xia, P. B., and Skitmore, M. (2016). Green building incentives: A review. Renew. Sustain. Energy Rev. 59, 1611–1621. doi:10.1016/j.rser.2016.01.028
Shan, S., Duan, X., Ji, W., Zhang, T., and Li, H. (2021). Evolutionary game analysis of stakeholder behavior strategies in ‘Not in My Backyard’ conflicts: Effect of the intervention by environmental Non-Governmental Organizations. Sustain. Prod. Consum. 28, 829–847. doi:10.1016/j.spc.2021.07.012
Shen, L., Song, X., Wu, Y., Liao, S., and Zhang, X. (2016). Interpretive Structural Modeling based factor analysis on the implementation of Emission Trading System in the Chinese building sector. J. Clean. Prod. 127, 214–227. doi:10.1016/j.jclepro.2016.03.151
Song, X., Yang, J., and Liu, J. (2012). Environmental benefit assessment of blast furnace slag resource production of green building materials: Lifecycle-based perspective. Popul. China·Resources Environ. 22 (4), 51–55.
Teng, Y., and Pan, W. (2020). Estimating and minimizing embodied carbon of prefabricated high-rise residential buildings considering parameter, scenario and model uncertainties. Build. Environ. 180, 106951. doi:10.1016/j.buildenv.2020.106951
Wang, Y., Cao, Y., Zhang, M., and Wang, Z. (2022). Opportunities and challenges: The impact of carbon emissions trading on enterprises in the building materials industry. China Build. Mater. 5, 94–95. doi:10.16291/j.cnki.zgjc.2022.05.025
Wasserbaur, R., Sakao, T., and Milios, L. (2022). Interactions of governmental policies and business models for a circular economy: A systematic literature review. J. Clean. Prod. 337, 130329. doi:10.1016/j.jclepro.2021.130329
Wu, Z., and Ma, G. (2022). Incremental cost-benefit quantitative assessment of green building: A case study in China. Energy Build. 269, 112251. doi:10.1016/j.enbuild.2022.112251
Yenipazarli, A. (2016). Managing new and remanufactured products to mitigate environmental damage under emissions regulation. Eur. J. Operational Res. 249 (1), 117–130. doi:10.1016/j.ejor.2015.08.020
Zhao, R., Neighbour, G., Han, J., McGuire, M., and Deutz, P. (2012). Using game theory to describe strategy selection for environmental risk and carbon emissions reduction in the green supply chain. J. Loss Prev. Process Industries 25 (6), 927–936. doi:10.1016/j.jlp.2012.05.004
Zhou, X., Jia, M., Wang, L., Sharma, G. D., Zhao, X., and Ma, X. (2022). Modelling and simulation of a four-group evolutionary game model for green innovation stakeholders: Contextual evidence in lens of sustainable development. Renew. Energy 197, 500–517. doi:10.1016/j.renene.2022.07.068
Keywords: industry life cycle, low-carbon building materials, incentive policy, income distribution coefficient, evolutionary game
Citation: Xu Q, Liu Y, Chen C and Lou F (2023) Research on multi-stage strategy of low carbon building material’s production by small and medium-sized manufacturers: A three-party evolutionary game analysis. Front. Environ. Sci. 10:1086642. doi: 10.3389/fenvs.2022.1086642
Received: 01 November 2022; Accepted: 20 December 2022;
Published: 10 January 2023.
Edited by:
Marcos Ferasso, Autonomous University of Lisbon, PortugalReviewed by:
Rui Huang, Nanjing Normal University, ChinaBor-Sen Chen, National Tsing Hua University, Taiwan
Copyright © 2023 Xu, Liu, Chen and Lou. This is an open-access article distributed under the terms of the Creative Commons Attribution License (CC BY). The use, distribution or reproduction in other forums is permitted, provided the original author(s) and the copyright owner(s) are credited and that the original publication in this journal is cited, in accordance with accepted academic practice. No use, distribution or reproduction is permitted which does not comply with these terms.
*Correspondence: Yuyang Liu, bGl1eXV5YW5nMDcyMUAxNjMuY29t