 Zhaoyang Song
 Yuming Zhang
94% of researchers rate our articles as excellent or good
Learn more about the work of our research integrity team to safeguard the quality of each article we publish.
Find out more
ORIGINAL RESEARCH article
Front. Environ. Sci., 01 December 2022
Sec. Atmosphere and Climate
Volume 10 - 2022 | https://doi.org/10.3389/fenvs.2022.1086492
This article is part of the Research TopicClimate-Environment Interactions under Global WarmingView all 25 articles
The Pliocene epoch from about 5.3 million to about 2.6 million years before present is the most recent period of sustained global warmth similar to the near future projections. The restriction of the Indonesian Passages, the closure of the Panama Seaway and declining atmospheric CO2-concentration are suggested to have caused the global climate evolution to the present-day condition. Here, we present the Pliocene sea surface temperature (SST) reconstructions along with sensitivity experimental results from a coupled General Circulation Model. We find that, in terms of SST, simulated model sensitivity to CO2 is in good agreement with the Pliocene reconstructions in most regions except the North Atlantic and Arctic. This suggests the necessity for improved boundary conditions and a possible underestimation of internal climate feedback at the high-latitudes. The responses of East Asian Summer Monsoon (EASM) to the oceanic gateway and CO2 are investigated. Influences of declining CO2 on the EASM are more prominent. An intensification of the intensity of EASM by ∼50% is simulated in response to the declining CO2, which is largely attributed to the strengthened land-ocean thermal contrast, while the precipitation decreases by ∼4.8%. In contrast, the restriction of two seaway changes only drives relatively weak changes with respect to wind speed and precipitation. A water vapor budget analysis suggests that the reduced atmospheric moisture content due to decreasing CO2 significantly contributes to precipitation response.
The Pliocene epoch, from 5.3 to 2.6 million years ago (Ma), was characterized as a period of global cooling and evolving towards present-day climate. Paleo-geochemical proxies indicate an atmospheric CO2-concentration similar to the present-day values, with concentrations amounting to ∼405 p.p.m. (parts per million; Haywood et al., 2011). Specifically, the global mean temperature during the mid-Pliocene (∼3.3–3 Ma) was 2–3°C warmer, global sea level 25 m higher than today (Dowsett et al., 2016). The Northern Hemisphere continental ice sheet extensively developed, especially over Greenland, in the late Pliocene around 3 Ma (e.g., Lisiecki and Raymo, 2005; Rohling et al., 2014).
During the Pliocene, a number of significant changes in oceanic gateway created the modern ocean geometry and had profound effects on global and regional climate evolution (e.g., Haug and Tiedemann, 1998; Cane and Molnar, 2001). The closure of the Panama Seaway that connected the tropical Atlantic to the Pacific has been one of the predominant seaway changes. The tectonic evolution of the Panama Seaway is complex and long-lasting for millions of years since early Miocene (23–25 Ma; Farris et al., 2011). From an oceanographic perspective, a critical threshold is the constriction of deep-water flow. Montes et al. (2015) suggests that deep and intermediate water mass exchange between both basins had already vanished at ∼15 Ma. However, ocean records indicate the existence of upper-ocean connections between the Caribbean Sea and the Pacific until the Pliocene (Haug et al., 2001). Notably, palaeoceanographic data indicate that the final closure of the Panama Seaway between ∼4.8–4 Ma were still sufficient to influence the ocean circulation and global climate (Steph et al., 2010). Numerical modelling studies show that the final closure enhances the Atlantic Meridional Overturning Circulation (AMOC), by differing magnitudes depending on the configuration of the seaway and the selection of climate models (Zhang X. et al., 2012), as the closure of seaway enhances the salinity contrast between the Pacific and Atlantic. Enhanced AMOC is also suggested to have caused the shoaling of thermocline depth in the east equatorial Pacific (Steph et al., 2010), which is supported by model results (Zhang X. et al., 2012). The shoaled thermocline depth may have preconditioned the modern Pacific cold tongue and favoured the development of ENSO. On the other hand, the warmer SSTs in the North Atlantic associated with strengthened AMOC would have increased the precipitation and presumably glaciation over Greenland (Haug and Tiedemann, 1998). However, paleoclimate reconstructions suggest gradual cooling in the North Atlantic at the same period (Lawrence et al., 2010). Furthermore, climate model experiments suggest the glaciation over Greenland is controlled by declining CO2 but not increased precipitation (Lunt et al., 2008).
The constriction of the Indonesian Passages is due to the collision between Australia and Southeast Asia. Since the earliest Miocene (∼25 Ma) Australia has been moving northward slowly and converging with Asia. Following the final closure of the Panama Seaway (∼4.8–4 Ma), the restriction of the Indonesian Passages (∼4–3 Ma) played a prominent role in constraining warm and salty water entering the Indian Ocean from the Pacific (e.g., Karas et al., 2009; Karas et al., 2017). Karas et al. (2017) further suggested that the constriction of the Indonesian Passages might have weakened the AMOC by reducing the salinity transport into the Atlantic Ocean from the Indian Ocean. Such change is suggested to have preconditioned the onset of Northern Hemisphere Glaciation and influenced global climate, including the aridification of East Africa (Cane and Molnar, 2001). However, Jochum et al. (2009) found rather weak global climate impact of an altered Indonesian Passages with coupled climate model simulations. The simulated climatic impact is observed only in the equatorial Pacific and the properties of ENSO. Additionally, Krebs et al. (2011) found that the restricted Indonesian Passages could explain the aridification of north-western Australia during the Plio–Pleistocene.
The East Asian Summer Monsoon (EASM) is one major component in the global climate system and provides fresh water resources for the most populated regions in the world. The EASM is mainly driven by the land-ocean thermal contrast. Due to the different thermal capacity of land and ocean, a warm low-pressure system over the East Asia continent drives southerly winds and brings precipitation into East Asia during boreal summer (June-July-August, JJA). Multiple geological evidence for surface air temperature and precipitation revealed the EASM evolution since the Pliocene. Biological and geochemical records indicate drying climate and weakening EASM trend from 4.5 to 2.7 Ma on the Chinese Loess Plateau (e.g., Wang et al., 2006; Ge et al., 2013). However, recent magnetic proxies contradict these records, which revealed a cooling and wetting climate at the same period (Nie et al., 2014). Furthermore, by extending the rock magnetic parameter record to ∼4.8–4.3 Ma, Nie et al. (2014) suggests a link between the final closure of the Panama Seaway and enhanced precipitation associated with intensified EASM. The idea is that the closure of Panama Seaway strengthened the high-pressure centre over the North Pacific, enhancing Southerly winds, which in turn intensify the precipitation brought by EASM (Nie et al., 2014). A group of proxy data with a decent age control ranging from 3.0 to 3.3 Ma, which indicates relatively reliable cooling temperature and/or decreasing precipitation, suggests a weakening trend of EASM since the mid-Pliocene. Atmospheric CO2-concentration could also modulate the EASM. Modelling studies show a weakening trend of EASM under global warming (Li et al., 2010).
In this study, we investigate the sensitivity of mean climate to external changes during the Pliocene, forced by changes in atmospheric CO2 and ocean geometry. Special attention is given to the influence of final closure of the Panama Seaway (∼4.8–4 Ma) and the restricted of Indonesian Passages, and to the EASM response. The structure is as follows. In Section 2, we describe the coupled model and the experimental design. The validation of model results, responses of mean climate and EASM are presented in Section 3. We conclude with a brief summary and a discussion of the main results in Section 4.
The Kiel Climate Model (KCM, Park et al., 2009) is used in this study. The KCM consists of the ECHAM5 as the atmosphere model (Roeckner et al., 2003) running on a T31 (3.75 ° × 3.75 °) horizontal resolution, with 19 vertical levels up to 10 hPa. It is coupled to the NEMO ocean-sea ice component (Madec, 2008) running on a 2°Mercator mesh, with 31 vertical levels, through the OASIS3 coupler (Valcke, 2006). The meridional resolution for the ocean component enhances towards lower latitudes, with ∼0.5° in the equatorial region. The ocean and the atmosphere component are coupled once per day without employing any form of flux correction.
Four experiments are conducted (Table 1) aiming to separate the model sensitivity of lowering atmospheric CO2, constriction of the Indonesian Passages and closure of the Panama Seaway. The experiment Pre-industrial is simulated with low-CO2 (286 p.p.m.) and modern Indonesian Passages and modern Panama Seaway. This experiment is integrated for 3,200 years starting from the Levitus climatology of temperature and salinity, which serves as a control simulation. Experiment Plio differs from experiment Pre-industrial only in the CO2-concentration which is higher (405 p.p.m.). Plio serves as sensitivity run for the high-CO2 experiments. The other two experiments, which investigate the effects of two seaway changes, are initialized with the output from Plio and integrated for 1,800 years. The last 300-year monthly output from each experiment is used for analysis.
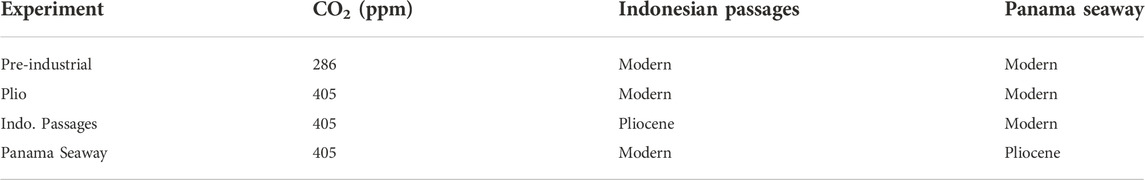
TABLE 1. Experimental setup for the coupled experiments.
The geometry for the Indonesian Passages and the Panama Seaway during the Pliocene are the same as in Song et al. (2017). Cane and Molnar (2001) suggested the deeper and wider geometry of the Indonesian Passages during the Early Pliocene. The passages between Sulawesi and New Guinea are 1,000 m deeper relative to the modern bathymetry. The northern coast of New Guinea is located 2° south due to the missing of the northern part. Additionally, the passage between Timor and Australia is also wider and deeper by removing part of Timor. An open Panama Seaway is represented in the model by replacing four land grids by ocean grids between North and South America at ∼8°N. We employ a depth of 106 m representing an open Panama Seaway to simulate the final stage of the shoaling process between 4.8 and 4.0 Ma (Haug et al., 2001).
We compare the simulated SST with the reconstructions from various types of proxies for the mid-Pliocene. The reconstructed dataset, which consists of 95 globally distributed sites, is from the Pliocene Research, Interpretation and Synoptic Mapping (PRISM) project (Dowsett et al., 2016). The estimates for SST are averaged over the time period between 3.264 and 3.025 Ma. The foraminifera based proxies, which are widely distributed in the low- and mid-latitudes, are of relatively higher confidence compared with other types (Dowsett et al., 2016). The Hadley Centre Sea Ice and Sea Surface Temperature data set (HadISST) is used for the observed SST. The HadISST is on a global 1 ° × 1 ° grid covering 1870–2017. Only a sub-period (1870–1930) average is employed to represent the pre-industrial climatological mean.
In this section, we address the responses of mean state to CO2 and seaway changes (Table 2). Decreasing atmospheric CO2 concentration alters the radiation balance at the top of the atmosphere and hence the poleward heat transport. The constrictions of both seaways allows for the reorganization of large-scale ocean and atmosphere circulation, which redistributes heat and salt. Furthermore, the surface temperature and hydrological cycle also respond to these changes. Lower atmospheric CO2 in Pre-industrial dominates the global averaged SST and 2 m-air-temperature response, which amount to -2.33 K and −3.12 K, while the constriction of Indonesian Passages and the Panama Seaway lead to a slight warming of SST and 2 m-air-temperature amounting to less than 0.5 K (Table 2). The global averaged SST response to decreasing CO2 is within the range (∼2–3°C) estimated from proxies, suggesting the dominant role of CO2 on the surface temperature evolution from the Pliocene to the pre-industrial. Both the Arctic and Antarctic sea ice extent illustrates significant increase at lower CO2 (Table 2). In contrast, the constriction of both seaways reduces the Arctic and Antarctic sea ice with respect to the volume but not the extent. Additionally, lower CO2 significantly enhances the averaged ice sheet accumulation rate by 45.8 mm/yr (∼44%). The constriction of both oceanic gateways slightly slows down the glaciation over Greenland (Table 2). The relative change, however, is less than 10%. Cane and Molnar (2001) and Haug and Tiedemann (1998) hypothesized that both the restriction of the Indonesian Passages and the closure of the Panama Seaway contribute to the Northern Hemisphere Glaciation. Contradictory to their hypothesis, our result suggests that the Northern Hemisphere Glaciation during the late Pliocene may not be attributed to the changes in the oceanic gateways. Despite the enhanced precipitation over Greenland due to both seaway changes, the warmer temperature increases the melting of ice sheet at lower topography. An overall effect of the constriction of both seaways reduces the accumulation of Greenland ice sheet (not shown).
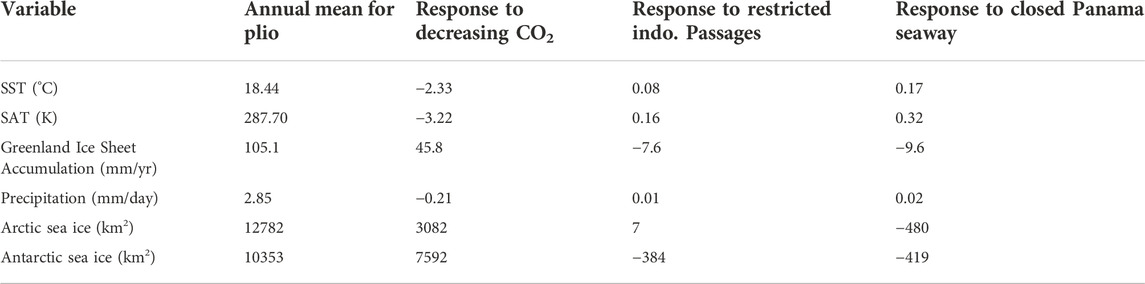
TABLE 2. Global mean statistics for all experiments. Response to decreasing CO2 is defined as the difference between the Pre-industrial and Plio. Response to the restricted Indo. Passages is defined as the difference between the Plio and Indo. Passages. Response to the closed Panama Seaway is defined as the difference between the Plio and Panama Seaway.
Next we examine the responses of zonal mean variables (Figure 1). Lower CO2 cools the zonal mean temperature by ∼2 K, while the impacts of seaway changes hardly show up. Additionally, the precipitation between 10°S and 10°N is suppressed from 5.23 mm/day in Plio to 4.66 mm/day in Pre-industrial, in response to low CO2 (Figure 1). The constriction of Indonesian Passages and the Panama Seaway slightly enhances the precipitation by 0.15 mm/day and 0.19 mm/day over the tropics between 10°S and 10°N relative to Plio (Figure 1B). Increased cloud cover in Pre-industrial strengthens the reemission of radiation, which is consistent with the temperature response (Figure 1C). According to the Clausius-Clapeyron relation, a cooler atmosphere holds less water vapor. As shown in Figure 1D, lower CO2 in Pre-industrial significantly reduces the column integrated water vapor by ∼10 kg/m2 in the tropics (10°S-10°N). The closure of Panama Seaway increases the water vapor content by ∼3 kg/m2 over the tropics, which is stronger than the constriction of the Indonesian Passages (Figure 1D). The influences of both seaway changes barely reach the extratropical region.
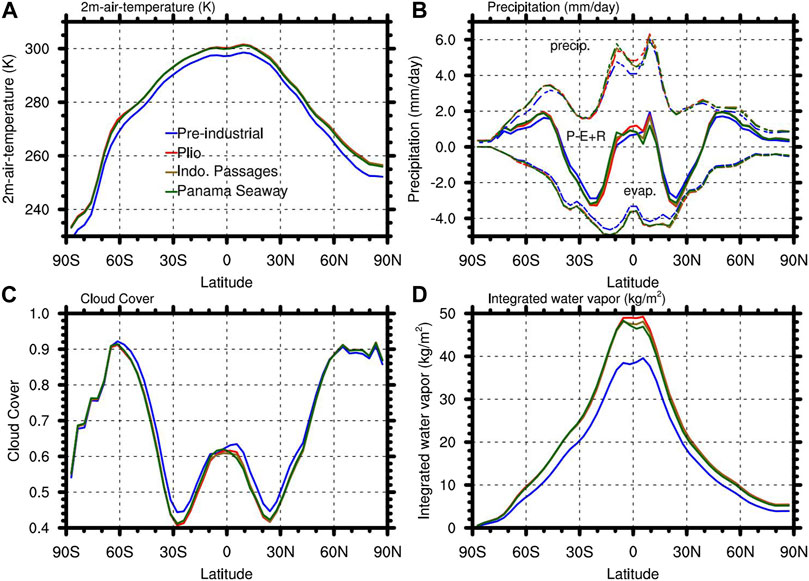
FIGURE 1. (A) Zonally averaged 2 m air temperature (K). (B) Zonally averaged precipitation, evaporation and total freshwater balance (defined as precipitation minus evaporation plus river runoff, in mm/day). (C) Zonally averaged cloud cover. (D) Zonally averaged column integrated water vapor.
The impacts of CO2 and seaway changes on the SST are not spatially homogeneous (Figure 2), indicating the reorganization of large-scale circulation. In response to lower CO2, relatively weaker cooling occurred in the western boundary current regions in the Northern Hemisphere, especially over the Kuroshio and Gulf Stream region (Figure 2A). Both could be attributed to the enhanced heat transport associated with the strengthened North Equatorial Current (NEC), which is driven by the enhanced trade winds (Wang et al., 2006; Duan et al., 2017). The Indonesian Throughflow (ITF) also strengthens from 14.75 Sv in Plio to 15.0 Sv in Pre-industrial, which contributes to the stronger cooling in the Pacific warm pool than the equatorial Indian Ocean. Weaker cooling in the high latitudes is attributed to the increased sea ice extent (Table 2) that hinders the ocean-atmosphere heat exchange. The impacts of two seaway changes are similar, with the closure of the Panama Seaway illustrating stronger effect (Figures 2B,C). The constriction of Indonesian Passages warms the equatorial Pacific and cools the Indian due to a weakening of the ITF by ∼2.7 Sv. Reduced heat transport associated with the ITF further cools the southern Indian and Atlantic Ocean. The closure of Panama Seaway prevented the water exchange amounting to ∼6.5 Sv between the Pacific and the Atlantic. The SST response is asymmetric between two hemispheres, with general warming in the Northern Hemisphere and cooling in the Southern Hemisphere except the Bellingshausen Sea and the Amundsen Sea (Figure 2C).
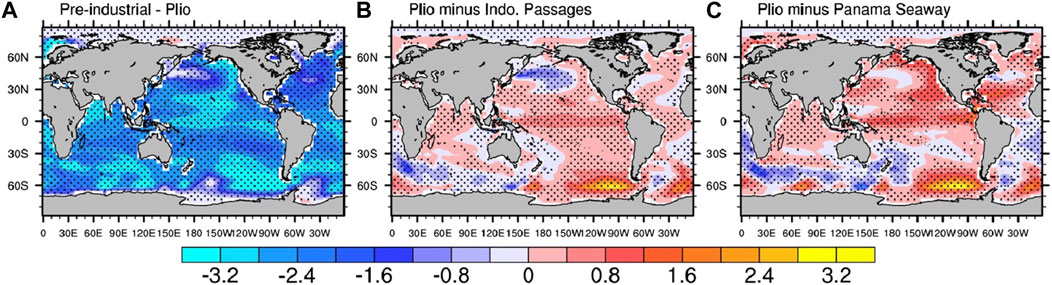
FIGURE 2. SST (°C) responses to (A) decreasing CO2, (B) the constriction of Indonesian Passages and (C) the final closure of Panama Seaway. Stippling indicates the differences are significant at the 95% confidence level using Student’s t-test.
Next we compare the modeled SST with the SST reconstructions from the PRISM project. There are 95 marine locations in total, which are distributed globally (Figure 3A). The re-constructions in low- and northern mid-latitudes are generally of high confidence, while the high- and southern mid-latitude reconstructions are of relatively low confidence, due to the limitations of reconstruction method or a low temporal resolution between 3.264 and 3.025 Ma (Dowsett et al., 2016). We first compare the simulated climatological mean SST with the proxies, and then the simulated SST difference between the Plio and Pre-industrial with the observed difference. Here the observed SST difference between the Plio and Pre-industrial is estimated by subtracting the interpolated HadISST from the PRISM dataset at each proxy location.
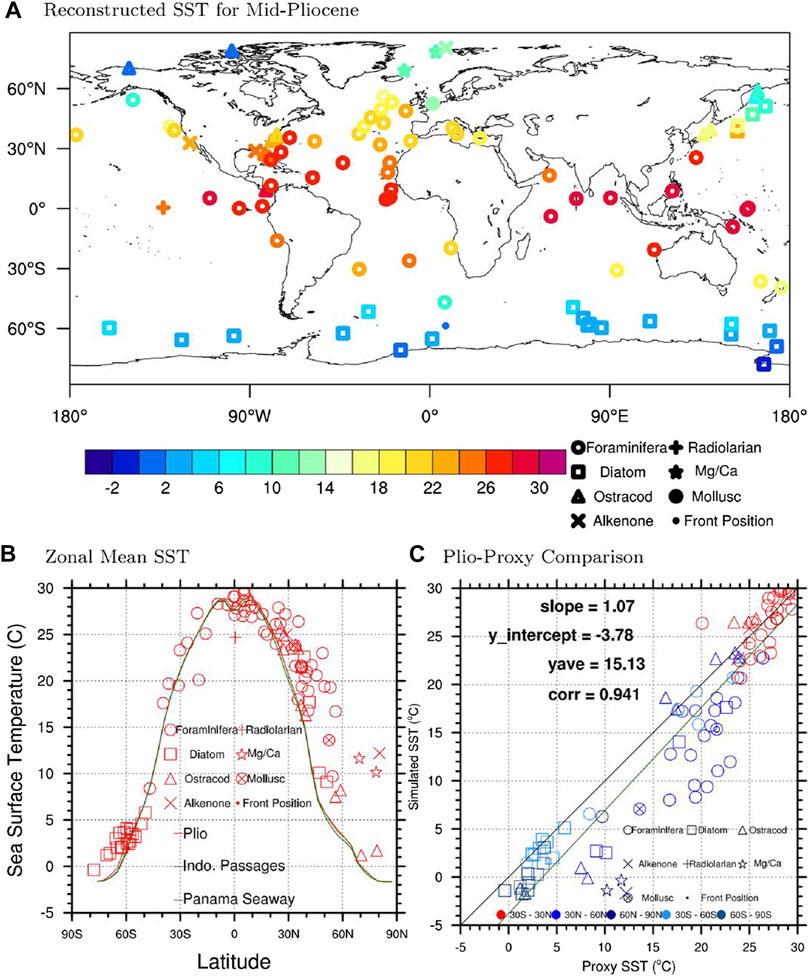
FIGURE 3. Model-data comparison. (A) Mean annual SST from PRISM dataset at 95 sites. (B) SST proxies superimposed on zonally averaged annual mean SST from three high-CO2 simulations. (C) Scatter plot showing the comparison between PRISM3 SSTs and the simulated annual mean SSTs in Plio. The Plio SSTs are interpolated to each proxy site.
To assess the model performance, we first compare the simulated zonally averaged annual mean SST. The high-CO2 experiments with different seaway configurations are generally in good agreement with reconstructions in the Southern Hemisphere, while models substantially underestimate the polar amplification in the Northern Hemisphere (Figure 3B). The model-proxy discrepancy over the northern mid- and high-latitudes amounts to a maximum of ∼10°C, especially over the North Atlantic and Arctic region (not shown). Neither of the tropical seaway changes helps to reduce this discrepancy. A pointwise comparison is further shown in Figure 3C by interpolating the simulated SST in Plio to each proxy site. The annual mean interpolated SST in Plio is 15.13°C, in comparison to an average of 17.67°C for the proxies. Additionally, various types of proxies confirmed the underestimated warming in the Northern Hemisphere.
Apart from the northern mid- and high-latitudes, the SSTs over California and Peru coastal upwelling regions significantly cool down, in comparison to the mid-Pliocene (Figure 4A). On the contrary, the SSTs over the Atlantic upwelling region remain quite stable (Figure 4A). Considering the model bias for the KCM to reproduce pre-industrial mean climate, we calculate the difference between Plio and Pre-industrial to cancel the model errors. The SST changes in the tropics are relatively modest, ranging from −2 to 2°C as suggested by the observations (red symbols in Figure 4B). However, the simulated difference between Plio and Pre-industrial is quite uniform in signs, amounting to ∼2–3°C. This suggests the missing of negative feedbacks or the inaccuracy of boundary conditions in Plio. The southern ocean is still in generally good agreement with the observed SST difference. On the other hand, the model-data discrepancy in the Northern Hemisphere remains quite large, with the simulated SST difference ranging from less than ∼2°C and the observation amounting to ∼9°C. By far, no climate models could fully reproduce the warming during the mid-Pliocene as suggested by the proxies. This may provide new sights into the mid-Pliocene boundary conditions or even the predictive abilities of the climate model.
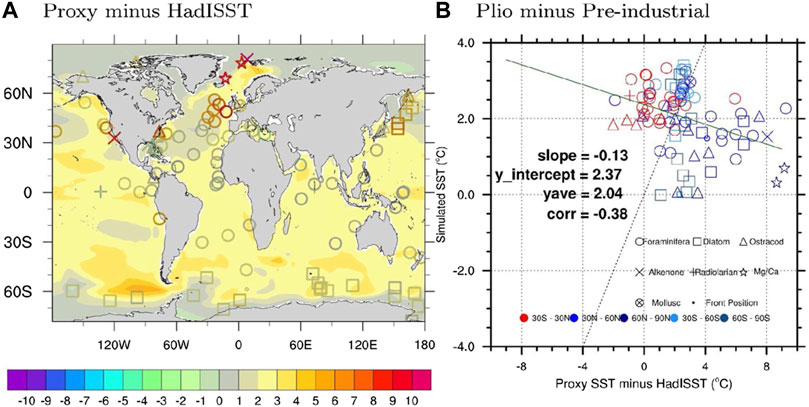
FIGURE 4. (A) Observed difference between PRISM SST dataset and HadISST dataset (averaged between 1870 and 1900) showing the observed SST change between the mid-Pliocene and the pre-industrial. (B) Scatter plot showing the simulated SST difference between Plio and Pre-industrial and the observed SST difference.
In this section, we investigate the responses of EASM to seaway and CO2 changes. Figure 2.10 shows the JJA mean responses of sea level pressure (SLP). While the surface cooling due to decreasing CO2 is globally ubiquitous (not shown), an enhanced land-ocean SLP contrast between the Pacific and East Asia is simulated (Figure 5A). There is a large SLP decrease of about 1.2 hPa over East China (red box in Figure 5). The SLP over the Tibetan Plateau decreases by ∼3.6 h Pa, while there is a weaker positive SLP response over the west Pacific (Figure 5A). In contrast, the restriction of the Indonesian Passages and the Panama Seaway reduces the land–ocean SLP contrast (Figures 5B,C). The seaway changes increase SLP over east China by ∼0.4 hPa and ∼0.6 hPa (green boxes in Figures 5B,C). The impacts of seaway changes on the west Pacific is modest.
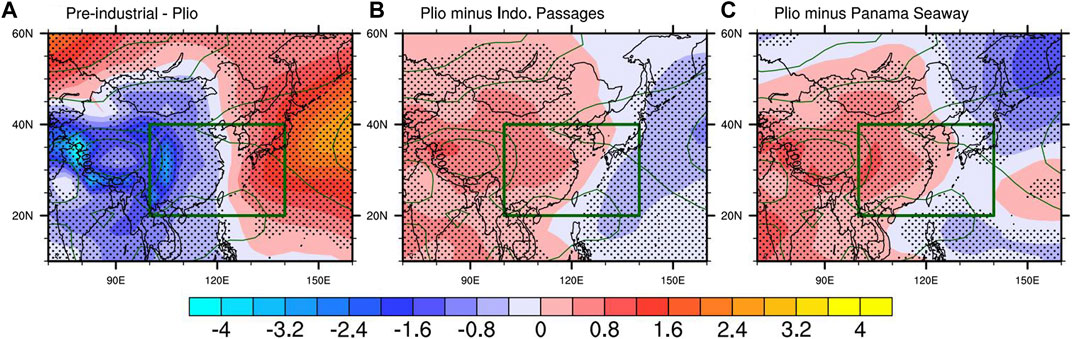
FIGURE 5. Responses (shading) of JJA mean sea level pressure to (A) decreasing CO2, (B) the constriction of the Indonesian Passages and (C) the closure of the Panama Seaway. Contours depict the JJA mean SLP for Plio. Green boxes indicate the range of EASM (20°N–40°N, 100°E–140°E).
Following Yang et al. (2002), we define the intensities of EASM as the JJA mean 850 hPa meridional wind averaged over 20°N–40°N and 100°E–140°E (red boxes in Figure 6). Consis-tent with the SLP response to lower CO2, enhanced land–ocean thermal contrast strengthens the EASM from ∼1.1 m/s in Plio to ∼1.65 m/s in Pre-industrial (Figure 6B). As opposed to the impact of lower CO2, the constriction of Indonesian Passages and the Panama Seaway weakens the EASM intensity to a lesser extent, by ∼0.2 m/s and ∼0.3 m/s, respectively (Figures 6C,D). The SLP response is the dominant driver for the EASM response to seaway changes.
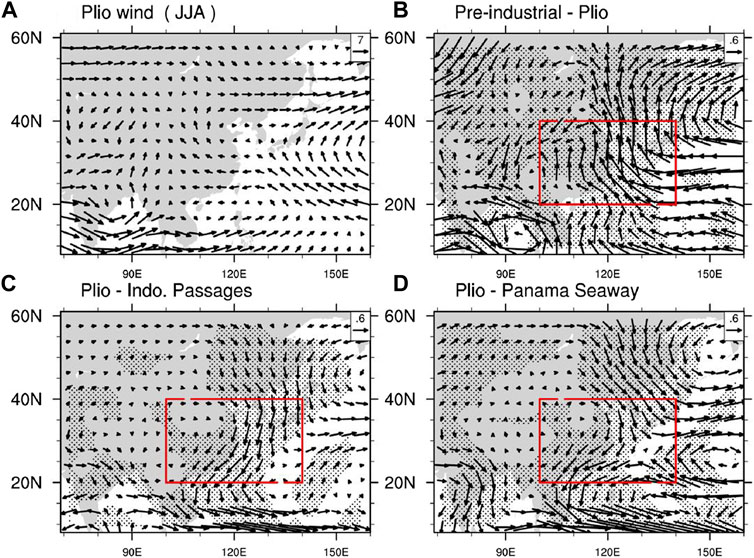
FIGURE 6. Climatological June-July-August (JJA) mean 850 hPa winds for (A) Plio, and its responses to (B) decreasing CO2, (C) the constriction of the Indonesian Passages and (D) the closure of the Panama Seaway. Red boxes indicate the range of EASM (20°N-40°N, 100°E-140°E). Wind vector scales (Unit: m/s) are shown in the upper right corner of each panel. Stippling indicates the differences for meridional wind are significant at the 95% confidence level using Student’s t-test.
The impact of lower CO2 on modulating the precipitation is stronger than that of seaway changes. Despite the enhanced EASM in Pre-industrial, the JJA mean precipitation averaged over the monsoon region decreases to 5.78 mm/day in Pre-industrial, in comparison to 6.20 mm/day in Plio. There is a large decrease of precipitation over the west Pacific (20°N-40°N, 130°E-150°E) amounting to 1.0 mm/day. The precipitation response to lower CO2 over east China is a dipole pattern, with wetter condition in the north and drought in the north (Figure 7A). Both seaway changes induce contradictory precipitation response between east China and the west Pacific (Figures 7B,C). The precipitation over land decreases while increases over the ocean. The overall JJA mean precipitation over the monsoon region slightly reduces by 0.13 mm/day and 0.01 mm/day, in response to the constriction of the Indonesian Passages and the Panama Seaway. The reduced precipitation response over land is associated with the weakened EASM (Figures 6C,D).
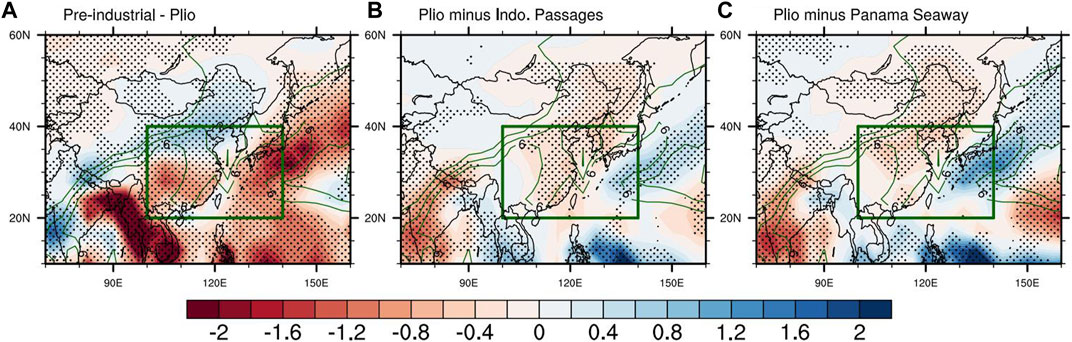
FIGURE 7. Responses (shading) of JJA mean precipitation to (A) decreasing CO2, (B) the constriction of the Indonesian Passages and (C) the closure of the Panama Seaway. Contours depict the JJA mean precipitation for Plio. Green box indicates the range of EASM (20°N–40°N, 100°E–140°E). Stippling indicates the differences for precipitation are significant at the 95% confidence level using Student’s t-test.
In order to account for the precipitation response to CO2 and seaway changes, water vapor budgets are analyzed with the following decomposition by Huang (2015). The precipitation is decomposed into
where P, ω and q are the precipitation, atmospheric vertical velocity (measured as the Lagrangian pressure tendency) and surface specific humidity, respectively. The overbar and ∆ represent the Plio JJA climatology and responses to CO2 and seaway changes. The two terms on the right hand side represent the thermodynamic and dynamic component, respectively. The positive vertical velocity represents ascending motion and vice versa. The underlying assumption for Eq. 1 is that the precipitation is produced by air that is transported from the boundary layer up to the mid-troposphere, where the water vapor condenses to become precipitation. This decomposition enables to separate the relative importance of the thermodynamic and dynamic contribution to precipitation response. The decomposition results are shown in Figure 8. The water vapor budget (Figures 8G–I) generally reproduces the responses of precipitation to CO2 and seaway changes, in comparison to Figure 7. The local contribution of thermodynamic component (Figures 8A–C) is weaker compared to that of the dynamic component (Figures 8D–F). Lower CO2 in Pre-industrial largely reduces the thermodynamic contributions by 5.62 Pa/day to precipitation averaged over monsoon region (black box in Figure 8A). Vertical profile of the corresponding specific humidity suggests that the response is robust and consistent throughout the troposphere to 300 hPa (Figures 9A,C). The restriction of the Indonesian Passages and Panama Seaway slightly increases the water vapor content, and thermodynamic contribution by 0.45 Pa/day (Figure 8B) and 1.20 Pa/day (Figure 8C), respectively. Student’s t-test shows that the response is statistically significant over most of the monsoon region (stippling in Figures 8B,C), albeit much weaker change compared to that of lower CO2. The dynamic component illustrates stronger local contribution to precipitation (Figures 8D–F). Lower CO2 generally enhances the precipitation associated with the vertical pressure velocity over East China, while weakens the dynamic contribution in the west Pacific. However, the averaged contribution over the monsoon region amounts to ∼0.38 Pa/day. It is much weaker than the thermodynamic component, which is mainly due to the compensation within the monsoon region. The vertical profile of the vertical velocity suggests that the lower troposphere is more sensitive to decreased CO2 in Pre-industrial (Figures 9B,D). The con-striction of both seaways weakens the ascending motion over East China and strengthens over west Pacific. The averaged contributions of dynamic component over monsoon region amount to −2.08 Pa/day and −0.51 Pa/day, respectively. Using Student’s t-test, we find that the significance is not as widely distributed as that of specific humidity, albeit the much stronger contribution of the dynamic component.
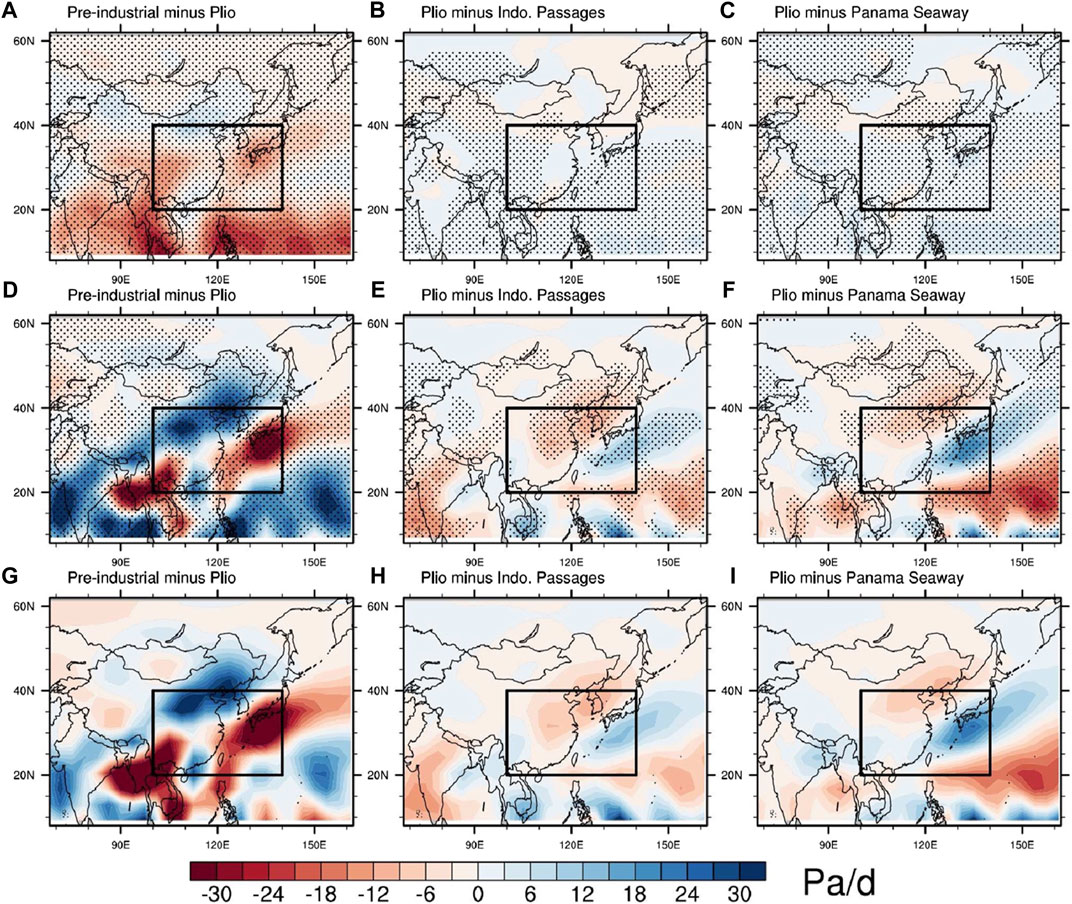
FIGURE 8. Decomposition of precipitation change as determined from the water vapor budget. Refer to the text for more details. (A) thermodynamic component in response to lower CO2, (B) the constriction of the Indonesian Passages and (C) the closure of the Panama Seaway. Stippling indicates the differences for surface specific humidity are significant at the 95% confidence level using Student’s t-test. (D–F) same as in (A–C) but for dynamic component. Stippling indicates the differences for vertical velocity are significant at the 95% confidence level using Student’s t-test. (G–I) summation of thermodynamic and dynamic component. The unit is Pa/day.
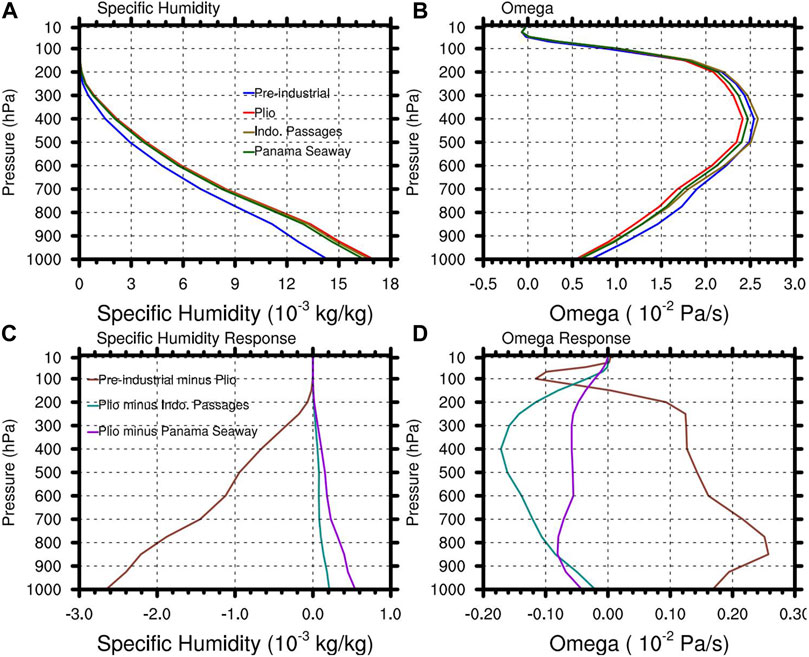
FIGURE 9. Vertical profile of JJA mean (A) specific humidity and (B) vertical pressure velocity averaged over the monsoon region (20°N–40°N, 100°E–140°E). Vertical profile of response of JJA mean (C) specific humidity and (D) vertical pressure velocity over the monsoon region to CO2 and seaway changes.
This study investigates the KCM sensitivity to changes in the atmospheric CO2 concentration, the Indonesian Passages and the Panama Seaway on the large-scale features of the Pliocene climate. In particular, we have compared the model sensitivity with the Pliocene SST reconstructions and EASM in a set of four sensitivity simulations with the KCM, which differ in the geometry of atmospheric CO2 concentration and the aforementioned passages. We studied the effect of decreasing CO2-concentration, the restriction of the Indonesian Passages and the closure of the Panama Seaway individually.
Model results show that global mean surface temperature anomalies are dominated by the atmospheric CO2 concentration. Decreasing CO2 cools global mean SST and 2 m-air-temperature by 2.33 K and 3.12 K, respectively (Table 2), which is consistent with surface temperature change (∼2–3 K), estimated from the proxies during the Pliocene. In comparison to the results from Pliocene Model Intercomparison Project (PlioMIP), the simulated 2 m-air-temperautre difference between Preindustrial and Plio is within the range (∼1.86–3.60 K) of coupled climate model ensembles (Haywood et al., 2013). The constriction of Indonesian Passages and the Panama Seaway warms the global mean 2 m-air-temperature barely, which amounts to ∼0.16 K and ∼0.32 K, respectively. Additionally, we observe a significantly increased ice sheet accumulation rate by ∼44% at low CO2 in Preindustrial compared to Plio. In contrast, the constriction of seaway changes slightly slows down the ice sheet accumulation by ∼7.2% and ∼9.1%. It is the melting of ice sheet associated with surface temperature that dominates the glaciation over Greenland in the KCM. Our results support the notion by Lunt et al. (2008) that the Northern Hemisphere Glaciation during the late Pliocene is con-trolled by the decline of atmospheric CO2. The influences of seaway changes, however, are of minor importance.
Although the simulated the global mean surface temperature change between Plio and Pre-industrial agrees reasonably well with the proxies, large model-data discrepancies exist in multiple regions. A comparison with proxy data shows that the model sensitivity agrees well with the SST changes in the southern oceans (Figure 4); however, it substantially underestimate the polar amplification by up to 9°C in the Northern Hemisphere, especially over the North Atlantic and Arctic region (Figure 4). Additionally, the simulated low-latitude temperature responses to CO2 are uniform in signs, in contrast to diverse responses estimated from proxies over the Caribbean Sea, Arabian Sea and the South China Sea (Figure 4). So far, no climate models could capture the strong polar amplification, or the diverse SST response in the tropics suggested by the proxies during the Pliocene (Dowsett et al., 2016). The reasons may be twofold. First, this suggests the necessity for improved boundary conditions and better representation of climate feedbacks for the Pliocene. Several possible tectonic changes, such as retreated Antarctic ice sheet, a closed Bering Strait and/or a deeper Greenland-Scotland- Ridge are not included in our study (Hill, 2015; Hill et al., 2017; Otto-Bliesner et al., 2017; Song et al., 2018). Burls and Fedorov (2014) further highlight the importance of an reduced meridional gradient of the cloud albedo in maintaining weak the zonal and meridional temperature gradient. Additionally, better representation of climate feedbacks over high latitudes, such as the water vapor and sea ice feedback, in the coupled models may be underestimated. Second, this discrepancy also highlights the need for improved proxy interpretation (Schneider et al., 2010) and reduced uncertainties in temperature estimates from geological proxies (Haywood et al., 2013). For instance, Stewart et al. (2004) shows that well-preserved foraminifera reveal lower tropical SSTs than previously stated. A proxy-proxy comparison over the Benguela upwelling region suggests that the Mg/Ca and alkenone SST proxies are strongly skewed toward cold and warm seasons, respectively (Leduc et al., 2014).
The EASM response to CO2 and seaway changes is investigated. Lower CO2 in Pre-industrial strengthens the EASM by 0.56 m/s, in relative to Plio. This is in contrast to the results of PlioMIP (Table 3). Seven out of eight PlioMIP members simulate weaker EASM in pre-industrial experiment by a range from 0.12 m/s to 1.2 m/s, and only one stronger EASM in pre-industrial experiment by 0.30 m/s, in composition to mid-Pliocene simulation (Zhang R. et al., 2013). JJA mean precipitation over the monsoon region decreases from 6.20 mm/day in Plio to 5.78 mm/day in Pre-industrial, albeit stronger EASM in Pre-industrial. The simulated precipitation response is larger than ensemble mean of PlioMIP amounting to 0.25 mm/day, but within the range from −0.51 mm/day to 0.75 mm/day among individual models. The simulated response to lower CO2 is consistent with the proxies (Ding et al., 2001; Wan et al., 2007), which suggests a wetter and warmer monsoon region during the Pliocene. The constraint of two tropical seaways both weakens the EASM (Figure 6). The restriction of Indonesian Passages and the Panama Seaway weakens the EASM by 0.28 m/s and 0.20 m/s, respectively. Accordingly, JJA mean precipitation over the monsoon region in response to both seaway changes decreases by 0.11 mm/day and 0.01 mm/day, respectively.
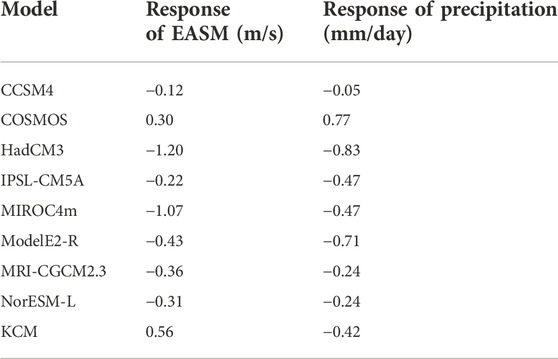
TABLE 3. The response (defined as the difference between Pre-indurial and Plio) of the intensity of East Asian summer monsoon (EASM) and JJA mean precipitation over the monsoon region (20°N-40°N, 100°E-140°E) in the KCM and the PlioMIP experiments (Zhang R. et al., 2013).
In order to account for the precipitation responses, a water vapor budget analysis is con-ducted by decomposing the precipitation into thermodynamic and dynamic component. In general, the local contribution of dynamic component to precipitation is stronger than the thermodynamic component. The water vapor budget generally agrees well with the precipitation response. Reduced precipitation over monsoon region in Preindustrial is mainly attributed to thermodynamic component (−5.62 Pa/day). The dynamic component amounting to ∼0.38 Pa/day compensates the reduced precipitation slightly. The precipitation response to the restricted Indonesian Passages is owing to the compensation of the thermodynamic (0.45 Pa/day) and dynamic component (−2.08 Pa/day). The impact of closed Panama Seaway is rather weak over the monsoon region, which is consistent with ∼0.01 mm/day precipitation change.
Multiple geological evidences for temperature and humidity ranging from ∼3.3 to 3.0 Ma suggest cooling and drying monsoon region since the mid-Pliocene (Ma et al., 2005; Wu et al., 2007; Jiang and Ding, 2008; Wu et al., 2011; Cai et al., 2012). Our result indicates that the EASM response is largely attributed to the declining CO2. The impact of seaway changes is much weaker, in comparison to low CO2. On the other hand, model results do not support the hypothesis by Nie et al. (2014), in which they proposed that the final closure of the Panama Seaway may have intensified the EASM from 4.8 to 2.7 Ma. We find that the closed Panama Seaway barely weakens the EASM. Instead, declining CO2 could explain the cooling and wetting trend over the proxy site. Additionally, the impacts of orography changes over the Himalayan Mountains and the Tibetan Plateau may be of greater importance (An et al., 2001; Zhang R. et al., 2012).
Data are available from the corresponding author upon request.
ZS performed the numerical experiment and the analysis. ZS wrote the manuscript with input from YZ. YZ is responsile for the funding acquisition.
The integration with the Kiel Climate Model (KCM) was conducted at the Computing Center of Kiel University (CAU). YZ is supported by the Fundamental Research Funds for the Central Public Welfare Scientific Institutes (Grant No. PM-zx703-202104-091).
The authors declare that the research was conducted in the absence of any commercial or financial relationships that could be construed as a potential conflict of interest.
All claims expressed in this article are solely those of the authors and do not necessarily represent those of their affiliated organizations, or those of the publisher, the editors and the reviewers. Any product that may be evaluated in this article, or claim that may be made by its manufacturer, is not guaranteed or endorsed by the publisher.
An, Z., Kutzbach, J. E., Prell, W. L., and Porter, S. C. (2001). Evolution of Asian monsoons and phased uplift of the Himalaya-Tibetan plateau since Late Miocene times. Nature 411 (6833), 62–66. doi:10.1038/35075035
Burls, N. J., and Fedorov, A. V. (2014). Simulating Pliocene warmth and a permanent El Niño-like state: The role of cloud albedo. Paleoceanography 29 (10), 893–910. doi:10.1002/2014PA002644
Cai, M., Fang, X., Wu, F., Miao, Y., and Appel, E. (2012). Pliocene–pleistocene stepwise drying of central Asia: Evidence from paleomagnetism and sporopollen record of the deep borehole sg-3 in the Western qaidam basin, ne Tibetan plateau. Glob. Planet. Change 94, 72–81. doi:10.1016/j.gloplacha.2012.07.002
Cane, M. A., and Molnar, P. (2001). Closing of the Indonesian seaway as a precursor to east African aridification around 3–4 million years ago. Nature 411 (6834), 157–162. doi:10.1038/35075500
Ding, Z., Yang, S., Sun, J., and Liu, T. (2001). Iron geochemistry of loess and red clay deposits in the Chinese loess plateau and implications for long-term Asian monsoon evolution in the last 7.0 ma. Earth Planet. Sci. Lett. 185 (1), 99–109. doi:10.1016/s0012-821x(00)00366-6
Dowsett, H., Dolan, A., Rowley, D., Moucha, R., Forte, A. M., Mitrovica, J. X., et al. (2016). The PRISM4 (mid-Piacenzian) paleoenvironmental reconstruction. Clim. Past. 12 (7), 1519–1538. doi:10.5194/cp-12-1519-2016
Duan, J., Chen, Z., Wu, L., et al. (2017). Projected changes of the low-latitude north-western pacific wind-driven circulation under global warming. Geophysical Research Letters 44 (10), 4976–4984. doi:10.1002/2017GL073355
Farris, D. W., Jaramillo, C., Bayona, G., Restrepo-Moreno, S. A., Montes, C., Cardona, A., et al. (2011). Fracturing of the Panamanian isthmus during initial collision with south America. Geology 39 (11), 1007–1010. doi:10.1130/G32237.1
Ge, J., Dai, Y., Zhang, Z., Zhao, D., Li, Q., Zhang, Y., et al. (2013). Major changes in East Asian climate in the mid-Pliocene: Triggered by the uplift of the Tibetan Plateau or global cooling? J. Asian Earth Sci. 69, 48–59. doi:10.1016/j.jseaes.2012.10.009
Haug, G. H., and Tiedemann, R. (1998). Effect of the formation of the isthmus of Panama on Atlantic Ocean thermohaline circulation. Nature 393 (6686), 673–676. doi:10.1038/31447
Haug, G. H., Tiedemann, R., Zahn, R., and Ravelo, A. C. (2001). Role of Panama uplift on oceanic freshwater balance. Geology 29 (3), 207. doi:10.1130/0091-7613(2001)029<0207:ROPUOO>2.0.CO;2
Haywood, A. M., Dolan, A. M., Pickering, S. J., Dowsett, H. J., McClymont, E. L., Prescott, C. L., et al. (2013). On the identification of a Pliocene time slice for data-model comparison. Phil. Trans. R. Soc. A 371, 20120515. doi:10.1098/rsta.2012.0515
Haywood, A. M., Dowsett, H. J., Robinson, M. M., Stoll, D. K., Dolan, A. M., Lunt, D. J., et al. (2011). Pliocene model Intercomparison project (PlioMIP):experimental design and boundary conditions (experiment 2). Geosci. Model Dev. 4 (3), 571–577. doi:10.5194/gmd-4-571-2011
Hill, D. J., Bolton, K. P., and Haywood, A. M. (2017). Modelled ocean changes at the pliopleistocene transition driven by Antarctic ice advance. Nat. Commun. 8 (14), 14376. doi:10.1038/ncomms14376
Hill, D. J. (2015). The non-analogue nature of Pliocene temperature gradients. Earth Planet. Sci. Lett. 425, 232–241. doi:10.1016/j.epsl.2015.05.044
Huang, P. (2015). Seasonal changes in tropical SST and the surface energy budget under global warming projected by CMIP5 models. J. Clim. 28 (16), 6503–6515. doi:10.1175/JCLI-D-15-0055.1
Jiang, H., and Ding, Z. (2008). A 20 ma pollen record of east-Asian summer monsoon evolution from guyuan, ningxia, China. Palaeogeogr. Palaeoclimatol. Palaeoecol. 265 (1), 30–38. doi:10.1016/j.palaeo.2008.04.016
Jochum, M., Fox-Kemper, B., Molnar, P. H., and Shields, C. (2009). Differences in the Indonesian seaway in a coupled climate model and their relevance to Pliocene climate and El Niño. Paleoceanography 24 (1). doi:10.1029/2008PA001678
Karas, C., Nürnberg, D., Bahr, A., Groeneveld, J., Herrle, J. O., Tiedemann, R., et al. (2017). Pliocene oceanic seaways and global climate. Sci. Rep. 739, 39842. doi:10.1038/srep39842
Karas, C., Nürnberg, D., Gupta, A. K., Tiedemann, R., Mohan, K., and Bickert, T. (2009). MidPliocene climate change amplified by a switch in Indonesian subsurface throughflow. Nat. Geosci. 2 (6), 434–438. doi:10.1038/ngeo520
Krebs, U., Park, W., and Schneider, B. (2011). Pliocene aridification of Australia caused by tectonically induced weakening of the Indonesian throughflow. Palaeogeogr. Palaeoclimatol. Palaeoecol. 309 (1-2), 111–117. doi:10.1016/j.palaeo.2011.06.002
Lawrence, K., Sosdian, S., White, H., and Rosenthal, Y. (2010). North Atlantic climate evolution through the Plio-Pleistocene climate transitions. Earth Planet. Sci. Lett. 300 (3-4), 329–342. doi:10.1016/j.epsl.2010.10.013
Leduc, G., Garbe-Schönberg, D., Regenberg, M., Contoux, C., Etourneau, J., and Schneider, R. (2014). The late Pliocene Benguela upwelling status revisited by means of multiple temperature proxies. Geochem. Geophys. Geosyst. 15 (2), 475–491. doi:10.1002/2013GC004940
Li, J., Wu, Z., Jiang, Z., and He, J. (2010). Can global warming strengthen the East Asian summer monsoon? J. Clim. 23 (24), 6696–6705. doi:10.1175/2010JCLI3434.1
Lisiecki, L. E., and Raymo, M. E. (2005). A Pliocene-Pleistocene stack of 57 globally distributed benthic δ18 O records. Paleoceanography 20 (1). doi:10.1029/2004PA001071
Lunt, D. J., Foster, G. L., Haywood, A. M., and Stone, E. J. (2008). Late Pliocene Greenland glaciation controlled by a decline in atmospheric CO2 levels. Nature 454 (7208), 1102–1105. doi:10.1038/nature07223
Ma, Y., Wu, F., Fang, X., Li, J., An, Z., and Wang, W. (2005). Pollen record from red clay sequence in the central loess plateau between 8.10 and 2.60 ma. Chin. Sci. Bull. 50 (19), 2234–2243. doi:10.1360/03wd0235
Madec, G. (2008). NEMO ocean engine: Notes du Pole de Mod{é}lisation 27. France: Institut PierreSimon Laplace.
Montes, C., Cardona, A., Jaramillo, C., Pardo, A., Silva, J. C., Valencia, V., et al. (2015). Middle Miocene closure of the central American seaway. Science 348 (6231), 226–229. doi:10.1126/science.aaa2815
Nie, J., Stevens, T., Song, Y., King, J. W., Zhang, R., Ji, S., et al. (2014). Pacific freshening drives Pliocene cooling and Asian monsoon intensification. Sci. Rep. 4, 5474. doi:10.1038/srep05474
Otto-Bliesner, B. L., Jahn, A., Feng, R., Brady, E. C., Hu, A., and Lofverstrom, M. (2017). Amplified North atlantic warming in the late pliocene by changes in arctic gateways. Geophys. Res. Lett. 44 (2), 957–964. doi:10.1002/2016GL071805
Park, W., Keenlyside, N., Latif, M., Stroh, A., Redler, R., Roeckner, E., et al. (2009). Tropical pacific climate and its response to global warming in the Kiel climate model. J. Clim. 22 (1), 71–92. doi:10.1175/2008JCLI2261.1
Roeckner, E., Bäuml, G., and Bonaventura, L. (2003). The atmospheric general circulation model ECHAM5. PART I: model description, Report 349. Hamburg: Max Planck Institute for Meteorology, 140.
Rohling, E. J., Foster, G. L., Grant, K. M., Marino, G., Roberts, A. P., Tamisiea, M. E., et al. (2014). Sea-level and deep-sea-temperature variability over the past 5.3 million years. Nature 508 (7497), 477–482. doi:10.1038/nature13230
Schneider, B., Leduc, G., and Park, W. (2010). Disentangling seasonal signals in holocene climate trends by satellite-model-proxy integration. Paleoceanography 25 (4). doi:10.1029/2009pa001893
Song, Z., Latif, M., Park, W., Krebs-Kanzow, U., and Schneider, B. (2017). Influence of seaway changes during the pliocene on tropical pacific climate in the Kiel climate model: Mean state, annual cycle, ENSO, and their interactions. Clim. Dyn. 48, 3725–3740. doi:10.1007/s00382-016-3298-x
Song, Z., Latif, M., Park, W., and Zhang, Y. (2018). Influence of model bias on simulating North Atlantic Sea Surface temperature during the mid-pliocene. Paleoceanogr. Paleoclimatology 33, 884–893. doi:10.1029/2018PA003397
Steph, S., Tiedemann, R., Prange, M., Groeneveld, J., Schulz, M., Timmermann, A., et al. (2010). Early pliocene increase in thermohaline overturning: A precondition for the development of the modern equatorial pacific cold tongue. Paleoceanography 25 (2), 1–17. doi:10.1029/2008PA001645
Stewart, D. R., Pearson, P. N., Ditchfield, P. W., and Singano, J. M. (2004). Miocene tropical indian ocean temperatures: Evidence from three exceptionally preserved foraminiferal assemblages from Tanzania. J. Afr. Earth Sci. 40 (3), 173–189. doi:10.1016/j.jafrearsci.2004.09.001
S., Valcke (Editors) (2006). OASIS3 user guide (PRISM_2–5). CERFACS technical report TR/CMGC/06/73, PRISM Report No 3 (p. 60). Available at: http://www.prism.enes.org/Publications/Reports/oasis3_UserGuide_T3.pdf, 60.
Wan, S., Li, A., Clift, P. D., and Stuut, J.-B. W. (2007). Development of the east Asian monsoon: Mineralogical and sedimentologic records in the northern south China sea since 20 ma. Palaeogeogr. Palaeoclimatol. Palaeoecol. 254 (3), 561–582. doi:10.1016/j.palaeo.2007.07.009
Wang, L., Lü, H. Y., Wu, N. Q., Li, J., Pei, Y. P., Tong, G. B., et al. (2006). Palynological evidence for Late Miocene-Pliocene vegetation evolution recorded in the red clay sequence of the central Chinese Loess Plateau and implication for palaeoenvironmental change. Palaeogeogr. Palaeoclimatol. Palaeoecol. 241 (1), 118–128. doi:10.1016/j.palaeo.2006.06.012
Wu, F., Fang, X., Herrmann, M., Mosbrugger, V., and Miao, Y. (2011). Extended drought in the interior of central Asia since the Pliocene reconstructed from sporopollen records. Glob. Planet. Change 76 (1), 16–21. doi:10.1016/j.gloplacha.2010.11.007
Wu, F., Fang, X., Ma, Y., Herrmann, M., Mosbrugger, V., An, Z., et al. (2007). Plio– quaternary stepwise drying of Asia: Evidence from a 3-ma pollen record from the Chinese loess plateau. Earth Planet. Sci. Lett. 257 (1), 160–169. doi:10.1016/j.epsl.2007.02.029
Yang, S., Lau, K. M., and Kim, K. M. (2002). Variations of the East Asian jet stream and Asian-Pacific-American winter climate anomalies. J. Clim. 15 (1), 306–325. doi:10.1175/1520-0442(2002)015<0306:VOTEAJ>2.0.CO;2
Zhang, R., Jiang, D. B., Liu, X. D., and Tian, Z. P. (2012). Modeling the climate effects of different subregional uplifts within the Himalaya-Tibetan Plateau on Asian summer monsoon evolution. Chin. Sci. Bull. 57 (35), 4617–4626. doi:10.1007/s11434-012-5284y
Zhang, X., Prange, M., Steph, S., Butzin, M., Krebs, U., Lunt, D. J., et al. (2012). Changes in equatorial Pacific thermocline depth in response to Panamanian seaway closure: Insights from a multi-model study. Earth Planet. Sci. Lett. 317, 76–84. doi:10.1016/j.epsl.2011.11.028
Keywords: Panama seaway, Indonesian Passages, mid-Pliocene, East Asian summer monsoon, atmospheric CO2
Citation: Song Z and Zhang Y (2022) Impact of oceanic gateway and CO2 changes on the East Asian summer monsoon during the mid-pliocene in a coupled general circulation model. Front. Environ. Sci. 10:1086492. doi: 10.3389/fenvs.2022.1086492
Received: 01 November 2022; Accepted: 21 November 2022;
Published: 01 December 2022.
Edited by:
Hainan Gong, Institute of Atmospheric Physics (CAS), ChinaReviewed by:
Weizeng Shao, Shanghai Ocean University, ChinaCopyright © 2022 Song and Zhang. This is an open-access article distributed under the terms of the Creative Commons Attribution License (CC BY). The use, distribution or reproduction in other forums is permitted, provided the original author(s) and the copyright owner(s) are credited and that the original publication in this journal is cited, in accordance with accepted academic practice. No use, distribution or reproduction is permitted which does not comply with these terms.
*Correspondence: Yuming Zhang, eW16aGFuZzg1QDEyNi5jb20=
Disclaimer: All claims expressed in this article are solely those of the authors and do not necessarily represent those of their affiliated organizations, or those of the publisher, the editors and the reviewers. Any product that may be evaluated in this article or claim that may be made by its manufacturer is not guaranteed or endorsed by the publisher.
Research integrity at Frontiers
Learn more about the work of our research integrity team to safeguard the quality of each article we publish.