- 1Hebei Cangzhou Groundwater and Land subsidence National Observation and Research Station, Cangzhou, China
- 2Laboratory of Water Resources Sustained Utilization and Development in Hebei Province, Shijiazhuang, China
- 3Key Laboratory of Intelligent Detection and Equipment for Underground Space of Beijing-Tianjin-Hebei Urban Agglomeration, Ministry of Natural Resources, Shijiazhuang, China
- 4China Institute of Geo-Environment Monitoring, Beijing, China
Land subsidence is an important environmental problem in the North China Plain (NCP). A typical subsidence area mainly located on adjoining areas of Beijing and Hebei provinces was selected to study the consolidation characteristics of deep clayey soil. Clay samples were collected from 14 boreholes at different depths, and the compression and consolidation behavior of the soil was analyzed by high-pressure oedometer tests. Results show that the deformation amount and deformation stabilization time in the primary consolidation stage increase with the load but decrease with the sampling depth. The nonlinear compression model of e-log(p) does not fit well for deep normally-consolidated clayey soil, the log(e+ec)–logp model fit the shallow clayey soil better than the deep clayey soil, and the hyperbolic model fits almost all soil samples well. Based on statistical theory, the soil consolidation equation CE_NCP was established for calculating the relationship between the degree of consolidation and the time factor in subsidence areas. The equations were fitted with the data obtained from high-pressure consolidation tests to obtain three parameters a, b and c, which are applied to the consolidation calculations for soil samples at depths of 0–100 m, 100–200 m, 200–300 m and 300–400 m, respectively. The applicability of CE_NCP equation was evaluated by comparing it to the analytical solution of Terzaghi’s consolidation equation, results showing that CE_NCP equation is more suitable for the calculation of the consolidation in the study area than the Terzaghi’s analytical solution. Eventually, the CE_NCP equation was successfully used to estimate the degree of consolidation in a subsidence area of Lang Fang City in the NCP.
1 Introduction
Land subsidence is a potentially destructive hazard caused by various natural or man-made factors. Natural factors include, for example, tectonic motion, consolidation of soft soil and seismic activity. Man-made factors include withdrawal of groundwater, oil, and gas, engineering construction and so on. Studies have shown that excessive exploitation of groundwater is the main cause of land subsidence. The process of land subsidence is also the process of rock and soil compression and consolidation caused by pumping. The settlement mainly comes from the compression deformation of aquitards (clayey soil layers) and water-bearing sand layers. When the pore water pressure is restored, the compaction of sand layers can basically return to the original state. The compression of clay is permanent, which determines the irreversibility of land subsidence. With the continuous advancement of urbanization, the land subsidence caused by underground space development, foundation pit drainage, and large-scale landfilling has become increasingly prominent. The trend of high-rise and densification of urban buildings is obvious, which gradually become a new important impacting factor of urban land subsidence.
Land subsidence is now a major environmental problem hindering regional sustainable development, occurring at more than 50 countries around the world, including United States, Japan, Mexico, Italy, Indonesia, India, Iran and China (Xiong et al., 2017; Figueroa-Mirandaet et al., 2018; Corbau et al., 2019; Bagheri et al., 2021; Gerardo et al., 2021; Guo et al., 2021; Kadiyan et al., 2021; Rafiee et al., 2022). The impact of land subsidence is expanding, and it is expected that by 2040, the global threat of land subsidence will involve nearly 20% of the population (Gerardo et al., 2021). In China, widespread subsidence is affecting rapidly developing cities, which are located in the major sedimentary basins such as the North China Plain (NCP). The NCP has the most serious and fastest developing land subsidence in China, with severe subsidence accounting for more than 80% of the country. More than 10 major cities, including Beijing, Tianjin, Cangzhou, Langfang, Hengshui and Dezhou, have experienced land subsidence (Figure 1). The development of land subsidence has caused severe condition in the NCP, with the maximum cumulative subsidence in Beijing, Tianjin and Hebei exceeding 1.7 m, 3.4 m and 2.6 m respectively (Cui and Lei, 2018). To promote the development of society and economy, regional aquifers of NCP have been over-exploited, resulting in the extrusion of clay layers, which is a major factor leading to land subsidence in this region. The deep groundwater depression cones are mainly distributed in the central and eastern plains of the NCP, consisting with the location of severe land subsidence areas. Land subsidence mainly occurred in the Quaternary loose sediments. Due to the low degree of soil consolidation, under the exploitation of underground fluids such as groundwater, geothermal fluid, oil and gas, the original pressure balance in the formation was broken, resulting in soil compression and land subsidence. In addition, the strata composed of a large amount of clayey soil with high plasticity (Figure 1), have possibility to form permanent settlement (Guo et al., 2017). Zhang et al. (2014) analyzed the deformation characteristics of soils in subsidence areas of the Beijing Plain using soil deformation and groundwater level data obtained by borehole extensometers, revealing the creep behavior and the elastic-plastic and viscoelastic-plastic mechanical behavior of the aquitards at different depths. They also concluded that the compressibility of the aquitards in the inelastic range is about one order of magnitude greater than in the elastic range.
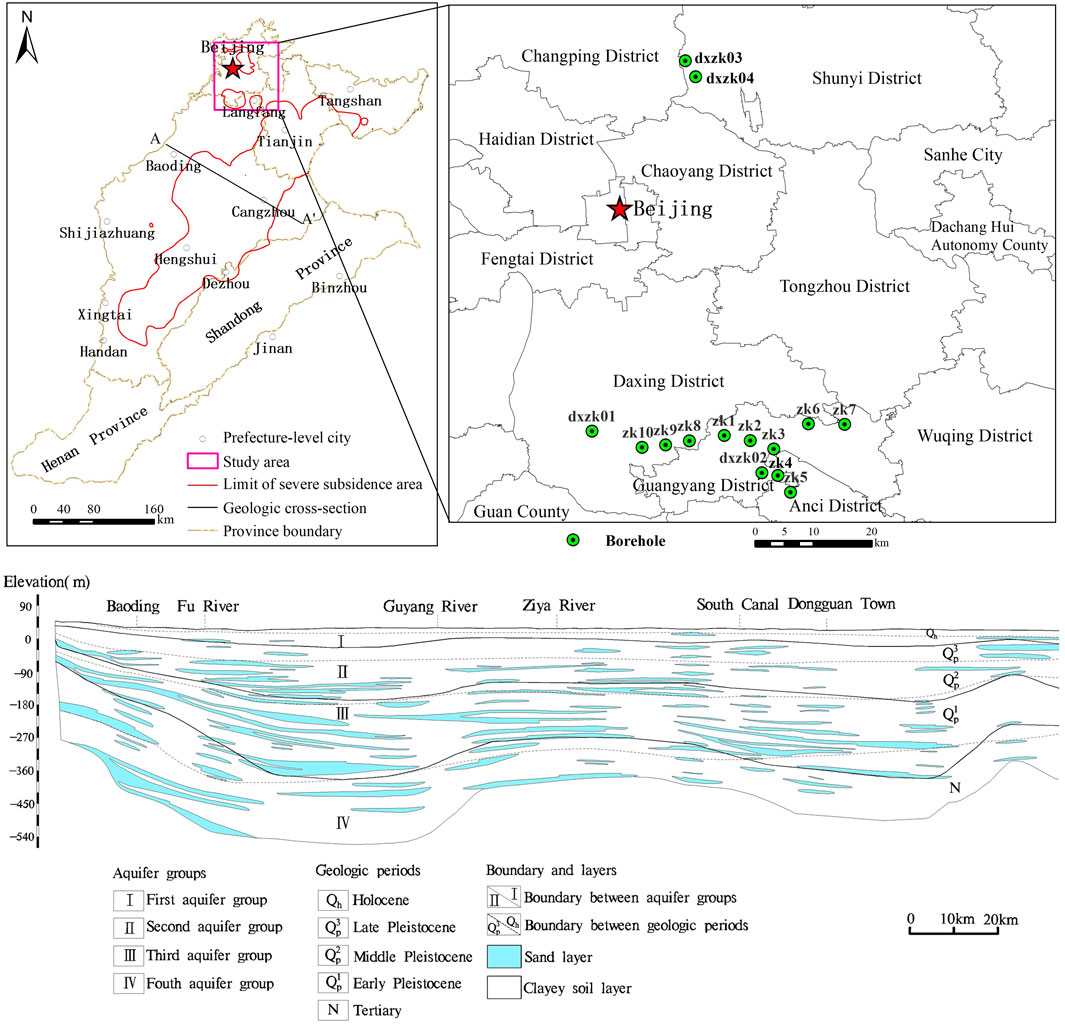
FIGURE 1. The study area and the distribution of sampling boreholes in a typical subsidence area of the NCP, and a typical hydrogeological cross section A-A’.
In general, it is easier to estimate the total settlement of a soil than to estimate the time-dependent behavior of consolidation settlement. Terzaghi developed the theory of one-dimensional consolidation of saturated clays that has served as the basis for solving most practical soil mechanics and settlement problems. The aquitards (fine-grained interbeds) and confining beds mainly composed of clayey soil, have low permeability and high specific storage under virgin stressing. Thus, the escape of water and the adjustment of pore pressures is slow and time-dependent, and the stress increase by the hydraulic head decline in adjacent aquifers can induce nonlinear soil compaction in these fine-grained soil layers. Duncan. (1993) analyzed the limitations of conventional theory of clay consolidation settlement, concluding that factors such as the variation of the coefficient of consolidation (Cv) and nonlinear stress-strain relation can improve the accuracy of settlement estimation. For most clays, strains increase in proportion (or approximately in proportion) to the log of effective stress with a flat slope when the effective stress is low, and then increase rapidly as effective stresses exceed the preconsolidation pressure (Das and Sobhan, 2016). Laboratory tests and field observations have shown that the Cv value depends on the permeability and compressibility of the soil and varies with the consolidation process. Mesri et al. (1999) developed an inflection point method that is simpler than the most widely used graphical methods of Casagrande and Taylor for calculating Cv. Chan (2003) used the least square method to determine the Cv value, and calculated results were more accurate than traditional methods because the entire range of primary consolidation data was used. The finite difference and circular arc endpoint methods were used to determine Cv, taking into account changes in permeability and compressibility during the consolidation to reduce the error of graphical method (Abbaspout et al., 2015). Akbarimehr et al. (2020) found that the soil compression index has good correlations with the physical properties of undisturbed and remolded Tehran clay by performing 125 consolidation tests and through determining the physical properties. Freire et al. (2022) studied vertical (Cv) and horizontal (Ch) consolidation coefficients of Guaratiba’s soft soil by comparing CPTu and laboratory test data. They concluded that high values of the variability of Cv and Ch were probably due to the wide range of organic matter, sand lenses and the sand content. Zabłocka et al. (2020) found that the main factors affecting correlation between Cv and consolidation pressure trends were mechanisms controlling changes in soil volume (mechanical or physicochemical), which is different for expansive and non-expansive soils. An efficient methodology was proposed to predict Cv using machine learning models such as Multiple Linear Regression (MLR), Artificial Neural Network (ANN), Support Vector Regression (SVR), and Adaptive Network based Fuzzy Inference System (ANFIS) (Mittal et al., 2021). To better characterize the compressive behavior of soils, several non-linear compression models have been developed, such as the e-log(p) model (Davis and Raymond, 1965; Li et al., 2013), the log(e+ec)-log(p) model (Chai et al., 2004), and the hyperbolic model (Wei, 1993).
Given the limitations of Terzaghi’s theory, various attempts have been made to improve the accuracy of consolidation calculation, generating abundant achievements on one-dimensional consolidation theory and consolidation process of soft clay. Analytical solutions for one-dimensional nonlinear consolidation of single-layer and double-layered soft soil under constant loading were derived by introducing an improved continuous drainage boundary condition (Zong and Wu, 2020; Zong, 2021), and the effects of different interface parameters and nonlinear parameters on soil consolidation characteristics were analyzed. The consolidation process of high organic peat soil was studied with one-dimensional consolidation tests in Dali, China, and the results showed that the consolidation process of the peat soil was divided into three stages (Feng et al., 2021). To improve the applicability of the consolidation theory in the actual soil consolidation calculation, the theory and methods for the settlement calculation of double-layer and multi-layer soils considering creep and rheological properties were developed (Chen et al., 2021; Cui et al., 2021). The microstructure evolution of soft soil during consolidation was explored through oedometer tests and field emission scanning electron microscopy tests, and the relationship between microstructure and macroscopic characteristics was analyzed (Zheng et al., 2021). The consolidation process and characteristics of saturated and unsaturated soils under different boundary and seepage conditions have also been widely studied. Governing equations for the one-dimensional large strain consolidation of a fully saturated clay layer were derived (Gibson et al., 1981; Xie and Leo, 2004), where the variation of soil compressibility and permeability during consolidation was taken into account. Compared with the small-strain theory, the large-strain theory predicts a smaller subsidence magnitude, while the subsidence develops and the excess pore water pressure dissipates faster (Xie and Leo, 2004). The discrepancy between large and small strain theories became smaller when the compressibility of soil was decreased and the magnitude of applied load was reduced. Hu et al. (2018) proposed a semi-analytical solution for the one-dimensional nonlinear consolidation problem of structured soil under single-stage loading. The one-dimensional consolidation problem of clay in land reclamation was obtained by considering the effects of self-weight and continuous drainage boundary conditions, and the calculation results were successfully applied to the settlement analysis of land reclamation (Feng et al., 2019). An approximate analytical solution for one-dimensional nonlinear consolidation of single-layer and multi-layer foundation under fixed load and cyclic load was derived by considering the change of compressibility and permeability of saturated soil layer (Kim et al., 2020a; 2020b). To reveal stress- and suction-dependency of primary and secondary consolidation responses of the soil, Rezania et al. (2020) carried out one-dimensional consolidation tests on natural and reconstituted London clay samples under saturated and unsaturated conditions by using a newly designed unsaturated soil consolidation instrument. Based on the piecewise linear consolidation model, Liu et al. (2021) proposed a consolidation model for cohesive soils considering drainage conditions and non-Darcy flow. The calculation results showed that both continuous drainage boundary and Hansbo’s flow could significantly slow down the consolidation process. Kim et al. (2021) studied the radial consolidation characteristics of unsaturated soil under cyclic loading based on the Fredlund and Hasan’s consolidation theory. The effects of different parameters on the radial consolidation of unsaturated soil subjected to various cyclic loadings were examined. Yin et al. (2022) proposed a simplified calculation method for consolidation settlement, which can be conveniently applied to the settlement calculation of layered cohesive soil foundation. According to Selvadurai (2021), the irreversibility of the skeletal deformations should be considered when quasistatic loading cycles are encountered.
The above studies mainly improve several defects in Terzaghi’s theory, such as nonlinearity of Cv, large deformation, finite deformation and rheological problems. Due to the complexity of clay, researchers do not have a unified understanding of the properties of soil, which will inevitably affect the accuracy of analytical solutions, making it difficult to apply these methods to engineering practice. Furthermore, the above experiments and theoretical analysis are mainly aimed at shallow clayey soil, while the deep clayey soil buried more than 50–100 m is rarely involved. The land subsidence of the NCP is serious due to human activities, especially the excessive exploitation of deep groundwater. Due to the limitation of the complex influencing factors and large variation in space of aquifer systems, the research on consolidation characteristics of deep clayey soils is weak so far, which restricts the scientific evaluation of the development trend for land subsidence and its forecast and early warning. In this paper, clayey samples at various depths were collected from 14 boreholes in a typical subsidence area located at the junction of Beijing and Hebei provinces. Then high-pressure oedometer tests were carried out to study the consolidation characteristics of clayey soil and to evaluate the applicability of the existing nonlinear compression deformation models. In addition, a model CE_NCP for calculating the consolidation degree of clayey soil was established to provide theoretical support for the study of land subsidence. The derived CE_NCP equation was used to investigate the degree of consolidation in a typical land subsidence area in Langfang, Hebei Province, China, where subsidence was mainly caused by deep groundwater abstraction.
2 Materials and methods
2.1 Soil used in the study
The study area is located in a typical subsidence area in the NCP, mainly in the north of Langfang City, Hebei Province, and the south of Daxing District and Shunyi District in Beijing (Figure 1). In order to meet the demand of water resources, the deep groundwater was developed on a large scale, which has induced the formation of groundwater depression cones and severe subsidence areas. The strata composed of multi-layer aquifer systems with deep confined aquifers and thick compressible clay layers, have geological and hydrogeological conditions favorable for the development of land subsidence. The mechanism of land subsidence in the study area is typical and representative in the NCP. Figure 1 also shows the distribution of sampling boreholes. There are eight drilling holes in Langfang City, of which the drilling depth of zk1-zk7 is 80m, and the drilling depth of dxzk02 is 402 m. There are four boreholes in Daxing District, of which zk8-zk10 boreholes have a depth of 80m, and dxzk01 borehole has a depth of 407 m. The other two boreholes marked with dxzk03 and dxzk04 are located in Shunyi District, having the drilling depth of 400 m and 300m, respectively. Basic physical parameter tests and high-pressure consolidation tests were carried out on 156 groups of clay samples at different depths, including 60 clay samples and 96 silty clay samples. The sampling intervals for each borehole was approximately 10 m. A total of 60 samples were collected from 0 to 50 m below the ground surface, and 96 samples were collected from 50 m or more below the surface.
2.2 Experimental set-up
Each clay sample was cut 30 cm from the borehole core, placed in a soil sample cylinder, sealed with wax and wrapped with tape, and sent to the laboratory. During preparation, the experimenters place the soil sample tube in the direction of natural deposition, remove the wax seal and tape, open the soil sample tube to take unearthed samples, and check whether the soil sample has been disturbed. A sample with the diameter of 61.8 mm and the height of 20 mm was prepared by a ring cutter for consolidation test, and the remaining soil was used for the determination of physical parameters. Consolidation tests were carried out with an electronic compression rheometer to investigate the time-dependent behavior of the clayey soil during one-dimensional consolidation. The test data were used to estimate the preconsolidation pressure, compression modulus and consolidation coefficient of test specimens at different depths. In the compression rheometer lateral movement of the soil was prevented by containing the soil in a stiff metal ring so that only vertical soil movements were possible. In practice the condition of zero lateral strain is satisfied approximately in the case where the area of the aquifer is much larger than the thickness. The stress measurement system is BK-2 precision sensor, and the maximum consolidation stress can reach 70 MPa. A series of pressures were applied to the specimen, ranging from 0.04 MPa to 40.96MPa, each being double the previous value. Each pressure was maintained for 24 h, during which compression readings were observed at appropriate intervals. During the test, the room was kept at a constant temperature and humidity.
2.3 Determination of soil parameters
The value of coefficient of consolidation (Cv) for a particular pressure increment in the test can be obtained by comparing the characteristics of the experimental and theoretical consolidation curves, which is referred as curve-fitting. Once the value of Cv has been determined, the permeability can be calculated. In this paper, the root time method (Craig, 2004) was used to determine the value of Cv, where Cv is given by
where
The degree of consolidation Ut of a soil is the ratio of the average dissipation value of the pore water pressure to the initial pore water pressure at a certain time during the consolidation process under a certain level of load, or the ratio of the compression amount at a certain time to the final compression amount. The value of
where Cv is the coefficient of consolidation (L2/T), t is the time of consolidation (T), and
3 Results
3.1 Time-dependent compression behavior of the clayey soils
The results of four specimens in borehole dxzk02 (Table 1), located in the subsidence area of Langfang, were selected to analyze the time-dependent consolidation characteristics. These specimens were all clayey soil and were taken from depths of 52.3 m, 145.5 m, 292.3 m and 395.1 m, respectively. The time-dependent compression process under various loads is shown by plotting deformation versus time (Figure 2). Time is plotted on a logarithmic scale.

FIGURE 2. Time-varying deformation curves of soil samples under different loads with sampling depths of 52.3 m (A), 145.5 m (B), 292.3 m (C) and 395.1 m (D), respectively.
It can be seen from Figure 2 that under different loads, the deformation of clayey soil increases with time, and the growth rate increases first and then decreases gradually. From the plot, we can observe three distinct stages, i.e., the initial compression, the primary consolidation and the secondary consolidation. Mainly due to the compression of a small amount of air in the soil, the initial compression occurs within 0–6 s, and in general, the deformation during this period increases with the increase of the load. For the undisturbed soil samples, due to the non-uniform compaction degree and composition of the soil, the phenomenon of large load leading to small deformation occurred in the experiment. Under the same load, the deformation of different depths within 0–6 s does not change significantly, and no obvious decreasing trend with the increase of depth occurs. The primary consolidation phase begins after the instantaneous deformation is completed. In this stage, the deformation amount increases rapidly, but the growth rate gradually decreases, and finally the deformation reaches a stable state.
Figure 2 also indicates that the deformation law of the primary consolidation stage has a certain relationship with the load and soil sampling depth. At the same sampling depth, the deformation of the primary consolidation stage, the proportion of deformation to total deformation and the consolidation stabilization time increase with the increase of the load. For soil samples with a depth of 292.3 m, the primary consolidation deformation at 1280kPa and 2560 kPa is 0.140 mm and 0.164 mm, respectively, the deformation ratio is 53.8% and 65.0%, and the consolidation stabilization time is 49 min and 200 min, respectively. Under the same load, the primary consolidation deformation and the stabilization time decrease with the increase of depth. The main reason for this phenomenon is that the sampling depth is positively correlated to the pressure of overlying soil, and also positively correlated to the pre-consolidation pressure after the soil sample was taken out. Due to different stress history, soil samples with greater depths have less deformation and less consolidation time when the same load is applied. For example, when the load is 2560kPa, the primary consolidation deformations of the four specimens at depth of 52.3 m, 145.5 m, 292.3 m and 395.1 m are 1.322 mm, 0.399 mm, 0.164 mm and 0.124 mm respectively. The corresponding deformation ratios are 87.3%, 65.4%, 65.0% and 53.2%, and the stabilization times are 784 min, 784 min, 200 min and 100 min respectively. The above indicators all decrease with the increase of depth. When the primary consolidation is completed, the deformation increases slowly over time. Eventually the compression of the soil continues at a slow rate for an indefinite period of time and is called secondary consolidation. The amount of secondary consolidation is minor within 24 h, accounting for about 0.4%–1.3% of the total deformation. The relevance of secondary consolidation with respect to time or duration of the applied load need be studied in the future.
3.2 Analysis of coefficient of consolidation
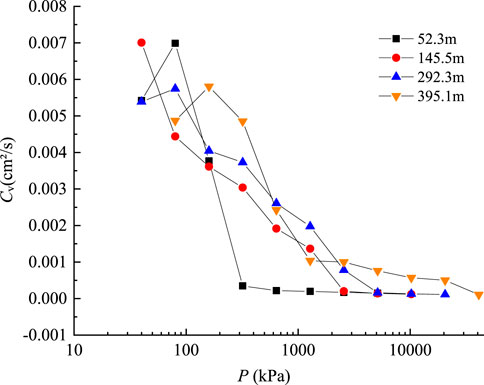
The coefficient of consolidation Cv reflects the speed of soil consolidation, which is proportional to the rate of the dissipation of pore water pressure. The larger the Cv is, the greater the dissipation rate of the pore water pressure. According to the root time method, the Cv value of each load was determined. Figure 3 exhibits the Cv values for four clayey soil samples at depths of 52.3 m, 145.5 m, 292.3 m and 395.1 m, taken from the borehole dxzk02 (Table1). The estimated results show that the value of Cv varies with the pressure and depth, and the estimated values are in the range of 1.0 × 10⁻⁴cm2/s—7.0 × 10–3 cm2/s, as shown in Figure 3. In general, at the same pressure, the Cv increases with the depth of soil sampling. For example, at a pressure of 2560kPa, the determined values of Cv are 1.69 × 10⁻⁴cm2/s, 2.02 × 10⁻⁴cm2/s, 7.82 × 10⁻⁴cm2/s and 9.99 × 10⁻⁴cm2/s, corresponding to the sampling depths of 52.3 m, 145.5 m, 292.3 m and 395.1 m. As the depth increases, the consolidation state gradually changes to overconsolidation, and the time t90 required to reach 90% consolidation degree is shorter, so the value of Cv obtained by graphic method becomes larger. When the pressure is less than 80–160 kPa, the Cv increases with the pressure, and when the pressure increases further, the Cv decreases with the pressure. Eventually, the rate of change of Cv with pressure becomes slow.
3.3 Analysis of degree of consolidation
Figure 4 compares the calculated Ut versus Tv curves at different pressures for four specimens of clayey soil collected at different depths (Table 1). The degree of consolidation increases rapidly when the time factor is in the range of 0–1.0. As Tv is greater than 1, the growth rate of Ut slows down gradually until the deformation stabilizes (Ut = 1). Under the same time factor, the degree of consolidation generally increases with the pressure. For example, when Tv of the sample at 395.1 m is equal to 2, the Ut increases from 70% to 76.7%, to 85.1% as the pressure increases from 2560kPa to 5120kPa, to 10240 kPa. When Tv is the same, the difference of Ut under high pressure and low pressure conditions increases with the increase of sampling depth, indicating that the consolidation process of deep clayey soil under low pressure is slower than that under high pressure. Deep clayey soil usually has large initial self-weight stress, high degree of consolidation, and is in a dense and hard state. When the load is low, especially less than the self-weight stress of the soil, the compaction response of the specimen is relatively low. In this case, as shown in Figures 4C,D, Ut increases relatively slowly with Tv.
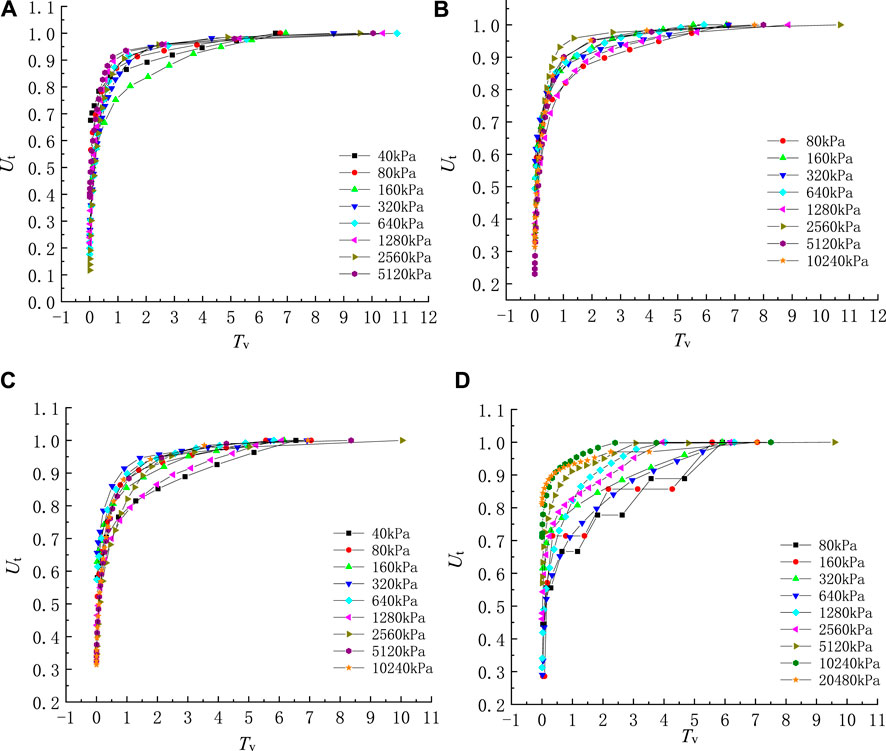
FIGURE 4. Relationship between Ut and Tv under different loads at sampling depths of 52.3 m (A), 145.5 m (B), 292.3 m (C) and 395.1 m (D).
4 Discussion
4.1 Verification of typical one-dimensional compression and consolidation models
4.1.1 Verification of one-dimensional nonlinear compression models
The compression response of clayey soil is usually defined by the relation between the settlement (after consolidation is complete) and the effective stress, which is usually nonlinear. It is conventional to investigate the compression response using a plot of void ratio against the vertical effective stress. The widely used nonlinear models describing the relation between the settlement and the effective stress are as follows.
4.4.1.1 e-log(p) model
The void ratio is an important indicator of soil consolidation characteristics. The test data show that the void ratio has a certain linear relationship with log(p), as shown in Eqs 3–5 (Davis and Raymond, 1965; Li et al., 2013).
For over-consolidated soil, the e-log(p) model is modified as follows
where e0 is the initial void ratio, P0 is the initial effective stress, e and P are respectively the void ratio and effective pressure of soil at a certain time, Cc is the compression index, Pc is the preconsolidation pressure and Cr is the recompression index.
The e-log(p) model is commonly used to describe the compression deformation of soil. However, the e-log(p) curve may not be linear due to differences in soil structure. Therefore, sometimes it is unreasonable to use only the compression (or recompression) index Cc (or Cr) to represent the characteristics of soil compression deformation.
4.1.1.2 log(e+ec)-log(p) model
Chai et al. (2004) developed the log(e+ec)- log(p) model as described below.
where Ccr is the modified compression index, that is, the slope of the log(e+ec)-log(p) line; ec is a test parameter, ranging from -1 to 1. when ec is 0, the model is simplified to the log(e)-log(p) model, and when ec is 1, the model is simplified to the log(1 + e)-log(p) model. The slopes of the straight lines corresponding to these two models are C0 and C1, respectively.
4.1.1.3 Hyperbolic compression model
Wei. (1993) found that the shape of a general ε-p curve is similar to a hyperbola, and the expression is
where E0 and n are model parameters, ε is vertical strain of soil.
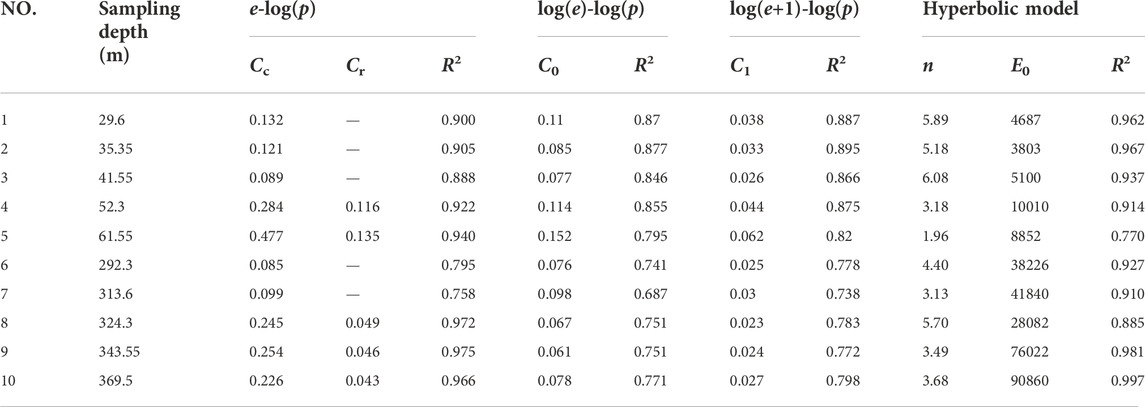
10 groups of soil samples from borehole dxzk02 in Langfang City were selected to verify the suitability of the above three compression models. The experimental data of the above 10 sets of typical clayey soil samples were analyzed, and different compression models were used to fit them, and the model parameters and coefficient of determination R2 were obtained (Table 2).
Table 2 shows that the e-log(p) model parameter Cc ranges from 0.085 to 0.477, parameter Cr ranges from 0.043 to 0.135, the log(e)-log(p) model parameter C0 ranges from 0.061 to 0.152, the log(1 + e)- log(p) model parameter C1 ranges from 0.023 to 0.062, the hyperbolic model parameter n ranges from 1.96 to 6.08, and the parameter E0 ranges from 3803 to 90860 kPa for 10 sets of clayey samples. From the fitting results of each model and the test data of each soil sample, it can be seen that the hyperbolic model and e-log(p) models have the best fitting effect, the R2 values of multiple samples are all above 0.92, and the mean R2 value are 0.93 and 0.9, respectively. The R2 of the log(e)-log(p) and log(1 + e)-log(p) models is generally in the range of 0.69–0.89, and the fitting effect is not as good as the hyperbolic model and e-log(p) models. It can also be seen that the e-log(p) model does not fit well for deep normally-consolidated soils, the R2 is only 0.79 and 0.76 for the normally-consolidated soil samples at depths of 292.3 m and 313.6 m, respectively. The log(e)-log(p) and log(1 + e)-log(p) models fit the shallow clayey samples better than the deep clayey samples, while the hyperbolic model fits almost all soil samples well. The strain-stress curves are presented for the clay samples at depths of 29.6 m and 292.3 m, respectively, which are compared to the e-log(p), log(e)-log(p), log(1 + e)-log(p) and hyperbolic models (Figure 5). As shown in Figure 5, the above conclusion is also proved to be correct by comparing the strain-stress curves with the compression models.
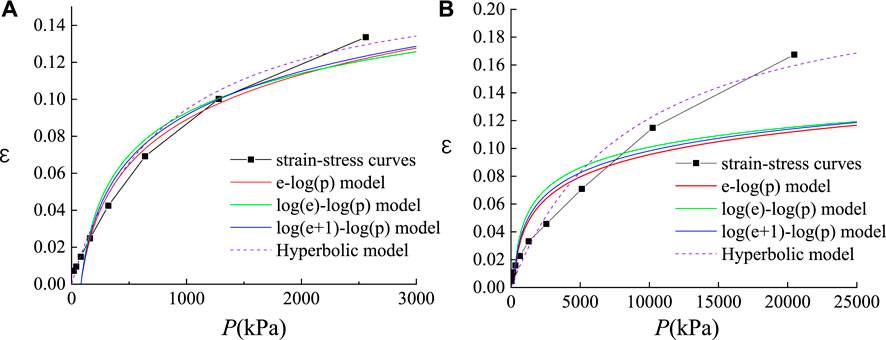
FIGURE 5. The strain-stress curves with comparisons to the compression models at sampling depths of 29.6 m (A) and 292.3 m (B).
4.1.2 Verification of Terzaghi’s one-dimensional consolidation equation
The average degree of consolidation Ut can be expressed as (Craig, 2004):
where
Since the series in the brackets of Eq. 9 converges quickly, the first term can be used in practice, see Eq. 10:
Eqs 9, 10 are analytical solution for Terzaghi’s one-dimensional consolidation equation and simplified forms, respectively. The accuracy of these solutions was tested by plotting the degree of consolidation and time factor data for five sets of shallow and deep clayey soil samples under loads of 2560 kPa and 20480 kPa, respectively (Figure 6). As shown in Figure 6A, the analytical solution of the Terzaghi’s equation is similar to the simplified solution, which is in good agreement with the test data of the shallow clayey soil samples. For deep clayey soil, the solution appears to underestimate the value of
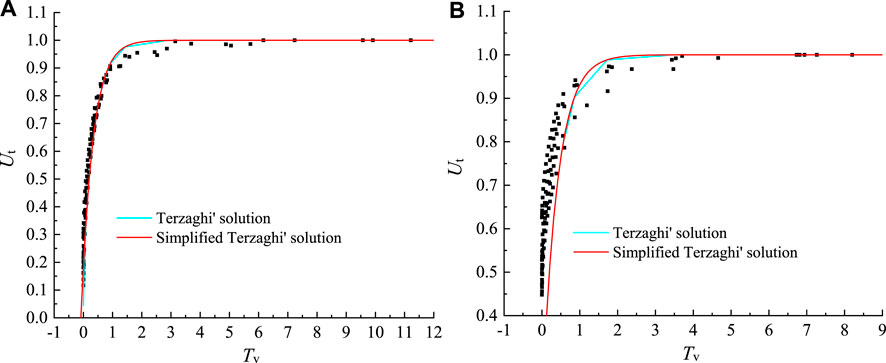
FIGURE 6. Data fitting of the solution of Terzaghi’s 1D consolidation equation to experimental data for shallow clay at p = 2560 kPa (A) and deep clay at p = 20480 kPa (B).
4.2 A new solution for one-dimensional consolidation of deep clayey soil
4.2.1 Equation derivation
Since the analytical solution of Terzaghi’s consolidation equation has a certain error in calculating the consolidation degree of deep clayey soil, it is necessary to establish a new relationship between
The results of test data and fitting curves are shown in Figures 7, 8, indicating that CE_NCP fits the test data better than the analytical solution of Terzaghi’ consolidation equation, which overestimates the degree of consolidation as a whole. The mean value of R2 for the CE_NCP equation is 0.946, indicating that the overall fit of the test data is good. The mean R2 values of the specimens at depths of 0–100 m, 100–200 m, 200–300 m and 300–400 m are 0.947, 0.949, 0.937 and 0.950, respectively, implying that CE_NCP is suitable for the consolidation calculation of both shallow and deep clayey soils.
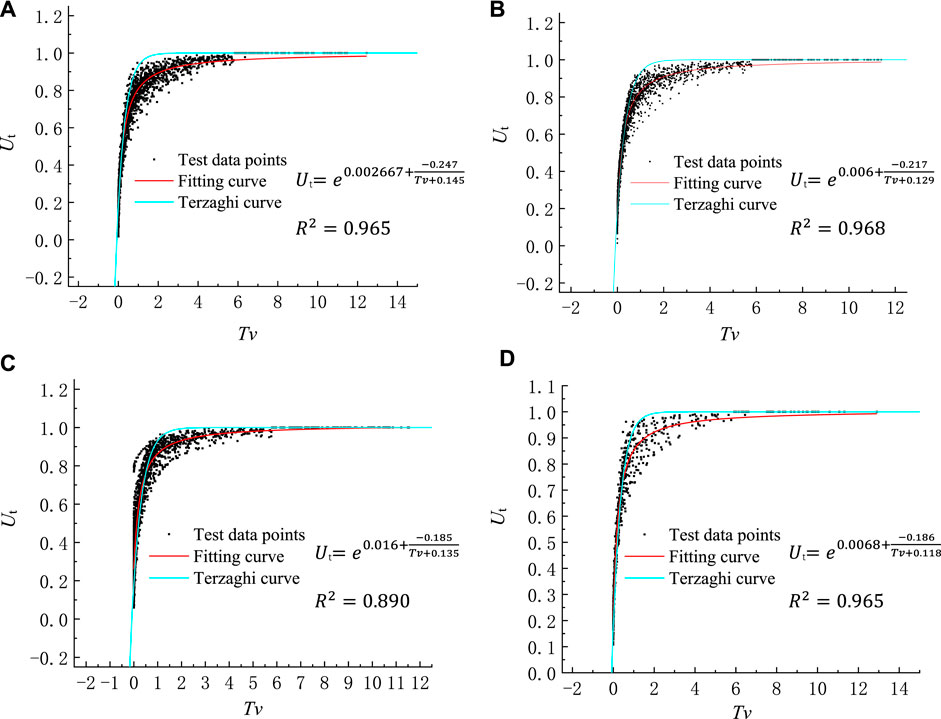
FIGURE 7. Data fitting of Ut -Tv curves for the clayey soil samples at depth of 0–100 m under loads of 0.64 MPa (A), 1.28 MPa (B), 2.56 MPa (C) and 5.12Mpa (D).
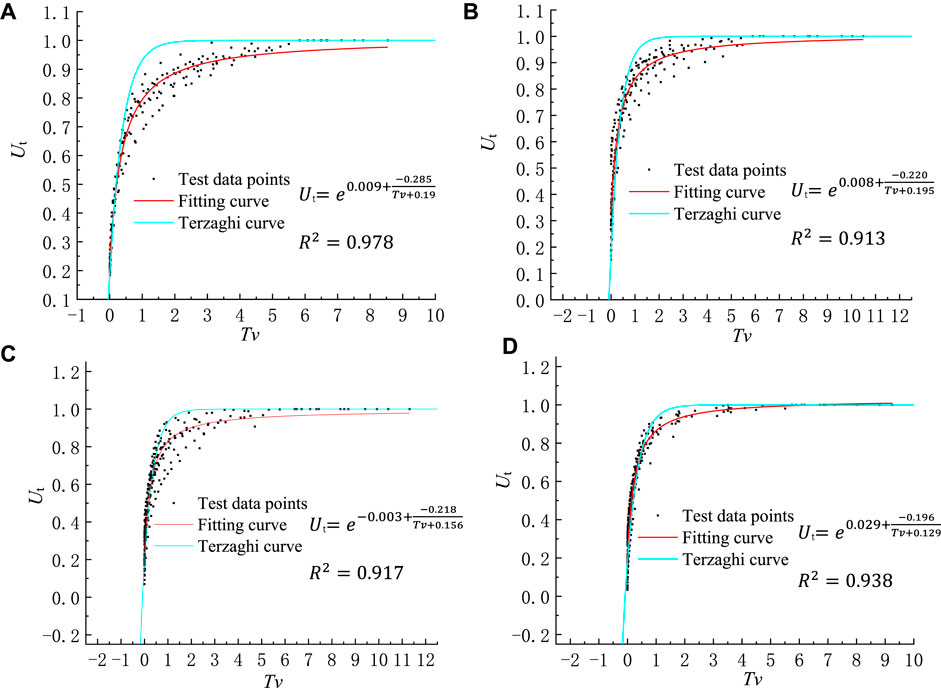
FIGURE 8. Data fitting of Ut -Tv curves for the clayey soil samples at depth of 200–300 m under loads of 1.28 MPa (A), 2.56 MPa (B), 5.12 MPa (C) and 10.24 MPa (D).
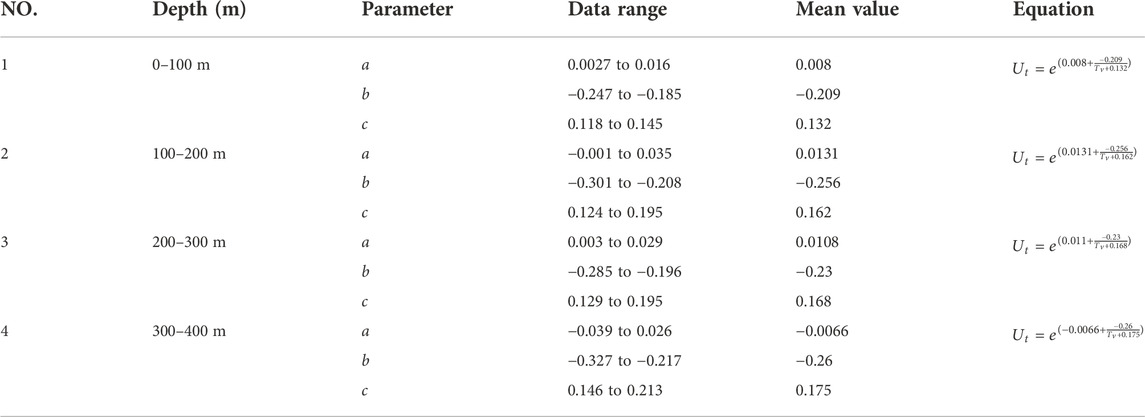
To more accurately reflect the consolidation process, CE_NCP was applied to all soil sample data from 0 to 400 m depth. The parameters a, b and c were averaged under various loads, and Equations 12-15 were obtained as follows.
4.2.2 Parametric analysis
Analysis of the parameters a, b and c is important to understand the variation range and physical meaning. The data ranges and mean values of the parameters are presented in Table 3. Analysis results show that the parameter b increases with the increase of the load. For example, when the loads are 0.64MPa, 1.28MPa, 2.56 MPa and 5.12MPa, the values of parameter b for 100–200 m samples are −0.301, −0.281, −0.234 and −0.208, respectively. As the depth increases to 200–300 m, the b value increases from −0.285 to −0.22, to −0.218, to −0.196, corresponding to loads of 1.28 MPa, 2.56 MPa, 5.12 MPa and 10.24 MPa, respectively. In general, for soil samples with different depths, the mean values of parameters b and c in the proposed equations do not change much.
Sensitivity of the Ut-Tv relationship to the model parameters was analyzed by expanding or reducing the size of one parameter by 10 times while the other two parameters remained unchanged. Results show that the Ut-Tv curve is more sensitive to parameters a and b than c. That is, the variation of parameters a and b has a greater influence on the fitting results than the parameter c. Analysis also shows that the parameter a mainly affects the part of the Ut-Tv curves after the inflection point where the slope of the curve changes from large to small. Table 3 shows that the variation range of parameter b is small, from −0.26 to −0.209, so the change of parameter b has little effect on the calculation results because it is limited to a small range, even though the Ut-Tv curve is sensitive to parameter b. Therefore, parameter a is the most important control parameter in CE_NCP.
4.2.3 Verification and application of CE_NCP
To verify the suitability of the developed consolidation equation CE_NCP, the test data of the soil samples taken from the boreholes located in Shunyi, i.e., dxzk03 and dxzk04, were selected for the fitting (Figure 9). The results show that the equatioin CE_NCP fits well with the test data.
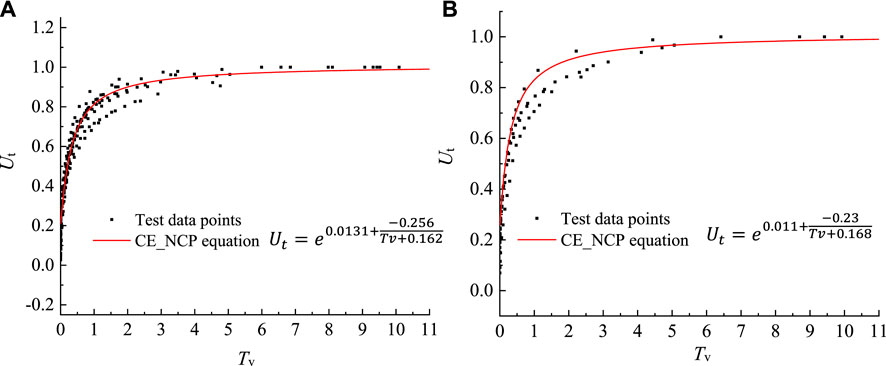
FIGURE 9. Applicability verification of CE_NCP equation, when the load is 5.12 MPa with depth of 100–200 m (A) and the load is 5.12 MPa with depth of 200–300 m (B).
To put the proposed equation into practice, the degree of consolidation of clay near borehole dxzk02 in Langfang was estimated, and the calculated degree of consolidation was compared with the consolidation state of the strata. Langfang City is located at the junction of the Hebei Plain and the Beijing Plain, and the Quaternary loose soil layer is thick. Due to the influence of human activities, especially over-exploitation of deep groundwater, the subsidence rate gradually increased, and by 2015, the maximum subsidence rate had exceeded 80mm/annum. The strata of Langfang City can be divided into four aquifer groups. Groundwater in the first and second aquifer groups is defined as shallow groundwater with unconfined or semi-confined hydraulic properties. Groundwater in the third and fourth aquifer groups is confined and is defined as deep groundwater. There are extensive and thick aquifers in all four aquifer groups. Due to poor quality of shallow groundwater, deep groundwater was mainly exploited locally. The relationship between the variation of groundwater depression cones and land subsidence shows that most serious subsidence areas coincide well with the distribution of depression cones of deep groundwater. The increase of groundwater extraction resulted in the decrease of deep groundwater levels, which led to the increasing of land subsidence rate and the influence area. The decline of groundwater levels is the main influencing factor of land subsidence in this area. There are regional differences in the intensity of groundwater exploitation, and the decline in water levels varies from place to place. In 2019, the depth of shallow groundwater in the area was measured to be 7m–13m, and the depth of deep groundwater reached 80 m.
To study the deformation law of the clayey soil driven by groundwater abstraction, in 2019, a borehole dxzk-02 with a drilling depth of 402.3 m was constructed near the groundwater depression cone in Langfang City, and undisturbed clayey soil samples were collected every 2 m. According to the drilling histogram, the total thickness of the clay in the borehole was is 214.3 m, accounting for 52.9% of the total thickness. The proportion of clayey soil for the third and fourth aquifers was 56.8% and 52.8%, respectively (Table 4). Clayey soil and coarse-grained soil were mutually distributed, and the thickest layer of clayey soil was located in the fourth aquifer group, reaching to 21.1 m.
Through geotechnical tests and high-pressure consolidation tests, the time-varying compression curves of soil samples at different depths and mechanical indicators such as pre-consolidation pressure, consolidation coefficient, compression index, and rebound index were obtained. By comparing the self-weight stress and pre-consolidation pressure, the soil layer with a depth of less than 300 m is basically normally consolidated, and the soil layer with a depth of more than 300 m is slightly over-consolidated (Figure 10).
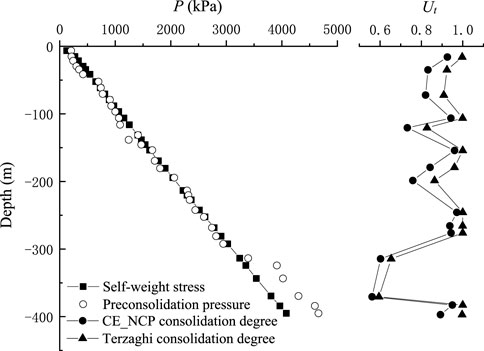
FIGURE 10. Change of self-weight stress, preconsolidation pressure, and degree of consolidation with depth.
Assuming that the clay layer only bears the additional load caused by groundwater extraction, the additional load is calculated as a 13 m drop in the shallow groundwater table and an 80 m drop in the deep groundwater level. The Langfang groundwater depression cone was formed in 1978. With the development of the city, the depression cone has been deepened and expanded. By the end of the drilling construction in 2019, it has been 41 years. Therefore, the action time of additional load caused by pumping is calculated as 41 years. Since the thickness of the clay layers at different depths is known, the degree of consolidation of the clay layers can be calculated by the Terzaghi’s equation and the CE_NCP equation proposed in this paper, as shown in Figure 10. The degree of consolidation calculated by CE_NCP equation at the depth of 0–400 m was in the range of 0.56–0.97, and the degree of consolidation obtained by Terzaghi’s equation was from 0.59 to 1.0. With the increase of depth, the variation law of consolidation degree calculated by Terzaghi’s equation and CE_NCP equation is consistent, but the values calculated by CE_NCP equation are all smaller than those calculated by Terzaghi’s equation. These phenomena are consistent with the conclusion in Section 4.2.1. The results of these two solutions indicate that the clayey soil in the study area is still not fully consolidated, and may still be compressed and result in continued land subsidence. In fact, the groundwater levels in Langfang City have stopped dropping due to the measures to control groundwater exploitation in recent years, but the land subsidence in this region is still developing, which implies that the consolidation of the clay layers have not been fully completed. The thick and low-permeability clay layers may continue to compact at a decreasing rate during the hydraulic head stabilization or recovery.
5 Conclusion
Based on the test data of undisturbed soil samples from 14 boreholes in typical land subsidence areas of Langfang, Daxing and Shunyi, the deformation and consolidation laws of deep clayey soils were analyzed in this paper, and the model CE_NCP was developed to estimate the degree of consolidation. This study has great scientific value and practical implications to improve the accuracy of land subsidence calculation, forecast and early warning, and will provide technical support to effectively relieve the disasters of land subsidence caused by groundwater exploitation in the NCP. The main conclusions are as follows:
1) The time-dependent compression process of clayey soil is roughly divided into three stages, namely the initial compression stage, the primary consolidation stage and the secondary consolidation stage. Overall, the instantaneous deformation caused by the initial compression is positively related to the load. The deformation amount and deformation stabilization time in the primary consolidation stage increase with the increase of the load and decrease with the increase of depth. Geotechnical tests show a general trend that the coefficient of consolidation decreases with the load. With the same soil depth and time factors, the degree of consolidation increases with increasing load. With the same time factor, the difference in the degree of consolidation obtained under high load and low load conditions increases with the increase of sampling depth, indicating that the consolidation process of deep clayey soils becomes slower under low load. Under the same time factor Tv, the degree of consolidation Ut generally increases with the pressure, and the difference of Ut under high pressure and low pressure conditions increases with the increase of sampling depth.
2) Existing compression models were evaluated for their applicability in the study area. Compared with the log(e)-log(p) and log(1 + e)-log(p) models, the hyperbolic and e-log(p) models have better fitting effects. However, the e-log(p) model does not fit well for deep normally-consolidated soils. The log(e)-log(p) and log(1 + e)-log(p) compression models fit the shallow clayey soil samples better than the deep clayey samples. The hyperbolic model fits almost all soil samples well.
3) For deep clayey soils, the Terzaghi’s consolidation equation deviates considerably from the experimental data. Through statistical analysis of a large number of test data, we proposed the CE_NCP consolidation equation, which is more suitable for calculation of the consolidation process of deep clayey soil in the study area than the Terzaghi’s equation. Among the three model parameters a, b and c involved in CE_NCP, parameter a has the greatest influence on the calculation results. The CE_NCP consolidation equation was applied successfully in calculating the degree of consolidation in the subsidence area of Lang Fang City.
Data availability statement
The original contributions presented in the study are included in the article/supplementary material, further inquiries can be directed to the corresponding authors.
Author contributions
Conceptualization, JQ, HG, and FL; data curation, FL, YW, and KG; formal analysis, FL, JQ, and HG; funding acquisition, HG; investigation, YW, FL, XZ, and KG; methodology, JQ, HG, and FL; supervision, FL and YW; writing—original draft, FL, JQ, and HG; writing—review and editing, FL, JQ, HG, and XZ. All authors have read and agreed to the published version of the manuscript.
Funding
This work was supported by the National Natural Science Foundation of China (Grant No. 41877294) and the China Geological Survey (Grant Nos. DD20160235 and DD20190679).
Acknowledgments
Thanks for the support of the above funding and the Science and Technology Innovation Team Project of Hebei GEO University.
Conflict of interest
The authors declare that the research was conducted in the absence of any commercial or financial relationships that could be construed as a potential conflict of interest.
Publisher’s note
All claims expressed in this article are solely those of the authors and do not necessarily represent those of their affiliated organizations, or those of the publisher, the editors and the reviewers. Any product that may be evaluated in this article, or claim that may be made by its manufacturer, is not guaranteed or endorsed by the publisher.
References
Abbaspout, M., Porhoseini, R., Barkhordari, K., and Ghorbani, A. (2015). Coefficient of consolidation by end of arc method. J. Cent. South Univ. 22, 332–337. doi:10.1007/s11771-015-2526-6
Akbarimehr, D., Eslami, A., Aflaki, E., and Imam, R. (2020). Using empirical correlations and artificial neural network to estimate compressibility of low plasticity clays. Arab. J. Geosci. 13, 1225. doi:10.1007/s12517-020-06228-3
Bagheri-Gavkosh, M., Hosseini, S. M., Ataie-Ashtiani, B., Sohani, Y., Ebrahimian, H., Morovat, F., et al. (2021). Land subsidence: A global challenge. Sci. Total Environ. 778, 146193. doi:10.1016/j.scitotenv.2021.146193
Chai, J. C., Miura, N., Zhu, H. H., and Yudhbir, (2004). Compression and consolidation characteristics of structured natural clay. Can. Geotech. J. 41 (6), 1250–1258. doi:10.1139/t04-056
Chan, A. H. C. (2003). Determination of the coefficient of consolidation using a least squares method. Géotechnique 53 (7), 673–678. doi:10.1680/geot.2003.53.7.673
Chen, Z. J., Feng, W., and Yin, J. H. (2021). A new simplified method for calculating short-term and long-term consolidation settlements of multi-layered soils considering creep limit. Comput. Geotechnics 138, 104324. doi:10.1016/J.COMPGEO.2021.104324
Corbau, C., Simeoni, U., Zoccarato, C., Mantovani, G., and Teatini, P. (2019). Coupling land use evolution and subsidence in the Po delta, Italy: Revising the past occurrence and prospecting the future management challenges. Sci. Total Environ. 654, 1196–1208. doi:10.1016/j.scitotenv.2018.11.104
Cui, P. L., Liu, Z. Y., Zhang, J. C., and Fan, Z. C. (2021). Analysis of one-dimensional rheological consolidation of double-layered soil with fractional derivative Merchant model and non-Darcian flow described by non-Newtonian index. J. Cent. South Univ. 28 (1), 284–296. doi:10.1007/S11771-021-4602-4
Cui, W., and Lei, K. (2018). Some ideas on land subsidence working from the view of coordinated development in Beijing-Tianjin-Hebei Regions. Urban Geol. 13 (2), 25–30. (in Chinese ).
Das, B. M., and Sobhan, K. (2016). Principles of geotechnical engineering. 9th edn. Boston: Cengage Learning.
Davis, E. H., and Raymond, G. P. (1965). A non-linear theory of consolidation. Géotechnique 15 (2), 161–173. doi:10.1680/geot.1965.15.2.161
Duncan, J. M. (1993). Limitations of conventional analysis of consolidation settlement. J. Geotech. Engrg. 119, 1333–1359. doi:10.1061/(asce)0733-9410(1993)119:9(1333)
Feng, J. X., Ni, P. P., and Mei, G. X. (2019). One-dimensional self-weight consolidation with continuous drainage boundary conditions: Solution and application to clay-drain reclamation. Int. J. Numer. Anal. Methods Geomech. 43, 1634–1652. doi:10.1002/nag.2928
Feng, R. L., Peng, B., Wu, L. J., Cai, X. P., and Sheng, Y. P. (2021). Three-stage consolidation characteristics of highly organic peaty soil. Eng. Geol. 294, 106349. doi:10.1016/j.enggeo.2021.106349
Figueroa-Miranda, S., Tuxpan-Vargas, J., Ramos-Leal, J. A., Hernández-Madrigal, V. M., and Villaseñor-Reyes, C. I. (2018). Land subsidence by groundwater over-exploitation from aquifers in tectonic valleys of central Mexico: A review. Eng. Geol. 246, 91–106. doi:10.1016/j.enggeo.2018.09.023
Freire, M. M., Marques, M. E. S., Tassi, M. C., and Berbert, L. A. (2022). Comparison between coefficients of consolidation from CPTu and laboratory tests for Guaratiba's soft soil, Rio de Janeiro, Brazil. Cone Penetration Test., 427–431. doi:10.1201/9781003308829-59
Gerardo, H. G., Pablo, E., Roberto, T., Béjar-Pizarro, M., López-Vinielles, J., Rossi, N., et al. (2021). Mapping the global threat of land subsidence. Science 371 (6524), 34–36. doi:10.1126/SCIENCE.ABB8549
Gibson, R. E., Schiffman, R. L., and Cargill, K. W. (1981). The theory of one dimensional consolidation of saturated clays: II. Finite nonlinear consolidation of thick homogeneous layers. Can. Geotech. J. 18 (2), 280–293. doi:10.1139/t81-030
Guo, H. P., Bai, J. B., and Zhang, Y. Q. (2017). The evolution characteristics and mechanism of the land subsidence in typical areas of the North China Plain. Geol. China 44 (06), 1115–1127. (in Chinese ).
Guo, H. P., Li, W. P., Wang, L. Y., Chen, Y., Zang, X. S., Wang, Y. L., et al. (2021). Present situation and research prospects of the land subsidence driven by groundwater levels in the North China Plain. Hydrogeol. Eng. Geol. 48 (3), 162–171. (in Chinese ).
Hu, A. F., Xia, C. Q., Cui, J., Li, C. X., and Xie, K. H. (2018). Nonlinear consolidation analysis of natural structured clays under time-dependent loading. Int. J. Geomech. 18 (2), 04017140. doi:10.1061/(ASCE)GM.1943-5622.0001059
Kadiyan, N., Chatterjee, R. S., Pranjal, P., Agrawal, P., Jain, S. K., Angurala, M. L., et al. (2021). Assessment of groundwater depletion–induced land subsidence and characterisation of damaging cracks on houses: A case study in mohali-chandigarh area, India. Bull. Eng. Geol. Environ. 80, 3217–3231. doi:10.1007/S10064-021-02111-X
Kim, P., Kim, H. S., Pak, C. U., Paek, C. H., Ri, G. H., and Myong, H. B. (2020a). Analytical solution for one-dimensional nonlinear consolidation of saturated multi-layered soil under time-dependent loading. J. Ocean Eng. Sci. 6 (1), 21–29. doi:10.1016/j.joes.2020.04.004
Kim, P., Ri, K. S., Kim, Y. G., Sin, K. N., Myong, H. B., and Paek, C. H. (2020b). Nonlinear consolidation analysis of a saturated clay layer with variable compressibility and permeability under various cyclic loadings. Int. J. Geomech. 20 (8), 04020111. doi:10.1061/(ASCE)GM.1943-5622.0001730
Kim, P., Ri, M. C., Ri, K. S., Rim, M. C., and Jong, S. G. (2021). Radial consolidation analysis of unsaturated soil with vertical drains under various cyclic loadings. Int. J. Numer. Anal. Methods Geomech. 2021, 1549–1568. doi:10.1002/NAG.3213
Li, G. X., Zhang, B. Y., and Yu, Y. Z. (2013). Soil mechanics. 2th edn. Beijing: Tsinghua University Press.
Liu, Z. Y., Zhang, J. C., Yang, C. Y., and Xu, C. Y. (2021). Piecewise-linear model for one-dimensional consolidation considering non-Darcian flow under continuous drainage boundary. Int. J. Geomech. 21 (5), 06021011. doi:10.1061/(ASCE)GM.1943-5622.0002017
Mesri, G., Feng, T. W., and Shahien, M. (1999). Coefficient of consolidation by inflection point method. J. Geotech. Geoenviron. Eng. 125125 (8), 7168–7718. doi:10.1061/(asce)1090-0241(1999)125:8(716)
Mittal, M., Satapathy, S. C., Pal, V., Agarwal, B., Goyal, L. M., and Parwekar, P. (2021). Prediction of coefficient of consolidation in soil using machine learning techniques. Microprocess. Microsystems 82, 103830. doi:10.1016/j.micpro.2021.103830
Rafiee, M., Ajalloeian, R., Dehghani, M., and Mahmoudpour, M. (2022). Artificial neural network modeling of the subsidence induced by overexploitation of groundwater in Isfahan-Borkhar Plain, Iran. Bull. Eng. Geol. Environ. 81, 170. doi:10.1007/s10064-022-02646-7
Rezania, M., Bagheri, M., and Nezhad, M. M. (2020). Creep and consolidation of a stiff clay under saturated and unsaturated conditions. Can. Geotech. J. 57 (5), 728–741. doi:10.1139/cgj-2018-0398
Selvadurai, A. P. S. (2021). Irreversibility of soil skeletal deformations: The Pedagogical Limitations of Terzaghi’s celebrated model for soil consolidation. Comput. Geotechnics 135, 104137. doi:10.1016/j.compgeo.2021.104137
Wei, R. L. (1993). Derivation for coefficient of consolidation from settlement observation. Chinese. J. Geotech. Eng. 15 (2), 12–19. (in Chinese ).
Xie, K. H., and Leo, C. J. (2004). Analytical solutions of one-dimensional large strain consolidation of saturated and homogeneous clays. Comput. Geotechnics 31, 301–314. doi:10.1016/j.compgeo.2004.02.006
Xiong, X. F., Shi, X. Q., and Wu, J. F. (2017). 3D numerical simulation of elasto-plastic land subsidence induced by groundwater pumping. Hydrogeol. Eng. Geol. 44 (2), 151–159. (in Chinese ).
Yin, J. H., Chen, Z. J., and Wei, Q. (2022). A general simple method for calculating consolidation settlements of layered clayey soils with vertical drains under staged loadings. Acta Geotech. 17 (8), 3647–3674. doi:10.1007/s11440-021-01318-2
Zabłocka, K., Lendo-Siwicka, M., and Wrzesiński, G. (2020). The influence of mineralogical composition of soil on the consolidation coefficient value. Acta Sci. Pol. Archit. 19 (3), 83–90. doi:10.22630/ASPA.2020.19.3.30
Zhang, Y. Q., Gong, H. L., Gu, Z. Q., Wang, R., and Zhao, W. (2014). Characterization of land subsidence induced by groundwater withdrawals in the plain of Beijing city, China. Hydrogeol. J. 22, 397–409. doi:10.1007/s10040-013-1069-x
Zheng, Y. M., Sun, H., Hou, M. X., and Ge, X. R. (2021). Microstructure evolution of soft clay under consolidation loading. Eng. Geol. 293, 106284. doi:10.1016/j.enggeo.2021.106284
Zong, M. F. (2021). Theoretical and experimental study on one-dimensional nonlinear consolidation of soft soil based on continuous drainage boundary. PhD thesis. Wuhan P.R. China: China University of Geosciences. (in Chinese ).
Keywords: the North China Plain, land subsidence, clayey soil, consolidation, oedometer test
Citation: Liu F, Qi J, Guo H, Wang Y, Guo K and Zang X (2022) Experimental study on consolidation characteristics of deep clayey soil in a typical subsidence area of the North China Plain. Front. Environ. Sci. 10:1084286. doi: 10.3389/fenvs.2022.1084286
Received: 30 October 2022; Accepted: 22 November 2022;
Published: 07 December 2022.
Edited by:
Lichun Wang, Tianjin University, ChinaReviewed by:
Youquann Zhang, Capital Normal University, ChinaJahanzaib Israr, University of Engineering and Technology, Lahore, Pakistan
Copyright © 2022 Liu, Qi, Guo, Wang, Guo and Zang. This is an open-access article distributed under the terms of the Creative Commons Attribution License (CC BY). The use, distribution or reproduction in other forums is permitted, provided the original author(s) and the copyright owner(s) are credited and that the original publication in this journal is cited, in accordance with accepted academic practice. No use, distribution or reproduction is permitted which does not comply with these terms.
*Correspondence: Jianfeng Qi, amlhbmZlbmdsdWNrQDE2My5jb20=; Haipeng Guo, cGVuZ2ZlaTc5NzFAc29odS5jb20=
 Fengjunnan Liu1,2
 Haipeng Guo
