 Abdallah M. A. Dawood
 Eric Akortia1
 Sultan J. Alsufyani
- 1Radiation Protection Institute, Ghana Atomic Energy Commission, Accra, Ghana
- 2Department of Physics, College of Science, Taif University, Taif, Saudi Arabia
Depositions of trace elements of air particulates in the atmosphere have gained much attention in recent times due to their environmental, climatic and health impacts. In the current study, trace elements of size-segregated rural and urban particulate matter (
1 Introduction
Dust intrusion phenomenon is the flow or transport of dust in significant quantities, locally (short range) and across boundaries (long range) from major sources such as the Saharan region of north Africa and central Asia (Rodríguez et al., 2001; Engelstaedter et al., 2006; Chin et al., 2007). It is a phenomenon that affects the soil-water mineral composition of a place. In many regions of the world, mineral dust contributes significantly to the atmospheric optical thickness (Tegen et al., 1997). Transboundary dust transport and local dust resuspension affect vision leading to traffic accidents, disruption in aviation operations and human health effects such as respiratory diseases, allergies and pediatric asthma (Gyan et al., 2005; Ge et al., 2014; WHO 2021).
Desert dusts have been reported as the main source of atmospheric particles that affect air quality and climate change (Grantz et al., 2003). Dust aerosols can alter albedo and rainfall patterns as they act as cloud condensation nuclei (CCN). Their deposition in the ocean is an important source of both marine nutrients and contaminants. They enter the marine ecosystems after long-distance transport; influence phytoplankton biomass in the oceans by altering the amount of CO2 absorbed by the phytoplankton (Wang et al., 2017), and ultimately cause a change in the global climate.
Dust is frequently transported in the Mediterranean basin area, but can also appear at higher latitudes in Europe (Gkikas, et al., 2018). It was suggested in Harrison et al. (2012) that, long-range transport of pollutants to the United Kingdom was associated with specific meteorological conditions under the influence of easterly, south-easterly and southerly flows; and that, 25%–50% of the total accumulated primary PM2.5 emissions originate outside of the United Kingdom.
The Sahara and its margins form the largest and most continuous source of dust globally. It is the main source of dust in the Northern Hemisphere with the potential to cause regional, inter-continental and global impacts such as fertilization in South America (Prospero et al., 1987) and air quality in Europe (Prospero, 1990; Lestari et al., 2003; Washington et al., 2003).
The climate of the Sahara is influenced by the monsoon during the summer and the westerly winds during the rest of the year. In July and August, easterly winds, moist air masses and scarce rainfall are the prevailing weather conditions in the Saharan region. Transport of dust from the Sahara to the Eastern Mediterranean is maximized in the months of April and May (Alpert and Ziv, 1989; Ganor, 1991). Francois and Legrand (2003), and Prasad and Singh (2007), have both reported that most of the naturally emitted mineral dust released to the atmosphere from arid or semi-arid areas such as the Sahara have significant impact on European countries located along the west coast of North Africa.
Atmospheric deposition scavenges pollutants from the atmosphere either by precipitation (wet deposition) or by the wind (dry deposition). Both processes are considered natural cleansing mechanism of the atmosphere (Grantz et al., 2003; Qu et al., 2012). Coarse particles (
Depositions of trace elements of air particulates are important phenomenon to air quality and public health. Several studies have estimated dry deposition flux (Herut et al., 2001; Jiries et al., 2002; Sakata et al., 2006; Fang et al., 2007; Ge et al., 2014) in many countries including Brazil, Taiwan, Tokyo and Turkey (Sakata et al., 2006; Tasdemir et al., 2006; Fang et al., 2007; Pedro et al., 2007).
Studies carried out in the Mediterranean Basin analyzed the impact of Saharan dust events (SDE) on human health. Most of these studies related to the impact of coarse particles as the associations between exposure to fine particles and human health effects were usually not statistically significant (Karanasiou et al., 2012). Jiménez et al. (2010) identified the
The current study investigated the impacts of dust intrusion and dust deposition flux on observed concentrations of both
The Non-hydrostatic Multiscale Model on B-grid (NMMB/BSC) is a dust model developed by the National Centers for Environmental Prediction (NCEP Maryland, United States) in collaboration with the Barcelona Super Computing (BSC, Spain). The model was evaluated to provide short to medium range weather and dust forecasts; and as a first step towards the development of a unified chemical-weather model (Pérez et al., 2011; Haustein et al., 2012). At the global scale, the model lies within the top range of AEROCOM dust models in terms of performance statistics for surface concentration, deposition and aerosol optical depth (AOD). At the regional scale, it significantly reproduces the daily variability, seasonal and spatial distribution of the dust optical depth over Northern Africa, Middle East, and Europe (Pérez et al., 2011). However, observational constraints due to non-linear relationship between dust emission and wind speed have led to underestimations by dust emission models (Cakmur et al., 2006).
2 Materials and methods
2.1 Study area
The current study had two monitoring stations in the western region of Turkey. One station was located in a rural area and the other one in an urban area. Selection of the sites was based on several factors including population, traffic and industrialization. The urban site was close to the city center of Kütahya. The population of the city was 260,776 (Kütahya Valiligi, 2013). It is city characterized with heavy vehicular activities (vehicular density of about 167.094 per day); and several industrial operations around the city. There are three major highways linking to other cities and Towns: Kütahya-Bilecik, Kütahya-Afyon, and Kütahya-Balıkesir. The Kütahya-Bilecik highway for instance has been cited as the most air pollution source on the city (Todd, 2008). The rural site on the other hand was located at western-north of the urban station with close proximity (approximately 2.5 km) to the Tunçbilek power plant. Its population and traffic density are lower; approximately 6000 people live in the area (Kütahya Valiligi, 2013).
Main pollution sources in the region are traffic, residential heating and industry (especially power plants and mining). Coal is the most commonly used fuel for residential heating and industrial activities due to its abundance as well as proximity of the lignite reserves around the region. The region is referred to as a thermal power plant region due to the presence of three thermal power plants: Seyitömer Thermal Power Plant (600 MW), Tunçbilek Thermal Power Plant (365 MW) and Orhaneli Thermal Power Plant (210 MW), which are 20 km, 50 km and 105 km, respectively from the Kutahya City Center (Artun et al., 2016). Among these plants, Tunçbilek and Seyitömer power plants are located within the study area and in close proximity (approximately 1.5 km and 2.5 km, respectively) from the rural monitoring station. Other potential industrial pollution sources located within the enclave include sugar factory, ceramic factory, food plants, heavy truck movement, boron mining and magnesite industries.
Meteorological parameters of the two sites differed marginally. The average ambient temperature, mixing height and wind speed of the rural and urban sites during the study period were 5.83°С and 5.02°С; 876 m and 898 m; and 6.82 ms−1 and 6.41 ms−1, respectively. Figure 1 is the map of the study area indicating the two monitoring sites.
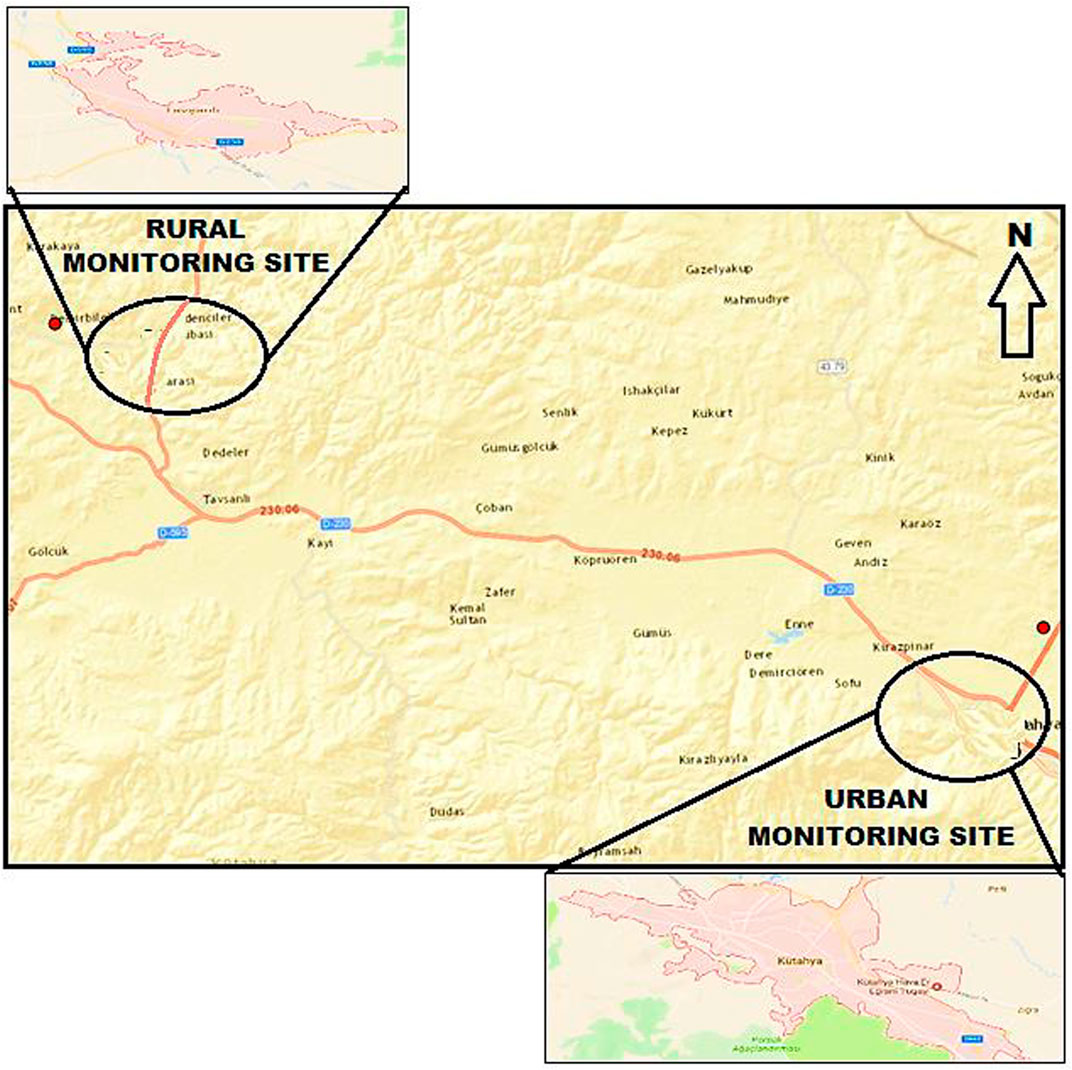
FIGURE 1. Map of the study area showing the locations of the two monitoring sites.
2.2 Sampling
Size-segregated particulate matter,
The first filter holder (holder facing the air intake) was loaded with the coarse filter membrane whilst the second filter holder was loaded with the fine filter membrane with the shiny sides of both facing upwards. The exposed surface area of the filters was 12.88 cm2. The sampler was installed at a height of 2 m above the ground. When the air flow started, particles with aerodynamic diameter between 2.5 μm and 10 μm were captured on the coarse filters whilst those less than 2.5 μm penetrate and get captured on the fine filters.
2.3 Sample analysis
The air particulate samples were analysed using particle-induced X-ray emission (PIXE) method. PIXE analysis was performed using 3 MeV protons (3 MV Tandetron accelerator) at the LABEC laboratory; National Institute of Nuclear Physics (INFN), Florence, Italy. The PIXE technique has been widely used since its inception for the study of aerosol composition. For a long time, it was a dominant technique due to its efficiency and short analytical time (Maenhaut, 2015). It is non-destructive, highly sensitive method which does not require sample treatment i.e., extraction, dilution, preconcentration etc., (Lucarelli et al., 2011), which are often the source of contamination for solution-based analytical methods such as induced coupled plasma - atomic emission spectroscopy (ICP-AES) or mass spectrometry (ICP-MS). Full description of the method including sensitivity, quality control—quality assurance, uncertainty and method detection limit can be found elsewhere in (Lucarelli et al., 2011; Dall’Osto et al., 2013; Lucarelli et al., 2015; Gaga et al., 2022).
PIXE was applied for both qualitative and quantitative analyses of the air particulate samples. The fundamental analytical task with regards to qualitative analysis involved observation of X-ray energies/peaks and linking them to their respective species/elements. With regards to quantitative analysis, the task was to convert the observed X-ray energies into elemental concentrations. Thus, the quantitative exploit of the method was based on Eq. 1 as follows:
Where
2.4 Dust intrusion analysis
The current study applied the online Non-hydrostatic Multiscale Model on a B-grid (NNMB/BSC) developed in collaboration with the Barcelona Super Computing (BSC, Spain) and the National Centers for Environmental Prediction (NCEP Maryland, United States). The model had been validated over a longer period in the European region (Pay et al., 2010; Basart et al., 2012) against measurements at source regions (Haustein et al., 2009; Todd, 2008). It is important to note that dust emission is a non-linear function of wind speed, it depends on several factors barely known and considered by the scale of the model grid.
The NMMB/BSC dust model was used to assess daily and monthly averages of dust surface Concentration (DSC), aerosol optical depth (AOD) and dust loadings (DL) for the entire sampling period. The months of March and November represent the cold and mostly wet period of the year whilst July and August represent the warm and mostly dry period in the study region. These selected months therefore, make a good representative period for dust flow investigation in the study area.
The model validation was performed by evaluating the model’s outputs in comparison with a near-real-time (NRT) AERONET observations—a Saharan Aerosol Network station (IMS-METU-ERDEMLI) located in Turkey. In this regard, Angstrom Exponent (AE), dust optical depth (DOD) and aerosol optical depth (AOD) were observed each day of the representative study period.
Trajectories of the air masses arriving at the study locations were obtained by performing back trajectory analysis using the on-line-Real-time Environmental Applications and Display sYstem, (READY). The following steps were followed in running the model:
1. Select the number of trajectories starting location
2. Selecting the type of trajectory e.g., Normal, Matrix, Ensemble or Frequency trajectories.
3. Input the meteorology and starting receptor locations
4. Select the meteorological forecast cycle
5. Select the direction of trajectory i.e., forward or backward
6. Select the type of motion i.e., vertical velocity, isobaric or isentropic
7. Set the model’s total run-time and date based on the study period
8. Select display option
2.5 Dry deposition flux
Dry depositions flux of selected PM elements including Mg, Al, K, Ca, S, V, Cr, Mn, Fe, Ni, Cu, Zn, As, Se, Sr, and Pb were estimated as the product of the atmospheric concentrations of the elements and their deposition velocities using Eq. 2:
Where, F is the dry deposition flux,
In the determination of dry deposition flux, the current study adopted the dry deposition velocities of elements from various literature including GESAMP, (1989); Fang et al. (2007a) and Injuk et al. (1998) as cited in Table 1, and elemental concentrations measured in this study. For the elements K, Ca, S, V, Cr, As, Se and Sr, the averages of summer and winter dry deposition velocities reported by Injuk et al., 1998 were adopted; those of Al, Mn, Fe, Zn and Pb were adopted from GESAMP, (1989) whilst that of Mg was adopted from Fang et al., 2007b. Deposition velocities of the elements were converted from their original units of cm s−1 to m day−1, and finally, dry deposition flux estimated and reported in μg m−2 day−1.
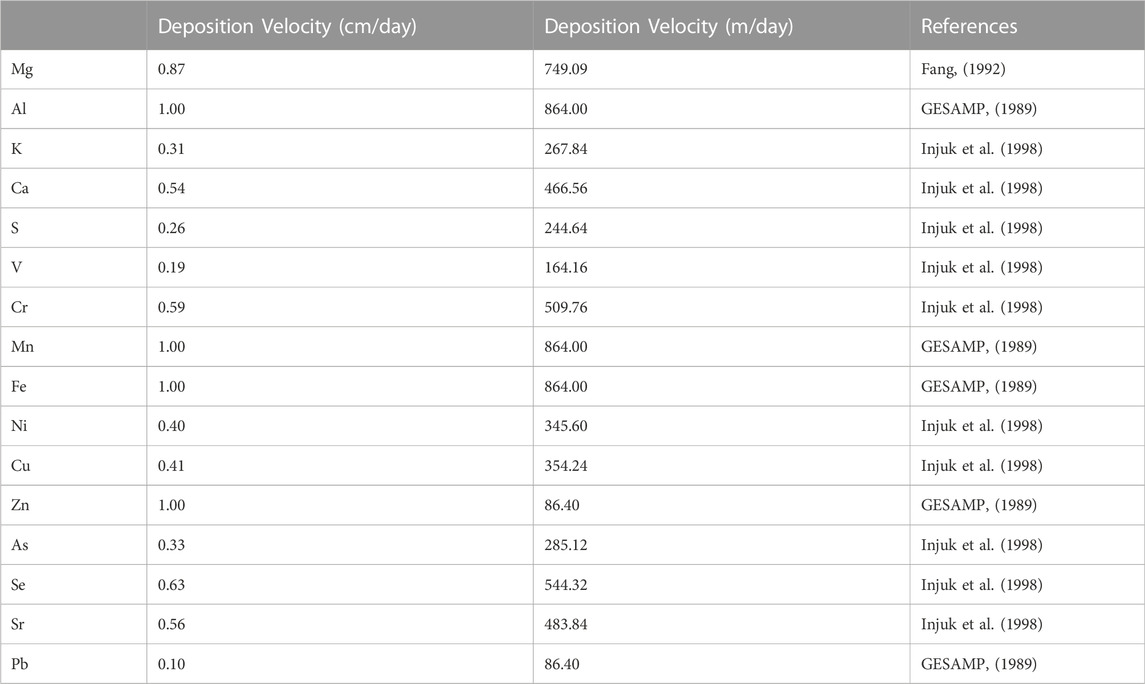
TABLE 1. Settling velocities of PM elements from the literature.
Following Duce et al. (1991) and as reported by GESAMP (1989), air particulate elements were categorized as ‘pollution’ dust and mineral dust elements. The “pollution” elements comprised S, V, Cr, As, Se, Cu, Sr and Pb; usually associated with fine aerosols with aerodynamic diameter ≤2.5 µm; and from high-temperature anthropogenic sources such as fossil fuel combustion. The mineral dust elements which comprised Mg, Al, K, Ca, Ti, Fe, Mn, and Zn are usually associated with coarse aerosols with aerodynamic diameter between 2.5 µm and 10 µm.
3 Results and discussion
3.1 Elemental concentration
Mass concentrations of the elements Mg, Al, K, Ca, S, V, Cr, Mn, Fe, Ni, Cu, Zn, As, Se, Sr, and Pb were determined in two PM modes,
Elemental concentrations in the fine aerosols of the rural site ranged between 0.0002 ± 0.0001 μg m−3 (for Se) and 0.6658 ± 0.5816 μg m−3 (for S). At the urban site, however, elemental concentration in the same PM mode ranged between 0.0007 ± 0.0008 μg m−3 (for As) and 0.5869 ± 0.3429 μg m−3 (for Ca). The coarse PM mode exhibited similar trend and variation in the measured elemental concentration. Concentration ranged between 0.0001 ± 0.0001 μg m−3 (for Se) and 0.5886 ± 0.5343 μg m−3 (for Ca) at the rural site whilst at the urban site, concentration ranged between 0.0002 ± 0.0002 μg m−3 (for Se) and 1.9201 ± 1.711 μg m−3 (for Ca). The average daily concentrations of
The summary statistics indicates that the variation and/or dispersion of the PM elemental concentration was low as in most cases, the standard deviation was marginally lower than the mean concentration. Variability of the elements in the two PM modes across the two sites are presented in Figure 2. Crustal elements such as Fe, Ca, Al, Mg and K were dominant in the urban coarse aerosols as opposed to the rural aerosols of same PM mode. This is attributable to the lithophilic nature of these elements, and their association with urban dust resuspension by the wind. Anthropogenic activities such as vehicular movement can also be a contributing factor. In contrast, the elements Pb, Se, As, S and V, associated with fuel combustion were found to be significant in the urban fine aerosols. However, other anthropogenic (mixed-source) elements such as Sr, Ni and Mn recorded very low concentrations in the same PM mode at the same site.
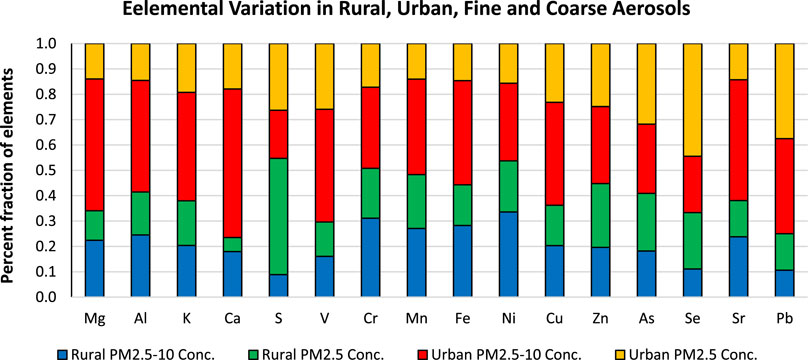
FIGURE 2. Variations of PM elemental concentrations under different environmental conditions.
It is important to note that, S, As and Se concentrations were statistically significant (p < 0.05) at the 95% confidence interval (CI) in the fine aerosols across the two sites. Concentrations of Zn, Pb, and V, another group of elements associated with oil combustion were found to be significant in both the rural and urban fine aerosols. These elements are important coal combustion markers, and their high concentrations can be attributed to the Tuncbilek and Seyitomer coal-fueled thermal power plants located within the province of the study area.
3.2 Dry deposition flux
Dry deposition fluxes of the elements in the fine and coarse aerosols were estimated as the product of the mean atmospheric concentration of the element and the mean deposition velocity of that element. Elemental dry deposition flux in the rural coarse aerosols ranged between 0.05 μg m−2 day−1 (for Se) and 274.62 μg m−2 day−1 (for Ca). In the fine aerosols, deposition flux ranged between 0.11 μg m−2 day−1 (for Se) and 162.88 μg m−2 day−1 (for S). At the urban site, deposition flux of the coarse aerosols ranged between 0.11 μg m−2 day−1 (for Se) and 895.84 μg m−2 day−1 for (Ca) whilst those of the fine aerosols ranged between 0.20 μg m−2 day−1 (for As) and 178.09 μg m−2 day−1 (for Ca). The average of deposition flux of elements at the urban site was 71.84 ± 74.69 μg m−2 day−1 as against 40.70 ± 49.83 μg m−2 day−1 at the rural site.
The average dry deposition flux estimated for fine and coarse aerosols at the rural and urban sites were 33.68 ± 57.19 μg m−2 day−1 and 47.71 ± 92.19 μg m−2 day−1; 36.66 ± 61.95 μg m−2 day−1 and 107.02 ± 237.71 μg m−2 day−1, respectively. Mainly crustal and lithophilic species (Al, Ca, Fe) and “coal pollution” element, S, recorded high and significant dry deposition fluxes across the two sites and in the two PM modes. However, in terms of PM mode variation, deposition flux was higher in the coarse mode than in the fine mode. These observations can be attributed to the combine effects of both meteorological conditions and anthropogenic emissions. During stable atmospheric condition, temperature inversion causes resistance of vertical motion of air parcel; the system cools the rising air faster than the surrounding environment. as a result, locally generated air pollutants tend to concentrate at the ground level. Unstable atmosphere will, however, make air parcels warmer and less dense than their surrounding environment. This phenomenon causes a decrease in the ground level concentration of the locally generated air pollutants. Previous studies carried out in the Mediterranean Basin on the impact of Saharan dust events (SDE) on human health have indicated the importance of coarse particles as far as dust loadings and mineral dust concentrations are concerned (Kim et al., 2000; Zender et al., 2004; Haustein et al., 2012). Moreover, the associations between exposure to fine fraction (
The descriptive statistics further reveals that, total PM deposition at the urban site was 27.67% more than that of the rural site. In relation to this, it was observed that, the average dry deposition flux of elements in the urban
Observation from various literature is that particle size distributions are as highly variable as the settling deposition velocities of the PM elements. Therefore, the use of average elemental concentration and average deposition velocity make the resulting deposition flux challenged with uncertainties. Nevertheless, it is important to understand the relationship between flux variation and elemental concentration; in different PM modes, and in different environmental conditions. Figure 3 shows the variations in dry deposition flux of the elements in the fine coarse aerosols across the two study sites. The percent deposition charts indicate the difference in arial deposition of each PM mode across the two sites.
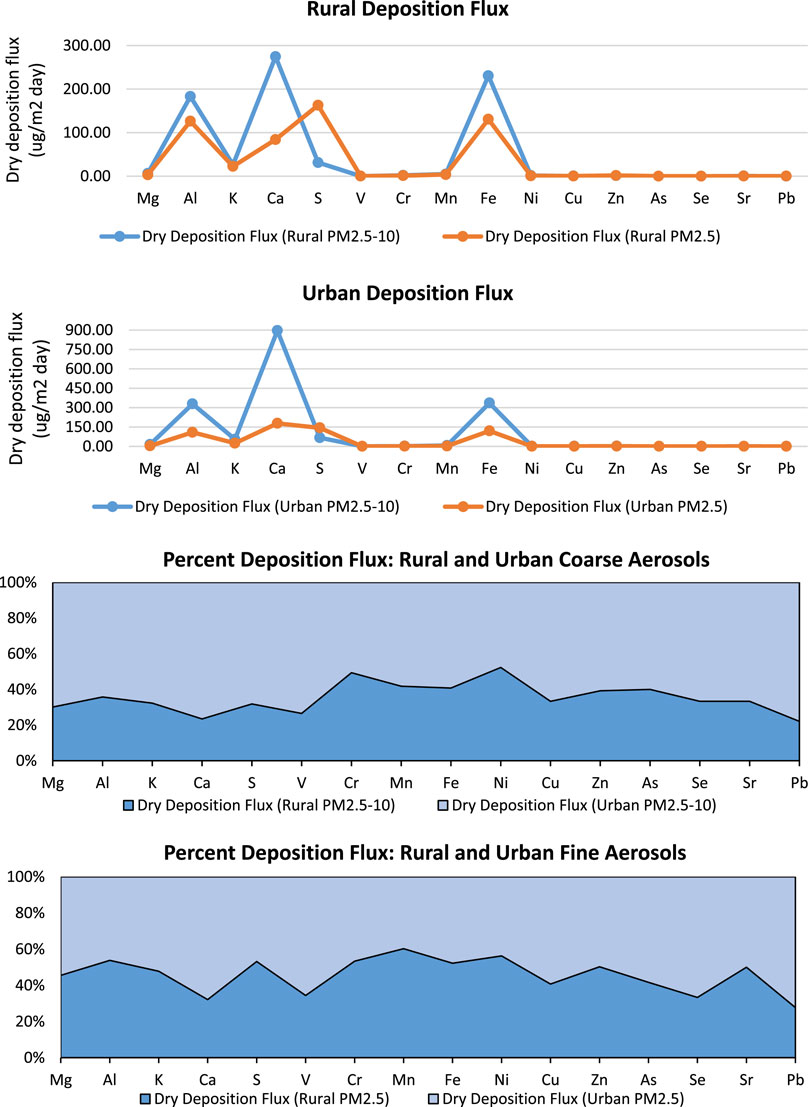
FIGURE 3. Estimated dry deposition flux of fine and coarse PM elements measured in different environmental conditions.
3.3 Dust intrusion
Satellite observation of air mass advection from the Sahara to Turkey and particularly the study region was done using the NMMB/BSC-dust model. The system consists of numerical weather prediction model incorporated with an on-line parameterization of all the major phases of the atmospheric dust cycle. Variables of interest were daily and monthly averages of dust surface Concentration (DSC), aerosol optical depth (AOD) and dust loadings (DL) for the entire study period. The months of March and November which represent the cold and mostly wet period; and July and August which represent the warmest and mostly dry periods in Turkey were selected as representative months for the satellite observation of the dust flow cycle.
Dust flow as observed with the NMMB/BSC dust model was seen to be concentric; from the highly loaded countries such as Chad through Niger, Mali, Algeria, Libya and over the Mediterranean into Western Turkey. The highest dust loadings from the source regions were observed in the months of July and August whereas relatively lower loadings were observed in March and November. Dust loads reaching Western Turkey were, however low, 0.1–0.4 g m−2 in the green color band of 492–550 nm wavelength compared to the loads from the source countries which was in the range 1.2–6.4 g m−2, extending from the yellow (577 nm) to dark brown (≥800 nm) aerosol bands. Order of dust loading in Turkey was March > July > November > August. Figure 4 is the generated model charts of dust loadings for these selected periods.
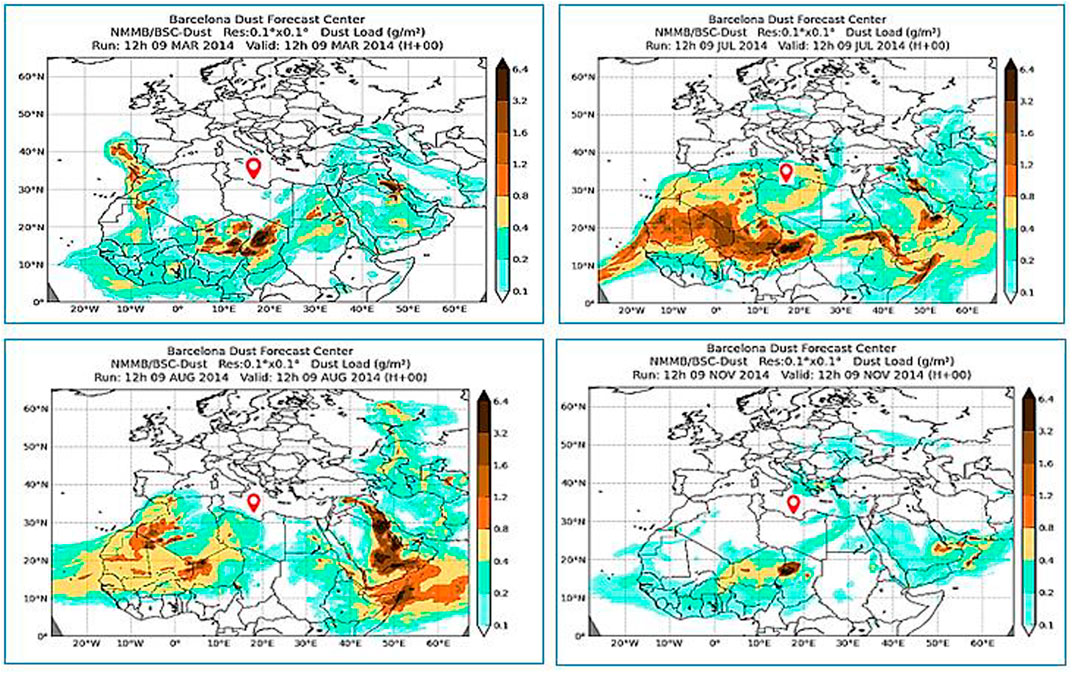
FIGURE 4. Dust loadings on selected months during sampling campaign.
3.3.1 Dust surface concentration
Dust surface concentration is dependent on the aerosol mass/dust loadings at a given area. Daily average dust concentration from the dust model ranged between 5 and 20,000 μg m−3 and that of the monthly average ranged between 5 and 5,000 μg m−3. The highest daily dust surface concentration (>5,000 μg m−3) was observed particularly in Chad and Niger in Sahara Africa and Iraq and Iran in the Middle East. Incidentally, the highest daily concentration for Turkey (50–200 μg m−3) was observed in the central and south-west of the country in the month of March; the rest of the months recorded between 5 and >20 μg m−3. Thus, the order of surface dust concentration in the year was March > July > November > August. It is important to mention that despite recording the highest dust surface concentration in the month of March, this did not reflect in the elemental concentrations of PM sampled at the receptor locations during this period. Elemental concentration observed in March was relatively lower than July and August. This unusual observation can be attributed to inhibition or lack of re-suspension of dust by precipitation as March is a winter month with a lot of snow or damp surfaces in the study region. In Figure 5, the model charts of daily average dust surface concentrations over the selected periods are shown.
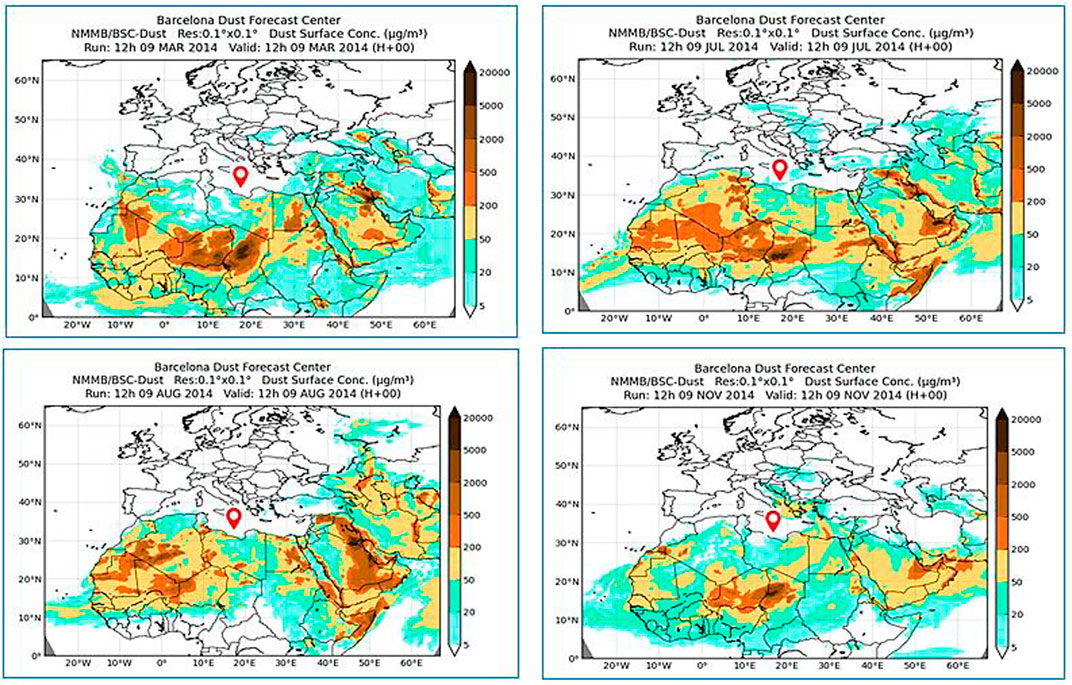
FIGURE 5. Daily dust surface concentrations (µg m−3) over the selected periods.
3.3.2 Aerosol optical depth
Aerosol Optical Depth (AOD) is the measure of aerosols distributed within a column of air from the Earth’s surface to the top of the atmosphere (Chen et al., 2015; Pausata et al., 2020). The measurement includes variables such as urban haze, smoke, particles, desert dust, sea salt etc. This parameter gives us an insight on the visual outlook of the atmosphere. For example, an optical depth of less than 0.1 (plain band) is an indication of a crystal-clear sky with maximum visibility, whereas an optical depth value of 1 or greater (red to reddish-brown) indicates a very hazy condition with hazicity increasing in that order (Smirnov et al., 2004; NASA Earth Observation). Aerosol optical depth is related to the quantity of aerosols in the vertical column of atmosphere over the observed location (NOAA; Accessed online, May 2018). In line with dust loading and dust surface concentration observed earlier, aerosol optical depth was observed in the same order; March > July > November > August, making the months of August and November the clearest atmosphere in Turkey in the study year. The maximum optical depth of 0.1–0.2 m was observed in the entire central to south-west and part of north-east regions of Turkey in March whereas in the month of July, same optical depth of aerosols was observed in west-most of the country. Figure 6 shows the variability in optical depths of aerosols in the selected representative months.
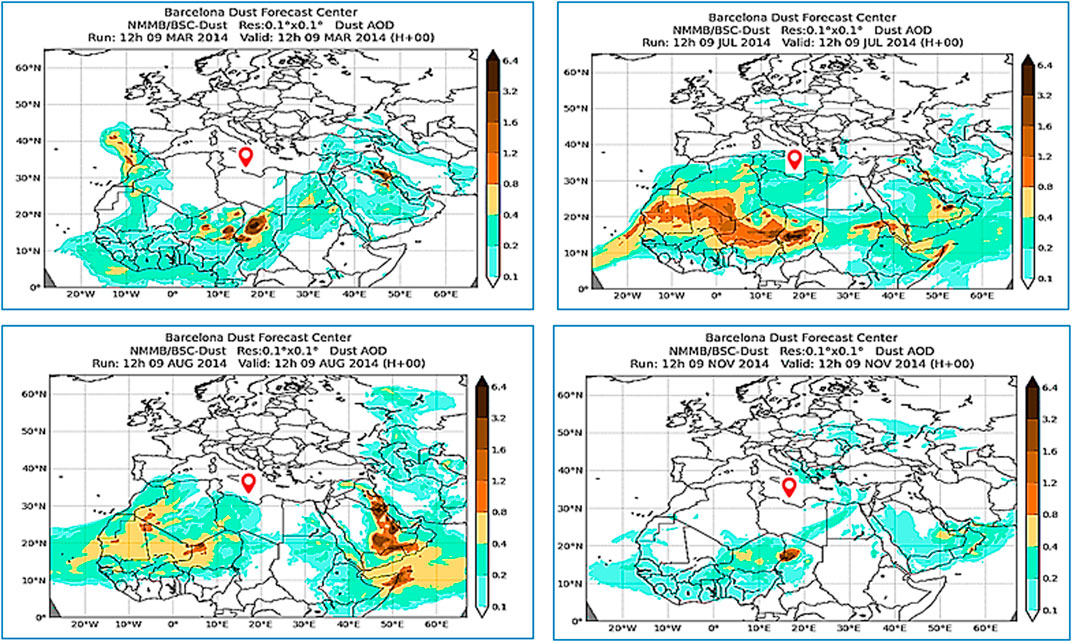
FIGURE 6. Optical depths of aerosols in the selected representative months.
3.3.3 Model validation
The NMMB/BSC was validated by comparing its outputs with observations of a base station (IMS-METU-ERDEMLI) in Turkey. Consistently, the NMMB/BSC dust model generated lower aerosol optical depth (AOD) and lower dust optical depth (DOD) in the selected months. Despite the underestimations of AOD and DOD by the model, the evaluation of the model’s output against the observations of the base station showed interesting similarities in the flow pattern. The flow pattern together with indication of the peak flow at the study area was of interest as it explains the variability in the elemental concentrations and observation of mineral dust episodes at the study area. As can be seen in Figure 7, both the dust model and NRT AERONET recorded their highest AOD and DOD values around 17th of March 13th July and 26th August. In November, however, the highest AOD and DOD were observed around 15th and 17th, respectively.
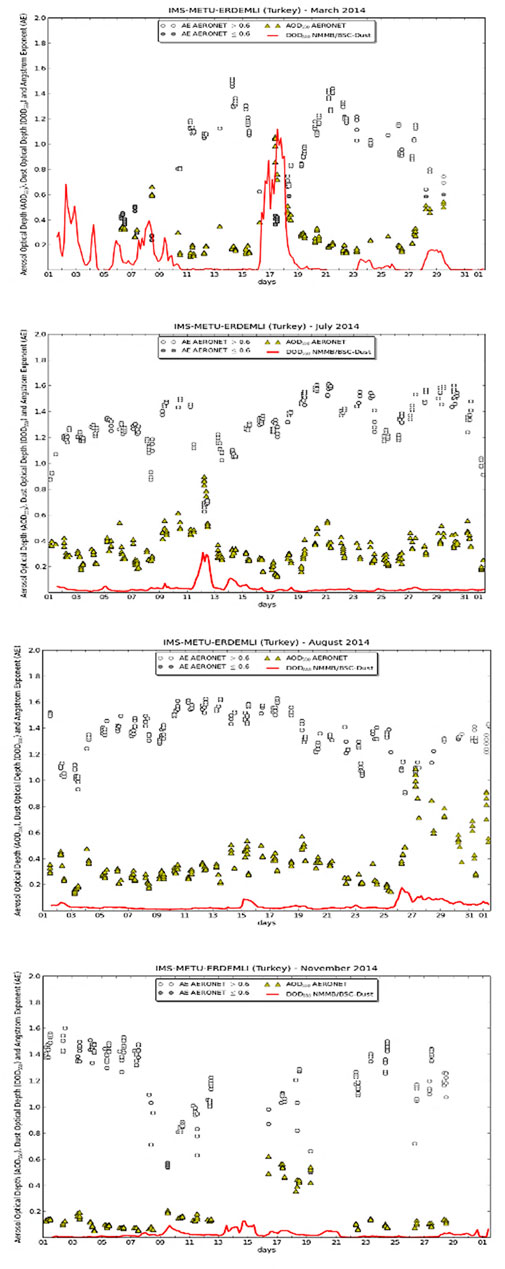
FIGURE 7. IMS-METU-ERDEMLI station observation of Angstrom Exponent (AE); dust optical depth and aerosol optical depth at 550 nm.
3.3.4 Mineral dust episodes
The most important source regions of dust are all in the Northern Hemispheric region including North Africa, the Middle East, the northwestern Indian subcontinent, central Asia, and northwestern China (Engelbrecht et al., 2010). Therefore, to identify an event as a mineral dust episode, at least one of its air mass back trajectories must be traced to one of the above stated regions. In the dust intrusion analysis, it was observed with the support of satellite images and back trajectories of the air masses that, dust flowing to Western Turkey (the location of the receptors) came from the Sahara (North Africa) whereas dust reaching Central Turkey came from the Middle East.
Another approach that can be used to determine a mineral dust episode is to observe the concentrations of mineral dust species like Al, Fe, and Ca relative to dust and non-dust days during the study period. Previous studies have reported using this approach to investigate mineral dust intrusion (Marcazzan et al., 1993; Kim et al., 2000; Borbey-Kiss et al., 2004). To achieve this objective, the sampling period of this study was first grouped as dust and non-dust days. Subsequently, the ratio of dust-to-non-dust days were determined for all the PM species measured. It was assumed that a rainy and/or snowy day constituted a non-dust day whilst a non-rainy and/or non-snowy day constituted a dry/dust day. By this approach, episodes with higher concentrations of dust tracers; high dust-to-non-dust day ratios; and significant difference (sample t-test) between dust and non-dust events were regarded as mineral dust episodes.
Statistical difference between the mean concentration of the PM elements with respect to dust and non-dust days was tested using Mann-Whitney U test. The test results indicate a significant difference in the mean concentrations at 95% confidence level (CL) of mainly crustal and lithophilic elements (Al, Ca, Mg, Fe, K, and Cr) and also “pollution” element (S). As can be seen in Figure 8, dust-to-non-dust day ratios of these elements ranged between 1.5 and 2.5 in both
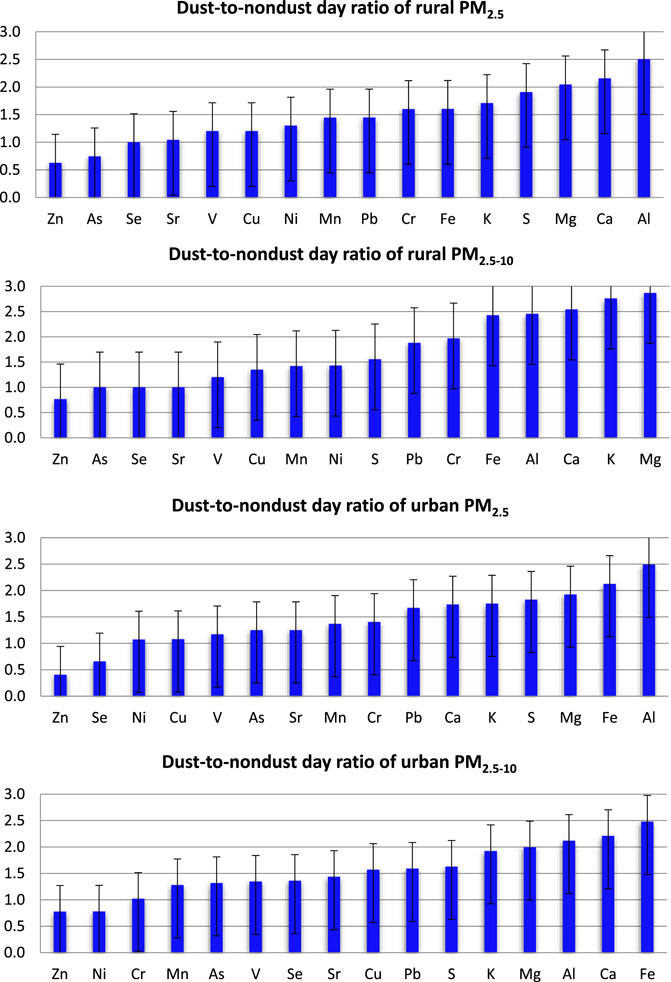
FIGURE 8. Dust-to-non-dust day ratios of PM elements.
5 Conclusion
Dust intrusion phenomenon and its impact on elemental concentrations of size-segregated air particulate matter (
Despite the underestimation of aerosol optical depth and dust optical depth by the model, we found similar pattern between the model’s output and the base station observations. We thus, conclude that, dust flow from the Sahara to western Turkey during the study was not significant to cause high concentrations of mineral dust in the study area. Episodes of mineral dust, however, are indications of dust flow from the Sahara (also supported by satellite images) to the study area.
The highest dust loads were observed in the months of July and August whereas relatively lower loadings were observed in March and November. Highest daily surface dust concentration for Turkey (50 µgm−3—200 µgm−3) was observed in the central and south-west of the country in the month of March, corresponding with the peak period of Saharan dust transport to the Eastern Mediterranean. Also, high concentrations of dust tracers, high dust-to-non-dust day ratios of Al, Fe, Ca and Mg signified mineral dust episodes and hence, Saharan dust intrusion.
Dry deposition flux of PM elements in the fine and coarse modes were estimated to investigate the relationship between flux variation and elemental concentration in different environmental conditions. The results indicated high and significant dry deposition flux of crustal and lithophilic species (Al, Ca, and Fe) as well as fossil combustion specie (S) in the two PM modes across the two monitoring stations. In terms of PM mode variation, deposition flux was found to be higher in the coarse mode than in the fine mode and this was attributed to local meteorology and local pollution sources. Pollution sources such as combustion from coal-fueled thermal power plants, traffic, and other industrial activities across the study areas caused enrichment of the pollution driven elements and hence the high deposition fluxes estimated for these elements.
Data availability statement
The original contributions presented in the study are included in the article/supplementary material, further inquiries can be directed to the corresponding author.
Ethics statement
Authors adhered strictly to the ethics and rules governing scientific research in conducting this study; study was performed in accordance with the principles of the Declaration of Helsinki.
Author contributions
All authors contributed to the study conception and design. Material preparation, data collection and analysis were performed by all authors. The first draft of the manuscript was written by AD whilst all authors reviewed, commented and made inputs in original version of the manuscript. All authors read and approved the final manuscript.
Conflict of interest
The authors declare that the research was conducted in the absence of any commercial or financial relationships that could be construed as a potential conflict of interest.
Publisher’s note
All claims expressed in this article are solely those of the authors and do not necessarily represent those of their affiliated organizations, or those of the publisher, the editors and the reviewers. Any product that may be evaluated in this article, or claim that may be made by its manufacturer, is not guaranteed or endorsed by the publisher.
References
Alpert, P., and Ziv, B. (1989). The sharav cyclone: Observations and some theoretical considerations. Jour. Geophys. Res. 94, 18495. doi:10.1029/jd094id15p18495
Basart, S., Pay, M. T., Jorba, O., Perez, C., Jimenez-Guerrero, P., Schulz, M., et al. (2012). Aerosols in the CALIOPE air quality modelling system: Evaluation and analysis of PM levels, optical depths and chemical composition over Europe. Atmos. Chem. Phys. 12, 3363–3392. doi:10.5194/acp-12-3363-2012
Borbély-Kiss, I., Kiss, Á. Z., Koltay, E., Szabó, G., and Bozó, L. (2004). Saharan dust episodes in Hungarian aerosol: Elemental signatures and transport trajectories. J. Aerosol Sci. 35 (10), 1205–1224. doi:10.1016/j.jaerosci.2004.05.001
Cakmur, R. V., Miller, R. L., Geogdzhayev, J., Ginoux, P., Koch, D., et al. (2006). Constraining the magnitude of the global dust cycle by minimizing the difference between a model and observations. J. Geophys. Res. 111, D06207. doi:10.1029/2005jd005791
Chen, H., Luo, Z., Jiang, J., Zhou, D., Lu, M., Fang, M., et al. (2015). Effects of simultaneous acoustic and electric fields on removal of fi ne particles emitted from coal combustion. Powder Technol. 281, 12–19. doi:10.1016/j.powtec.2015.04.049
Chin, M., Diehl, T., Ginoux, P., and Malm, W. (2007). Intercontinental transport of pollution and dust aerosols: Implications for regional air quality. Atmos. Chem. Phys. 7, 5501–5517. doi:10.5194/acp-7-5501-2007
Dall’Osto, M., Querol, X., Amato, F., Karanasiou, A., Lucarelli, F., Nava, S., et al. (2013). Hourly elemental concentrations in PM&lt;sub&gt;2.5&lt;/sub&gt; aerosols sampled simultaneously at urban background and road site during SAPUSS – diurnal variations and PMF receptor modelling. Atmos. Chem. Phys. 13, 4375–4392. doi:10.5194/acp-13-4375-2013
Duan, L., Song, J., Xu, Y., Li, X., and Zhang, Y. (2010). The distribution, enrichment and source of potential harmful elements in surface sediments of Bohai Bay, North China. J. Hazard. Mat. 183, 155–164. doi:10.1016/j.jhazmat.2010.07.005
Duce, R. A., Liss, P. S., Merrill, J. T., Atlas, E. L., Buat-Menard, P., Hicks, B. B., et al. (1991). The atmospheric input of trace species to the world ocean. Glob. Biogeochem. Cy. 5, 193–259. doi:10.1029/91GB01778
Engelstaedter, S., Tegen, I., and Washington, R. (2006). North african dust emissions and transport. Earth-Science Rev. 79 (1-2), 73–100. doi:10.1016/j.earscirev.2006.06.004
Fang, G. C. (1992). “A Study of mass size distributions and particle deposition velocities in ambient air,” Ph.D. Thesis (Chicago, Illinois: Illinois Institute of Technology), 220.
Fang, G. C., Wu, Y. S., Lee, W. J., Chou, T. Y., and Lin, I. C. (2007a). Ambient air particulates, metallic elements, dry deposition and concentrations at Taichung Airport, Taiwan. Atmos. Res. 84, 280–289. doi:10.1016/j.atmosres.2006.08.006
Fang, G. C., Wu, Y. S., Chang, S. Y., Lin, J., and Lin, J. G. (2007b). Overall dry deposition velocities of trace elements measured at harbor and traffic site in central Taiwan. Chemosphere 67, 966–974. doi:10.1016/j.chemosphere.2006.10.068
François, L. J., and Legrand, M. (2003). Mineral dust sources in the surroundings of the north Indian ocean. Geophys. Res. Lett. 30, 1016690. doi:10.1029/2002gl016690
Furimsky, E. (2000). Characterization of trace element emissions from coal combustion by equilibrium calculations. Fuel process Technol. 63, 29–44. doi:10.1016/s0378-3820(99)00067-3
Gaga, E. O., Dawood, A. M. A., Lucarelli, F., Arı, A., Can, E., Arı, E. P., et al. (2022). Comparative elemental characterization of atmospheric fine and coarse PM samples by PIXE and ICP-ms/MS: Results from a one-year measurement campaign in a coal-powered thermal power plant city. J. Anal. Atomic Spectrom. 37, 2701–2712. doi:10.1039/d2ja00251e
Ganor, E. (1991). The composition of clay minerals transported to Israel as indicators of Saharan dust emission. Atmos. Environ. Part a-General Top. 25, 2657–2664. doi:10.1016/0960-1686(91)90195-d
Ge, J., Huang, J., Xu, C., Qi, Y., and Liu, H. (2014). Characteristics of taklimakan dust emission and distribution: A satellite and reanalysis field perspective. J. Geophys. Res. Atmos. 119 (20), 11772–11783. doi:10.1002/2014JD022280
GESAMP (1989). Group of experts on scientific aspects of marine pollution working group 14, the atmospheric input of trace species to the world ocean. Rep. Stud. 38, 111.
Gkikas, A., Obiso, V., García-Pando, C. P., Jorba, O., Hatzianastassiou, N., Vendrell, L., et al. (2018). Direct radiative effects during intense Mediterranean desert dust outbreaks. Atmos. Chem. Phys. 18, 8757–8787. doi:10.5194/acp-18-8757-2018
Grantz, D. A., Garner, J. H. B., and Johnson, D. W. (2003). Ecological effects of particulate matter. Environ. Int. 29, 213–239. doi:10.1016/S0160-4120(02)00181-2
Gyan, K., Henry, W., Lacaille, S., Laloo, A., Lamsee-Ebanks, C., McKay, S., et al. (2005). African dust clouds are associated with increased paediatric asthma accident and emergency admissions on the Caribbean Island of Trinidad. Int. J. Biometeorol. 49, 371–376. doi:10.1007/s00484-005-0257-3
Harrison, R., Duncan, L., Moorcroft, S., and Laxen, K. (2012). Processes affecting concentrations of fine particulate matter (PM2.5) in the UK atmosphere Atmos. Environ 46, 115–124. doi:10.1016/j.atmosenv.2011.10.028
Haustein, K., Perez, C., Baldasano, J. M., Jorba, O., Basart, S., Miller, R. L., et al. (2012). Atmospheric dust modeling from meso to global scales with the online NMMB/BSC-dust model - Part 2: Experimental campaigns in northern Africa. Atmos. Chem. Phys. 12, 2933–2958. doi:10.5194/acp-12-2933-2012
Haustein, K., Perez, C., Baldasano, J. M., Muller, D., Tesche, M., Schladitz, A., et al. (2009). Regional dust model performance during SAMUM 2006. Geophys. Res. Lett. 36, L03812. doi:10.1029/2008gl036463
Herut, B., Nimmo, M., Medway, A., Chester, R., and Krom, M. D. (2001). Dry atmospheric inputs of trace metals at the mediterranean coast of Israel (SE mediterranean): Sources and fluxes. Atmos. Environ. 35, 803–813. doi:10.1016/s1352-2310(00)00216-8
Hovmand, M. F., Kemp, K., Kystol, J., Johnsen, I., Riis-Nielsen, T., and Pacyna, J. M. (2008). Atmospheric heavy metal deposition accumulated in rural forest soils of southern Scandinavia. Environ. Pollut. 155, 537–541. doi:10.1016/j.envpol.2008.01.047
Injuk, J., Van Grieken, R., and de Leeuw, G. (1998). Deposition of atmospheric trace elements into the north sea: Coastal, ship, platform measurements and model predictions. Atmos. Environ. 32, 3011–3025.
Jiménez, E., Linares, C., Martinez, D., and Díaz, J. (2010). Role of Saharan dust in the relationship between particulate matter and short-term daily mortality among the elderly in Madrid (Spain). Sci. Total Environ. 408, 5729–5736. doi:10.1016/j.scitotenv.2010.08.049
Jiries, A., Ei-Hasan, T., and Manasrah, W. (2002). Qualitative evaluation of the mineralogical and chemical composition of dry deposition in the central and southern highlands of Jordan. Chemosphere 48, 933–938. doi:10.1016/s0045-6535(02)00177-7
Karanasiou, A., Moreno, N., Moreno, T., Viana, M., de Leeuw, F., and Querol, X. (2012). Health effects from Sahara dust episodes in Europe: Literature review and research gaps. Environ. Int. 47, 107–114. doi:10.1016/j.envint.2012.06.012
Kim, E., Kalman, D., and Larson, T. (2000). Dry deposition of large, airborne particles onto a surrogate surface. Amsterdam, Netherlands: Atmospheric Environment.
Lestari, P., Oskouie, A. K., and Noll, K. E. (2003). Size distribution and dry deposition of particulate mass, sulfate and nitrate in an urban area. Amsterdam, Netherlands: Atmospheric Environment.
Lin, J. J., Noll, K. E., and Holsen, T. M. (1994). Dry deposition velocities as a function of particle size in the ambient atmosphere. Netherlands: Aerosol Science and Technology.
Lucarelli, F., Barrera, V., Calzolai, G., Chiari, M., Nava, S., Giannoni, M., et al. (2015). Study of air pollution in the proximity of a waste incinerator. Nucl. Instrum. Methods Phys. Res. B 363, 112–118. doi:10.1016/j.nimb.2015.08.015
Lucarelli, F., Nava, S., Calzolai, G., Chiari, M., Udisti, R., and Marino, F. (2011). Is PIXE still a useful technique for the analysis of atmospheric aerosols? LABEC Exp. 40, 162–167. doi:10.1002/xrs.1312
Maenhaut, W. (2015). Present role of PIXE in atmospheric aerosol research. Sect. B Beam Interact. Mater. Atoms 363, 86–91. doi:10.1016/j.nimb.2015.07.043
Mallone, S., Stafoggia, M., Faustini, A., Gobbi, G. P., Marconi, A., and Forastiere, F. (2011). Saharan dust and associations between particulate matter and daily mortality in Rome, Italy. Environ. Health Perspect. 119, 1409–1414. doi:10.1289/ehp.1003026
Marcazzan, G. M., Bonelli, P., Della Bella, E., Fumagalli, A., Ricci, R., and Pellegrini, U. (1993). Study of regional and long-range transport in an Alpine station by PIXE analysis of aerosol particles. Nucl. Instrum. Methods Phys. Res. B 75, 312–316. doi:10.1016/0168-583x(93)95666-s
Pan, Y. P., and Wang, Y. S. (2014). Atmospheric wet and dry deposition of trace elements at ten sites in Northern China Atmos. Chem. Phys. Discuss. 14, 20647–20676. doi:10.5194/acpd-14-20647-2014
Pausata, F. S. R., Gaetani, M., Messori, G., Berg, A., De Souza, D. M., Sage, R. F., et al. (2020). The greening of the Sahara: Past changes and future implications. One Earth 2 (3), 235–250. doi:10.1016/j.oneear.2020.03.002
Pay, M. T., Piot, M., Jorba, O., Gasso´, S., Gonc¸alves, M., Basart, S., et al. (2010). A full year evaluation of the CALIOPE-EU air quality modeling system over Europe for 2004. Atmos. Environ. 44, 3322–3342. doi:10.1016/j.atmosenv.2010.05.040
Pedro, A., Pereira, P., Lopes, W. A., Carvalho, L. S., da Rocha, G. O., Bahia, N. C., et al. (2007). Atmospheric concentrations and dry deposition fluxes of particulate trace metals in Salvador, Bahia, Brazil. Atmos. Environ. 41, 7837–7850. doi:10.1016/j.atmosenv.2007.06.013
Perez, C., Haustein, K., Janjic, Z., Jorba, O., Huneeus, N., Baldasano, J. M., et al. (2011). Atmospheric dust modeling from meso to global scales with the online NMMB/BSC-Dust model – Part 1: Model description, annual simulations and evaluation. Atmos. Chem. Phys. 11, 13001–13027. doi:10.5194/acp-11-13001-2011
Prasad, A. K., and Singh, R. P. (2007). Changes in aerosol parameters during major dust storm events (2001-2005) over the indo-gangetic plains using AERONET and MODIS data. J. Geophys. Res. Atmos. 112, D09208. doi:10.1029/2006jd007778
Prospero, J. M. (1990). “Mineral aerosol transport to the north atlantic and north pacific. The impact of african and asian sources,” in The long range atmospheric transport of natural and contaminant substances. Editor A. H. Knap (Boston, Mass: Kluwer), 59–86.
Prospero, J. M., Nees, R. T., and Uematsu, M. (1987). Depositionra teo f particulatea ndd issolved aluminum derived from Saharan dust in precipitation at Miami, Florida. J. Geophys, Res. 92 (14), 14723–14731. doi:10.1029/jd092id12p14723
Qu, C. S., Ma, Z. W., Yang, J., Liu, Y., Bi, J., and Huang, L. (2012). Human exposure pathways of heavy metals in a lead-zinc mining area, Jiangsu Province, China. PLoS One 7 (11), 46793–46803. doi:10.1371/journal.pone.0046793
Rodríguez, S., Querol, X., Alastuey, A., Kallos, G., and Kakakliagou, O. (2001). Saharan dust contributions to PM10 and TSP levels in Southern and Eastern Spain. Atmos. Environ. 35, 2433–2447. doi:10.1016/S1352-2310(00)00496-9
Sakata, M., Marumoto, K., Narukawa, M., and Asakura, K. (2006). Regional variations in wet and dry deposition fluxes of trace elements in Japan. Atmos. Environ. 40, 521–531. doi:10.1016/j.atmosenv.2005.09.066
Tasdemir, Y., Kural, C., Cindoruk, S. S., and Vardar, N. (2006). Assessment of trace element concentrations and their estimated dry deposition fluxes in an urban atmosphere. Atmos. Res. 81, 17–35. doi:10.1016/j.atmosres.2005.10.003
Tegen, I., Hollrig, P., Chin, M., Fung, I., Jacob, D., and Penner, J. (1997). Contribution of different aerosol species to the global aerosol extinction optical thickness: Estimates from model results. J. Geophys. Res. 102, 23895–23915. doi:10.1029/97jd01864
Todd, M. C., Bou Karam, D., Cavazos, C., Bouet, C., Heinold, B., Baldasano, J. M., et al. (2008). Quantifying uncertainty in estimates of mineral dust flux: An intercomparison of model performance over the bodele depression, northern Chad. J. Geophys. Res. 113, D24107. doi:10.1029/2008jd010476
USEPA (2020). The national ambient air quality standards for particulate matter. Available at: https://www.epa.gov/naaqs/particulate-matter-pm-air-quality-standards (Accessed May 12, 2022).
Wang, F., Zhao, X., Gerlein-Safdi, C., Mu, Y., Wang, D., and Lu, Q. (2017). Global sources, emissions, transport and deposition of dust and sand and their effects on the climate and environment: A review. Front. Environ. Sci. Eng. 11, 13. doi:10.1007/s11783-017-0904-z
Washington, R., Todd, M., Middleton, N. J., and Goudie, A. S. (2003). Dust-storm source areas determined by the total ozone monitoring spectrometer and surface observations. Ann. Assoc. Am. Geogr. 93 (2), 297–313. doi:10.1111/1467-8306.9302003
Westerlund, K. G. (2001). Metal emissions from stockholm traffics - wear of brake linings, reports from SLB-analysis. Stockholm: Environment and Health Protection Administration in Stockholm.
WHO (2021). Global air quality guidelines. Available at: https://www.who.int/news-room/questions-and-answers/item/who-global-air-quality-guidelines (Accessed May 12, 2022).
Keywords: air particulate matter, air pollution, dust intrusion, trace elements, deposition flux
Citation: Dawood AMA, Akortia E, Alsufyani SJ and Gbeddy G (2023) Impact of dry deposition flux and dust intrusion phenomena on elemental concentrations of air particulate matter. Front. Environ. Sci. 10:1082783. doi: 10.3389/fenvs.2022.1082783
Received: 28 October 2022; Accepted: 09 December 2022;
Published: 10 January 2023.
Edited by:
Jing Wei, University of Maryland, College Park, United StatesReviewed by:
Chen Siyu, Lanzhou University, ChinaCheng Da, University of Maryland, College Park, United States
Copyright © 2023 Dawood, Akortia, Alsufyani and Gbeddy. This is an open-access article distributed under the terms of the Creative Commons Attribution License (CC BY). The use, distribution or reproduction in other forums is permitted, provided the original author(s) and the copyright owner(s) are credited and that the original publication in this journal is cited, in accordance with accepted academic practice. No use, distribution or reproduction is permitted which does not comply with these terms.
*Correspondence: Abdallah M. A. Dawood, ZGF3dXVkMjAwMEBnbWFpbC5jb20=