 Yourui Guo1
 Ruiyu Lin
- 1Fujian Provincial Key Laboratory of Agroecological Processing and Safety Monitoring, College of Life Sciences, Fujian Agriculture and Forestry University, Fuzhou, China
- 2Key Laboratory of Crop Ecology and Molecular Physiology of Fujian Province University, Fujian Agriculture and Forestry University, Fuzhou, China
To comprehensively understand the spatial characteristics and pollution hazards of heavy metals in rice in Fujian Province, the contents of Cd, Hg, As, Pb, Cr, Ni, Cu, and Zn in 260 rice samples were measured based on the field investigation. Their spatial distribution patterns and clustering characteristics were explored by geostatistical methods, and their pollution-health risks were revealed by the pollution index method and exposure evaluation model. The results showed that the average contents of eight heavy metals in rice were below the food safety limits, but the excess rates of As, Cu, and Cd samples reached 33.08%, 22.69%, and 18.85%, respectively. In terms of spatial characteristics, the contents of Cd, Hg, and Ni were higher in the southeastern and northwestern regions, while the contents of As, Cu, and Cr were higher in the southwestern parts of Fujian Province. The hotspots of the corresponding heavy metals were also concentrated in the above-mentioned areas, showing an obvious spatial clustering effect. The pollution risk assessment showed that the single factor pollution index of heavy metals in rice decreased in the order of As (0.536) > Hg (0.505) > Cu (0.421) > Cd (0.378) > Cr (0.318) > Zn (0.304) > Pb (0.286) > Ni (0.116), and the Nemerow comprehensive pollution index was 0.623, which was generally at a safe level with low pollution risk. Furthermore, the non-carcinogenic risk index of heavy metals for adults and children were 3.558 and 6.014, and the carcinogenic risk index were 0.0050 and 0.0084, respectively, with extremely serious health hazards. In contrast, the health damage of heavy metals was higher in children than that in adults, with As and Cd in rice as the pivotal elements. Therefore, attention should be paid to the future monitoring and agricultural management of heavy metal pollution in rice in the region.
1 Introduction
At present, the global climate continues to deteriorate, resulting in excessive carbon emissions, heavy metal pollution and other serious threats to human life and modern civilization (Ma et al., 2022a; Zhang C. L et al., 2022). Improper human activities may be the main cause of this situation, not only the excessive carbon emissions that may occur during the operation of commercial buildings in metropolises (Xiang et al., 2022), but also massive amounts of greenhouse gases emissions from agricultural activities such as rice production. In order to cope with this dilemma, achieving carbon neutral has become hot issues in current research, for example, the operational carbon transformation of commercial buildings in large cities (Ma et al., 2022b), and “low-carbon rice” planting programs both have been proved to be effective in some degree by practiced (Rattanawan et al., 2021; Li et al., 2021). With the influences of various sources such as industrial emissions, agricultural inputs, and traffic exhaust deposition, heavy metal contamination in the agricultural environment cannot be ignored, which threatens the safe production of food crops (Zou et al., 2021; Wang et al., 2022). Rice, one of the staple foods for the population of China and even the world, contamination has been increasing in recent years (Xiang et al., 2021). For example, the sampling results of commercial rice in China in 2002 indicated that the excess rates of Pb, Cd, Hg, and As in rice samples reached 28.4%, 10.3%, 3.4%, and 2.8%, respectively (Cheng et al., 2005). In southern China, such as Zhejiang, Hunan, and Guangdong, the contents of As, Cd, and Cu in rice collected from contaminated farmland usually exceed the corresponding maximum permissible limits (Chen et al., 2018a; Chen et al., 2018b; Zheng et al., 2020). Heavy metals such as cadmium (Cd), Mercury (Hg), arsenic (As), lead (Pb), chromium (Cr), nickel (Ni), copper (Cu), and zinc (Zn) have obvious biological toxicity, while Cd, As, Cr and Ni also have the possibility of carcinogenicity, which have been identified as priority control elements by the U.S. Environmental Protection Agency (USEPA, 2011). Previous studies have shown that, compared with environmental media such as soil, water, and atmosphere, rice consumption led to greater exposure to heavy metals and higher harm to human health (He et al., 2019; Sanaei et al., 2021). Therefore, it is of great significance to understand the pollution status of heavy metals in rice and evaluate its potential risk.
Geostatistics, based on a large number of samples, determines its spatial distribution pattern and correlation through the analysis of the frequency distribution or mean and variance relations of the sample nature values and their corresponding rules, which has been widely used in environmental scientific research (Kumar et al., 2007). Geostatistical analysis technology could effectively characterize the spatial characteristics of heavy metal pollution in a specific region. Most previous studies have explored the spatial patterns of heavy metals in crops through semivariogram and spatial interpolation methods (Ran et al., 2016; Zhang et al., 2019; Zou et al., 2021). For example, a study found that the contents of Cd, Cu, Pb, and Zn in rice were relatively high in the Northwestern part of Wenling, Zhejiang (Zhao et al., 2010). Meanwhile, spatial autocorrelation analysis has also been widely applied to the study of the agglomeration effect of heavy metal pollution, which could effectively identify clusters and outliers within a region (Mirzaei et al., 2014; Hu et al., 2021). Another study using the local Moran’s I index found significant high-high clustering of soil As, Cu, Cd, and Cr in the Eastern part of Hunan (Li et al., 2018). However, to the best of our knowledge, there are still relatively few reports of heavy metal pollution hotspots in rice. Furthermore, the combined application of the pollution index method and exposure evaluation model was relatively mature in the risk assessment process, which could provide information on various aspects of environmental pollution and health hazards (Hu et al., 2017; Chen et al., 2018c; Lü et al., 2022). For instance, a relevant study has shown that the local Cd-Pb complex pollution risk in rice was serious and As, Cd, and Cu were the main contributors to the non-carcinogenic risk of residents in the Dongting Lake area (Tang et al., 2019). Considering the uncertainty of heavy metal contents and specific individual differences, more and more studies analyze the health risks of different populations based on age and gender, which will make the results more accurate and comparable (Minh et al., 2012; Ma et al., 2018).
Fujian Province is one of the important crop-production regions in southern China, with a vast rice cultivation area and a high rice consumption level. Recently, the problem of heavy metal contamination in farmland soil in Fujian Province has apparent (Huang et al., 2018; Lin et al., 2021), but the rice pollution is still unclear. Therefore, the purpose of this study was to: 1) analyze the heavy metal content of rice in Fujian Province; 2) explore the spatial characteristics of heavy metals; 3) assess the potential risk of heavy metal accumulation; 4) To evaluate the health risks in Fujian Province. The purpose of this study was to evaluate the overall rice quality in Fujian Province and provide a reference for rice management and control in the region through heavy metal pollution analysis and health risk analysis in rice.
2 Materials and methods
2.1 Study area
The study area (23°33′-28°20′N, 115°50′-120°40′E) is located in the southeast coast of China with a total land area of about 1.24 × 10⁵ km2, a high northwest and low southeast terrain, and a wide area of mountains and hills (Figure 1). The region has a subtropical marine monsoon climate, with an annual average temperature of 17°C–21°C and average precipitation of 1,400–2000 mm. The area of agricultural land in Fujian is about 1.09 × 10⁷ ha, with red soil and yellow soil as the main soil types. The density of the river network is 0.1 km/km2, and the irrigation water is sufficient. Rice is an important food crop in Fujian, and most of the local population also relies on rice as their main food (Kang et al., 2020). Additionally, Fujian is located in the Pacific Rim metallogenic belt, rich in mineral resources, petrochemical industry, machinery industry development scale, and developed transportation network.
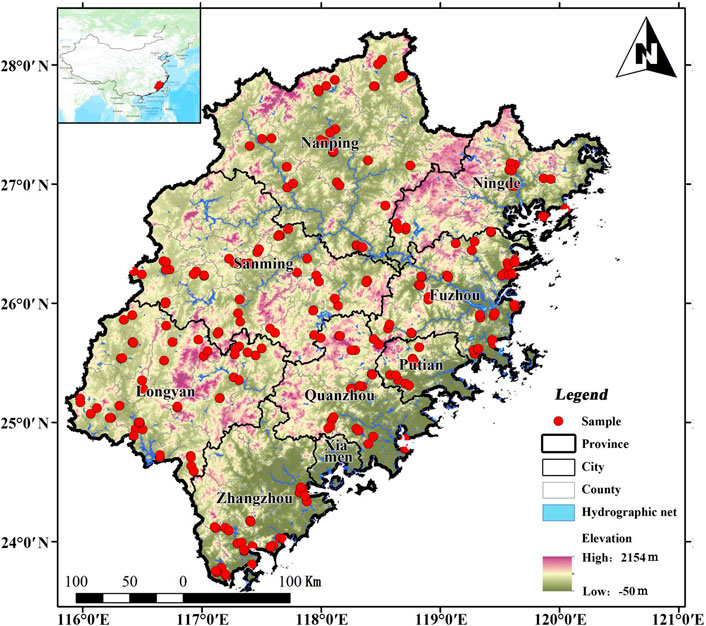
FIGURE 1. Study area and location of sampling points.
2.2 Sample collection and chemical analysis
Based on the distribution of farmland in the study area, a total of 260 rice samples with a minimum mass of 1 kg were collected in the year 2015 and 2016, and the geographical coordinates of the sampling points were recorded by GPS. Their distribution positions are shown in Figure 1.
The collected rice samples were inactivated (105°C) and dried (75°C) to constant weight. After that, they were shelled to make brown rice, which was ground with an agate mortar and passed through a 100-mesh nylon sieve. 0.5 g of the rice powder was taken and digested by HClO4-HNO3. The obtained digested solution was filtered by a 0.22 μm aqueous membrane, sealed, and then indicated the sample number (Lü et al., 2021). The contents of Cd, Pb, Cr, Ni, Cu, and Zn in each sample were determined by inductively coupled plasma mass spectrometry (ICP-MS), and the contents of Hg and As were determined by atomic fluorescence spectrometry (AFS). In this study, the reagents used were guaranteed reagents (GR), the quality control was carried out by standard materials and blank samples, and the recoveries were between 80% and 110%. The detection limits for Cd, Hg, As, Pb, Cr, Ni, Cu, and Zn were 0.0005, 0.0003, 0.0005, 0.001, 0.002, 0.001, 0.025, and 0.217 mg/kg, respectively.
2.3 Spatial variability analysis
Semivariogram and Ordinary Kriging (OK) are important tools for exploring the spatial structure characteristics of regionalized variables and implementing numerical simulations (Zhao et al., 2010). Spherical, exponential, Gaussian, and linear models are often used to fit semivariograms, and parameters such as nugget value and sill value are set to ensure optimal linear unbiased estimation of spatial interpolation (Goovaerts, 1997). The semivariogram is calculated as follows:
where r(h) is the semivariogram at a lag distance h, N(h) is the number of pairs of sample points separated by the h, Z (xi) and Z (xi + h) are the values of the Z at the xi and xi + h location, respectively.
2.4 Spatial autocorrelation analysis
The local Moran’s I index could be used to judge the spatial autocorrelation characteristics of the variables, and then to distinguish the spatial association by identifying spatial clusters and outliers (Anselin, 1995). When the value of Moran’s I is more than 0, it means that the data presents a spatial positive correlation, and the greater the value, the more obvious the spatial correlation. When the value of Moran’s I is less than 0, it means that the data presents spatial negative correlation, and the less the value, the greater the spatial difference. When the value of Moran’s I is equal 0, the spatial distribution is random (Nguyen, 2018; Tao and Wu, 2018).Its results include five types: high-high cluster (HH), low-low cluster (LL), high-low outlier (HL), low-high outlier (LH), and not significant (NS), among which “HH” is also called “hotspot”, “LL” called “coldspot” (Li et al., 2014). The local Moran’s I index is calculated as follows:
where Ii is the local Moran’s I index at the location I, Zi and Zj are the values of the variable Z at the i and j (j≠i),
2.5 Pollution risk assessment
The “National Standards of Food Safety - Limits of Contaminants in Food (GB 2762-2017)” (NHCPRC, 2017) was used as the pollution evaluation standard. The single factor pollution index (SFPI) and the Nemerow comprehensive pollution index (NCPI) were used to evaluate the degree of contamination risk of heavy metals in rice (Zhang S. F et al., 2022), which are calculated as follows:
where Pi is the SFPI value of heavy metal i, Ci is the content of i, Si is the standard evaluation value of i, PN is the NCPI value, Pave and Pmax are the average and the maximum value of the SFPI. In this study, Pi < 1.0, and Pi ≥ 1.0 indicate that the element is safe, and excessive, respectively (Zhang S. F et al., 2022). PN ≤ 0.7, 0.7 < PN ≤ 1.0, 1.0 < PN ≤ 2.0, 2.0 < PN ≤ 3.0, and PN > 3.0 indicate that the element is clean, precautionary, slightly polluted, moderately polluted, and heavily polluted, respectively (Xiang et al., 2019).
2.6 Health risk assessment
The exposure evaluation model was applied to assess the potential health risks for the adult and the child from rice consumption (USEPA, 2011). According to whether heavy metals are carcinogens, they could be assessed from two aspects: non-carcinogenic risk and carcinogenic risk. Among them, the exposure was expressed as the average dietary intake (ADI), the non-carcinogenic risks were expressed as the target hazard quotient (THQ) and the hazard index (HI), the carcinogenic risks were expressed as the cancer risk index (CR) and the total cancer risk index (TCR) (He et al., 2019). Their calculation formulas are as follows:
Where ADI is the average dietary intake, C is the content of heavy metal, IR is the rice intake rate, BW is the average body weight, EF is the exposure frequency, ED is the exposure duration, AT is the averaging exposure time. RfD is the oral reference dose, with Cd, Hg, As, Pb, Cr, Ni, Cu, and Zn were 0.001, 0.0007, 0.0003, 0.0037, 1.5, 0.02, 0.04, and 0.3 mg/kg/d, respectively (USEPA, 2013). SF is the carcinogenicity slope factor, with Cd, As, Cr, and Ni being 6.1, 1.5, 0.5, and 0.84, respectively (WHO, 2011). When THQ (HI) ≤ 1.0, it means there is no risk; and when THQ (HI) > 1.0, it means there is a non-carcinogenic risk. When CR (TCR) ≤ 1.0 × 10⁻⁶, it means there is no risk; when 1.0 × 10⁻⁶ < CR (TCR) ≤ 1.0 × 10⁻⁴, it means that the risk is acceptable; and when CR (TCR) > 1.0 × 10⁻⁴, it means that there is a serious carcinogenic risk (USEPA, 2011). The meaning and value of each parameter in the model were shown in Table 1.
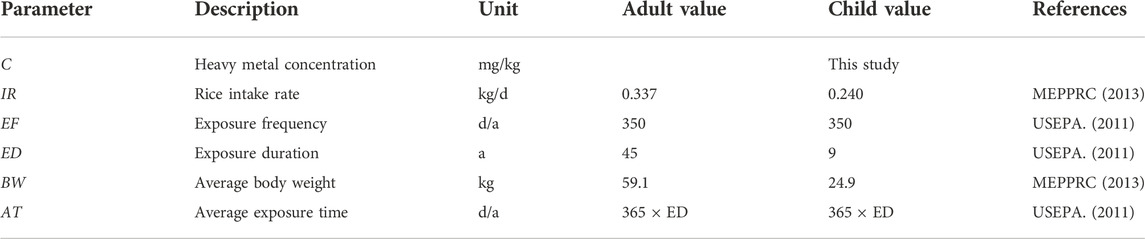
TABLE 1. Parameter values of health risk assessment model.
2.7 Data analysis
The descriptive statistical analysis, normality test, and correlation analysis were proceed by software of SPSS 19 and Excel 2019. The semivariogram was calculated by GS + 9.0, and the local Moran’s I index was calculated by GeoDa 1.14. The spatial interpolation and mapping were performed by ArcGIS 10.6, and other plots were made by Origin 9.0 and Python 3.6.
3 Results
3.1 Content of heavy metals in rice
3.1.1 Descriptive statistical analysis
The content ranges of Cd, Hg, As, Pb, Cr, Ni, Cu, and Zn in rice were 0.000-0.684, 0.002-0.063, 0.008-0.302, 0.001-0.897, 0.013-0.884, 0.019-1.727, 0.042-12.672, and 1.170-26.616 mg/kg, and the average values were 0.076, 0.010, 0.107, 0.057, 0.318, 0.116, 4.209, and 15.190 mg/kg, respectively (Table 2). Compared with the national standard (GB 2762-2017), the average contents of eight heavy metals were lower than the corresponding standard limit values. However, the maximum contents of Cd, Hg, As, Pb, Ni, and Cu in rice were 3.42, 3.15, 1.51, 4.49, 1.73, and 1.27 times the standard values, respectively. And the excess rates of Cd, As and Cu reached 8.85%, 33.08%, and 22.69%, respectively, which accumulated in rice to some extent (Table 2).
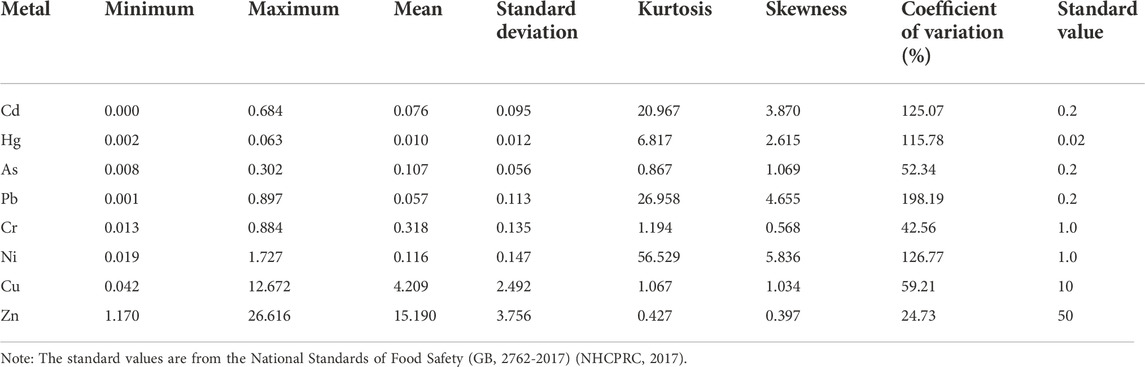
TABLE 2. Descriptive statistics of heavy metal content in rice (mg/kg).
The coefficients of variation (CV) values of heavy metal contents in rice were Pb (198.19%) > Ni (126.77%) > Cd (125.07%) > Hg (115.78%) > Cu (59.21%) > As (52.34%) > Cr (42.56%) > Zn (24.73%) (Table 2). Among them, the CV values of Cd, Hg, Pb, and Ni were greater than 1.0, which had extensive variability. The rest of the metals (As, Cr, Cu, Zn) had moderate variability (0.1 < CV < 1.0) (Table 2).
3.1.2 Correlation analysis
The Cd content was significantly correlated with Hg, As, Ni, and Zn content (p < 0.01), and As content was significantly correlated with Cu content (p < 0.01) (Figure 2). Meanwhile, Zn content was significantly correlated with Hg, Ni content (p < 0.01), and Cr content was significantly correlated with Ni content (p < 0.01). Among them, the correlation coefficient between Cr and Ni was the largest (0.32), followed by Zn and Hg, Ni, both reached 0.27 (Figure 2).
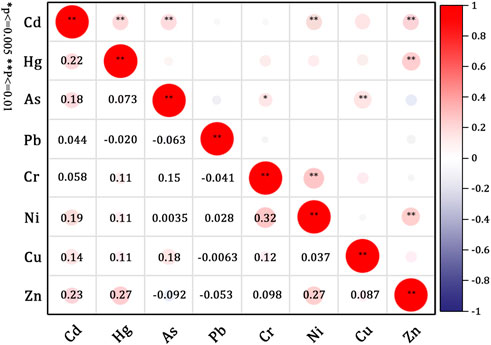
FIGURE 2. Correlation analysis of heavy metal content in rice.
3.2 Spatial variation characteristics of heavy metals in rice
3.2.1 Spatial structure
The semivariogram models of most heavy metal contents (except for Cd) in rice fitted well, and their coefficients of determination (R2) were all greater than 0.80 (Table 3). The semivariograms of Cd and As were fitted by the linear models, Hg, Cr, Cu, and Zn were fitted by the exponential models, and Pb and Ni were fitted by the spherical models. The nugget/sill (C0/C0 + C) ratio of Cd, Hg, As, Pb, Cr, Ni, Cu, and Zn in rice were 51.8%, 92.0%, 50.1%, 79.8%, 63.2%, 60.6%, 50.0%, and 50.0%, respectively (Table 3). Among them, the C0/C0 + C ratio of Hg and Pb was greater than 75%, showing a weak autocorrelation, and the rest of the metals had a moderate spatial correlation (25% < ratio <75%). Additionally, the step sizes of heavy metals in rice were As > Cu > Cr > Zn > Cd > Pb > Ni > Hg, with As having the strongest local spatial variability (Table 3).
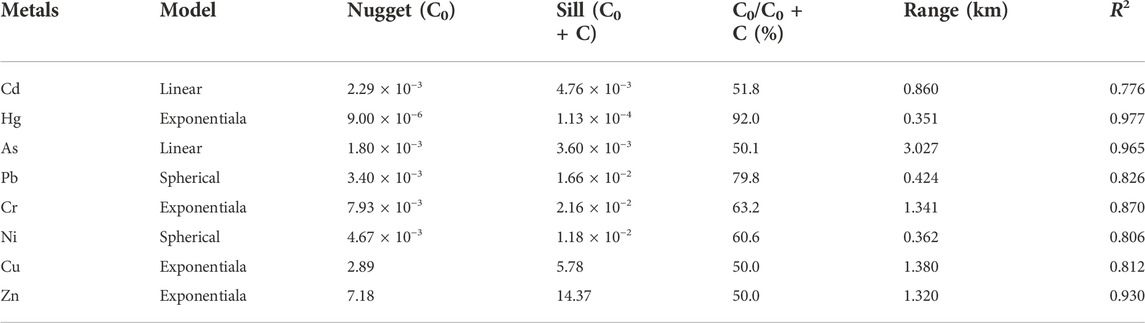
TABLE 3. Semivariogram fitting model and parameters of heavy metals in rice.
3.2.2 Spatial distribution
The Cd, Hg, and Ni in rice showed similar spatial distribution patterns, and the areas with higher content were mainly distributed in the southeast and northwest of Fujian Province (Figure 3). The high content of Cd (0.105–0.684 mg/kg) had the largest spatial coverage in the study area, concentrated in Zhangzhou and Longyan city, while the low content of Cd was mainly in Ningde and Sanming city. The spatial distribution patterns of As, Cr, and Cu in rice were relatively consistent (Figure 3). Their high contents mainly occurred in the southwest of Fujian Province (especially in Longyan city), where the contents of As, Cr, and Cu content reached 0.144-0.302, 0.407-0.884, and 5.895-12.672 mg/kg, respectively. But the low content of As was concentrated in Nanping city, and Cu was mainly in Ningde city. Furthermore, the high content of Pb (0.134-0.897 mg/kg) in rice was mainly located in the northwest of Fujian Province (especially in Nanping city), and the high content of Zn (16.540-19.955 mg/kg) was found in the southeast of Fujian Province (especially Quanzhou city) (Figure 3).
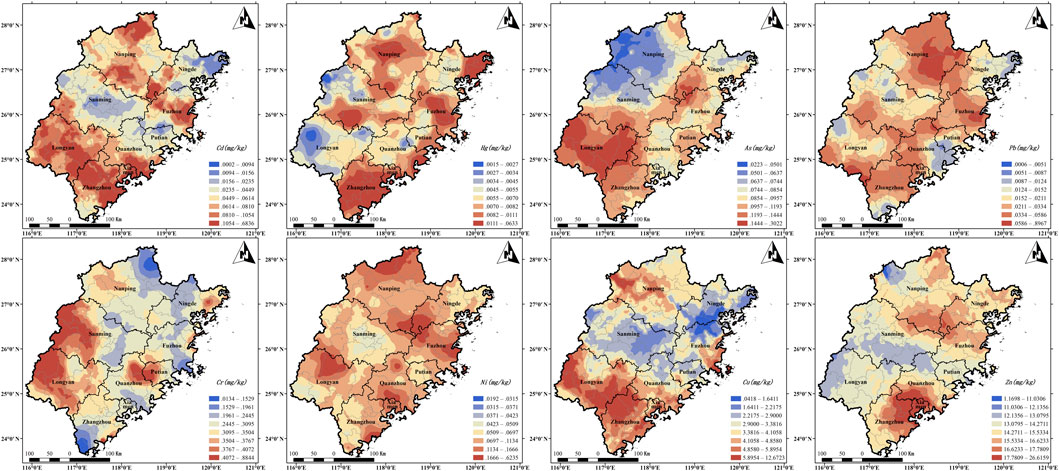
FIGURE 3. Spatial distribution of heavy metals in rice.
3.3 Spatial hotspot and coldspot identification of heavy metals in rice
With regard to the Moran ‘I values in different elements, As, Cr, Cu, Ni and Zn are spatially positively correlated, while Cd, Hg and Pb are spatially negatively correlated, among which Cu is the most correlated. Except for Pb (13.46%), about 20%–40% of heavy metals were in spatial clustering areas (i.e., HH and LL, Table 4), which were the main local spatial pattern types in Fujian Province. The percentage of high-low outliers (HL) and low-high outliers (LH) is relatively low. In Table 4, the percentages of heavy metal hotspots (HH) were Cr (19.23%) > As (14.62%) > Cu (10.77%) > Zn (9.62%) > Hg (8.08%) > Ni (4.62%) > Cd (1.54%) ≈ Pb (1.54%). The distribution of hotspots of Cr, As and Cu in rice was more significant in the study area.
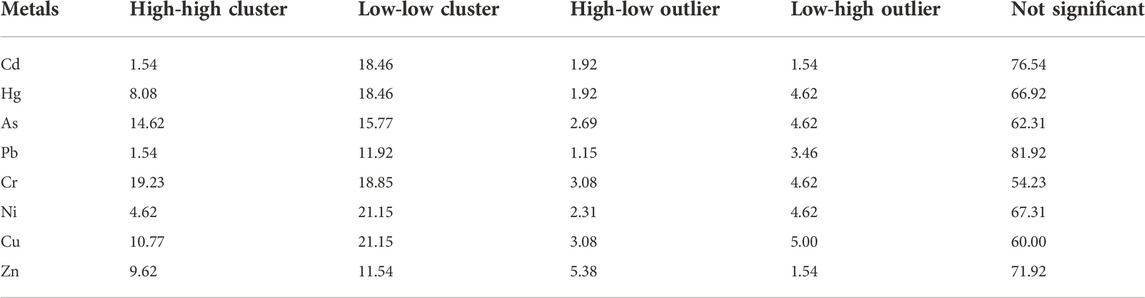
TABLE 4. Percentage of local spatial pattern types of heavy metals in rice (%).
The hotspots of As, Cu, and Cr in rice were mainly distributed in Longyan city, southwest of Fujian Province (Figure 4). There were also sporadic Cr hotspots in Putian city, while their coldspots appeared in the northern region (Nanping, Ningde, and Sanming city). The hotspots of Zn and Hg in rice were concentrated in Zhangzhou city, and some hotspots of Zn and Hg appeared in Quanzhou and Nanping city, respectively (Figure 4). The coldspots of Zn and Hg were located in Longyan and Sanming city. In addition, the hotspots of Ni and Cd in rice were mostly in Fuzhou and Zhangzhou city, while coldspots of Cd, Ni, and Pb were observed in Sanming and Putian cities (Figure 4).
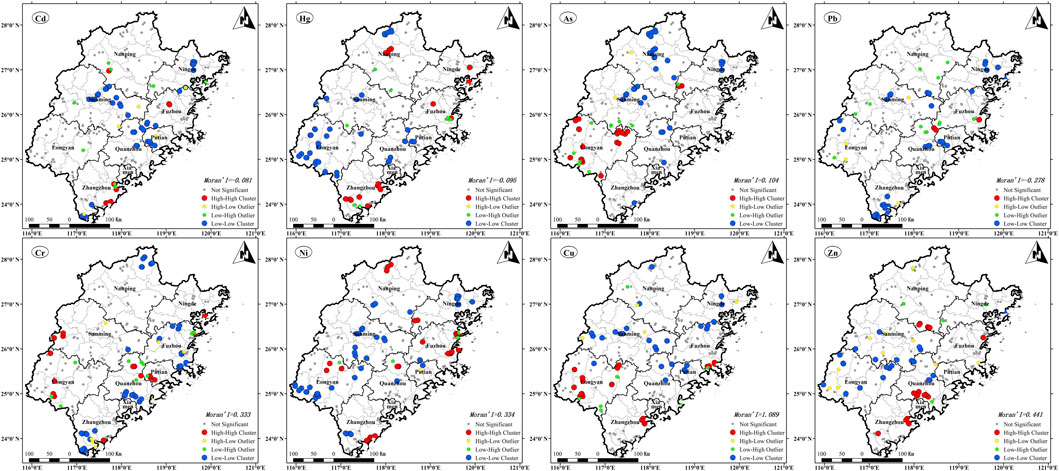
FIGURE 4. Spatial clustering of heavy metals in rice and distribution of outliers.
3.4 Pollution risk assessment of heavy metals in rice
3.4.1 Single pollution risk
The average SFPI values of heavy metals in rice were As (0.536) > Hg (0.505) > Cu (0.421) > Cd (0.378) > Cr (0.318) > Zn (0.304) > Pb (0.286) > Ni (0.116), which were all less than 1.0 (Table 5). The proportions of As, Cu, Hg, Cd, and Pb in rice samples exceeding the standard were about 33.08%, 22.69%, 18.85%, 18.85%, and 13.08%, respectively. There were As and Cu had the highest pollution risk. Additionally, the maximum SFPI values of Cd, Hg, As, Pb, Cr, Ni, and Cu were about 5.70, 5.28, 2.52, 7.47, 1.47, 2.88, and 2.11 times the threshold at 0.6, respectively (Table 5). The residual risk of heavy metals (except Zn) in rice was higher in local areas of Fujian Province.
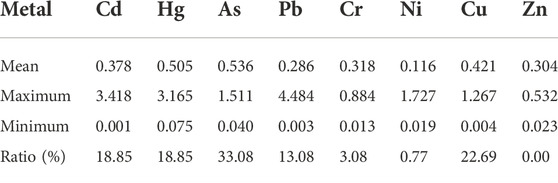
TABLE 5. Single factor pollution index of heavy metals in rice.
3.4.2 Comprehensive pollution risk
The average NCPI value of heavy metals in rice in Fujian Province was 0.623, which belonged to a safe level (PN ≤ 0.7). There were the heavily polluted (n = 2) rice samples only accounted for 0.77% of the total number of samples, concentrated in the northern part of Quanzhou city (Figure 5). About 3.46% and 9.62% of the rice samples were moderately polluted (n = 9) and slightly polluted (n = 25). Overall, the comprehensive pollution of rice accounted for more than 13.85%, with As contributing the highest. In addition, the average NCPI values of heavy metals in the cities were Zhangzhou (1.096) > Longyan (0.822) > Putian (0.658) > Nanping (0.642) > Ningde (0.633) > Fuzhou (0.621) > Quanzhou (0.619) > Sanming (0.536). Among them, Zhangzhou city was slightly polluted, Longyan city was precautionary, and other cities were clean.
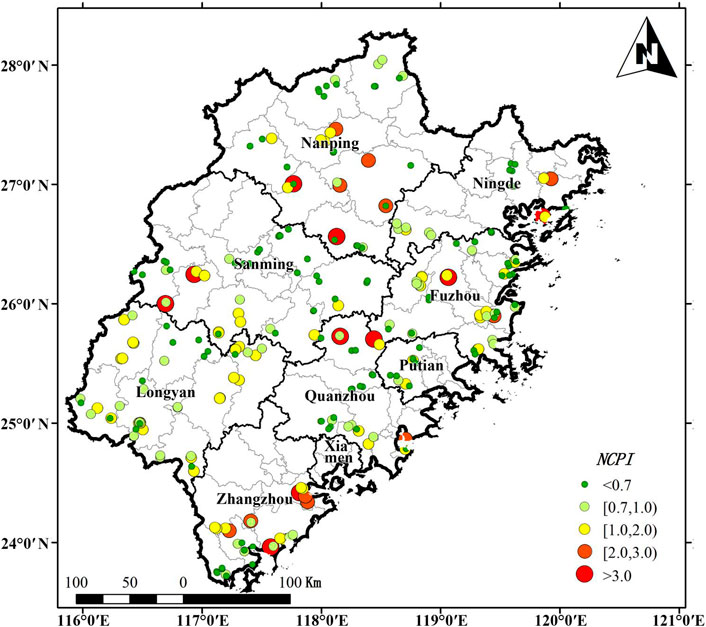
FIGURE 5. Distribution of comprehensive pollution index of heavy metals in rice.
3.5 Health risk assessment of heavy metals in rice
3.5.1 Non-carcinogenic risk
For the single risk, the average THQ values for adult were As (2.035) > Cu (0.600) > Cd (0.431) > Zn (0.289) > Pb (0.088) > Hg (0.082) > Ni (0.032) > Cr (0.001), and the average THQ values of child were As (3.440) > Cu (1.014) > Cd (0.729) > Zn (0.488) > Pb (0.149) > Hg (0.139) > Ni (0.054) > Cr (0.002) (Figure 6). The average THQ values of As for adult and that of As and Cu for child were all greater than 1.0, which had certain toxic effects.
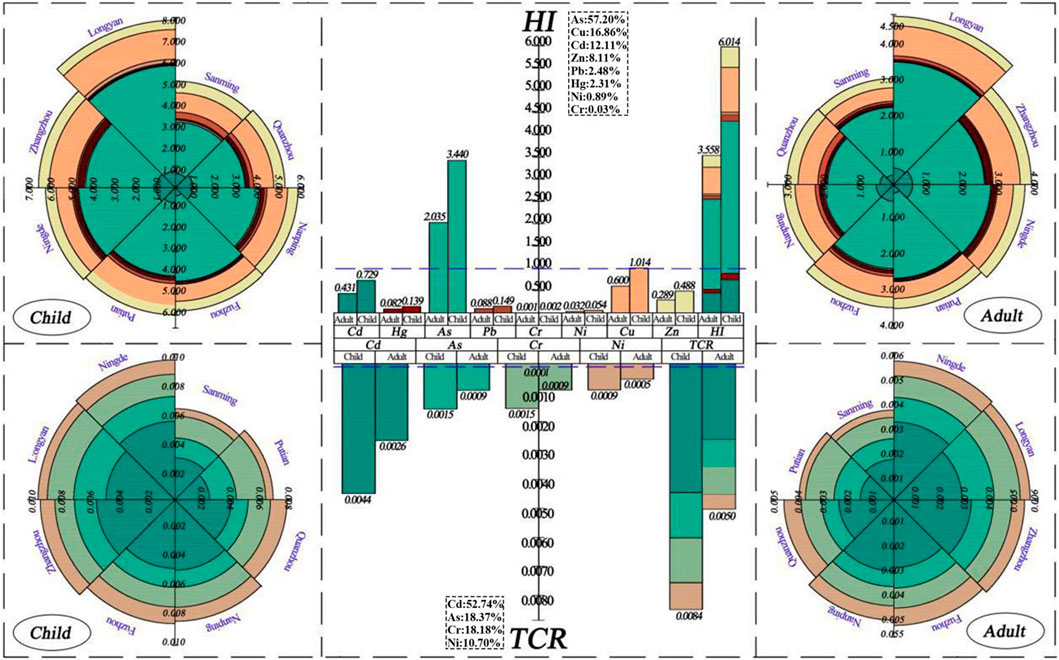
FIGURE 6. Health risk index of heavy metals in rice.
For the comprehensive risk, the average HI values for the adult and the child were 3.558 and 6.014, respectively, which showed that heavy metals in rice might have a potential non-carcinogenic risk (HI > 1.0). The contribution rate of As to HI was the largest (57.20%), followed by Cu (16.86%) (Figure 6). Furthermore, the average HI values of heavy metals in the cities were Longyan (adult: 4.682, child: 7.914) > Zhangzhou (adult: 3.825, child: 6.466) > Ningde (adult: 3.642, child: 6.156) > Putian (adult: 3.451, child: 5.833) > Fuzhou (adult: 3.420, child: 5.781) > Nanping (adult: 3.052, child: 5.160) > Quanzhou (adult: 2.968, child: 5.016) > Sanming (adult: 2.954, child: 4.993) (Figure 6). There were certain differences in the non-carcinogenic risk among cities in Fujian Province, but all showed that the risk value for the child was greater than that of the adult.
3.5.2 Carcinogenic risk
For the single risk, the average CR values for adult were Cd (0.0026) > As (0.0009) ≈ Cr (0.0009) > Ni (0.0005), and average CR values for child were Cd (0.0044) > As (0.0015) ≈ Cr (0.0015) > Ni (0.0009) (Figure 6). The average CR values of the above elements were higher than 1.0 × 10⁻⁴, which exceeded the tolerable carcinogenic risk level of the human body (Lü et al., 2022).
For the comprehensive risk, the average TCR values for the adult and the child were 0.0050 and 0.0084, respectively, which showed that heavy metals in rice had a serious carcinogenic risk (TCR >1.0 × 10⁻⁴). The contribution rate of Cd to TCR was the largest (52.74%), and that of Ni was the smallest (10.70%) (Figure 6). Additionally, the average TCR values of heavy metals in the cities were Longyan (adult: 0.0057, child: 0.0096) ≈ Ningde (adult: 0.0057, child: 0.0096) > Zhangzhou (adult: 0.0054, child: 0.0092) > Fuzhou (adult: 0.0052, child: 0.0088) > Nanping (adult: 0.0050, child: 0.0084) > Quanzhou (adult: 0.0046, child: 0.0078) > Putian (adult: 0.0039, child: 0.0066) > Sanming (adult: 0.0037, child: 0.0063) (Figure 6). The average TCR values were about 37-96 times that of 1.0 × 10⁻⁴, and the carcinogenic risk for the child was higher than that of the adult.
4 Discussion
4.1 Pollution status and quality safety of heavy metals in rice
The quality and safety of rice in Fujian Province were relatively good, and the degree of heavy metal pollution was low. The results of this study showed that the average contents of the eight heavy metals investigated were lower than the national standards (GB 2762-2017) (NHCPRC, 2017). Compared with the international standards of contaminants in plants/crops, the average contents of metals, such as Cd, As, Pb, Cr, Cu, and Zn, were also relatively low in this study (FAO, 2015; WHO, 1996).
The extent of heavy metal pollution in rice varied in most regions, especially As, Cu and Cd. Compared with the previous results of heavy metals in rice, the contents of rice As and Cd in Fujian Province were lower than the average levels of As (0.125 mg/kg) and Cd (0.116 mg/kg) in China by 14.40% and 34.48%, respectively (Mu et al., 2019). The average contents of As and Cd were also lower than those of the corresponding metals in the Yangtze River Delta region (As: 0.29 mg/kg, Cd: 0.08 mg/kg), while the average content of Cu was about 1.41 times higher than that of Cu in the above region (2.98 mg/kg) (Hu et al., 2019). Meanwhile, the average Cu content in this study area far exceeded the Cu contamination status in rice in Hunan Province (3.69 mg/kg) reported by Du et al. (2018). Compared with our previous long-term monitoring results of rice pollution in the Western Fujian region (Cd: 0.068 mg/kg, As: 0.157 mg/kg, Cu: 6.647 mg/kg), the average content of Cd in rice in Fujian Province was higher by 11.76%, while As and Cu were relatively lower (Lü et al., 2022).
4.2 Spatial pattern and influencing factors of heavy metals in rice
The more correlated heavy metals showed similar spatial characteristics. The results showed that the significant correlations (p < 0.01, Figure 2) among the Cd, Hg, Ni, and Zn contents in rice, whose high contents were mainly located in southeastern Fujian Province (Figure 3), and their hotspots were spatially concentrated in Zhangzhou city (Figure 4). Significant correlations (p < 0.05) also existed between the As, Cu, and Cr contents in rice in this study, especially their high contents and hotspots were more located in the southwestern Fujian Province (Longyan city). Previous studies showed that the similar spatial patterns of heavy metals at a regional scale usually reflect the possible existence of the same pollution sources (Deng et al., 2020; Shi et al., 2020). This implied that Cd, Hg, Ni, and Zn in rice in Fujian Province might be influenced by the same pollution sources, while As, Cu, and Cr were likely to have homologous sources. In contrast, the correlation coefficients were smaller between Pb and the other seven heavy metals in rice (Figure 2). There were significant differences in distributions in their spatial patterns and hotspots as well (Figures 3, 4). Another study also found that the areas with clustered hotspots had a higher likelihood of heavy metal pollution from specific point sources such as industrial emissions and mineral mining (Han et al., 2022).
Heavy metals in rice in Fujian Province were significantly affected by anthropogenic activities. The results showed that the CV values of Cd, Hg, Pb, and Ni in rice belonged to an extensive variability (CV > 1.0, Table 2). This indicated that the distribution of the above elements in rice was uneven across the region and was affected by external disturbances such as human activities (He et al., 2019). In others, the nugget/sill ratio could better represent the spatial variation degree of regionalized factors. Generally, when the ratio is greater than 75%, it means that random variation dominates with the weak spatial association, which is mainly controlled by human factors; when the ratio is less than 25%, structural variation dominates and the influence of natural factors is greater (Gao et al., 2016; Lü et al., 2021). In this study, the nugget/sill ratio of Hg and Pb in rice was greater than 75% (Table 3), showing a stronger role of human activities in the distribution of Hg and Pb. Combined with the spatial characteristics of heavy metals and field investigations, it was found that the contents of Cd, Hg, and Ni in rice were higher in southeastern Fujian Province, where the number of industrial enterprises was high. It was speculated that the heavy metal contents might be closely related to the wastewater and exhaust gas emissions caused by industrial production. This was similar to the findings in Zhejiang and Jiangsu Provinces by Yang et al. (2020). The contents of As, Cu, and Cr in rice were higher in the southwestern Fujian Provinces, which could be related to the excessive application of chemical fertilizers and pesticides in the local agricultural production process. Wan et al. (2020) also showed that the As and Cu contents in rice were significantly affected by the input of agrochemicals in Changsha city, Hunan Province. In this study, the higher CV value and higher nugget/sill ratio of rice Pb indicated the strong influence of anthropogenic activities. The higher content of Pb in the Northwestern region, overlapped greatly with the spatial distribution of the mineral belt in Fujian Province, and there might be more Influenced by mining and smelting activities (Zhang et al., 2018). However, the CV value and nugget/sill ratio of rice Zn were relatively low, and its high-content area (Southeast) was more consistent with the area of high Zn content in soil in Fujian Province reported by Huang et al. (2018). So, Zn was more affected by soil environmental conditions.
4.3 Risk assessment and management recommendations of heavy metals in rice
The pollution risk of heavy metals in rice in Fujian Province was low. The results showed that the average NCPI value was lower than 0.7, the average SFPI values of eight heavy metals were all lower than 1.0, and the exceeding rates of samples except As and Cu were all lower than 20% (Table 5). Referring to the Agricultural Industry Standard (NY/T 398-2000), it was also found that the residual degree of heavy metals in rice was relatively small, and only As, Cu, and Cd accumulated significantly (SFPI >0.6). The average SFPI values of As and Cu in rice in this study area were closed to those in the southwest Karst area (As: 0.520, Cu: 0.412) (Zhang C. L et al., 2022), but the samples from Fujian Province had a lower excess rate. Compared with the pollution index of heavy metals in rice in the Yangtze River Delta region (As: 0.66, Cu: 0.52, Cd: 0.32), the average SFPI values of As and Cu in rice in Fujian Province were slightly lower, while the average SFPI value of Cd was about 1.18 times that of the above region (Mao et al., 2019). The average SFPI values of As and Cd were also lower than the results of the study in Hunan Province (As: 1.21, Cd: 1.42), but the average SFPI value of Cu was higher than that of Hunan Province by 109.14% (Zhang et al., 2020). In addition, for each city, the comprehensive pollution risk of rice in southern Fujian Province (Longyan: 0.822, Zhangzhou: 1.096) was higher (Figure 5), which was consistent with the investigation results in southwestern Fujian Province by Lin et al. (2021). To sum up, chemical remediation and bioremediation measures should be carried out in time in heavily polluted areas to reduce the bioavailability of heavy metals in rice. For example, adding passivation materials (biochar, quicklime) or microbial inoculants to the soil according to local conditions (Zhao and Wang, 2020; Wang et al., 2021). The agronomic practice was also one of the effective measures to control the enrichment ability of pollutants (like As, Cd). Some studies showed that the voltaic effect could control the remobilization of Cd in paddy soil during drainage (Huang et al., 2021). Controlling the amount of phosphorus fertilizer in farmland and changing the application of silicon fertilizer could also reduce the content of As in rice (Kumarathilaka et al., 2019). Other, for rice safe production, rice could be grown in coldspots areas to reduce the potential risk of heavy metal pollution.
Consumption of polluted rice has caused significantly non-carcinogenic and carcinogenic hazards to the human body. The results showed that the average HI values of the adult and the child in Fujian Province were greater than 1.0, and the average TCR values were far more than 1.0 × 10⁻⁴ (Figure 6). This was consistent with the conclusion of the fifth residents’ dietary survey that there was a comprehensive risk of Cd, As, and Pb in Fujian Province (Wei et al., 2019). Compared with the existing risk studies, the average HI and TCR values of the child in Fujian Province were 1.07 and 10.05 times higher than those in the Yangtze River Delta region (HI: 5.62, TCR: 0.0008), and the values of the adult were 8.59 and 19.61 times the local risk index (HI: 0.414, TCR: 0.0003) (Hu et al., 2017). The average HI values of the child and the adult were 5.05 and 3.87 times higher than those in Lengshuikeng, Jiangxi Province (child: 1.19, adult: 0.92), and the average TCR values were 1.65 and 1.32 times those of the corresponding population (child: 0.0051, adult: 0.0038) (Huang et al., 2020). For the contribution rates of each element, As and Cd in rice were the key factors for high HI values and high TCR values, which was consistent with the previous research reports by He et al. (2019) and Zeng et al. (2015). This study indicated that the health risks of the child were higher than that of the adult in Fujian Province. Similarly, some studies also showed that children tend to suffer more health hazards than adults from environments threatened by heavy metals (Hu et al., 2020; Baruah et al., 2021). This should be attributable to specific behavioral (e.g., arbitrary grasping) and physiological characteristics (e.g., lower body weight, weaker organ toxicity tolerance) of the child (Kumarathilaka et al., 2019; Guo et al., 2021). Therefore, residents (especially the child) should pay attention to reasonably controlling rice daily intake and adjust the dietary structure in time. Another study found that As was concentrated in the husk, bran, and germ of brown rice, the As content in milled rice was less than 30% of that in brown rice (Wu et al., 2019). Milling also reduced the Cd content in rice by about 23.5% (Gu et al., 2020), which may be one of the effective measures to reduce the health risk of rice.
5 Conclusion
So far the average concentration of heavy metals in rice is lower than the national standard, which presents the rice quality was positive in general. However the heavry metal in rice such as Cd (18.85%), Hg (18.85%), As (33.08%), and Cu (22.69%) are accumulated in farmland in Fujian Province. Affected by human activities, the spatial distributions and hotspots agglomeration characteristics of heavy metals were significant by spatial analysis. Specifically, As, Cu, and Cr pollution in rice were mainly located in the southwest areas, while Cd, Hg, and Ni were distributed in the southeast and northwest regions. Moreover, the comprehensive pollution risk of heavy metals in rice was lower with NCPI value is 0.623. However, there is a high potential for non-carcinogenic and carcinogenic hazards to adults (HI: 3.558; TCR: 0.0050) and children (HI: 6.014; TCR: 0.0084) from consuming contaminated rice, with mainly contributed by As and Cd. Therefore, green remediation should be carried out as soon as possible to prevent and control heavy metal pollution in rice.
Data availability statement
The datasets presented in this article are not readily available because The data is not allowed to open to the public. Requests to access the datasets should be directed to ruiyulin121011@sina.com.
Author contributions
YG: Conceptualization, writing—original draft, methodology, visualization, formal analysis; MH: Data curation, formal analysis; WY: Methodology, data curation; YH: Formal analysis, visualizationg; QX: Methodology, data curation, visualization; ZX: Methodology, visualization, writing—review and editing; RL: Writing—review and editing, funding acquisition, supervision.
Funding
This work was supported by the Special Program for Basic Research of Science and Technology of MOST, China (2015FY111300), and the National Key Research and Development Program of China (2017YFD0800900).
Conflict of interest
The authors declare that the research was conducted in the absence of any commercial or financial relationships that could be construed as a potential conflict of interest.
Publisher’s note
All claims expressed in this article are solely those of the authors and do not necessarily represent those of their affiliated organizations, or those of the publisher, the editors and the reviewers. Any product that may be evaluated in this article, or claim that may be made by its manufacturer, is not guaranteed or endorsed by the publisher.
References
Anselin, L. (1995). Local indicators of spatial association—LISA. Geogr. Anal. 27, 93–115. doi:10.1111/j.1538-4632.1995.tb00338.x
Baruah, S. G., Ahmed, I., Das, B., Ingtipi, B., Boruah, H., Gupta, S. K., et al. (2021). Heavy metal(loid)s contamination and health risk assessment of soil-rice system in rural and peri-urban areas of lower brahmaputra valley, northeast India. Chemosphere 266, 129150. doi:10.1016/j.chemosphere.2020.129150
Chen, H. P., Tang, Z., Wang, P., and Zhao, F. J. (2018a). Geographical variations of cadmium and arsenic concentrations and arsenic speciation in Chinese rice. Environ. Pollut. 238, 482490–490. doi:10.1016/j.envpol.2018.03.048
Chen, H. P., Yang, X. P., Wang, P., Wang, Z. X., Li, M., and Zhao, F. J. (2018b). Dietary cadmium intake from rice and vegetables and potential health risk: A case study in xiangtan, southern China. Sci. Total Environ. 639, 271–277. doi:10.1016/j.scitotenv.2018.05.050
Cheng, W. D., Yao, H. G., Wu, W., and Zhang, G. P. (2005). Heavy metal pollution and its countermeasures in soil-rice system. J. Agric. Sci. Techol. 7, 51–54. doi:10.3969/j.issn.1008-0864.2005.04.011
ChenL, ., Zhou, S. L., Shi, Y. X., Wang, C. H., Li, B., Li, Y., et al. (2018). Heavy metals in food crops, soil, and water in the Lihe River Watershed of the Taihu Region and their potential health risks when ingested. Sci. Total Environ. 615, 141–149. doi:10.1016/j.scitotenv.2017.09.230
Deng, M. H., Zhu, Y. W., Shao, K., Zhang, Q., Ye, G., and Shen, J. (2020). Metals source apportionment in farmland soil and the prediction of metal transfer in the soil-rice-human chain. J. Environ. Manage. 260, 110092. doi:10.1016/j.jenvman.2020.110092
Du, F., Yang, Z. G., Liu, P., and Wang, L. (2018). Accumulation, translocation, and assessment of heavy metals in the soil-rice systems near a mine-impacted region. Environ. Sci. Pollut. Res. 25, 32221–32230. doi:10.1007/s11356-018-3184-7
FAO (2015). General standard for contaminants and toxins in food and feed (CXS 193-1995). Available at: https://www.scirp.org/reference/referencespapers.aspx?referenceid=2857548. (Accessed Apirl 14,2017).
Gao, Z. Q., Fu, W. J., Zhang, M. J., Zhao, K. L., Tunney, H., and Guan, Y. (2016). Potentially hazardous metals contamination in soil-rice system and it's spatial variation in Shengzhou City, China. J. Geochem. Explor. 167, 62–69. doi:10.1016/j.gexplo.2016.05.006
Goovaerts, P. (1997). Geostatistics for natural resources evaluation. New York: Oxford University Press, 137.
Gu, Y., Wang, P., Zhang, S., Dai, J., Chen, H. P., Lombi, E., et al. (2020). Chemical speciation and distribution of cadmium in rice grain and implications for bioavailability to humans. Environ. Sci. Technol. 54, 12072–12080. doi:10.1021/acs.est.0c03001
Guo, G. H., Wang, Y. T., Zhang, D. G., and Lei, M. (2021). Source-specific ecological and health risks of potentially toxic elements in agricultural soils in Southern Yunnan Province and associated uncertainty analysis. J. Hazard. Mat. 417, 126144. doi:10.1016/j.jhazmat.2021.126144
Han, J. L., Liang, L. C., Zhu, Y. R., Xu, X. H., Wang, L., Shang, L., et al. (2022). Heavy metal(loid)s in farmland soils on the Karst Plateau, Southwest China: An integrated analysis of geochemical baselines, source apportionment, and associated health risk. Land Degrad. Dev. 1, 1689–1703. doi:10.1002/ldr.4257
He, M. J., Shen, H. R., Li, Z. T., Wang, L., Wang, F., Zhao, K., et al. (2019). Ten-year regional monitoring of soil-rice grain contamination by heavy metals with implications for target remediation and food safety. Environ. Pollut. 244, 431–439. doi:10.1016/j.envpol.2018.10.070
Hu, B. F., Jia, X. L., Hu, J., Xu, D. Y., Xia, F., and Li, Y. (2017). Assessment of heavy metal pollution and health risks in the soil-plant-human system in the Yangtze River Delta, China. Int. J. Environ. Res. Public Health 14, 1042. doi:10.3390/ijerph14091042
Hu, B. F., Shao, S., Fu, T. T., Fu, Z. Y., Zhou, Y., Li, Y., et al. (2020). Composite assessment of human health risk from potentially toxic elements through multiple exposure routes: A case study in farmland in an important industrial city in east China. J. Geochem. Explor. 210, 106443. doi:10.1016/j.gexplo.2019.106443
Hu, B. F., Shao, S., Fu, Z. Y., Li, Y., Ni, H., Chen, S., et al. (2019). Identifying heavy metal pollution hot spots in soil-rice systems: A case study in south of Yangtze River Delta, China. Sci. Total Environ. 658, 614–625. doi:10.1016/j.scitotenv.2018.12.150
Hu, B. F., Shao, S., Ni, H., Fu, Z. Y., Huang, M., Chen, Q., et al. (2021). Assessment of potentially toxic element pollution in soils and related health risks in 271 cities across China. Environ. Pollut. 270, 116196. doi:10.1016/j.envpol.2020.116196
Huang, H., Chen, H. P., Kopittke, P. M., Kretzschmar, R., Zhao, F. J., and Wang, P. (2021). The voltaic effect as a novel mechanism controlling the remobilization of cadmium in paddy soils during drainage. Environ. Sci. Technol. 55, 1750–1758. doi:10.1021/acs.est.0c06561
Huang, S., Shao, G. F., Wang, L. Y., Wang, L., and Tang, L. (2018). Distribution and health risk assessment of trace metals in soils in the Golden Triangle of Southern Fujian Province, China. Int. J. Environ. Res. Public Health 16, 97. doi:10.3390/ijerph16010097
Huang, Y. N., Dang, F., Li, M., Zhou, D. M., Song, Y., and Wang, J. B. (2020). Environmental and human health risks from metal exposures nearby a Pb-Zn-Ag mine, China. Sci. Total Environ. 698, 134326. doi:10.1016/j.scitotenv.2019.134326
Kang, Z. M., Wang, S. L., Qin, J. H., Wu, R. Y., and Li, H. (2020). Pollution characteristics and ecological risk assessment of heavy metals in paddy fields of Fujian province, China. Sci. Rep. 10, 12244. doi:10.1038/s41598-020-69165-x
Kumar, A., Maroju, S., and Bhat, A. (2007). Application of ArcGIS geostatistical analyst for interpolating environmental data from observations. Environ. Prog. 26, 220–225. doi:10.1002/ep.10223
Kumarathilaka, P., Seneweera, S., Ok, Y. S., Meharg, A. A., and Bundschuh, J. (2019). Mitigation of arsenic accumulation in rice: An agronomical, physico-chemical, and biological approach–A critical review. Crit. Rev. Environ. Sci. Technol. 50, 31–71. doi:10.1080/10643389.2019.1618691
Li, W. J., Ruiz-Menjivar, J., Zhang, L., and Zhang, J. B. (2021). Climate change perceptions and the adoption of low-carbon agricultural technologies: Evidence from rice production systems in the Yangtze River Basin. Sci. Total Environ. 759, 143554. doi:10.1016/j.scitotenv.2020.143554
Li, W. L., Xu, B. B., Song, Q. J., Liu, X. M., Xu, J., and Brookes, P. C. (2014). The identification of 'hotspots' of heavy metal pollution in soil-rice systems at a regional scale in eastern China. Sci. Total Environ. 472, 407–420. doi:10.1016/j.scitotenv.2013.11.046
Li, X. Z., Zhao, Z. Q., Yuan, Y., and Wang, X. (2018). Heavy metal accumulation and its spatial distribution in agricultural soils: evidence from hunan province, China. RSC Adv. 8, 10665–10672. doi:10.1039/c7ra12435j
Lin, C. Q., Cai, Y. H., Hu, G. R., Yu, R. L., Hao, C. L., and Huang, H. B. (2021). Bioaccessibility and health risks of the heavy metals in soil-rice system of southwest fujian province. Environ. Sci. 42, 359–367. doi:10.13227/j.hjkx.202005247
Lü, Q. X., Xiao, Q. T., Guo, Y. R., Wang, Y. J., Cai, L., You, W., et al. (2022). Pollution monitoring, risk assessment and target remediation of heavy metals in rice from a five-year investigation in Western Fujian region, China. J. Hazard. Mat. 424, 127551. doi:10.1016/j.jhazmat.2021.127551
Lü, Q. X., Xiao, Q. T., Wang, Y. J., Wen, H. H., Han, B., Zheng, X., et al. (2021). Risk assessment and hotspots identification of heavy metals in rice: A case study in longyan of fujian province, China. Chemosphere 270, 128626. doi:10.1016/j.chemosphere.2020.128626
Ma, M. D., Chen, M. X., Feng, W., and Huo, J. W. (2022a). What decarbonized the residential building operation worldwide since the 2000s. Pet. Sci. doi:10.1016/j.petsci.2022.10.016
Ma, M. D., Feng, W., Huo, J. W., and Xiang, X. W. (2022b). Operational carbon transition in the megalopolises’ commercial buildings. Build. Environ. 226, 109705. doi:10.1016/j.buildenv.2022.109705
Ma, W. C., Tai, L. Y., Qiao, Z., Zhong, L., Wang, Z., Fu, K., et al. (2018). Contamination source apportionment and health risk assessment of heavy metals in soil around municipal solid waste incinerator: a case study in north China. Sci. Total Environ. 631, 348–357. doi:10.1016/j.scitotenv.2018.03.011
Mao, C. P., Song, Y. X., Chen, L. X., Ji, J. F., Li, J., Yuan, X., et al. (2019). Human health risks of heavy metals in paddy rice based on transfer characteristics of heavy metals from soil to rice. Catena 175, 339–348. doi:10.1016/j.catena.2018.12.029
MEPPRC (2013). Exposure factors handbook of Chinese population. Beijing: China Environmental Press, p87.
Minh, N. D., Hough, R. L., Nyberg, Y., Vinh, N. C., and Mai, L. B. (2012). Assessing dietary exposure to cadmium in a metal recycling community in vietnam: age and gender aspects. Sci. Total Environ. 416, 164–171. doi:10.1016/j.scitotenv.2011.11.068
Mirzaei, R., Ghorbani, H., Hafezi Moghaddas, N., and Martín, J. A. R. (2014). Ecological risk of heavy metal hotspots in topsoils in the Province of Golestan, Iran. J. Geochem. Explor. 147, 268–276. doi:10.1016/j.gexplo.2014.06.011
Mu, T. T., Wu, T. Z., Zhou, T., Li, Z., Ouyang, Y., Jiang, J., et al. (2019). Geographical variation in arsenic, cadmium, and lead of soils and rice in the major rice producing regions of China. Sci. Total Environ. 677, 373–381. doi:10.1016/j.scitotenv.2019.04.337
Nguyen, T. T. (2018). Juirui bölgesindeki (Gd çin) jeokimyasal anomalilerin ayrilmasinda moran-I ve sağlam İstatistik yöntemlerin kullanilmasi. Bull. Min. Res. Explor. Inst. Turk. 156, 1–10. doi:10.19076/mta.413240
NHCPRC (2017). National standards of food safety. Available at: https://sppt.cfsa.net.cn:8086/db. (Accessed Apirl 14,2017).
Ran, J., Wang, D. J., Wang, C., Zhang, G., and Zhang, H. (2016). Heavy metal contents, distribution, and prediction in a regional soil-wheat system. Sci. Total Environ. 544, 422–431. doi:10.1016/j.scitotenv.2015.11.105
Rattanawan, M. K., Sarocha, D., and Shabbir, H. G. (2021). Development of a low-carbon, healthy and innovative value-added riceberry rice product through life cycle design. Clean. Technol. Environ. Policy 23, 2037–2047. doi:10.1007/s10098-021-02101-3
Sanaei, F., Amin, M. M., Alavijeh, Z. P., Esfahani, R. A., Sadeghi, M., Bandarrig, N. S., et al. (2021). Health risk assessment of potentially toxic elements intake via food crops consumption: Monte Carlo simulation-based probabilistic and heavy metal pollution index. Environ. Sci. Pollut. Res. 28, 1479–1490. doi:10.1007/s11356-020-10450-7
Shi, A., Shao, Y. F., Zhao, K. L., and Fu, W. J. (2020). Long-term effect of E-waste dismantling activities on the heavy metals pollution in paddy soils of southeastern China. Sci. Total Environ. 705, 135971. doi:10.1016/j.scitotenv.2019.135971
Tang, L., Deng, S. H., Tan, D., Long, J. M., and Lei, M. (2019). Heavy metal distribution, translocation, and human health risk assessment in the soil-rice system around Dongting Lake area, China. Environ. Sci. Pollut. Res. 26, 17655–17665. doi:10.1007/s11356-019-05134-w
Tao, Y., and Wu, Y. (2018). Spatial-temporal patterns of national air quality based on Moran'I. J. Nat. Disasters 27, 107–113. doi:10.13577/j.jnd.2018.0513
USEPA (2011). Exposure factors handbook 2011 edition (final report). Available at: https://cfpub.epa.gov/ncea/risk/recordisplay.cfm?deid=236252. (Accessed October 3.2011).
USEPA (2013). Integrated risk information system (IRIS):Assessments. Available at: https://cfpub.epa.gov/ncea/risk/recordisplay.cfm?deid=2776.
Wan, Y. N., Huang, Q. Q., Wang, Q., Yu, Y., Su, D., Qiao, Y., et al. (2020). Accumulation and bioavailability of heavy metals in an acid soil and their uptake by paddy rice under continuous application of chicken and swine manure. J. Hazard. Mat. 384, 121293. doi:10.1016/j.jhazmat.2019.121293
Wang, J. H., Wu, H. H., Wei, W. X., Xu, C. B., Tan, X., Wen, Y., et al. (2022). Health risk assessment of heavy metal(loid)s in the farmland of megalopolis in China by using APCS-MLR and PMF receptor models: Taking Huairou District of Beijing as an example. Sci. Total Environ. 835, 155313. doi:10.1016/j.scitotenv.2022.155313
Wang, Y. J., Zheng, X. Y., He, X. S., Lü, Q. X., Qian, X., Xiao, Q., et al. (2021). Effects of Pseudomonas TCd-1 on rice (Oryza sativa) cadmium uptake, rhizosphere soils enzyme activities and cadmium bioavailability under cadmium contamination. Ecotoxicol. Environ. Saf. 218, 112249. doi:10.1016/j.ecoenv.2021.112249
Wei, J. X., Gao, J. Q., and Cen, K. (2019). Levels of eight heavy metals and health risk assessment considering food consumption by China's residents based on the 5th China total diet study. Sci. Total Environ. 689, 1141–1148. doi:10.1016/j.scitotenv.2019.06.502
WHO (2011). International agency for research on cancer (IARC) monographs on the identification of carcinogenic hazards to humans. Geneva, Switzerland: World Health Organization. Available at: https://monographs.iarc.who.int/agents-classified-by-the-iarc/.
WHO (1996). Permissible limits of heavy metals in soil and plants. Geneva, Switzerland: World Health Organization.
Wu, T. L., Cui, X. D., Cui, P. X., Ata-Ul-Karim, S. T., Sun, Q., Liu, C., et al. (2019). Speciation and location of arsenic and antimony in rice samples around antimony mining area. Environ. Pollut. 252, 1439–1447. doi:10.1016/j.envpol.2019.06.083
Xiang, L., Liu, P. h., Jiang, X. f., and Chen, P. J. (2019). Health risk assessment and spatial distribution characteristics of heavy metal pollution in rice samples from a surrounding hydrometallurgy plant area in No. 721 uranium mining, East China. J. Geochem. Explor. 207, 106360. doi:10.1016/j.gexplo.2019.106360
Xiang, M. T., Li, Y., Yang, J. Y., Lei, K. G., and Li, F. (2021). Heavy metal contamination risk assessment and correlation analysis of heavy metal contents in soil and crops. Environ. Pollut. 278, 116911. doi:10.1016/j.envpol.2021.116911
Xiang, X. W., Ma, M. D., Ma, X., Chen, L. M., Cai, W., Feng, W., et al. (2022). Historical decarbonization of global commercial building operations in the 21st century. Appl. Energy 322, 119401. doi:10.1016/j.apenergy.2022.119401
Yang, S. H., Qu, Y. J., Ma, J., Liu, L. L., Wu, H., Liu, Q., et al. (2020). Comparison of the concentrations, sources, and distributions of heavy metal(loid)s in agricultural soils of two provinces in the Yangtze River Delta, China. Environ. Pollut. 264, 114688. doi:10.1016/j.envpol.2020.114688
Zeng, F. F., Wei, W., Li, M. S., Huang, R. X., Yang, F., and Duan, Y. (2015). Heavy metal contamination in rice-producing soils of Hunan province, China and potential health risks. Int. J. Environ. Res. Public Health 12, 15584–15593. doi:10.3390/ijerph121215005
Zhang, C. L., Zou, X., Yang, H., Liang, J. H., and Zhu, T. (2022). Bioaccumulation and risk assessment of potentially toxic elements in soil-rice system in Karst area, southwest China. Front. Environ. Sci. 10, 232. doi:10.3389/fenvs.2022.866427
Zhang, S. F., Ma, M. D., Xiang, X. W., Cai, W. G., Feng, W., and Ma, Z. (2022). Potential to decarbonize the commercial building operation of the top two emitters by 2060. Resour. Conserv. Recycl. 185, 106481. doi:10.1016/j.resconrec.2022.106481
Zhang, T., Xu, W. X., Lin, X. N., Yan, H. L., Ma, M., and He, Z. (2019). Assessment of heavy metals pollution of soybean grains in North Anhui of China. Sci. Total Environ. 646, 914–922. doi:10.1016/j.scitotenv.2018.07.335
Zhang, X. W., Wei, S., Sun, Q. Q., Wadood, S. A., and Guo, B. (2018). Source identification and spatial distribution of arsenic and heavy metals in agricultural soil around Hunan industrial estate by positive matrix factorization model, principle components analysis and geo statistical analysis. Ecotoxicol. Environ. Saf. 159, 354–362. doi:10.1016/j.ecoenv.2018.04.072
Zhang, Z. X., Zhang, N., Li, H. P., Lu, Y., and Yang, Z. (2020). Potential health risk assessment for inhabitants posed by heavy metals in rice in Zijiang River basin, Hunan Province, China. Environ. Sci. Pollut. Res. 27, 24013–24024. doi:10.1007/s11356-020-08568-9
Zhao, F. J., and Wang, P. (2020). Arsenic and cadmium accumulation in rice and mitigation strategies. Plant Soil 446, 1–21. doi:10.1007/s11104-019-04374-6
Zhao, K. L., Liu, X. M., Xu, J. M., and Selim, H. M. (2010). Heavy metal contaminations in a soil-rice system: identification of spatial dependence in relation to soil properties of paddy fields. J. Hazard. Mat. 181, 778–787. doi:10.1016/j.jhazmat.2010.05.081
Zheng, S. N., Wang, Q., Yuan, Y. Z., and Sun, W. M. (2020). Human health risk assessment of heavy metals in soil and food crops in the Pearl River Delta urban agglomeration of China. Food Chem. x. 316, 126213. doi:10.1016/j.foodchem.2020.126213
Keywords: rice, heavy metal pollution, spatial distribution, hotspots, risk assessment
Citation: Guo Y, Huang M, You W, Cai L, Hong Y, Xiao Q, Zheng X and Lin R (2022) Spatial analysis and risk assessment of heavy metal pollution in rice in Fujian Province, China. Front. Environ. Sci. 10:1082340. doi: 10.3389/fenvs.2022.1082340
Received: 28 October 2022; Accepted: 15 November 2022;
Published: 28 November 2022.
Edited by:
Minda Ma, Lawrence Berkeley National Laboratory, United StatesCopyright © 2022 Guo, Huang, You, Cai, Hong, Xiao, Zheng and Lin. This is an open-access article distributed under the terms of the Creative Commons Attribution License (CC BY). The use, distribution or reproduction in other forums is permitted, provided the original author(s) and the copyright owner(s) are credited and that the original publication in this journal is cited, in accordance with accepted academic practice. No use, distribution or reproduction is permitted which does not comply with these terms.
*Correspondence: Ruiyu Lin, cnVpeXVsaW4xMjEwMTFAc2luYS5jb20=