 Katharine A. Owens
 Puspita Insan Kamil
 Hannington Ochieng
- 1Department of Politics, Economics, and International Studies, University of Hartford, West Hartford, CT, United States
- 2Indonesia Herpetofauna Foundation, Bogor, West Java, Indonesia
- 3Department of Biology, Faculty of Science and Education, Busitema University, Tororo, Uganda
Introduction: Plastic waste in freshwater ecosystems is increasingly recognized as an economic, ecological, and environmental problem with potential health consequences. This article shares the results of a project to train local stakeholders to collect debris in their communities using scientific methods, then share the results with policymakers.
Methods: Workshops were held in Uganda, Indonesia, and the United States in the spring of 2022. This article presents baseline data from collections on the Aturukuku River in Uganda, the Ayung River in Indonesia, and the Connecticut River in the United States as well as survey results measuring participant attitudes, behaviors, and their perceptions around plastic waste and policy. Surveying participants sheds light on the nuances of perception of the problem and policies to combat pollution at each locale.
Results: We found deposited debris at each riverbank location: Aturukuku River, 0.45 pieces/m2 of which 89.4% was plastic; Ayung River, 7.62 pieces/m2 of which 91.1% was plastic, and the Connecticut River 0.29 pieces/m2 of which 63% was plastic. Environmental attitudes and behaviors were comparable among countries. Participants in all three countries expect plastic will be the most frequently found material.
Discussion: In all cases, perceptions about the kind of debris in their communities corresponds well with collection results. Perceptions around policy solutions included a wide range of solutions, though countries differed in whether solutions addressed the source or the symptoms of the problem; solutions focused more on waste management in Uganda and Indonesia.
Introduction
Researchers recognize plastic waste as a threat to water resources (Teuten et al., 2009; Lechner et al., 2014; Jambeck et al., 2015; Baldwin et al., 2016; Alshawafi et al., 2017; Blettler et al., 2017; Cable et al., 2017; Blettler et al., 2018; van Emmerik et al., 2019a; Battulga et al., 2019; Blettler and Wantzen 2019; Castro-Jiménez et al., 2019; Azevedo-Santos et al., 2021). Decades of research on the topic of what was initially called ‘marine debris’ indicates that it has a significant negative impact on ecosystems (Barnes et al., 2009; Teuten et al., 2009; Nkwachukwu et al., 2013; Rochman et al., 2016), wildlife (Ryan 1989; Laist 1997; Kuhn et al., 2015; Reynolds and Ryan 2018), and economies (McIlgorm et al., 2011; Newman et al., 2015). Plastics, often the most frequently found item in cleanups, have been found in human blood (Leslie et al., 2022), meconium and placenta (Braun et al., 2021), and human lung tissue (Amato-Lourenço et al., 2021). While the potential health impacts for humans are poorly understood, it is clear that plastic pollution significantly impacts life on Earth. This research builds knowledge of freshwater macro plastic pollution through first analyses of the Aturukuku River in Uganda, the Ayung River in Indonesia, and the Connecticut River in the United States. These rivers are valuable culturally and socially. In Indonesia, the Ayung River is the longest river on Bali island, which is called “The Island of Gods” because of its high value in religious and cultural matters. This river which flows across the island, holds specific cultural, agricultural, and tourism importance for the locals. The river Aturukuku in Tororo, is one of the few existing small riverine ecosystems in Eastern Uganda, and is currently an important resource supporting local fisheries, harvesting of craft materials, crop irrigation, and livestock rearing by the riparian communities, especially the rural poor and those who are ecosystem dependent. In the United States, the Connecticut river is the New England region’s longest river and notable as an American Heritage River, a designation that recognizes its importance for nature, the economy, agriculture, history, culture, and recreation. Taking an interdisciplinary approach, we seek to better understand debris density at these sites as well as the perceptions of workshop participants around debris and policy.
Why freshwater and macro plastics?
Experts note the relative dearth of studies on freshwater plastic pollution when compared to research on marine environments (Sigler 2014; Blettler et al., 2017; Sruthy and Ramasamy 2017; Vincent and Hoellein 2017; Blettler et al., 2018; Reynolds and Ryan 2018; van Emmerik et al., 2019a; Blettler and Wantzen 2019; van Emmerik et al., 2019b; van Calcar and van Emmerik 2019; van Emmerik and Schwarz 2020; Meijer et al., 2021). Researchers have understood for some time that rivers may serve as a pathway connecting litter from land-based communities to marine environments (Jambeck et al., 2015; Lebreton et al., 2017; Schmidt et al., 2017). But rivers are not simply a mode of transferring debris, they are also deposition sites that hold plastic over years or decades as it degrades (McCormick and Hoellein 2016; Blettler and Wantzen 2019).
Several studies estimate plastics accumulation by combining variables including (high) population density, (lack of) waste infrastructure, and hydrological modeling (e.g., Jambeck et al., 2015; Lebreton et al., 2017; Schmidt et al., 2017). Lebreton et al. (2017) predict that the twenty most-polluting rivers exist in Asia (fifteen rivers: 75%), Africa (three rivers: 15%), and South America (two rivers: 10%). Further investigations of river systems may shed light on the so-called ‘missing’ plastic problem, or the difference between known plastic inputs compared to outputs in the environment (Cózar et al., 2014; Schmidt et al., 2017; Willis et al., 2017). Researchers point to the importance of assessing river debris (in water, sediment, and shorelines) to fully understand debris flows, better justifying these estimates through field observations (Gasperi et al., 2014; Lechner et al., 2014; Blettler and Wantzen 2019; Castro-Jiménez et al., 2019; Mihai et al., 2022). Several scientists recommend research emphasizing coastal regions with high population density (Vince and Hardesty 2017; Jambeck et al., 2018). Blettler et al. (2018) promote research on the world’s most polluted rivers, namely in places that feature both quickly developing economic systems and a lack of waste management. Blettler and Wantzen (2019) suggest a focus on macro debris originating as “mismanaged1 household solid waste;” they note that the scholarly emphasis on micro-plastics is an export from the global North to the global South: scientific imperialism that does not focus on the core local problem (p. 1). Not only is macro debris important to study for its emphasis on local context, Willis et al. (2017) note that land-based interventions at the local level will be more successful at preventing debris from entering the ocean at all. As such, more data on macro debris in freshwater systems is critical to understanding how plastic pollution harms freshwater and marine systems.
River debris studies in Uganda
Sadan and De Kock (2021) write that without intervention, both the production and the consumption of plastic will increase not only in Africa but across the globe in the coming decade. The African rivers included in the top twenty of Lebreton et al.’s (2017) list are the Cross River in Nigeria and Cameroon, the Imo in Nigeria, and the Kwa Ibo, also in Nigeria. Nigeria is the most populous country in Africa (with 225 million inhabitants) and the sixth most populous country worldwide (CIA 2022). The population density of Nigeria was 232 persons per square kilometer in 2021 (World Bank 2022). In comparison, Uganda has far fewer inhabitants (46.2 million) and a comparably high population density (235 individuals per square kilometer) (CIA 2022; World Bank 2022). No rivers in Uganda are included in Lebreton et al.’s (2017) list.
In a systematic literature review, Akindele and Alimba (2021) analyze fifty-nine plastic pollution studies from across the continent of Africa ranging in time from 1987 to 2020. They find that east African countries have the fewest studies while southern Africa has the most (Akindele and Alimba 2021). The majority of the studies (71%) focus on marine or estuarine systems while fewer (29%) center on freshwater habitats (Akindele and Alimba 2021). There are no studies of Ugandan plastic debris in freshwater systems. They call for more research, particularly in East Africa, North Africa, and West Africa (Akindele and Alimba 2021). For an in-depth review on microplastic research on the African continent, see Alimi et al. (2021); for research on both macro and micro plastic in Africa, see Akindele and Alimba (2021).
There are a few studies of microplastic in East Africa, including a study of plastic from the stomachs of Nile perch and Nile tilapia in Lake Victoria (Biginagwa et al., 2016), analysis of microplastic from the surface of Lake Victoria (Egessa et al., 2020b), documentation of ingestion of microplastic by zooplankton on Kenyan coasts (Kosore et al., 2018), and an analysis of microplastic abundance and composition from the surface waters of Kenya’s Lake Naivasha (Migwi et al., 2020). Analyzing micro and macro particles in fish and sediment from Ethiopia’s Lake Ziway, Merga et al. (2020) find plastic ingested by 35% of fish sampled and a median of 30,000 plastic particles/m3 of sediment.
Due to a lack of macro freshwater research in Uganda, this review focuses on macro plastic studies across the African continent. Trawling the seafloor near Morocco, Loulad et al. (2017) found 603 kg of macro debris. Plastic was found in 54% of their trawling stations and made up 34.4% of the total weight of materials found and 83.6% of total number of items counted (Loulad et al., 2017). The most frequently found plastic material were displaced traps for Octopus vulgaris (Loulad et al., 2017). Working in a coastal wetland in Morocco, Alshawafi et al. (2017) found 57% of the macro debris recorded in their study was plastic. The authors attribute the debris to tourism, land-based usage, and commercial fishing (Alshawafi et al., 2017). Madzena and Lasiak (1997) investigate an undeveloped beach in South Africa, finding that plastic make up 83% of the debris by count and 47% by weight. It should be noted that at the time, researchers did not necessarily distinguish between macro and microplastic. Ebere et al. (2019) working on (microplastic and) macro debris research in Nigeria, find a total of 3,487 macro debris items (across five locations of 1,000 m2 each) of which 59% were plastic. Their work indicates a significant relationship between macro-debris and microplastic abundance, suggesting microplastics are formed as macro plastics break down rather than distributed in another way (Ebere et al., 2019). They recommend improved management of waste, increased recycling, and consequences for those engaged in illegal dumping (Ebere et al., 2019). Egessa et al. (2020a) investigate micro-, meso-, and macro plastic in sediments and on shorelines of the northern side of Lake Victoria. They note that rates of accumulation are higher at fish landing beaches compared to recreational beaches and recommend focusing management at these sights (Egessa et al., 2020a). Ngupula et al. (2014) survey 68 stations by trawling in Lake Victoria in 2013, finding 44% (by weight) is multifilament gillnets, 42% monofilament gillnets, 7% longlines and hooks, 4% plastic bags, 2% floats, and 1% clothing; the authors attribute the waste to fishing, human activities, and transportation.
Research on plastic accumulation in African countries at times centers on ruminants ingesting debris—often plastic bags or polythene-causing impaction (Ramaswamy and Sharma 2011; Akinrinmade and Akinrinde 2013). This is sadly a phenomenon across the developing world (Priyanka and Dey 2018). Akinrinmade and Akinrinde (2013) note this impaction may be exacerbated by high numbers of livestock, lack of fodder, and the prevalence of dumping. Through abattoir surveys in northern Nigeria, Remi-Adewumi et al. (2011) find 80.9% of sheep and 19.1% of goats in their sample have foreign material within the rumen in their stomachs, most commonly plastic. Analyzing animals after slaughter at an abattoir in Ethiopia, Abebe and Nuru (2011) report that of 768 sheep and goats (384 each) 6.1% are positive cases of rumen or reticulum impaction, with plastic as the foreign substance in 59.6% of the positive cases.
Wandeka et al. (2022) note the complexities of plastic packaging in Uganda, where it is essential to maintaining quality, particularly for foods. The authors report that from 1994 to 2017 Uganda imported 1.9 million tons of raw and finished plastic (totals for the whole of the continent during this time is 117 million tons) (Wandeka et al., 2022). Akindele and Alimba (2021) concur that the African continent is the destination of many plastics manufactured globally, that they lack waste infrastructure, and that African countries are least studied. A 2018 article by Jambeck et al. names the usual suspects of lack of infrastructure and high population growth rates contributing to this important challenge. Focusing on Kenya, Rayne (2008) describes some of the challenges across Africa, namely lack of waste or sewage infrastructure as well as lobbying from plastics manufacturers to maintain access to plastic bags. In conclusion, the global problem of plastic pollution is significant across the African continent. There are many countries, coastlines, and freshwater systems with little or no data. Overall, studies tend to focus on a few areas and emphasize coastal and microplastic pollution. This research centers on macroplastic in the freshwater environment and shares data from an as yet unstudied river in Uganda: the Aturukuku.
River debris studies in Indonesia
Lebreton et al. (2017) include four river systems in Indonesia in their predictive list of top-twenty most polluting rivers: the Brantas, the Solo, the Serayu and the Progo. All can be found on Java, the most populous island on Earth. Indonesia is the second most populous country in East and Southeast Asia behind China and the fourth most populous country in the world with 277 million inhabitants (CIA 2022). The population density of Indonesia is 147 people per square kilometer (World Bank 2022). The Ayung River, the focus of this study is found on Bali and is not included in Lebreton et al.’s (2017) top twenty list.
Regarded as a ‘hot spot’ for plastic pollution, there are more studies in Indonesia as compared to Uganda, but like the bulk of studies from the African continent, Indonesian studies emphasize microplastics and coastal or marine settings (see Purba et al., 2019 and Vriend et al., 2021 for excellent overviews of studies across Indonesia) instead of macro debris and freshwater systems. As with our Ugandan review, we focus on macroplastic and freshwater analyses.
Scenario-modeling waste distribution patterns throughout Indonesia to guide policy, Sakti et al. (2021) estimate freshwater inputs for various regencies as 0.65–11.9 tons of plastic waste per day (low to high scenarios). The authors recommend using these data to name priority zones for management (Sakti et al., 2021). Surveying a number of points on the Pesanggrahan and Grogol Rivers (Java) using floating booms, Sari et al. (2022) find 74% of the litter in their sample is plastic. The authors calculate roughly 9.9 g of plastic per person discharges per day in the rainy season for these two rivers (Sari et al., 2022). They recommend more studies, effective cleaning, and strategies to prevent litter (Sari et al., 2022). Pamungkas et al. (2021), studying plastic flows in the Citarum River (Java) find an influx of 24,813.7 items per cubic meter, with the most commonly seen material being thin plastic wrap and foamed plastic. Studying visible plastic debris on the shore of the Madura Strait of the Wonorejo River (Java) estuary, Kurniawan and Imron (2019) track debris seasonally, finding accumulation is significantly greater in the rainy season. The researchers note that low-density polyethylene is the most abundant plastic (73.1%) in their dry season samples while polyethylene terephthalate is the most abundant plastic (59.8%) in their rainy season samples (Kurniawan and Imron 2019). They recommend cleanups in the rainy season to maximize efficiency (Kurniawan and Imron 2019). Studying riverbank debris of the Lower Citarum River (Java) Hidayat et al. (2022) sample quadrats of 30 × 30 × 10 cm3 to analyze plastic composition. The researchers find plastic in all samples ranging from 0.7 to 301 g per 9,000 cm3 quadrat and recommend improving management of waste, fewer single use plastics, and improved recycling to combat the problem.
Honingh et al. (2020) study plastic waste accumulation at trash racks, which may increase risk of flooding. Using flume experimentation, the authors analyze how waste from plastic and other debris may impact trash rack blockage, finding plastic has higher blockage density when compared to organic waste (Honingh et al., 2020). In addition to modeling experiments, the researchers performed fieldwork at the Cikapundung River (Java) a headwater of the Citarum, finding approximately 100 kg of which plastic make up from 11% to 78% of the samples by weight. Plastic bags (57%), food packaging (21%), and plastic cups (16%) dominate the sample (Honingh et al., 2020). Cordova et al. (2022) also research the Citarum River (Java) outputs to the ocean, approximating 6,043 ± 567 pieces (1.01 ± 0.19 tons by weight) of macro debris release each day. Monitoring outputs from nine rivers into Jakarta Bay (Java) Cordova and Nurhati (2019) determine plastic is the most frequently polluted material, comprising 59% of the sample by piece and 37% of its weight. Their analysis finds an average daily “release of 97,098 ± 28,932 items or 23 ± 7.10 tons into Jakarta Bay” of which they determine “8.32 ± 2.44 tons” per day are plastic (Cordova and Nurhati 2019, p. 1). While an incredible amount of debris, the authors note this is “8–16 times less than global-scale model estimates” (Cordova and Nurhati 2019, p. 1). Also working in Jakarta Bay (Java) Dwiyitno et al. (2020) find a concentration of 10,300 plastic items/km2 in the wet season and 7,400 plastic items/km2 in the dry season, with packaging and consumer products made of plastic representing the most abundance in the sample. In two articles modeling macro debris accumulation in Java’s Jakarta Bay, Jasmin et al. (2019, 2020) find accumulation in the rainy season in the eastern part of the Bay and accumulation in the dry season on the western and eastern areas of the Bay.
Researching Pantai Indah Kapuk mangrove (Java) Hastuti et al. (2014) note plastic is the most frequent item they sample (77.7%) followed by foamed plastic (18.1%) which is, of course, also plastic; the authors recommend restoration and widening of the mangrove ecosystem to improve conditions. Tracking outputs of local rivers into Banten Bay (Java) Rahmania et al. (2021) find plastics originating in the Cibanten River drift west to the Sunda Strait in the east monsoon and east to Jarkarta Bay in the west monsoon. Their analysis leads to a recommendation of local governmental cooperation to control both unmanaged and managed solid waste sites (Rahmania et al., 2021). Bridge sampling emissions of macro-plastics on the Ciliwung, Pesanggrahan, Sunter, and Cakung rivers (Java) in Indonesia, van Emmerik et al. (2019a) estimate that 2.1 × 10³ tons of plastic waste travels via rivers and canals in Jakarta to oceans annually. Analysis of Ciliwung, Pesanggrahan, and Banjir Kanal Timur rivers (Java) in Indonesia by van Calcar and van Emmerik (2019) indicate an average of over 104 plastic items per hour for the Ciliwung, just under 104 plastic items per hour for the Pesanggrahan, and well over 103 plastic items per hour for the Banjir Kanal Timur, with seasonal variation. They find high rates of soft polyolefin in these Indonesian rivers (van Calcar and van Emmerik 2019).
An analysis of the Musi River (Sumatra) by Maherlsa et al. (2019) use a net/manta system to survey floating debris at ten stations along the river. The researchers discover 87 macro debris items, with a range of 1–33 items found per station; plastics comprise 86.2% of the sample (Maherlsa et al., 2019). Working with the point intercept transit method in the Musi River of South Sumatera (Sumatra), Almiza and Patria (2021) find an abundance range of 5–32 items/m2 and 27.8–126.9 g/m2. Their most frequently sampled items are “plastics fragments, food wrappers, other jugs/containers, bags/films, … cups, … [and] bags/films” (p. 1). Owens and Kamil’s (2020) study is the only example of freshwater analysis for macro debris on Bali published to date. This research on two sites along the riverbanks of the Tukad Badung finds at the floodplain site 598 pieces of debris weighing 14.8 kg (or 1.19 pieces/m2 and 0.029 kg/m2), 92.8% of which was composed of plastic and at the transition zone site 147 pieces weighing 3.58 kg (or 0.58 pieces/m2 and 0.014 kg/m2) of which 88.4% was plastic (Owens and Kamil 2020). When analyzing research of freshwater macro plastic pollution in Indonesia, it is clear most analyses are centered on Java, with limited research in Sumatra or Bali and no published research tracking freshwater macro debris inputs on smaller islands.
River debris studies in the United States
The population of the United States is 337 million people, and the population of the state of Connecticut is 3.6 million people (CIA 2022; U.S Census 2022). Connecticut is the fourth most densely populated state in America, with 286 inhabitants per square kilometer (Statista, 2022). Lebreton et al. (2017) do not include any rivers in North American in their predictive list of top-twenty most polluting rivers. As there are no studies of the Connecticut river (as is the case with the Aturukuku and the Ayung) this review focuses on broader freshwater studies of macro plastic in the United States.
There are studies of US freshwater systems focusing on microplastics (e.g., Baldwin et al., 2016 in the Great Lakes Tributaries, Barrows et al., 2018 in the Gallatin River watershed, and Cable et al., 2017 in the Great Lakes) and more comprehensive reviews of freshwater research on microplastics with US examples (see Peller et al., 2020). Many reviews on microplastics in freshwater include little data on the United States though Bellasi et al. (2020) incorporate some data on tire wear particles and wastewater treatment plants. Baldwin et al. (2016) assess floating micro and macro debris across 29 tributaries of the Great Lakes in six US states, finding plastics in all of their 107 samples, of which 98% are microplastic. The authors attribute many of the plastics including fragments, pellets, foams, and films to urban runoff events though this is not true of fibers (Baldwin et al., 2016).
Carpenter et al. (1972) note the presence of polystyrene spherules in samples from Niantic Bay, Block Island, Long Island Sound, and the Great Salt Pond on Block Island. Collecting at the outlet pipes of factories in Massachusetts (the Chicopee River, the Connecticut River) and at the mouth of the Connecticut River in Saybrook, Hays and Cormans (1974) find similar polystyrene spherules at both locations. They find cylindrical polyethylene particles at additional factory sites in Ludlow Massachusetts, Stonington Connecticut, and Gilman (Thames River) Connecticut as well as sites in New York and New Jersey (Hays and Cormans 1974). Poletti and Landberg (2021) find 14,520 pieces of debris, 56.4% of which is polystyrene in their assessment of the Mill Creek of the Blue Heron Nature Preserve in Atlanta, Georgia. Analyzing the Los Angeles and San Gabriel Rivers (Moore et al., 2011) estimate an average 2.3 billion pieces of plastic (30 metric tons) flow through these rivers every 72 h with foams being most abundant (71%). Working on the Long Island Sound at Meig’s Point, eight miles west of the Connecticut river’s outlet and at Bluff Point State Park on the Poquonock River in Connecticut, Owens (2018) finds 1,623 individual pieces of debris weighing 19.4 kg of which 61.5% by piece and 16.2% by weight is plastic. In a review of studies on the Laurentian Great Lakes, Driedger et al. (2015) found litter along shorelines is predominantly plastic (>80%) while density in water is comparable to that of the ocean gyres. Vincent and Hoellein (2017) studying Lake Michigan’s Pratt Beach collect 79,915 items and primarily attribute the material to litter and its accumulation. One comprehensive study of 15 sites in five rivers in Illinois and Indiana (Salt Creek, Turkey Creek, North Branch of the Chicago River, Hickory Creek, Plum Creek) finds that while in the riparian zone debris density compares to global beach averages, in benthic zones density is higher for riverine than marine environments (McCormick and Hoellein 2016). As such, this review indicates that there have been few analyses of the Connecticut River since the 1970’s and there is a dearth of freshwater macro pollution studies in the United States in general.
Experts have weighed in for decades on solutions for the plastic pollution problem, whether touting education, legislation, or some combination of the two (Derraik 2002; Sheavly and Register 2007). Cleanups are valuable tools to improve awareness, influence behavior, and provide context to this complex global issue (5IMDC 2011; Owens 2018). Our analysis includes not only baseline data on three rivers (the Aturukuku, the Ayung, and the Connecticut) but also an analysis of surveys of workshop participant environmental attitudes and behaviors as well as asking how they conceptualize the problem of and the solution for plastic pollution in their home communities. According to Wandeka et al. (2022) many of the solutions presented in the Ugandan system stem from “the private sector and plastic recycling businesses” (p.19) Wandeka et al. (2022) recommend more support from government, increased regulations on imports, and local solutions for packaging and use. Nkwachukwu et al. (2013) recommend redesigning plastics to alleviate the problem, but note the importance of coupling bioplastic design with proper labelling, outreach, and education. The authors astutely point out “that the concept of degradable plastics has been oversold as a solution to the waste disposal problem” (Nkwachukwu et al., 2013 p.12). They also recommend creating infrastructure for disposal and recycling of waste (Nkwachukwu et al., 2013). Sadan and De Kock (2021) note that policy fragmentation exists at all levels and recommend that African nations address the problem globally (contributing to the development of a global treaty), regionally (aligning global policy for the regional context), and nationally (considering their own priorities and challenges). Jambeck et al. (2018) find that African communities show greater propensity toward recycling, remaking, and reusing materials in creative ways, finding that community-based solutions to the problem may be particularly apt in African countries. Mihai et al. (2022) find that whether discussing macroplastic in coastal or freshwater systems and in developed or developing countries, the linear economy model will yield waste mismanagement problems; they recommend the circular economy model “as a key mitigation strategy in the prevention of plastics materials, improvement of the production sector, and providing better waste management practices to reduce this global environmental threat” (p. 242). These authors rightly note that waste management in itself is not the solution, as developed countries with ample management of waste produce plastic pollution of both freshwater and marine systems (Mihai et al., 2022).
While the number of studies of freshwater systems is increasing, there are as yet no studies including data from the Aturukuku River in Uganda, the Ayung River in Indonesia, or the Connecticut River in the United States. In addition, we have found no studies that compare perceptions in these three countries to better understand the nuances around plastic pollution globally. This research provides additional information about three river systems, the Aturukuku River in Uganda, the Ayung River in Indonesia, and the Connecticut River in the United States and the people who live and work nearby.
Materials and methods
This interdisciplinary research approach seeks to create a baseline report for sites along each of the three rivers, and to highlight how communities understand the problem of plastic pollution, its sources, and its solutions. Maps of the Aturukuku, the Ayung, and the Connecticut River can be seen in Figure 1. At each study site (Uganda, Indonesia, United States) members of the research team led 2-day workshops for local residents. The goal of the workshop was to inform participants about the issue of freshwater debris, train participants on the cleanup methods, and share strategies for communicating results to policymakers. In addition to debris collections at each site, participants were surveyed before the workshop, at the end of the workshop, and 2 months after the workshop.
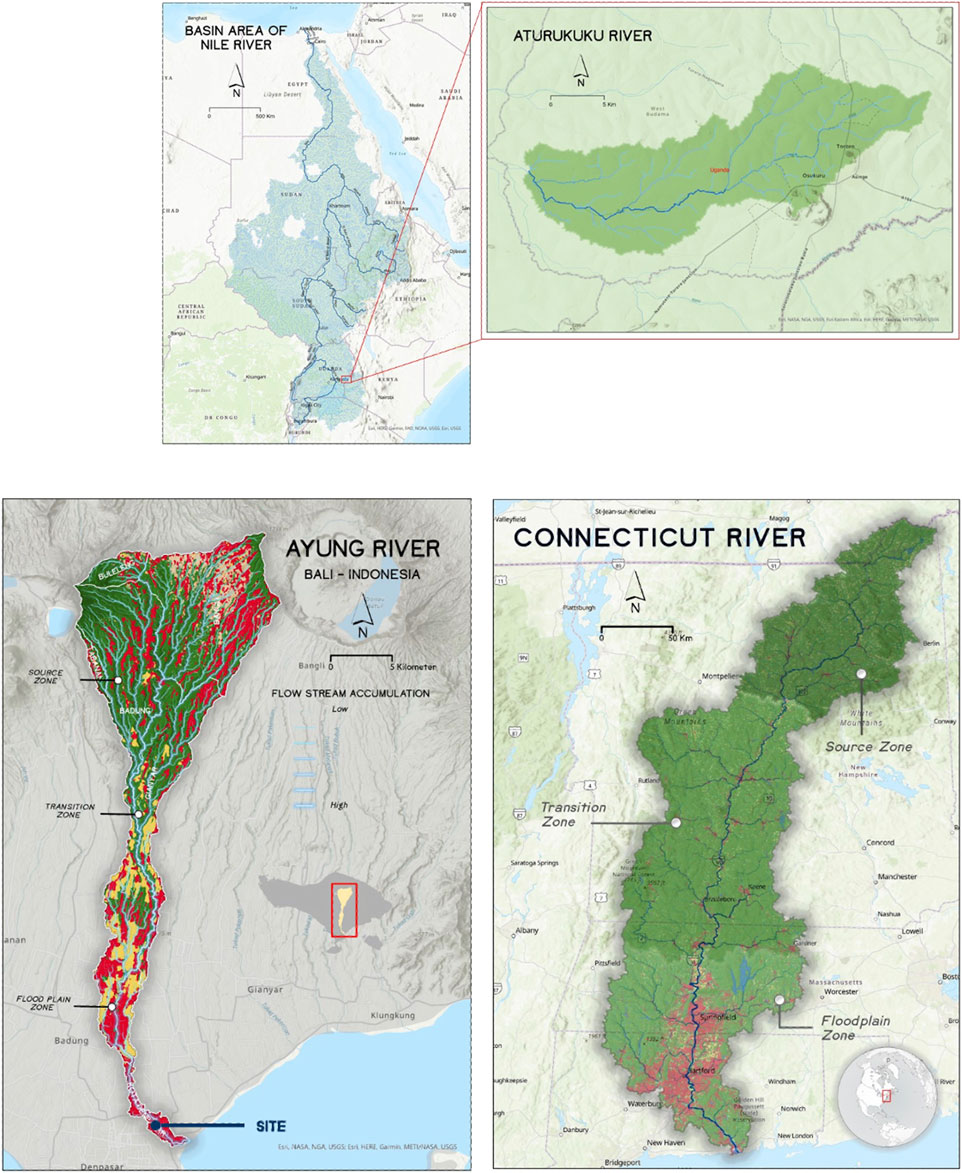
FIGURE 1. Maps showing the locations of the Aturukuku River in Uganda, the Ayung River in Indonesia, and the Connecticut River in the United States (Map credit: Muhammad Azmi).
Debris collection
Researchers at each site complete an analysis using a river collection method (Owens and Kamil 2020) modeled on the National Oceanic and Atmospheric Administration (NOAA) Marine Debris Shoreline methodology (Opfer, Arthur, and Lippiatt 2012). Researchers use survey flags to demarcate an area along the shore of the respective river, marking off a 100 m long by 5-m wide (landward from the river) portion of shoreline for a total collection area of 500 m2. In the Indonesian case, it was not possible to find an accessible shoreline area with 100 consecutive meters. Therefore, the Indonesian team opted for a shorter collection area of 16 m in length. After flagging the study area, researchers walk a precise pattern dictated by NOAA, covering the complete area by walking back and forth, scanning from side to side in order to collect all macro debris visible within the given area that is attributable to humans. As described in Owens and Kamil (2020) and Owens et al. (2022), this method combines the NOAA methodology for a standing stock survey (which typically covers 100 m of shoreline but does not include removing debris) and the accumulation method (which includes the entire shoreline and does include removing debris). This practical combined approach allows removing debris from a limited area to take a snapshot of accumulation of plastic and other debris. Researchers collect the debris and log it onto data collection sheets by type of material. The debris from a limited portion of shoreline is removed using this replicable, inexpensive, scientific method to serve a broader goal of informing policymakers and community members about the problem in a local context (Owens et al., 2022).
Surveys
We measure participant environmental attitudes using the New Ecological Paradigm (NEP) Scale (Dunlap et al., 2000) which is used globally to shed light on “the impact of educational programs on environmental world views” (Anderson, 2012), p. 260. Self-reported environmental behaviors are measured via the Environmentally Responsible Behavior Index (ERBI) described by Thapa (1999) and developed by Smith-Sebasto and D'Costa (1995). This instrument has a high internal consistency reliability (.94), and high validity (82%) (Smith-Sebasto and D'Costa 1995).
To shed light on perceptions around the problem of pollution in freshwater, we ask respondents about the items they expect to find in their cleanup and policies that can address the problem. We analyze responses using content analysis to look for patterns of meaning. When classifying responses into more discrete categories, we err on the side of counting an item as ‘indeterminate’ rather than ascribing meaning to it. For example, if a respondent writes they expect to see “straw” in the river, we do not assume this is a single use plastic straw. If they write “shoe” we cannot determine if they mean flip-flop (aka thong) made of plastic or a leather or cloth shoe, therefore we count it as indeterminate. In this way, we would rather under-report than over-report perceptions ascribed to respondents.
Why use qualitative methods to understand the problem of plastic pollution? As we hail from different societies with different cultures, as well as social and economic systems, we did not want to make presumptions about the conceptualization of the problem, the policy, or the solutions by respondents. Instead, we ask them to share the problem, the policy, and the solutions in their own words. Using an inductive, social-constructivist method we use content analysis to systematically observe, review, and pull meaning from the responses. This allows us to remove some of our own biases and conceptions from the analysis. The categories to which we subdivide responses vary by study area, as each derives from the responses themselves. In other words, we do not impose one set of categories on all three study sites, but instead build categories based on responses. By asking local participants about the problem, the policy, and the solutions, we highlight their perceptions and understanding of the issue, creating a unique profile for each community. We then compare these to draw meaning about the global problem of freshwater pollution. Please note: While participants share their results with local policymakers, this study is not configured to measure the impact of their advocacy on policy over time. Policymaking is a slow, incremental process. Work training local stakeholders to understand their local resources and advocate for them may improve policy in the future, but it is outside the scope of this project to measure it.
Results
Debris collection
Basic information about each site and collection can be seen in Table 1. Debris was present at all three riverbank sites, with the Ayung River’s debris density (7.62 pieces/m2) an order of magnitude higher than the Aturukuku (0.45 pieces/m2) and the Connecticut (0.29 pieces/m2). Plastic was the most frequently found item at each site, ranging from 63.0% to 91.1% of the samples. Material by category can be seen in Table 2 and proportional distribution of each sample by site is shown in Figure 2.
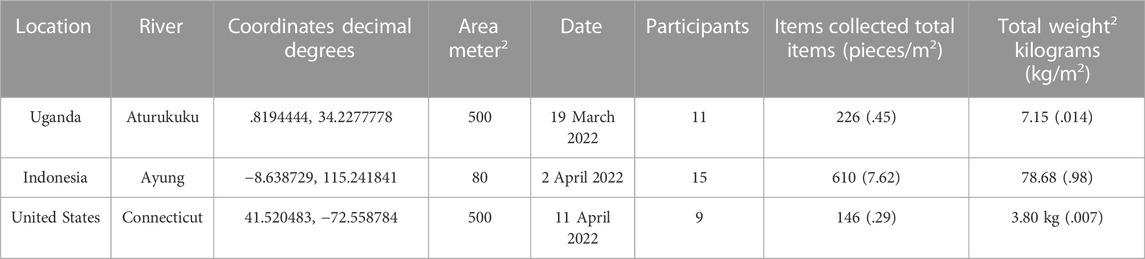
TABLE 1. Data about collection sites, with number of items collected, pieces/m2, total weight, and kg/m2.
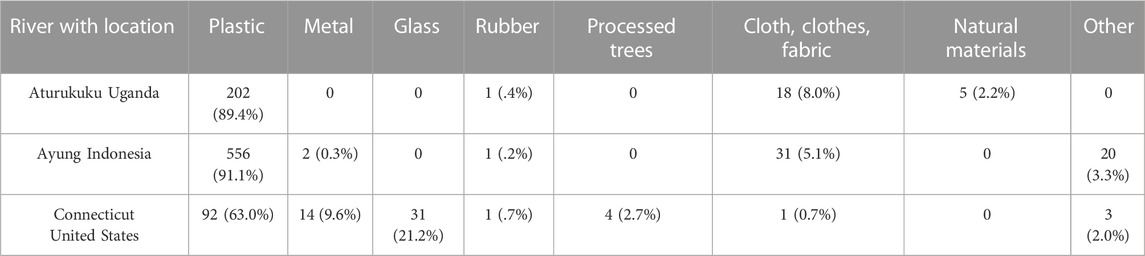
TABLE 2. Collected material by type from three sites in Uganda, Indonesia, and the United States; in parentheses find the percentage of the total amount of accumulated debris at each site.
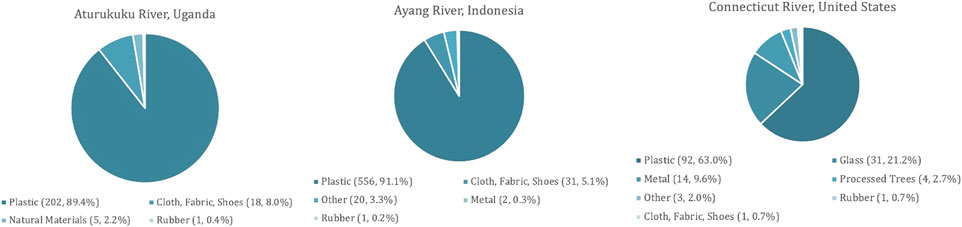
FIGURE 2. Proportional distribution of material found in the Aturukuku River, Uganda, the Ayung River, Indonesia, and the Connecticut River, United States with material type (count, percentage).
Survey data: Environmental attitudes and behaviors
The New Ecological Paradigm (NEP) Scale (Dunlap et al., 2000) measures environmental attitudes while the Environmentally Responsible Behavior Index (ERBI) measures self-reported environmental behaviors. Participants respond to questions about their attitudes or behaviors on a scale ranging from rarely to usually. Their answers are given a score ranging from 0 = Not applicable, 1 = Rarely, 2 = Occasionally, 3 = Sometimes, 4 = Frequently, and 5 = Usually. Here we share the mean scores of the sample and the standard deviation. Due to the low sample sizes, we have opted not to administer statistical analysis on the responses. Results can be found in Tables 3 and Table 4.
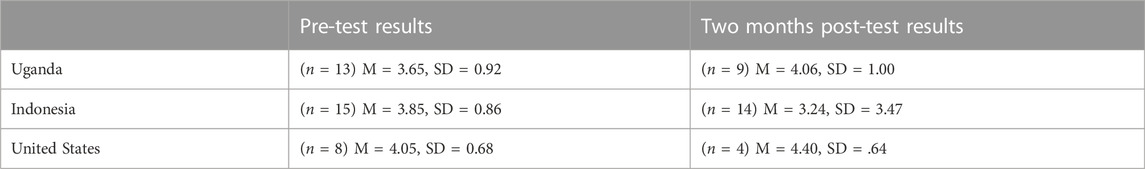
TABLE 3. Comparative results of the New Ecological Paradigm.
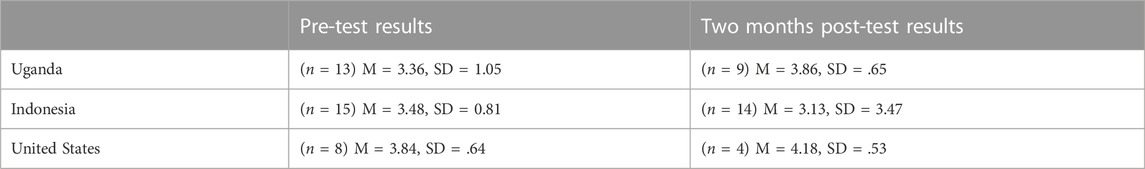
TABLE 4. Comparative results of the Environmentally Responsible Behavior Index.
Survey data: Perception of content of debris in Uganda
Ugandan respondents were asked: Please list the top five most frequently found items in the Aturukuku River. Supplementary Materials Table 1 compiles and categorizes responses for the Aturukuku river in Uganda. Figure 3 shows a comparison of participant responses by type of material for each survey period. Please note the changing sample size between the pre-test (n = 61), the post-test (n = 55), and the 2 months post-test (n = 45).
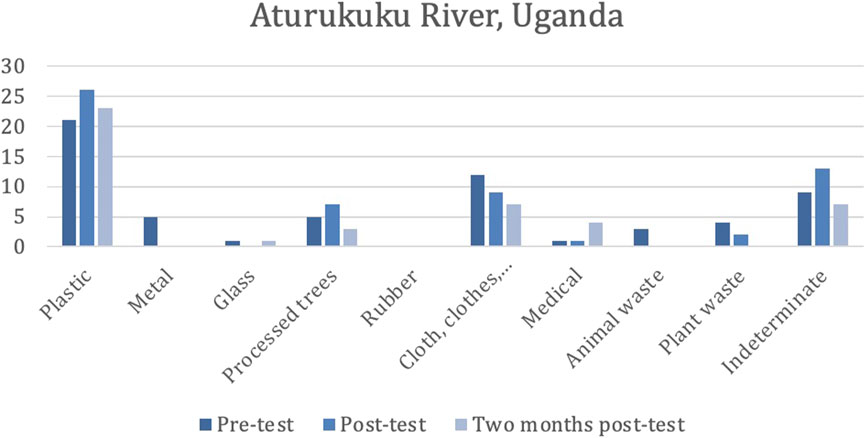
FIGURE 3. Participant perceptions of the most frequently found items in the Aturukuku River by type.
Survey data: perception of content of debris in Indonesia
Indonesian respondents were asked: Please list the top five most frequently found items in the Ayung River. Supplementary Materials Table 2 compiles and categorizes responses for the Ayung River in Indonesia. Figure 4 shows a comparison of participant responses by type of material for each survey period. Please note the changing sample size between the pre-test (n = 65), the post-test (n = 68), and the 2 months post-test (n = 66).
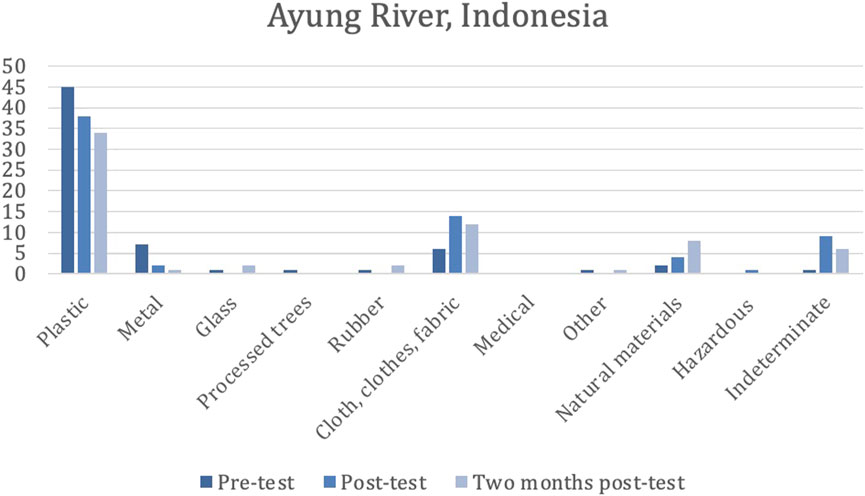
FIGURE 4. Participant perceptions of the most frequently found items in the Ayung River by type.
Survey data: perception of content of debris in America
American respondents were asked: Please list the top five most frequently found items in the Connecticut River. Supplementary Materials Table 3 compiles and categorizes responses for the Connecticut River in the United States. Figure 5 shows a comparison of participant responses by type of material for each survey period. Please note the changing sample size between the pre-test (n = 40), the post-test (n = 40), and the 2 months post-test (n = 20).

FIGURE 5. Participant perceptions of the most frequently found items in the Connecticut River by type.
Survey data: stakeholder perception of policies in Uganda
All workshop participants were asked: Please list the top three policies that are helpful for combating the river litter problem in your community. We categorize the responses based on whether the listed policy focuses on the symptoms or the sources of plastic pollution. For example, policies dealing with the symptoms might include recycling, fines on littering, or beach cleanups. Policies dealing with the source include those that ban plastic, encourage reducing, re-using, or alternatives to single use plastics. This is to better understand if policy conceptualization highlights the underlying core problem (unsustainable production of single use plastics).
Results from Uganda can be seen in Supplementary Materials Table 4, the data are summarized in Figure 6 below. In the pre-test (n = 30) 63% of responses focus on symptoms-based approaches, including recycling, fines, cleanups, education, waste management, and behavior. Thirty-three percent focus on the source, including improving policy, reducing plastics, banning certain plastic, and promoting alternatives to plastic. Three percent of responses are indeterminate or unknown (e.g., “To circle the plastic”). For the immediate post-test (n = 21) in Uganda, 68% include policies associated with the symptoms of plastic pollution, including recycling, fines, education, waste management and behavior. Twenty-eight percent address the source of pollution, including improving policy and banning certain plastics. Five percent of responses are indeterminate or unknown (e.g., “Burning off plastic factories”). In the final Ugandan survey (n = 20) 65% of responses focus on symptoms-based approaches, including fines, cleanups, education, waste management, behavior and research. Twenty percent address the sources of pollution, including improving policies, banning certain plastics, and alternatives to plastic. Fifteen percent are indeterminate or unknown (e.g., “Throwing bottles is dangerous”). For the Ugandan participants, responses more frequently focus on the ‘end of the pipe’ rather than the source of debris and this does not change drastically over the course of the survey period.
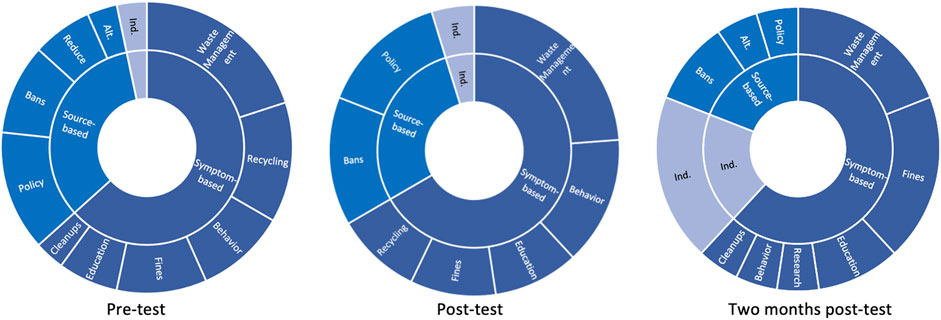
FIGURE 6. Comparison of stakeholder perceptions of policies in Uganda, pre-test (n = 30), post-test (n = 21), and 2 months post-test (n = 20). Alt. = Alternatives to plastic. Ind. = Indeterminate or unknown.
Survey data: stakeholder perception of policies in Indonesia
Results from Indonesia can be seen in Supplementary Materials Table 5 and are summarized in Figure 7 below. In the pre-test (n = 31) 22% of responses focus on symptoms-based approaches, including recycling and waste management. Seventy-four percent focus on the source, including reusing materials, businesses no longer using single-use plastics, reducing plastics, banning certain plastic, and promoting alternatives to plastic. Three percent of responses are indeterminate or unknown (e.g., “reward and punishment for people”). For the immediate post-test (n = 32) in Indonesia, 37% include policies associated with the symptoms of plastic pollution, including recycling, waste management, and behavior. Fifty-nine percent of responses focus on the sources, including refusing, reusing, businesses no longer using single-use plastics, reducing, bans, and alternatives to plastic. Three percent of responses are indeterminate or unknown (e.g., “reward and punishment for people”). In the final Indonesian survey (n = 39), 57% percent of responses focus on the symptoms including recycling, waste management, behavior, education, cleanups, and punishment for people who litter. Forty-four percent address the sources of debris including refusing, reusing, businesses no longer using single-use plastics, reducing, bans, and alternatives to plastic. Initially, Indonesian responses focus more on the sources of debris, but then shift to being more balanced between policies focusing on the sources and symptoms of pollution.
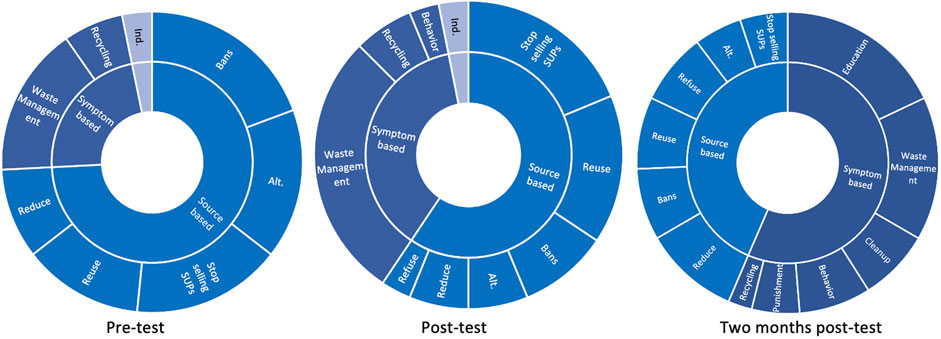
FIGURE 7. Stakeholder perceptions of policies in Indonesia, pre-test (n = 31), post-test (n = 32), and 2 months post-test (n = 39). Alt. = Alternatives to plastic. Ind. = Indeterminate or unknown.
Survey data: stakeholder perception of policies in America
The American results can be seen in Supplementary Materials Table 6 and are summarized in Figure 8 below. In the pre-test (n = 14), 50% of responses focus on the symptoms, including recycling, fines, cleanups, and education. Thirty-five percent of responses focus on the sources, including re-using, extended producer responsibility, and alternatives. Fourteen percent of responses are indeterminate or unknown (e.g., “commercial fishing,” “none that I am aware of”). In the immediate post-test (n = 16), 25% of responses are symptom-based, emphasizing recycling. Forty-five percent emphasize the sources of debris, including re-using, bans on certain plastics, extended producer responsibility, and reducing. Thirty-one percent of responses are indeterminate or unknown (e.g., “plastic bag,” “straw,” “to go containers,” “unaware of any”). For the final Connecticut survey (n = 11), 36% of responses are symptom based, including recycling and fines. Sixty-three percent are source-based and focus on re-using, bans, reducing, and promoting alternatives to plastic. Connecticut responses emphasize the symptoms of pollution initially, but shift to the sources of pollution between the pre-test and the survey occurring 2 months after the workshop.
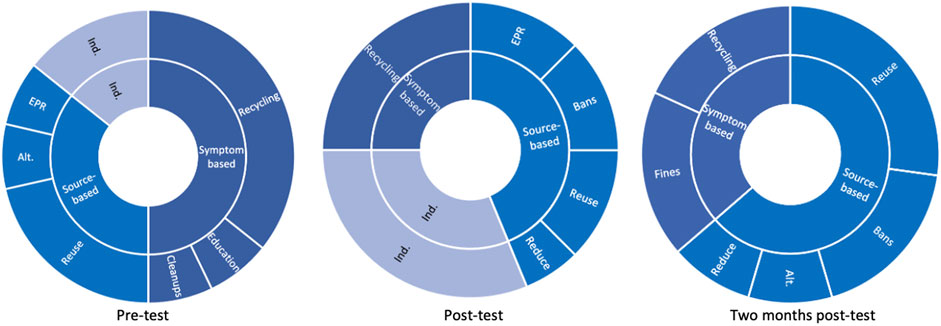
FIGURE 8. Stakeholder perceptions of policies in the United States, pre-test (n = 14), post-test (n = 16), 2 months post-test (n = 14). Alt. = Alternatives to plastic. Ind. = Indeterminate or unknown.
Discussion
Debris collection
To better understand the context of the density results we use the classification of the Clean Coast Index (Alkalay et al., 2007). According to this classification system, the Ayung riverside rates as “extremely dirty” and the Aturukuku and the Connecticut riversides rate as “moderate.”
Survey data: Environmental attitudes and behaviors
Due to both the low enrollment and the discrepancy in number of participants for each workshop, we were unable to run comparative statistical analysis on these data. That said, what we can see is that in this limited sample, the mean responses are comparable and there are not obvious differences between the respondents in Uganda, Indonesia, and the United States. In each country, the respondents are generally responding in the sometimes/frequently range for both pro-environmental attitudes and behaviors. In other words, workshop participants in each country display quite positive environmental attitudes and pro-environmental behaviors.
Survey data: Perception of content of debris in Uganda
How do the responses change over time to the question Please list the top five most frequently found items in the Aturukuku River? There is some growth of proportion for plastic, with responses for plastic rising from the pre-test (34%), through the immediate post-test (47%), and having the highest percentage for the 2-month post-test (51%). That said, plastic always ranks as the most frequently selected material, with cloth, clothes, fabric maintaining a steady proportion through the pre-test (20%), through the immediate post-test (16%), and the 2-month post-test (16%). Metal and animal waste are responses for the pre-test sample, but not beyond that. Glass disappears in the immediate post-test but resurfaces in the 2-month post-test. Plant waste is mentioned in the pre-test and immediate post-test, but not the 2-month post-test, whereas medical waste and processed trees are named in all three survey samples. As such, while some responses shift in minor ways throughout the sampling series, there are not drastic changes in respondent understanding of local waterway pollutants.
How do the responses compare to the collected sample? The respondents accurately presume the types of material they will find in the river, acknowledging that it will be primarily composed of plastic with cloth, clothes, fabric being the next-highest category. While these numbers shift between the pre, immediate post and 2-month post surveys, they are the two highest-ranking determined categories. This indicates the Ugandan participants have a strong grasp of the issues that plague their local waterway though they underestimate the proportion of plastic. In the pre-test, respondents presumed metal waste and animal waste would play a larger role, but this was not borne out through subsequent surveys, likely because the riverside collection did not include either of these substances. In other words, as their presumptions were ground-truthed, the Ugandan participants shifted their knowledge and understanding of the problem accordingly.
Survey data: Perception of content of debris in Indonesia
How do the responses change over time to the question Please list the top five most frequently found items in the Ayung River? There is a loss of proportion for plastic over the sampling series, with responses for plastic decreasing from the pre-test (69%), through the immediate post-test (56%), and through the 2-month post-test (52%). And yet, plastic always ranks as the most frequently selected material and proportionally makes up more than half of the responses. In the pre-test, metal ranks second-highest (11%) but this shifts to cloth, clothes, fabric for the immediate post-test (21%), and the 2-month post-test (18%). Metal is consistently named, but the proportion diminishes over time while conversely, Natural materials (including items like rope, organic waste, jute bags) is listed consistently and increases as a proportion of the sample over time. Glass and rubber are each a relatively small proportion found in the pre-test and the 2-month post-test, but not the immediate post-test. Hazardous materials appear only in the immediate post-test, and the other category includes varied materials in the pre-test (tetrapak) and the 2-month post-test (religious waste) but never comprises more than 2% of the sample. As with the Ugandan responses, the sample shifts in small ways through the sampling series, but there is a consistent understanding of local waterway pollutants.
How do the responses compare to the collected sample? The respondents accurately presume the types of material they will find in the river, acknowledging that it will be primarily composed of plastic. This indicates the Indonesian participants have a strong grasp of the issues that plague their local waterway, though they underestimate the predominance of plastic. While cloth, clothes, fabric rank third behind metal in the pre-test, these materials are the second most frequently found material in the collection. Responses shift accordingly, with cloth, clothes, fabric’s proportion of the sample increasing from the pre-test (9%) to the post-test (21%) and the 2-month post-test (18%) while metal drops precipitously in the ranking from pre-test (11%) to the post-test (3%) and the 2-month post-test (2%). As such, as the Indonesian respondents learned more by engaging in a collection, their reported knowledge and understanding of the problem shifted accordingly.
Survey data: perception of content of debris in America
How do the responses change over time to the question Please list the top five most frequently found items in the Connecticut River? There is an increase in proportion for plastic over the sampling series, with responses for plastic increasing from the pre-test (53%), through the immediate post-test (55%), and the 2-month post-test (70%). Plastic always ranks as the most frequently selected material. In the pre-test, the indeterminate category ranks second-highest (23%) but that category shifts to 5% in both subsequent surveys. Metal is consistently named, and the proportion diminishes slightly over the series from pre-test (15%) to post-test (15%) to 2-month post-test (10%). Glass is not named in the pre-test, but is in the post-test (15%) tapering down for the 2-month post-test (5%). Rubber in the form of tires is noted in the pre-test (3%), not in the post-test, and again in the 2-month post-test (5%). Cloth, clothes, fabric rank low in the pre-test (3%), maintain that level for the post-test (3%) and are not mentioned in the 2-month post-test. Medical waste is mentioned in the pre-test (3%) but not in subsequent tests. As with the Ugandan and Indonesian responses, the sample shifts in small ways through the sampling series, but there is a consistent understanding of local waterway pollutants.
How do the responses compare to the collected sample? The respondents accurately presume the types of material they will find in the river, acknowledging that it will be primarily composed of plastic, though proportionately it is first slightly too low and then too high in comparison to the actual results. This indicates the American participants have a strong grasp of the issues that plague their local waterway, though they underestimate then overestimate the predominance of plastic. While glass is not listed in the pre-test, it is the second most frequently found material in the collection. Responses shift accordingly, with glass’ proportion of the sample increasing for the post-test (15%) then decreasing for the 2-month post-test (5%). Metal is accurately presumed to be a part of the waste found in the sample, though its proportion decreases by the 2-month post-test (to 5%). As with the Ugandan and Indonesian respondents, the post-test responses are not a perfect match but do reflect the ground-truthing from the field experience. As such, the knowledge and understanding of the problem shifts accordingly.
How do the responses compare across countries?
The Ugandan responses are unique in the ranking of organic waste (animal remains, plant waste, logs, and invasive species) along with other pollutants (plastic, metal, glass, cloth, and rubber). The responses are consistent over time, never shifting widely. Participant responses indicate the Ugandans have a strong grasp of local river pollution and make subtle changes based on their real-world experience. Indonesian responses are also broadly consistent over time and a good match for the results found on-the-ground. When looking at the perceptions of the problem across categories, it is clear that respondents expect plastic will be a frequent find, which is borne out in real life. Both Ugandan and Indonesian responses note the importance of plastic and cloth, which are in fact the most frequently found items in their cleanup events. In comparison, Indonesian respondents do not expect as much organic waste (animal waste and plant waste), but do expect products created from natural materials such as jute bags and rope. The American respondents rightly presume they will find more non-organic materials (plastic, glass, and metal) and do not presume to find or find as much cloth as in the Ugandan and Indonesian samples.
In addition to the shifts within countries across the three surveys, it is important to note that both Ugandan and Indonesian participants describe a need for waste management, which is not mentioned by the US participants. This indicates the importance of waste management infrastructure for alleviating the symptoms of plastic pollution.
Survey data: Comparison of stakeholder perception of policies across countries
In general, the participants are well-informed about policy solutions, naming a wide range of policy options and strategies, particularly considering they are not prompted or given choices from which to select. The participants are self-selected into the workshop cohorts, which may mean they are more likely to be informed about the issues and aware of policies.
The Indonesian group begins with a strong focus on the sources of debris and provide more types of solutions when considering sources of pollution. When considering symptom-based approaches to alleviating debris, participants in all three countries note recycling, cleanups, education, and some type of negative consequences for littering, though respondents in Indonesia characterize this as punishment while those in Uganda and the US classify this as fines. As previously described, both Uganda and Indonesia make a note of waste management policies; participants from both countries also mention individual littering behavior, which the American respondents do not. In considering source-based approaches, respondents in all three countries mention policies that encourage reducing plastics, banning plastics, and promoting alternatives to plastics. Ugandan participants also mention forming new policies or bylaws. Both the American and Indonesian participants talk about programs to re-use materials. In addition, American respondents mention Extended Producer Responsibility, while Indonesian participants also mention programs that promote refusing plastics and business no longer carrying single-use plastics. Over time the Uganda sample remains relatively consistent, with the range of proposed policy responses focused on the sources of plastic pollution ranging from 33 to 20%. In contrast, the Indonesian population shifts over time, at first having a higher proportion devoted to source-based solutions (74%) though that falls over time to 44%. The group from Connecticut, United States, also shifts, but in the opposite direction, with the percentage of source-based policy solutions changing from 35% to 63% over time.
In conclusion, pollution, particularly plastic pollution, is an ongoing threat to freshwater as well as marine systems. This pervasive material has many uses, is convenient, and perhaps most importantly—cheap to produce in large quantities. That said, the long-term consequences as plastics break down in the environment harm wildlife, ecosystems, the economy, and human communities. The River Engage workshops sought to make connections between science and policy for local communities—collecting data on local systems to report the results to local lawmakers, though the project was hampered by the COVID-19 global pandemic. This research sheds light on the nuances among the way local workshop participants understand and grapple with the issue. These results indicate that one size does not ‘fit all’ and that the approaches to the problem should encapsulate local issues, nuances, and context.
The results, particularly from participant responses in Uganda and Indonesia, indicate that basic waste management must be a part of the solution. This must be shared with a major caveat, however, as in the United States and Europe, waste management systems are in place—yet plastic pollution remains a problem. In many ways, the global north has not solved the problem of plastic pollution—but are better at hiding it. Waste management systems should be in place in rural areas—for public health reasons as well as environmental and ecological health. It cannot be emphasized enough that waste management systems allow for some tidying up of but not the true elimination of the majority of plastic waste. When waste management systems are in place for plastic pollution, they result in incineration or landfilling—neither of which is an environmentally or ecologically neutral option. So, while these results indicate that waste management will improve the health of rivers in Uganda and Indonesia, this should be considered a stop-gap measure, never intended to solve the problem of plastic pollution. How we define problems has bearing on how we define solutions. The real solution for solving the problem of plastic pollution can only come from greatly reducing the number of single use plastics being manufactured, sold, used, and disposed of globally.
Data availability statement
The datasets presented in this study can be found in online repositories. The names of the repository/repositories and accession number(s) can be found below: https://bit.ly/3Db4i04 Research Gate and https://bit.ly/3f7hdYU Research Gate.
Ethics statement
The studies involving human participants were reviewed and approved by University of Hartford Institutional Review Board. The University of Hartford has an Assurance of Compliance on file with the Office of Human Research Protections (Federalwide Assurance—FWA #00003578). The patients/participants provided their written informed consent to participate in this study.
Author contributions
KO: conceptualization, methodology, formal analysis, investigation, writing—original draft, visualization, supervision, project administration, funding acquisition PK: conceptualization, methodology, formal analysis, investigation, writing—review and editing, supervision, project administration, funding acquisition HO: conceptualization, methodology, investigation, writing—review and editing, supervision, project administration, funding acquisition.
Funding
This research was fully funded by National Geographic Society Meridian grant NGS-64464E-19.
Acknowledgments
The authors wish to thank their research collaborators in Uganda: Diana M. Kisakye, Moses Olowo, and Mary I. Amado, in Indonesia: Muhammad Azmi, Nathan Rusli, Dwi Jayanthi, Amer Risnadi, and Sri Junantari, and the United States: Sahara Williams and Myalia Durno.
Conflict of interest
The authors declare that the research was conducted in the absence of any commercial or financial relationships that could be construed as a potential conflict of interest.
Publisher’s note
All claims expressed in this article are solely those of the authors and do not necessarily represent those of their affiliated organizations, or those of the publisher, the editors and the reviewers. Any product that may be evaluated in this article, or claim that may be made by its manufacturer, is not guaranteed or endorsed by the publisher.
Supplementary material
The Supplementary Material for this article can be found online at: https://www.frontiersin.org/articles/10.3389/fenvs.2022.1081208/full#supplementary-material
Footnotes
1While the term ‘mismanaged waste’ is a regular feature in the literature, we take issue with the idea that the plastic pollution found in global waterways is merely “mismanaged.” This term implies that under different waste management conditions, the problem would be solved. Instead, under the best waste management, plastic is burned or buried: both are detrimental to the environment. Even eell-managed waste systems cannot address the core problem: that single use plastics were designed to be used once and thrown ‘away.’
2This is wet weight.
References
Abebe, F., and Nuru, M. (2011). Prevalence of indigestible foreign body ingestion in small ruminants slaughtered at Luna Export Abattoir, East Shoa, Ethiopia. J. Animal Veterinary Adv. 10 (12), 1598–1602.
Akindele, E. O., and Alimba, C. G. (2021). Plastic pollution threat in Africa: Current status and implications for aquatic ecosystem health. Environ. Sci. Pollut. Res. 28 (7), 7636–7651. doi:10.1007/s11356-020-11736-6
Akinrinmade, J. F., and Akinrinde, A. S. (2013). Foreign body rumen impaction with indigestible materials in ruminants in Nigeria: A review. Anim. Health Prod. 61 (4), 629–642.
Alimi, O. S., Fadare, O. O., and Okoffo, E. D. (2021). Microplastics in african ecosystems: Current knowledge, abundance, associated contaminants, techniques, and research needs. Sci. Total Environ. 755, 142422. doi:10.1016/j.scitotenv.2020.142422
Alkalay, R., Pasternak, G., and Zask, A. (2007). Clean-coast index—A new approach for beach cleanliness assessment. Ocean Coast. Manag. 50 (5-6), 352–362. doi:10.1016/j.ocecoaman.2006.10.002
Almiza, G., and Patria, M. P. (2021). “Distribution and abundance of macroplastic at Musi estuary, South Sumatera, Indonesia,” in Journal of physics: Conference series (London: The Institute of Physics (IOP)), 1869, 012178.
Alshawafi, A., Analla, M., Alwashali, E., and Aksissou, M. (2017). Assessment of marine debris on the coastal wetland of Martil in the North-East of Morocco. Mar. Pollut. Bull. 117 (1-2), 302–310. doi:10.1016/j.marpolbul.2017.01.079
Amato-Lourenço, L. F., Carvalho-Oliveira, R., Júnior, G. R., dos Santos Galvão, L., Ando, R. A., and Mauad, T. (2021). Presence of airborne microplastics in human lung tissue. J. Hazard. Mater. 416, 126124. doi:10.1016/j.jhazmat.2021.126124
Anderson, M. (2012). “The new environmental paradigm (NEP) scale,” in The Berkshire encyclopedia of sustainability: Measurements, indicators, and research methods for sustainability (Barrington, MA: Berkshire Publishing Group), 260–262.
Azevedo-Santos, V. M., Brito, M. F., Manoel, P. S., Perroca, J. F., Rodrigues-Filho, J. L., Paschoal, L. R., et al. (2021). Plastic pollution: A focus on freshwater biodiversity. Ambio 50 (7), 1313–1324. doi:10.1007/s13280-020-01496-5
Baldwin, A. K., Corsi, S. R., and Mason, S. A. (2016). Plastic debris in 29 Great Lakes tributaries: Relations to watershed attributes and hydrology. Environ. Sci. Technol. 50 (19), 10377–10385. doi:10.1021/acs.est.6b02917
Barnes, D. K., Galgani, F., Thompson, R. C., and Barlaz, M. (2009). Accumulation and fragmentation of plastic debris in global environments. Philosophical Trans. R. Soc. B Biol. Sci. 364 (1526), 1985–1998. doi:10.1098/rstb.2008.0205
Barrows, A. P., Christiansen, K. S., Bode, E. T., and Hoellein, T. J. (2018). A watershed-scale, citizen science approach to quantifying microplastic concentration in a mixed land-use river. Water Res. 147, 382–392. doi:10.1016/j.watres.2018.10.013
Battulga, B., Kawahigashi, M., and Oyuntsetseg, B. (2019). Distribution and composition of plastic debris along the river shore in the Selenga River basin in Mongolia. Environ. Sci. Pollut. Res. 26 (14), 14059–14072. doi:10.1007/s11356-019-04632-1
Bellasi, A., Binda, G., Pozzi, A., Galafassi, S., Volta, P., and Bettinetti, R. (2020). Microplastic contamination in freshwater environments: A review, focusing on interactions with sediments and benthic organisms. Environments 7 (4), 30. doi:10.3390/environments7040030
Biginagwa, F. J., Mayoma, B. S., Shashoua, Y., Syberg, K., and Khan, F. R. (2016). First evidence of microplastics in the african Great Lakes: Recovery from Lake Victoria nile perch and nile tilapia. J. Gt. Lakes. Res. 42, 146–149. doi:10.1016/j.jglr.2015.10.012
Blettler, M. C., Abrial, E., Khan, F. R., Sivri, N., and Espinola, L. A. (2018). Freshwater plastic pollution: Recognizing research biases and identifying knowledge gaps. Water Res. 143, 416–424. doi:10.1016/j.watres.2018.06.015
Blettler, M. C., and Wantzen, K. M. (2019). Threats underestimated in freshwater plastic pollution: Mini-review. Water Air Soil Pollut. 230 (7), 174. doi:10.1007/s11270-019-4220-z
Blettler, M., Ulla, M. A., Rabuffetti, A. P., and Garello, N. (2017). Plastic pollution in freshwater ecosystems: Macro-meso-and microplastic debris in a floodplain lake. Environ. Monit. Assess. 189 (11), 581–613. doi:10.1007/s10661-017-6305-8
Braun, T., Ehrlich, L., Henrich, W., Koeppel, S., Lomako, I., Schwabl, P., et al. (2021). Detection of microplastic in human placenta and meconium in a clinical setting. Pharmaceutics 13 (7), 921. doi:10.3390/pharmaceutics13070921
Cable, R. N., Beletsky, D., Beletsky, R., Wigginton, K., Locke, B. W., and Duhaime, M. B. (2017). Distribution and modeled transport of plastic pollution in the Great Lakes, the world's largest freshwater resource. Front. Environ. Sci. 5, 45. doi:10.3389/fenvs.2017.00045
Carpenter, E. J., Anderson, S. J., Harvey, G. R., Miklas, H. P., and Peck, B. B. (1972). Polystyrene spherules in coastal waters. Science 178 (4062), 749–750. doi:10.1126/science.178.4062.749
Castro-Jiménez, J., González-Fernández, D., Fornier, M., Schmidt, N., and Sempere, R. (2019). Macro-litter in surface waters from the rhone river: Plastic pollution and loading to the NW mediterranean sea. Mar. Pollut. Bull. 146, 60–66. doi:10.1016/j.marpolbul.2019.05.067
CIA (2022). Country comparisons: Population. retrieved from: https://www.cia.gov/the-world-factbook/field/population/country-comparison.
Cordova, M. R., and Nurhati, I. S. (2019). Major sources and monthly variations in the release of land-derived marine debris from the Greater Jakarta area, Indonesia. Sci. Rep. 9 (1), 18730–18738. doi:10.1038/s41598-019-55065-2
Cordova, M. R., Nurhati, I. S., Shiomoto, A., Hatanaka, K., Saville, R., and Riani, E. (2022). Spatiotemporal macro debris and microplastic variations linked to domestic waste and textile industry in the supercritical Citarum River, Indonesia. Mar. Pollut. Bull. 175, 113338. doi:10.1016/j.marpolbul.2022.113338
Cózar, A., Echevarría, F., González-Gordillo, J. I., Irigoien, X., Úbeda, B., Hernández-León, S., et al. (2014). “Plastic debris in the open ocean,” in Proceedings of the National Academies of Sciences U.S.A., 111, 10239–10244.
Derraik, J. G. (2002). The pollution of the marine environment by plastic debris: A review. Mar. Pollut. Bull. 44 (9), 842–852. doi:10.1016/s0025-326x(02)00220-5
Driedger, A. G., Dürr, H. H., Mitchell, K., and Van Cappellen, P. (2015). Plastic debris in the laurentian Great Lakes: A review. J. Gt. Lakes. Res. 41 (1), 9–19. doi:10.1016/j.jglr.2014.12.020
Dunlap, R. E., Van Liere, K. D., Mertig, A. G., and Jones, R. E. (2000). New trends in measuring environmental attitudes: Measuring endorsement of the new ecological paradigm: A revised NEP scale. J. Soc. Issues 56 (3), 425–442. doi:10.1111/0022-4537.00176
Dwiyitno, D., Andayani, F., Anissah, U., Januar, H. I., and Wibowo, S. (2020). Concentration and characteristic of floating plastic debris in Jakarta Bay: A preliminary study. Squalen Bull. Mar. Fish. Postharvest Biotech. 15, 109–117. doi:10.15578/squalen.v15i3.462
Ebere, E. C., Wirnkor, V. A., Ngozi, V. E., and Chukwuemeka, I. S. (2019). Macrodebris and microplastics pollution in Nigeria: First report on abundance, distribution and composition. Environ. Anal. Health Toxicol. 34 (4), e2019012. doi:10.5620/eaht.e2019012
Egessa, R., Nankabirwa, A., Basooma, R., and Nabwire, R. (2020a). Occurrence, distribution and size relationships of plastic debris along shores and sediment of northern Lake Victoria. Environ. Pollut. 257, 113442. doi:10.1016/j.envpol.2019.113442
Egessa, R., Nankabirwa, A., Ocaya, H., and Pabire, W. G. (2020b). Microplastic pollution in surface water of Lake Victoria. Sci. Total Environ. 741, 140201. doi:10.1016/j.scitotenv.2020.140201
Gasperi, J., Dris, R., Bonin, T., Rocher, V., and Tassin, B. (2014). Assessment of floating plastic debris in surface water along the Seine River. Environ. Pollut. 195, 163–166. doi:10.1016/j.envpol.2014.09.001
Hastuti, A. R., Yulianda, F., and Wardiatno, Y. (2014). Distribusi spasial sampah laut di ekosistem mangrove Pantai Indah Kapuk, Jakarta. Bonorowo Wetl. 4 (2), 94–107.
Hays, H., and Cormons, G. (1974). Plastic particles found in tern pellets, on coastal beaches and at factory sites. Mar. Pollut. Bull. 5 (3), 44–46. doi:10.1016/0025-326x(74)90234-3
Hidayat, H., Aisyah, S., Rahmadya, A., Husrin, S., Hermana, I. S., Hurley, R., et al. (2022). Quantification of riverbank macroplastic contamination in the lower Citarum River IOP conference series: Earth and environmental science. IOP Conf. Ser. Earth Environ. Sci. 950 (1), 012010. doi:10.1088/1755-1315/950/1/012010
Honingh, D., Van Emmerik, T., Uijttewaal, W., Kardhana, H., Hoes, O., and Van de Giesen, N. (2020). Urban river water level increase through plastic waste accumulation at a rack structure. Front. Earth Sci. (Lausanne). 8, 28. doi:10.3389/feart.2020.00028
IMDC (2011). Summary proceedings: 5th international marine debris conference. retrieved from https://5imdc.wordpress.com/about/proceedings/.
Jambeck, J., Hardesty, B. D., Brooks, A. L., Friend, T., Teleki, K., Fabres, J., et al. (2018). Challenges and emerging solutions to the land-based plastic waste issue in Africa. Mar. Policy 96, 256–263. doi:10.1016/j.marpol.2017.10.041
Jambeck, J. R., Geyer, R., Wilcox, C., Siegler, T. R., Perryman, M., Andrady, A., et al. (2015). Plastic waste inputs from land into the ocean. Science 347 (6223), 768–771. doi:10.1126/science.1260352
Jasmin, H. H., Purba, N. P., Harahap, S. A., Pranowo, W. S., Syamsudin, M. L., and Faizala, I. (2019). The model of macro debris transport before reclamation and in existing condition in Jakarta Bay. J. Ilmu Dan. Teknol. Kelaut. Trop. 11 (1), 131–140. doi:10.29244/jitkt.v11i1.24777
Jasmin, H. H., Purba, N. P., Pranowo, W. S., Pribadi, T. D. K., Syamsudin, M. L., and Ihsan, Y. N. (2020). Marine macro debris transport based on hydrodynamic model before and after reclamation in Jakarta Bay, Indonesia. MyJAS. 5 (2), 100–111. doi:10.37231/myjas.2020.5.2.241
Kosore, C., Ojwang, L., Maghanga, J., Kamau, J., Kimeli, A., Omukoto, J., et al. (2018). Occurrence and ingestion of microplastics by zooplankton in Kenya’s marine environment: First documented evidence. Afr. J. Mar. Sci. 40 (3), 225–234. doi:10.2989/1814232x.2018.1492969
Kuhn, S., Bravo Rebolledo, E. L., and Franeker, J. A. V. (2015). Deleterious effects of litter on marine life,” in Marine anthropogenic litter (Cham: Springer), 75–116.
Kurniawan, S. B., and Imron, M. F. (2019). Seasonal variation of plastic debris accumulation in the estuary of Wonorejo River, Surabaya, Indonesia. Environ. Technol. Innovation 16, 100490. doi:10.1016/j.eti.2019.100490
Laist, D. W. (1997). “Impacts of marine debris: Entanglement of marine life in marine debris including a comprehensive list of species with entanglement and ingestion records,” in Marine Debris (New York, NY: Springer), 99–139.
Lebreton, L. C., Van der Zwet, J., Damsteeg, J. W., Slat, B., Andrady, A., and Reisser, J. (2017). River plastic emissions to the world’s oceans. Nat. Commun. 8, 15611. doi:10.1038/ncomms15611
Lechner, A., Keckeis, H., Lumesberger-Loisl, F., Zens, B., Krusch, R., Tritthart, M., et al. (2014). The danube so colourful: A potpourri of plastic litter outnumbers fish larvae in europe's second largest river. Environ. Pollut. 188, 177–181. doi:10.1016/j.envpol.2014.02.006
Leslie, H. A., Van Velzen, M. J., Brandsma, S. H., Vethaak, A. D., Garcia-Vallejo, J. J., and Lamoree, M. H. (2022). Discovery and quantification of plastic particle pollution in human blood. Environ. Int. 163, 107199. doi:10.1016/j.envint.2022.107199
Loulad, S., Houssa, R., Rhinane, H., Boumaaz, A., and Benazzouz, A. (2017). Spatial distribution of marine debris on the seafloor of Moroccan waters. Mar. Pollut. Bull. 124 (1), 303–313. doi:10.1016/j.marpolbul.2017.07.022
Madzena, A., and Lasiak, T. (1997). Spatial and temporal variations in beach litter on the Transkei coast of South Africa. Mar. Pollut. Bull. 34 (11), 900–907. doi:10.1016/s0025-326x(97)00052-0
Maherlsa, R., Purwiyanto, A. I., Agustriani, F., Putri, W. A., Fauziyah, , and Ferdiansyah, (2019). Identification of surface macro debrisin river flow and estuary of Musi River, South Sumatera province, Indonesia journal of physics: Confere. J. Phys. Conf. Ser.IOP Publ. 1282 (1), 012106. doi:10.1088/1742-6596/1282/1/012106
McCormick, A. R., and Hoellein, T. J. (2016). Anthropogenic litter is abundant, diverse, and mobile in urban rivers: Insights from cross ecosystem analyses using ecosystem and community ecology tools. Limnol. Oceanogr. 61 (5), 1718–1734. doi:10.1002/lno.10328
McIlgorm, A., Campbell, H. F., and Rule, M. J. (2011). The economic cost and control of marine debris damage in the Asia-Pacific region. Ocean Coast. Manag. 54 (9), 643–651. doi:10.1016/j.ocecoaman.2011.05.007
Meijer, L. J., van Emmerik, T., van der Ent, R., Schmidt, C., and Lebreton, L. (2021). More than 1000 rivers account for 80% of global riverine plastic emissions into the ocean. Sci. Adv. 7 (18), eaaz5803. doi:10.1126/sciadv.aaz5803
Merga, L. B., Redondo-Hasselerharm, P. E., Van den Brink, P. J., and Koelmans, A. A. (2020). Distribution of microplastic and small macroplastic particles across four fish species and sediment in an African lake. Sci. Total Environ. 741, 140527. doi:10.1016/j.scitotenv.2020.140527
Migwi, F. K., Ogunah, J. A., and Kiratu, J. M. (2020). Occurrence and spatial distribution of microplastics in the surface waters of Lake Naivasha, Kenya. Environ. Toxicol. Chem. 39 (4), 765–774. doi:10.1002/etc.4677
Mihai, F. C., Gündoğdu, S., Khan, F. R., Olivelli, A., Markley, L. A., and Van Emmerik, T. (2022). “Plastic pollution in marine and freshwater environments: Abundance, sources, and mitigation,” in Emerging Contaminants in the Environment (Elsevier), 241–274.
Moore, C. J., Lattin, G. L., and Zellers, A. F. (2011). Quantity and type of plastic debris flowing from two urban rivers to coastal waters and beaches of Southern California. Revista de Gestão Costeira Integrada-Journal Integr. Coast. Zone Manag. 11 (1), 65–73. doi:10.5894/rgci194
Newman, S., Watkins, E., Farmer, A., Ten Brink, P., and Schweitzer, J. P. (2015). “The economics of marine litter,” in Marine Anthropogenic Litter (Cham: Springer), 367–394.
Ngupula, G. W., Kayanda, R. J., and Mashafi, C. A. (2014). Abundance, composition and distribution of solid wastes in the Tanzanian waters of Lake Victoria. Afr. J. Aquatic Sci. 39 (2), 229–232. doi:10.2989/16085914.2014.924898
Nkwachukwu, O. I., Chima, C. H., Ikenna, A. O., and Albert, L. (2013). Focus on potential environmental issues on plastic world towards a sustainable plastic recycling in developing countries. Int. J. Industrial Chem. 4 (1), 34–13. doi:10.1186/2228-5547-4-34
Opfer, S., Arthur, C., and Lippiatt, S. (2012). NOAA marine debris shoreline survey field guide. retrieved from: https://repository.oceanbestpractices.org/handle/11329/1434.
Owens, K. A., Divakaran Sarasamma, J., Conlon, K., Kiruba, S., Biju, A., Vijay, N., et al. (2022). Empowering local practitioners to collect and report on anthropogenic riverine and marine debris using inexpensive methods in India. Sustainability 14 (3), 1928. doi:10.3390/su14031928
Owens, K. A., and Kamil, P. I. (2020). Adapting coastal collection methods for river assessment to increase data on global plastic pollution: Examples from India and Indonesia. Front. Environ. Sci. 7, 208. doi:10.3389/fenvs.2019.00208
Owens, K. A. (2018). Using experiential marine debris education to make an impact: Collecting debris, informing policy makers, and influencing students. Mar. Pollut. Bull. 127, 804–810. doi:10.1016/j.marpolbul.2017.10.004
Pamungkas, B., Kurnia, R., and Riani, E. (2021). Potential plastic waste input from Citarum River, Indonesia. Aquac. Aquarium, Conservation Legislation 14 (1), 103–110.
Peller, J. R., Nelson, C. R., Babu, B. G., Iceman, C., and Kostelnik, E. (2020). A review of microplastics in freshwater environments: Locations, methods, and pollution loads. Contam. Our Water Identif. Remediat. Methods, 65–90.
Poletti, S. A., and Landberg, T. (2021). Using nature preserve creek cleanups to quantify anthropogenic litter accumulation in an urban watershed. Freshw. Sci. 40 (3), 537–550. doi:10.1086/716214
Priyanka, M., and Dey, S. (2018). Ruminal impaction due to plastic materials-An increasing threat to ruminants and its impact on human health in developing countries. Vet. World 11 (9), 1307–1315. doi:10.14202/vetworld.2018.1307-1315
Purba, N. P., Handyman, D. I., Pribadi, T. D., Syakti, A. D., Pranowo, W. S., Harvey, A., et al. (2019). Marine debris in Indonesia: A review of research and status. Mar. Pollut. Bull. 146, 134–144. doi:10.1016/j.marpolbul.2019.05.057
Rahmania, R., Setiawan, A., Tussadiah, A., Kusumaningrum, P. D., Prihantono, J., Gautama, B. G., et al. (2021). Mapping seasonal marine debris patterns and potential hotspots in banten Bay, Indonesia IOP conference series: Ear. IOP Conf. Ser. Earth Environ. Sci.IOP Publ. 763 (1), 012056. doi:10.1088/1755-1315/763/1/012056
Ramaswamy, V., and Sharma, H. R. (2011). Plastic bags–threat to environment and cattle health: A retrospective study from gondar city of Ethiopia. IIOAB J. 2 (1), 6–11.
Rayne, S. (2008). The need for reducing plastic shopping bag use and disposal in Africa. Afr. J. Environ. Sci. Technol. 2 (3).
Remi- Adewunmi, B. D., Olukosi, J. O., Gyang, E. O., and Abdullahi, U. S. (2011). The economic implications of rumen foreign body impaction in small ruminants in northern Nigeria’, Proceedings of the 5th Pan- Commonwealth Veterinary Conference, Accra, Ghana, 20–25 March 2011. J. Commonw. Veterinary Assoc. Special Issue 27 (2), 214.
Reynolds, C., and Ryan, P. G. (2018). Micro-plastic ingestion by waterbirds from contaminated wetlands in South Africa. Mar. Pollut. Bull. 126, 330–333. doi:10.1016/j.marpolbul.2017.11.021
Rochman, C. M., Browne, M. A., Underwood, A. J., Van Franeker, J. A., Thompson, R. C., and Amaral Zettler, L. A. (2016). The ecological impacts of marine debris: Unraveling the demonstrated evidence from what is perceived. Ecology 97 (2), 302–312. doi:10.1890/14-2070.1
Ryan, P. G. (1989). The effects of ingested plastic and other marine debris on seabirds. Proc. second Int. Conf. Mar. debris 2 (7), 623–634.
Sadan, Z., and De Kock, L. (2021). Plastic Pollution in Africa: Identifying policy gaps and opportunities. Cape Town, South Africa: WWF South Africa.
Sakti, A. D., Rinasti, A. N., Agustina, E., Diastomo, H., Muhammad, F., Anna, Z., et al. (2021). Multi-scenario model of plastic waste accumulation potential in Indonesia using integrated remote sensing, statistic and socio-demographic data. ISPRS Int. J. Geoinf. 10 (7), 481. doi:10.3390/ijgi10070481
Sari, M. M., Andarani, P., Notodarmojo, S., Harryes, R. K., Nguyen, M. N., Yokota, K., et al. (2022). Plastic pollution in the surface water in Jakarta, Indonesia. Mar. Pollut. Bull. 182, 114023. doi:10.1016/j.marpolbul.2022.114023
Schmidt, C., Krauth, T., and Wagner, S. (2017). Export of plastic debris by rivers into the sea. Environ. Sci. Technol. 51, 12246–12253. doi:10.1021/acs.est.7b02368
Sheavly, S. B., and Register, K. M. (2007). Marine debris & plastics: Environmental concerns, sources, impacts and solutions. J. Polym. Environ. 15 (4), 301–305. doi:10.1007/s10924-007-0074-3
Sigler, M. (2014). The effects of plastic pollution on aquatic wildlife: Current situations and future solutions. Water Air Soil Pollut. 225 (11), 2184. doi:10.1007/s11270-014-2184-6
Smith-Sebasto, N. J., and D'Costa, A. (1995). Designing a likert-type scale to predict environmentally responsible behavior in undergraduate students: A multistep process. J. Environ. Educ. 27 (1), 14–20. doi:10.1080/00958964.1995.9941967
Sruthy, S., and Ramasamy, E. V. (2017). Microplastic pollution in vembanad lake, Kerala, India: The first report of microplastics in Lake and estuarine sediments in India. Environ. Pollut. 222, 315–322. doi:10.1016/j.envpol.2016.12.038
Statista (2022). Population density in the U.S. by federal states including the District of Columbia in 2021. retrieved from: https://www.statista.com/statistics/183588/population-density-in-the-federal-states-of-the-us/.
Teuten, E. L., Saquing, J. M., Knappe, D. R., Barlaz, M. A., Jonsson, S., Björn, A., et al. (2009). Transport and release of chemicals from plastics to the environment and to wildlife. Phil. Trans. R. Soc. B 364 (1526), 2027–2045. doi:10.1098/rstb.2008.0284
Thapa, B. (1999). Environmentalism: The relation of environmental attitudes and environmentally responsible behaviors among undergraduate students. Bull. Sci. Technol. Soc. 19 (5), 426–438. doi:10.1177/027046769901900512
U.S. Census (2022). Decennial Census. retrieved from: https://www.census.gov/programs-surveys/decennial-census/about/rdo.html.
van Calcar, C. V., and van Emmerik, T. V. (2019). Abundance of plastic debris across European and Asian rivers. Environ. Res. Lett. 14 (12), 124051. doi:10.1088/1748-9326/ab5468
van Emmerik, T., Loozen, M., van Oeveren, K., Buschman, F., and Prinsen, G. (2019a). Riverine plastic emission from Jakarta into the ocean. Environ. Res. Lett. 14 (8), 084033. doi:10.1088/1748-9326/ab30e8
van Emmerik, T., and Schwarz, A. (2020). Plastic debris in rivers. WIREs Water 7 (1), e1398. doi:10.1002/wat2.1398
van Emmerik, T., Strady, E., Kieu-Le, T. C., Nguyen, L., and Gratiot, N. (2019b). Seasonality of riverine macroplastic transport. Sci. Rep. 9 (1), 13549–9. doi:10.1038/s41598-019-50096-1
Vince, J., and Hardesty, B. D. (2017). Plastic pollution challenges in marine and coastal environments: From local to global governance. Restor. Ecol. 25 (1), 123–128. doi:10.1111/rec.12388
Vincent, A. E., and Hoellein, T. J. (2017). Anthropogenic litter abundance and accumulation rates point to seasonal litter sources on a Great Lakes Beach. J. Contemp. Water Res. Educ. 160 (1), 72–84. doi:10.1111/j.1936-704x.2017.03241.x
Vriend, P., Hidayat, H., van Leeuwen, J., Cordova, M. R., Purba, N. P., Löhr, A. J., et al. (2021). Plastic pollution research in Indonesia: State of science and future research directions to reduce impacts. Front. Environ. Sci. 187. doi:10.3389/fenvs.2021.692907
Wandeka, C. M., Kiggundu, N., and Mutumba, R. (2022). Plastic packaging: A study on plastic imports in Uganda. Int. J. Sci. Adv. 3, 19–26. doi:10.51542/ijscia.v3i1.2
Willis, K., Hardesty, B. D., Kriwoken, L., and Wilcox, C. (2017). Differentiating littering, urban runoff and marine transport as sources of marine debris in coastal and estuarine environments. Sci. Rep. 7, 44479. doi:10.1038/srep44479
World Bank (2022). Population density. retrieved from: https://data.worldbank.org/indicator/EN.POP.DNST.
Keywords: plastic, freshwater, Uganda, Indonesia, United States, perception, policy, content analysis
Citation: Owens KA, Kamil PI and Ochieng H (2023) River engage: Insights on plastic debris polluting the Aturukuku River in Uganda, the Ayung River in Indonesia, and the Connecticut River in the United States. Front. Environ. Sci. 10:1081208. doi: 10.3389/fenvs.2022.1081208
Received: 27 October 2022; Accepted: 06 December 2022;
Published: 04 January 2023.
Edited by:
Pierre Girard, Federal University of Mato Grosso, BrazilReviewed by:
Veerasingam S., Qatar University, QatarSusete Wambier Christo, Universidade Estadual de Ponta Grossa, Brazil
Copyright © 2023 Owens, Kamil and Ochieng. This is an open-access article distributed under the terms of the Creative Commons Attribution License (CC BY). The use, distribution or reproduction in other forums is permitted, provided the original author(s) and the copyright owner(s) are credited and that the original publication in this journal is cited, in accordance with accepted academic practice. No use, distribution or reproduction is permitted which does not comply with these terms.
*Correspondence: Katharine A. Owens, a293ZW5zQGhhcnRmb3JkLmVkdQ==