 Zehao Huang1†
 Yuanjian Yang
 Xueyan Bi
 Wanju Li
94% of researchers rate our articles as excellent or good
Learn more about the work of our research integrity team to safeguard the quality of each article we publish.
Find out more
ORIGINAL RESEARCH article
Front. Environ. Sci., 06 December 2022
Sec. Atmosphere and Climate
Volume 10 - 2022 | https://doi.org/10.3389/fenvs.2022.1078820
This article is part of the Research TopicClimate-Environment Interactions under Global WarmingView all 25 articles
Warm-sector heavy rainfall in South China is a frequent type of precipitation in summer in the Pearl River Delta region. The complexity of the mechanisms involved in the triggering of convection, especially the effects of urbanization, has greatly increased the uncertainty of numerical simulations of warm-sector heavy rainfall. In this study, five new surface parameters with five new anthropogenic heat (AH) parameters were constructed and coupled with the urban canopy model (UCM) of the Weather Research and Forecasting model, version 4.1, based on the local climate zone system over the Pearl River Delta Urban Agglomeration (PRDUA). Taking a typical warm-sector heavy rainfall process that occurred in the PRDUA on 20 April 2019 as an example, five groups of experiments involving different schemes were compared and analyzed, revealing that the precipitation simulated using the localized UCM with the new AH parameters was the best (closest to observations). The localized UCM successfully simulated the increase in 2 m temperature and sensible heat flux and the resultant thermal forcing in urban areas, which promoted the convergence of low-level southerly winds with water vapor and the lifting of the lower-layer warm and humid water vapor to the upper layers in the urban center, leading to a significant increase of precipitation. The improved AH parameters enhanced the anthropogenic heat and its vertical conduction in urban areas, but contributed only marginally to the convergence of 10 m winds. Compared with observations from wind profile radar, it was found that the localized UCM enhanced the accuracy of the simulated horizontal wind field convergence at upper and lower levels, while the improved AH parameters enhanced the accuracy of the simulated low-level jet intensity and vertical movement, which are important drivers for the spatial variation in warm-sector heavy rainfall over the PRDUA. The current findings will be helpful for improving the model skill in simulating warm-sector heavy rainfall over high-density urban areas, as well as enhancing understanding of the impact mechanism of urbanization on the occurrence and development of warm-sector heavy rainfall.
With rapid urbanization, the altered urban underlying surface modulates the processes of radiation, energy balance, turbulent motion and water budget, which have a significant impact on the weather and climate over the city and its surrounding areas (Oke et al., 2017). In particular, the effects of urbanization play essential roles in precipitation (Luo et al., 2016; Lin et al., 2020; Li W. et al., 2021). The Pearl River Delta (PRD) region, located in the tropics and subtropics and supplied in the south with abundant water vapor from the tropical ocean, has become one of the largest urban agglomerations in China. Under the action of the Asian monsoon, the western Pacific subtropical high, and thermodynamic forcing of the Qinghai–Tibet Plateau, the region is one of the areas in China with the highest incidence of heavy precipitation (Zhou et al., 2008; Zhang et al., 2010).
During the April–June pre-flood period in the PRD region, many heavy rainfall events occur in the warm sector in front of a cold front, termed “warm-sector heavy rainfall” (Huang et al., 1986). In detail, warm-sector heavy rainfall generally refers to heavy rainfall on the side of the warm area 200–300 km from the surface front, or heavy rainfall processes that occur in the converging southwestly and southeastly winds, or even in the southwestly flow without shear, and are not controlled by tropical systems such as typhoons (Huang et al., 1986). This type of rainstorm is usually generated under high temperatures, high humidity, and unstable conditions, with highly intense and sudden precipitation (Jiang et al., 2017; Li W. et al., 2021) that brings urban flooding and thus a serious threat to the lives and property of local people. Due to the lack of forcing from synoptic-scale baroclinic systems such as fronts, shear or low vortices, the warm-sector heavy rainfall of South China has long been a challenging forecasting issue (Chen et al., 2015; Luo et al., 2020; Wu et al., 2020).
In recent years, with the rapid development of modern meteorological detection methods and high-resolution mesoscale models, considerable progress has been made in studying the mesoscale characteristics, occurrence and development mechanisms, and predictability of warm-sector heavy rainfall (Huang et al., 1986; Lin et al., 2006; Chen et al., 2012; He et al., 2016; Li W. et al., 2021). In terms of the mechanism triggering the development of warm-sector heavy rainfall in South China, it has been found that low-level jets (LLJs) in this region are prone to convergent upward motion and the triggering of convective generation over the “trumpet” topography of the PRD region (Wu and Luo, 2016; Chen et al., 2017; Li M. et al., 2020), in which the boundary layer jet rapids are closely related to the appearance and maintenance of warm-sector heavy rainfall in coastal South China (Du and Chen, 2018; Zeng et al., 2019). Before the occurrence of warm-sector heavy rainfall in South China, strong convection and strengthening of radial winds in the Bay of Bengal (Li et al., 2015) and sea surface temperature anomalies in the eastern equatorial Pacific Ocean often occur (Li Z. et al., 2020). In particular, the urban heat island effect, linked with the size of the city, will also affect the intensity and fall area of warm-sector heavy rainfall over the PRDUA (Du and Chen, 2019).
To more accurately describe the impact of urbanization in numerical modeling, the main approach now is to couple an urban canopy model (UCM) with the numerical model (Ching, 2013). Currently, the UCM in the Weather Research and Forecasting (WRF) model divides cities into four types (low-density residential areas, high-density residential areas, commercial areas, and industrial areas), but WRF does not provide information on these four types of cities, except for cities in the United States. To solve the problem of classifying the urban underlying surface, Stewart and Oke (2012) proposed the concept of Local Climate Zones (LCZs), which divides cities into 10 categories according to building height, density, and land use/land cover (Stewart and Oke, 2012). Since the LCZ system was proposed, more than 130 cities around the world have established corresponding categorical data, most of which are European and Asian (Jiang et al., 2020; Li N. et al., 2021; Yang et al., 2022). Since 2018, LCZ data have been introduced into the WRF model, and studies have been conducted on urban climate, urban heat islands, urban air pollution, urban extreme high temperatures, and urban extreme precipitation (Tse et al., 2018; Molnár et al., 2019; Mughal et al., 2019; Wong et al., 2019; Yang et al., 2022; Zong et al., 2021). After the introduction of LCZ classification with its 10 categories of urban underlying surface, the simulation results in cities and their surrounding areas are generally improved, especially in terms of the spatial distribution of meteorological fields (Mu et al., 2019; Patel et al., 2020).
Based on the LCZ classification system, this study divided the urban underlying surface of the PRDUA into five main categories with a horizontal resolution of 100 m. Then, it was introduced and updated in the UCM of WRF, version 4.1 (WRF4.1). In addition, a new and improved anthropogenic heat (AH) parameters was coupled with the UCM of WRF4.1 over the PRDUA. Taking a typical warm-sector heavy rainfall process in the PRDUA on 20 April 2019 as an example, five groups of experiments with different schemes were conducted to explore the influence of the thermodynamic vertical structure and the urbanization within the boundary layer on the simulation of this rainfall process and its causes. Section 2 describes the urban surface parameters and AH settings for the PRDUA in the UCM, and the design of the five groups of experiments. Section 3 analyzes the improvement of the underlying surface parameters, urbanization, and the effects of AH on warm-sector heavy rainfall. Concluding remarks are given in Section 5.
Based on the types of urban construction and planning in the PRDUA, the underlying urban surface was classified into five categories using the LCZ classification system: high-rise, mid-rise, low-rise, large low-rise, and heavy industry. Firstly, Landsat satellite remote sensing data in summer 2014 and building height inversion data were used to establish an urban underlying surface classification dataset in the PRDUA with a 100 m horizontal resolution (Figure 1B) (Li N. et al., 2021). Secondly, instead of the default one-type urban surface in the UCM of WRF4.1, these five classifications of urban underlying surface were introduced, and the data on the proportion of urban built-up area were also updated by using Landsat satellite measurements (Figure 1D), replacing the default single value of 0.9 (i.e., 90% of the grid was built-up area; Figure 1C). Then, the building forms and road information corresponding to the underlying surfaces of five types of cities were introduced into WRF; specifically, the probability distributions of building height, building width, and road width (Figure 2). Finally, in combination with census data for China (Zheng et al., 2017), the air conditioning and energy consumption parameters were updated in the building-energy model (Table 1), replacing the default in WRF based on the parameters of air conditioning in Europe and the United States. The proportions of waste heat in the form of sensible heat or water vapor emissions from air conditioning were also changed; the air conditioning switch times of commercial and residential areas were set from 0,800 to 1800 or from 1800 to 0,800 the next day (LST, local standard time), respectively.
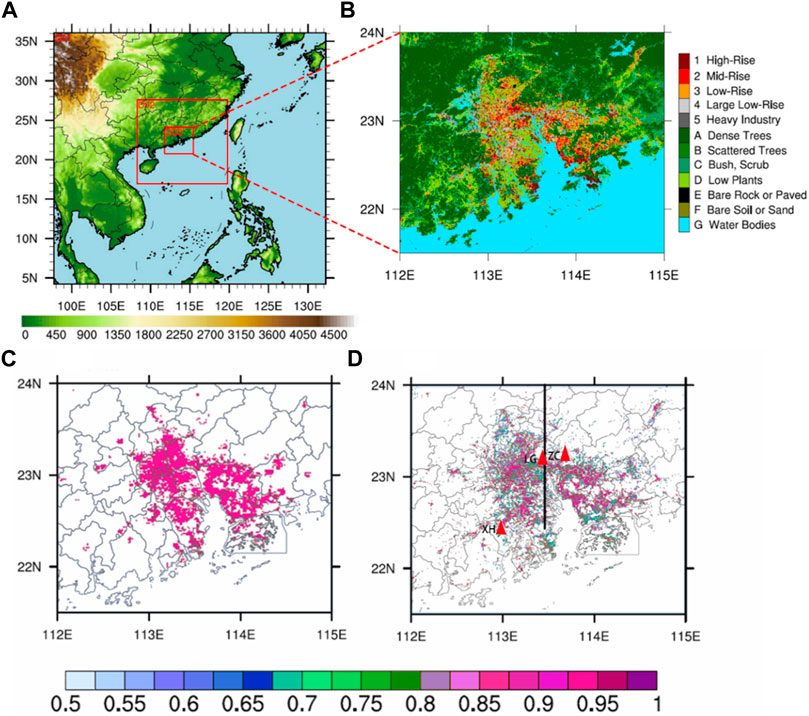
FIGURE 1. (A) Spatial distribution (red frame) and terrain height distribution (shaded; unit: m) of the WRF mesoscale numerical model. (B) Spatial distribution of localized urban land types in the third, finest-scale grid area, along with other land types. (C) Proportion of built-up area in the default urban canopy. (D) Proportion of built-up area in the localized urban canopy. The black line in (D) is the location of the vertical cross section shown in Figures 10, 11. The red triangles indicate the locations of three wind profiler radar (LG: Luogang, ZC: Zengcheng, XH: Xinhui).
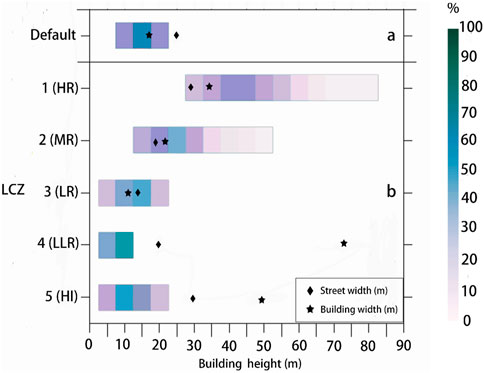
FIGURE 2. Urban form parameters of the (A) default urban canopy and (B) localized urban canopy. Bars represent the probability distributions of building height (unit: m); circles and asterisks represent street width (unit: m) and building width (unit: m), respectively.
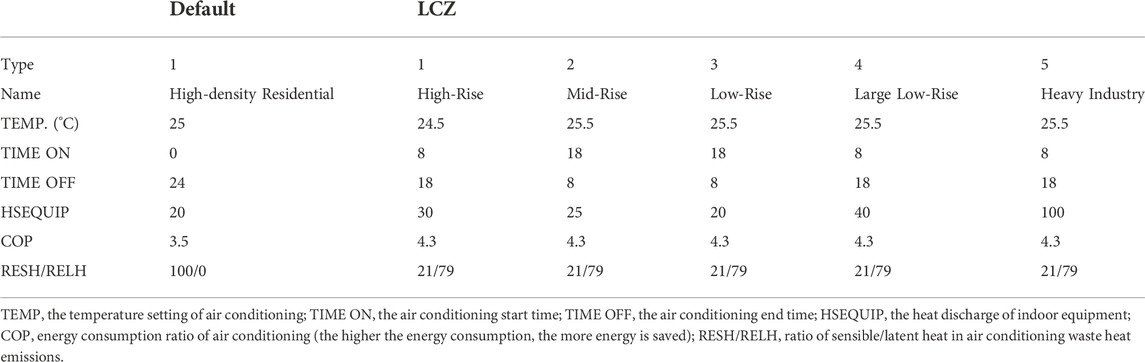
TABLE 1. Candidates residing under the WRF Default 1 category and Localized 5 Categories (candidates) of urban underlying surface and their corresponding building air-conditioning use and energy consumption parameters.
The urban underlying surface classification dataset considered the localized urban information of the PRDUA, which could then be used by the single-layer UCM, multi-layer UCM, and multi-layer building-energy model in WRF4.1. This process of updating and localizing the urban underlying surface dataset made the urban underlying surface and AH emissions in the model more realistic and detailed, which was conducive to improving its ability to simulate the urban meteorology.
Observational data obtained by various methods were used to verify and compare with the simulation results over the PRDUA. These data included hourly precipitation data from a high-density network of 1,180 automatic weather stations and hourly wind field data from wind profiler radars in the areas of Luogang, Zengcheng and Jiangmen Xinhui in Guangdong Province. The P-band tropospheric type-I wind profile radar in Luogang can provide horizontal and vertical wind field information from 150 to 16,230 m, with a vertical resolution of 120 m below 2,670 and 240 m above 2,670 m. The boundary layer wind profile radars in Zengcheng and Jiangmen Xinhui can provide horizontal and vertical wind field information from 100 to 5,980 m above the radar altitude, with a vertical resolution of 60 m. Wind profiler radar data can provide multiple types of long-distance atmospheric turbulence information with high spatial and temporal resolution and a high degree of accuracy (He, 2006). The ECMWF Reanalysis (ERA5; 0.25° × 0.25°; 37 vertical layers; hourly) to analyze synoptic situation for the rainfall event. The ERA5 data is also used to generate the initial and lateral boundary conditions for the numerical simulations.
The mesoscale numerical model WRF4.1 was selected and three two-way nested domains were adopted. The first and coarsest mesh had a horizontal resolution of 9 km and covered the whole of East Asia; the second, finer-scale mesh had a resolution of 3 km and covered the whole of South China Sea and part of the South China Sea; and the third, even finer-scale mesh had a nested resolution of 1 km and covered the whole of the PRD region, with 378 × 378 grid points (Figure 1A). Each domain had 45 vertical layers and 12 vertical layers within 1 km from the ground. The initialization time was 0000 UTC 19 April 2019 and the forecast time was 1200 UTC 21 April, with a model output at 1 h intervals. The WRF double-moment 7-class scheme (Thompson et al., 2008), The NoAH-MP land surface process parameterization scheme (Niu et al., 2011) the RRTMG longwave and shortwave radiation schemes (Iacono et al., 2008), the BouLac boundary layer parameterization scheme (Bougeault and Lacarrere, 1989), and the revised MM5 similarity surface layer scheme, were used for the three domains. The Grell 3D cumulus convection scheme (Grell and Dévényi, 2002) was used for the first, coarsest domain. The initial and boundary conditions were provided by ERA5 with horizontal resolution of 0.25° × 0.25° and a time interval of 1 h.
In order to understand the influence of the urban canopy and AH change on the simulation results of the WRF model, four groups of urban (control) experiments and one rural experiment were designed, as listed in Table 2.
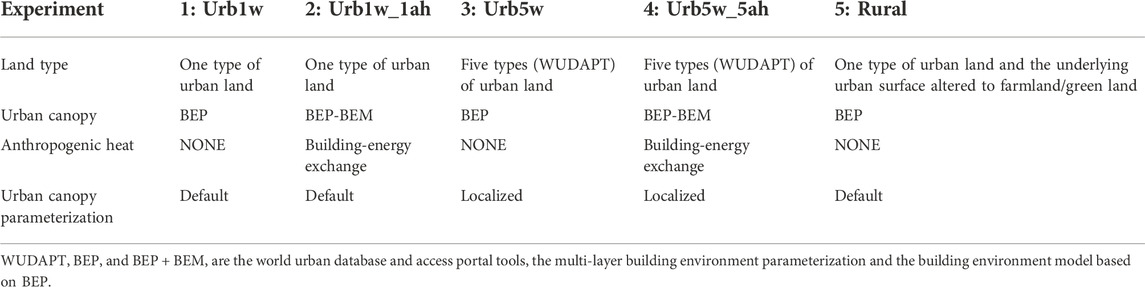
TABLE 2. The five groups of experiments and their urban canopy and anthropogenic heat settings.
A warm-sector heavy rainfall event that occurred from 0800 LST to 2000 LST 20 April 2019 in the PRDUA was selected as an example. The main study area was the PRDUA and its surrounding areas. The 0.25 ° × 0.25 ° hourly ERA5 reanalysis product was used to analyze the case. Figure 3 shows the horizontal divergence of velocity at 950 hPa, the water vapor flux dispersion at 950 hPa, the pseudo-relative potential temperature at 850 hPa, the relative vorticity at 850 hPa, and the geopotential height at 500 hPa at 0700 LST 20 April 2019. Figure 3A shows that the western Pacific subtropical high reached close to 14°N and 104°E, and the ridge of the subtropical high was over the northern part of the South China Sea. Southern Guangdong was influenced by the subtropical high as well as the southwest monsoon. At 500 hPa, the coastal areas of South China were dominated by westerly winds whilst simultaneously being affected by the cold air brought by the East Asian trough over the Tibetan Plateau. Figures 3B–D show that southerly winds controlled the South China coast and delivered sufficient warm, moist air to the area at 850 hPa and 950 hPa. A negative center of water vapor flux dispersion (Figure 3E) appeared at the lower levels in the PRDUA, indicating that there was a convergence of water vapor, which provided positive water vapor conditions for precipitation. At 950 hPa (Figure 3D), wind speeds decreased significantly when the southly winds reached the PRDUA, while the southwestly winds at 850 hPa increased significantly, indicating that low-level winds converged and the horizontal wind direction rotated clockwise in urban areas. Figure 3B shows that the pseudo-relative potential temperature in the PRDUA was higher than in the surrounding areas at 850 hPa, indicating that the PRDUA was in a warm and humid environment. The low-level southerly winds transported the warm and humid air of the ocean to the urban area, which was thermodynamically uplifted in the urban area, where it then met the cold air from the north and triggered this warm-sector heavy rainfall event in the PRDUA in South China. Precipitation first appeared in the northwest of Guangdong, and cold air from the north continued to invade the Guangdong under the action of the strong northwestly winds, thereby forming a southwest–northeast-oriented rainband. At 1200 LST 20 April 2019, the rainband arrived at the PRDUA and warm-sector heavy rainfall occurred, with a maximum cumulative precipitation of 82 mm in 3 h and a maximum precipitation intensity of 72.7 mm/h. The rainband then moved southwards over the ocean and disappeared. The precipitation process can be divided into two stages: during 0,800–1200 LST, the rainband had not reached the urban area; and during 1,200–2000 LST, precipitation occurred over the PRDUA. This paper focuses on analyzing the changes in meteorological elements in the urban area during the first stage, before the occurrence of precipitation.
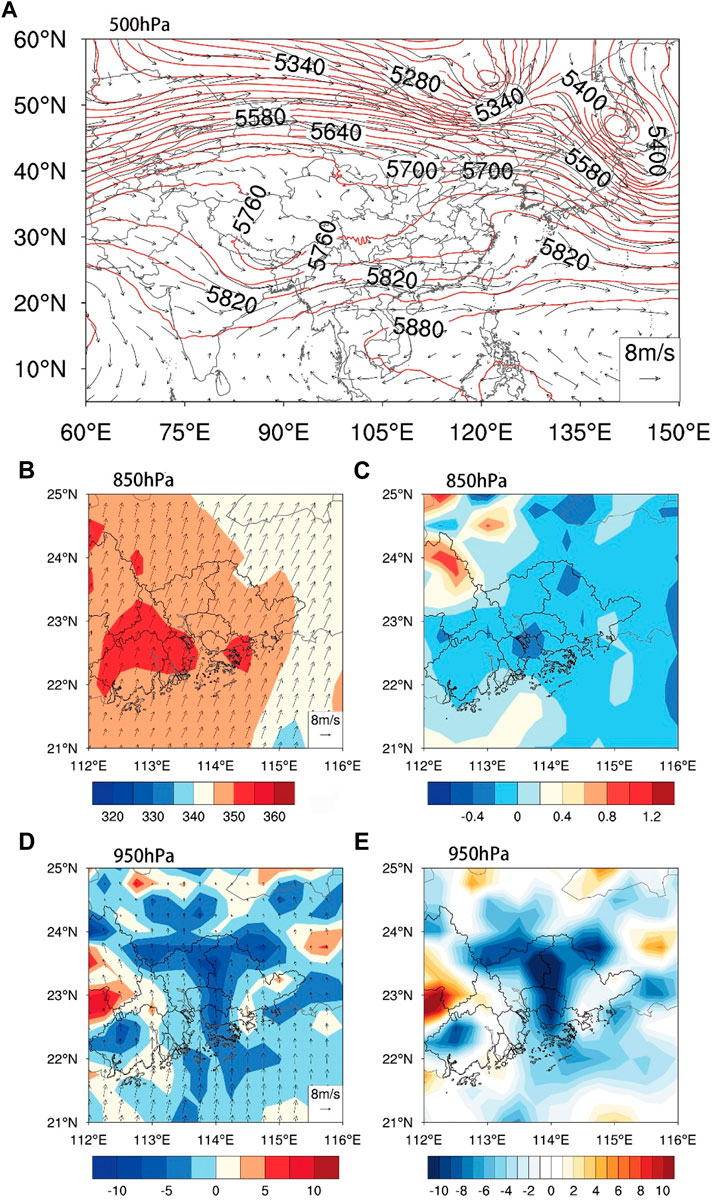
FIGURE 3. The (A) geopotential height (red contours; unit: gpm) at 500 hPa, (B) pseudo-phase temperature (color shading; unit: K) and horizontal wind (arrows; unit: m·s−1) at 850 hPa, (C) 850 hPa relative vorticity field (color shading; unit: s−1), (D) 950 hPa horizontal wind (arrows; unit: m·s−1) and horizontal divergence of velocity field (color shading; unit: s−1), and (E) 950 hPa water vapor flux divergence field (color shading; unit:10 g·cm−1 s−1 hPa−1) at 0700 LST 20 April 2019.
Figure 4A shows the distribution of 12-h cumulative precipitation observed by the high-density network of automatic weather stations in Guangdong. There were three main heavy precipitation centers, which were the northwest–southeast-oriented heavy precipitation rainband in the Luogang area of Guangzhou, the northeastern part of Guangzhou, and the Hong Kong area, respectively. The maximum 12-h cumulative precipitation in all three areas exceeded 70 mm. Among them, Guangzhou’s Luogang area had the most extensive rainband and the greatest intensity of precipitation. In all five experimental groups, the heavy precipitation rainband in the Luogang area of Guangzhou could be simulated, but the heavy precipitation areas were shifted to the south compared with the observed precipitation distribution. Compared with the other four groups, the Urb5w_5ah experimental group, with the addition of new urban surfaces and AH, simulated the largest area of intense precipitation in the Luogang area of Guangzhou, which is more practical. In addition, Urb5w_5ah also simulated the area of intense precipitation in northeastern Guangzhou and the intensity of precipitation in the Luogang area of Guangzhou well (Figure 4E). The rainband pattern simulated by the Urb5w experimental group in the Luogang area of Guangzhou was closer to the actual precipitation distribution, but the intensity of precipitation in urban areas was underestimated (Figure 4D). In the rural experiment, due to the lack of urban thermal uplift, and although a certain amount of precipitation in urban areas was simulated, the precipitation range and precipitation intensity were smaller than observed (Figure 4F).
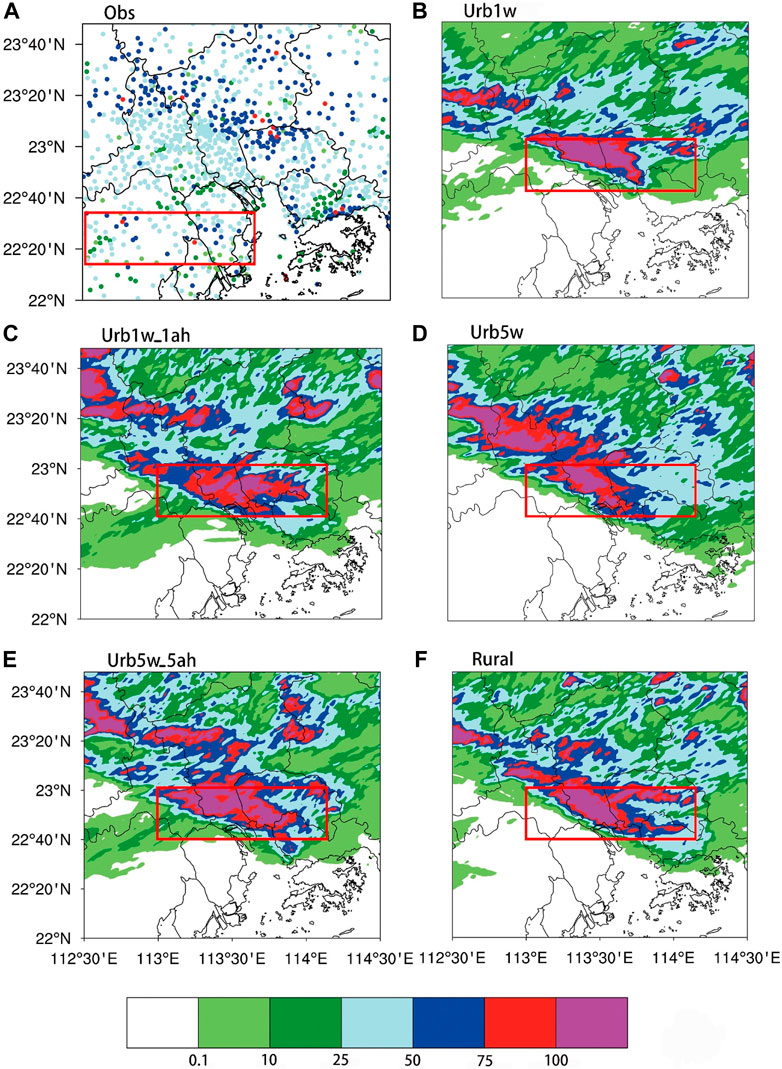
FIGURE 4. Distribution of 12-h cumulative precipitation (unit: mm) during 0,800–2000 LST 20 April in (A) automatic weather station observations, (B) Urb1w, (C) Urb1w_1ah, (D) Urb5w, (E) Urb5w_5ah, and (F) Rural (red box: precipitation bias in the simulations).
In order to quantitatively assess the simulation results of this warm-sector heavy rainfall in the five experimental groups, three evaluation indices—bias (Bias), mean absolute error (MAE), and root-mean-square error (RMSE)—were selected, and the results are shown in Table 3. Since the precipitation area was relatively wide, in order to evaluate the model’s performance in simulating the heavy precipitation, hourly observations based on 50 automatic weather stations in three chosen regions of South China, with high spatiotemporal density, were employed. The precipitation on the grid was matched to the vicinity of the site. Two methods—matching the nearest grid point and averaging the nine surrounding grid points—were selected, and the former was found to be more reasonable. After coupling the new UCM and adding AH, all evaluation indices showed a significant improvement in the accuracy of the simulated precipitation. The RMSE of the Urb5w_5ah experimental group improved by 8.8% compared with the original scheme, Urb1w_1ah. The RMSE improved by 5.9% in the Urb5w-5ah experimental group compared with the Rural experimental group. With AH only, the RMSE of the Urb5w_5ah experimental group improved by 15.8% over the Urb5w experimental group.
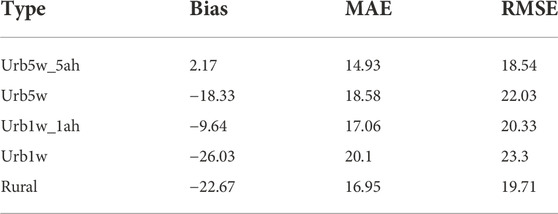
TABLE 3. Assessment of model-simulated precipitation.
Meanwhile, Figure 4 shows that the five experimental groups all overestimated the rainfall over the region (22°40′ N to 23°N, 113°N to 114°N) in this simulation case. This might be because that the precipitation in the southwest coastal region (red box in Figure 4A: 22°15′ N to 22°35′ N, 113°30′ N to 114°30′ N) was shifted to the northeast (red box in Figures 4B–F) in the simulations, which was enhanced by the urbanization effect. The shifted simulation bias might be that the simulated precipitation usually has a wet bias with a large area or a dry bias with a small in these five experiment groups, which is probaby related to the selected cloud microphysical scheme and the boundary layer parameterization scheme (Wan et al., 2017). More studies are needed, however, this is beyond the scope of this study.
To reduce the impact of simulated precipitation errors on the evaluation results, the stations in urban areas with heavy precipitation (22°55′ N to 23°41′ N, 112°32′ E to 114°24′ E) were selected to evaluate simulation results, which is outside of the region with large simulation biases (22°40′ N to 23°N, 113°N to 114°N). Table 3 shows that the urb5w_5ah slightly overestimates precipitation and the urb1w_1ah underestimates precipitation in this area. Table 3 shows that the precipitation bias of the urb5w_5ah is 2.17 mm/h while that of the urb1w_1ah is -9.64 mm/h in the area. Figure 5 shows the distribution of 08–12 LST, 08–16 LST and 08–20 LST cumulative precipitation. It can be found that precipitation pattern simulated by the Urb5w_5ah is more consistent with the observation in urban areas (inside the black box) during 08–16 LST, indicating that the urb5w_5ah scheme can improve the precipitation simulation in urban area. Impacts of the localized UCM and improved AH parameters.
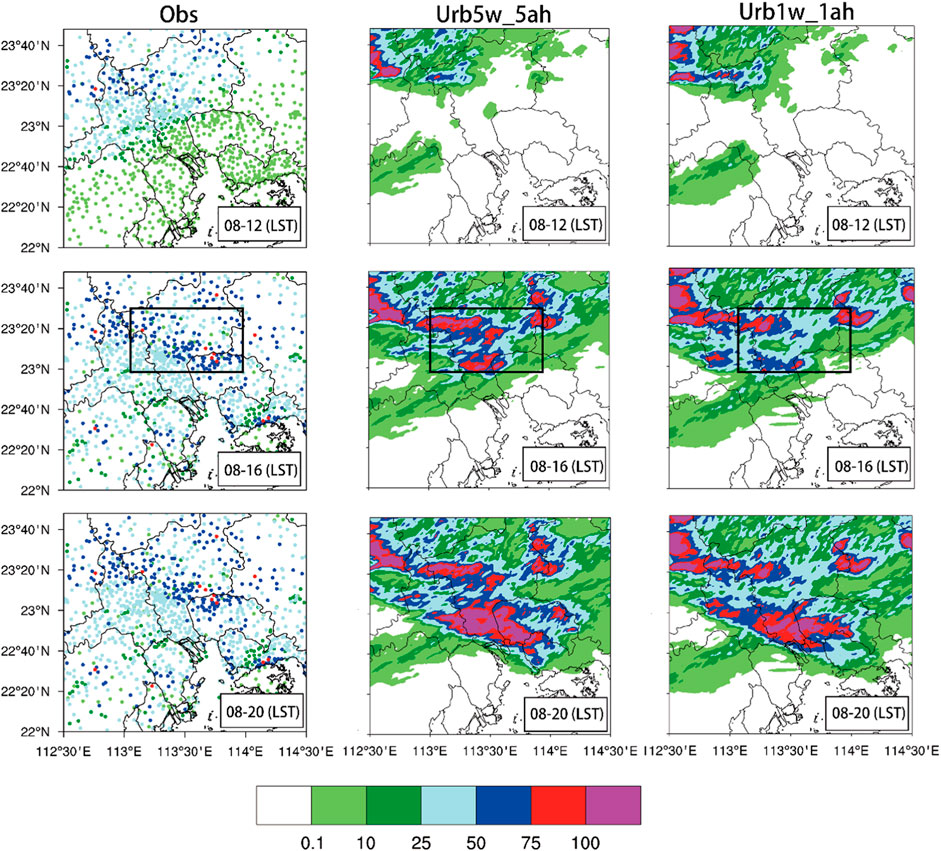
FIGURE 5. Distribution of 4-h cumulative precipitation (unit: mm) during 0,800–2000 LST 20 April (black box: urban areas with heavy precipitation).
In order to evaluated the simulation of 2 m temperature and 10 m wind field in the PRDUA, the study compared the results of the Observation with the two experimental groups (Urb5w_5ah and Urb1w_1ah) (Figure 6). Considering the deviations in precipitation location and intensity after the improvement of the subsurface, the cumulative precipitation in the Urb5w_5ah and Urb1w_1ah experimental groups was compared to reveal the effect of the new urban canopy on the precipitation. Results showed that the intensity of precipitation in the PRDUA was significantly enhanced after adopting the new urban surface parameters (Figure 7A). Different schemes for the underlying surface will affect the atmospheric circulation, convection, and precipitation by influencing the urban heat and momentum as well as the water vapor exchange. Next, we analyze the influence of the new surface parameters on this warm-sector heavy rainfall by comparing several meteorological elements including the 2 m temperature, sensible heat flux, latent heat flux, 10 m wind, and 2 m specific humidity in the five experimental groups.
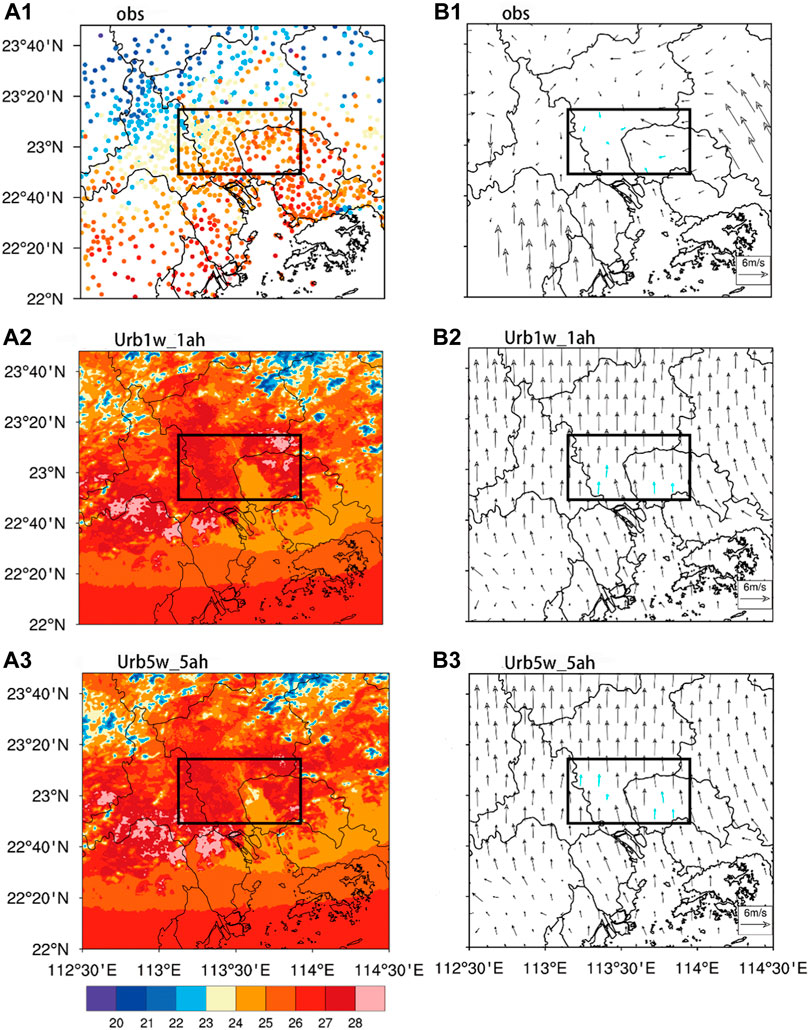
FIGURE 6. Comparison between observations and two sets of model-simulated meteorological elements from 0,800 to 1000 LST 20 April: (A1) observations of 2 m temperature (unit: °C); (A2) Urb1w_1ah simulated 2 m temperature (unit: °C); (A3) Urb5w_5ah simulated 2 m temperature (unit: °C); (B1) observations of 10 m wind speed (unit: m·s−1); (B2) Urb1w_1ah simulated 10 m wind speed (unit: m·s−1); (B3) Urb5w_5ah simulated 10 m wind speed (unit: m·s−1). (The black box represents the precipitation centers in urban areas, the cyan arrows represent the locations where the horizontal wind speed decreases in urban areas).
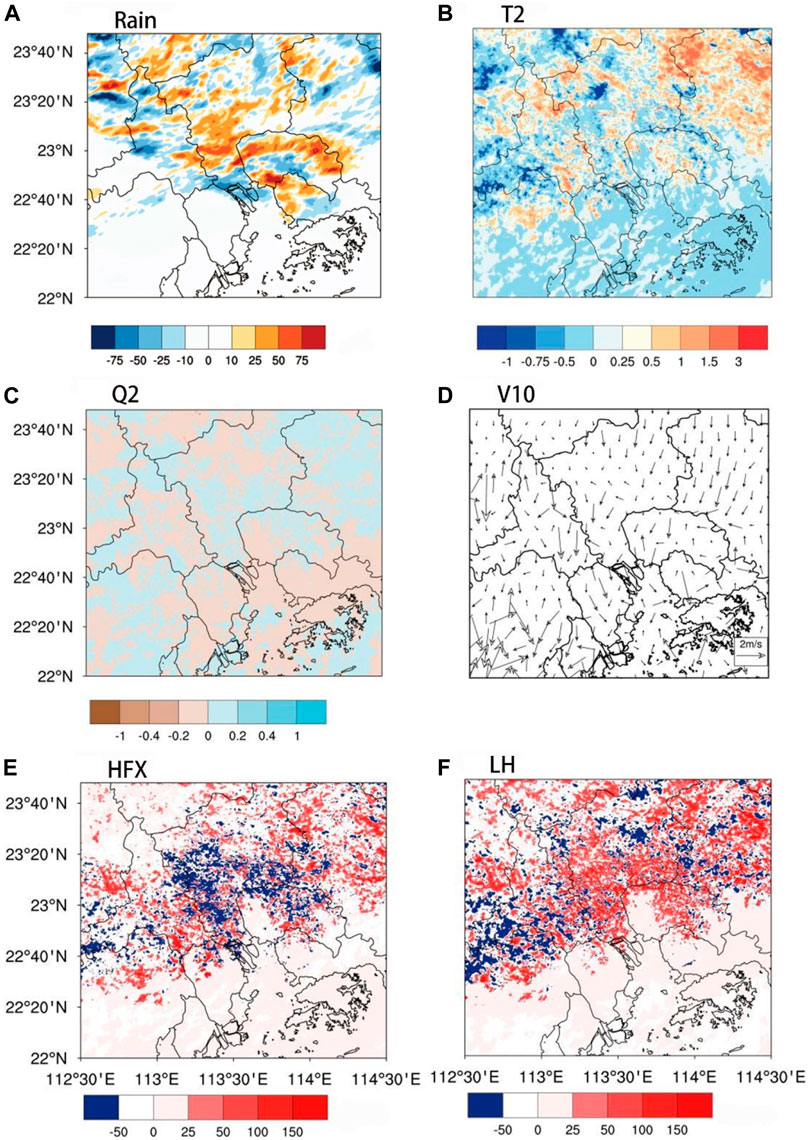
FIGURE 7. Difference between the urb5w_5ah and urb1w_1ah experimental groups in their simulation of meteorological elements from 0,800 to 2000 LST 20 April: (A) cumulative precipitation (unit: mm); (B) average 2 m temperature (unit: °C); (C) average 2 m specific humidity (unit: g·kg−1); (D) average horizontal wind (unit: m·s−1) (in the figure, the stronger the north wind in urban areas, the larger the urban deceleration and convergence effect); (E) average surface upward sensible heat flux (unit: W·m−2); (F) average surface upward latent heat flux (unit: W·m−2).
Figure 6A1 shows the observed 2 m temperature distribution, from which it can be seen that, during this precipitation process, the urban area of Guangzhou was warmer compared with the surrounding areas and the higher-temperature areas were mainly located near the PRD. Both experimental groups broadly simulated the high-temperature areas (Figures 6A2, 6A3), with only some deviation at the highest temperatures. Considering the 10 m horizontal wind (Figure 6B1), southly winds were dominant in the PRD region. The suburban areas had strong wind speeds because of the sparsity of the buildings and their low height, and the 10 m wind decelerated significantly when reaching the urban area of Guangzhou. After adopting the new urban canopy (Figures 6A3, 6B3), the 2 m temperature increased in the urban area, the horizontal wind was southeastly in the upwind area of the city and southly in the downwind area, and the wind speed decreased in the urban area of Guangzhou. The wind speed was more consistent with the observation in urban areas. The Urb5w_5ah experimental group had a more pronounced deceleration than the Urb1w_1ah experimental group when the 10 m horizontal wind speed blew across the urban area (Figures 6B1, 6B2), which was more consistent with the observation. However, high-speed 10 m horizontal winds appeared in the southwest of Guangzhou, which were not accurately simulated by both experimental groups.
After adopting the new urban surface parameters, there was a reduction in 2 m temperature in the PRDUA (Figure 7B). The main reason for this may be that the new surface consists of buildings of different heights and, during the day, shortwave radiation is absorbed when it reaches tall buildings and partially reflected back to the atmosphere, preventing it from reaching the ground and low buildings, resulting in shade effects in the PRDUA. In Figure 7E, the change in sensible heat flux is consistent with the 2 m temperature. For the PRDUA, after adopting the new UCM, the direction of sensible heat flux in urban areas shifted to downwards. This may be due to the fact that tall buildings in the new scheme block most of the solar energy, causing heat to gather at a height and preventing it from being transmitted downwards. The latent heat flux at the surface represents the potential heating of the atmosphere by the surface and the exchange of water vapor between the surface and the atmosphere. After adding the new UCM (Figure 7F), the upward latent heat flux in the PRDUA was generally enhanced. The reason may be that the improved urban surface scheme has a stronger effect on the deceleration of low-level winds, resulting in more water vapor converging in the PRDUA and stronger water vapor heat exchange, thus forming a stronger latent heat flux. Adequate water vapor is a necessary condition for precipitation to occur. The effect of the improved urban ground surface scheme (Figure 7C) on the 2 m specific humidity was mainly reflected in the southern Guangzhou urban agglomeration, in which the weakening of near-surface heating due to urban buildings of different heights led to a decrease in surface evaporation, resulting in a certain increase in the 2 m specific humidity in this area. From Figure 7D, it can be seen that southern Guangzhou was dominated by southerly winds and the winds weakened in the urban area. If northly winds appeared in Figure 7D, meaning the new urban surface has a more obvious deceleration effect on the near-surface southerly winds. From Figure 7D, stronger northly winds appears in the urban area and the surrounding horizontal winds were generally weaker. This indicates that the surface building design in the Urb5w_5ah experimental group had a stronger blocking effect on the 10 m horizontal wind in the urban center. The low-level southerly winds carried warm and humid air, which converged in this area and was lifted to the upper levels where it strengthened the southwesterly wind. This high–low wind configuration was conducive to triggering atmospheric instability and enhancing precipitation in the PRDUA.
Due to the accelerated urbanization process, the expansion of the urban area and the increasing number of buildings in the city, the surface roughness, albedo, and vegetation coverage in the urban area have changed dramatically, thus leading to continuous changes in the thermodynamic characteristics of the urban canopy, and the changes in the heat transport and wind field have greatly affected the precipitation in the urban area (Miao et al., 2011; Zhong et al., 2015). By comparing the results of the Urb5w_5ah and Rural experimental groups, the effect of urbanization on precipitation over the PRDUA can be analyzed. By calculating the difference between the precipitation of the two schemes (Figure 8A), it can be seen that the difference is mainly located in the urban area of Guangzhou. Comparing the 2 m temperature distribution before precipitation (Figure 8B), the release of AH in Guangzhou led to an average temperature that was 1.5°C higher in the Urb5w_5ah experimental group than in the Rural experimental group, with the temperature increase in the northwest of Guangzhou even exceeding 3°C. Meanwhile, the heat island effect in the PRDUA was strengthened in the Urb5w_5ah experimental group, resulting in a general increase in upward sensible heat flux in Guangzhou (Figure 8E). The rural surface is mainly covered with vegetation and soil, which has a higher capacity to store water vapor, and therefore has a stronger upward latent heat flux near the surface relative to the impermeable surface in the PRDUA (Figure 8F). At the same time, because the surface temperature is not as high as in urban areas, the heating and lifting effect of water vapor is weak; the 2 m humidity over the rural surface was higher than in the urban area (Figure 8C). Over the rural surface (Figure 8D), due to the reduced roughness of the vegetated surface, the land had a weaker deceleration effect on the southerly winds from the sea. The urban surface, meanwhile, had a convergent lifting effect on the southerly winds near the surface, so the 10 m horizontal wind difference between the Urb5w_5ah and Rural experimental groups was the largest. Due to the differences in the types of surface and their thermal characteristics between the urban and rural areas, the near-surface temperature increased in the urban areas and the southerly winds from the sea, which carried large quantities of warm and humid water vapor converges, heated and lifted in the PRDUA, resulting in stronger precipitation.
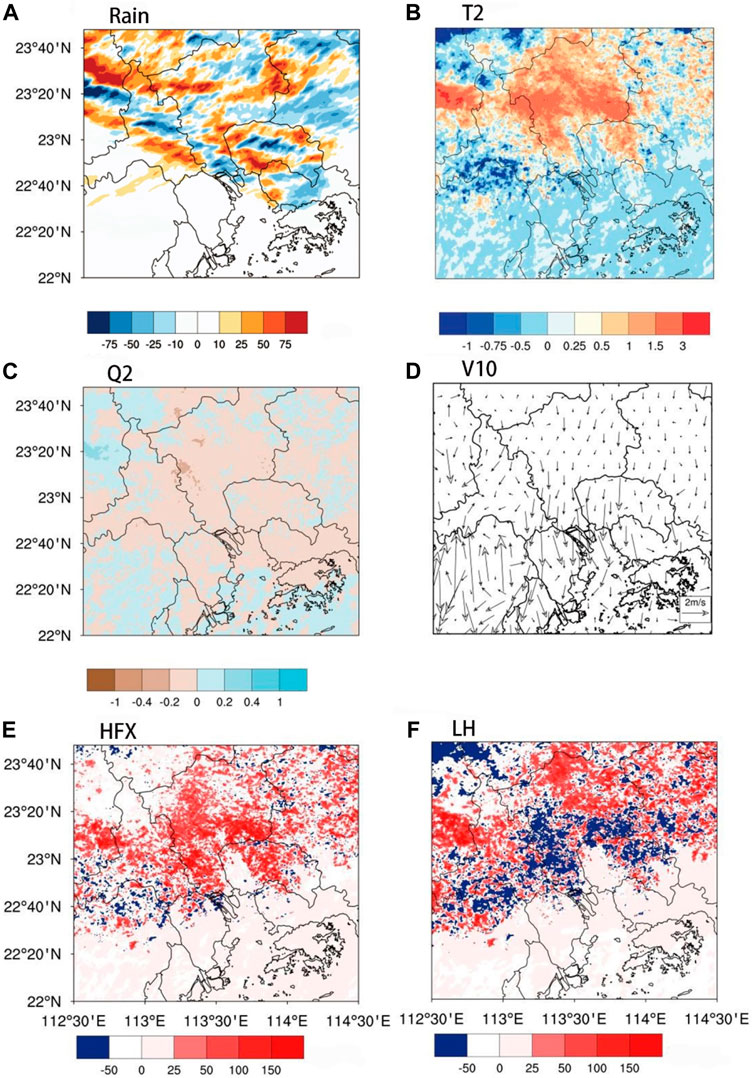
FIGURE 8. Similar to Figure 7 but for the difference between the Urb5w-5ah and Rural experimental groups.
In recent years, the PRDUA has seen a large increase in AH (e.g., vehicle emissions, air conditioning emissions, the release of heat from factory waste), due to the population explosion and growth of industry. AH is a key part of the near-surface energy balance equation and can affect the distribution and intensity of rainfall in urban areas by increasing the upward heat flux, changing the free convection height, and lifting the condensation height and the height of the planetary boundary layer. To clarify the urbanization effect, it is necessary to further quantify the effect of AH as an independent factor affecting precipitation in the PRDUA, especially on precipitation in warm areas dominated by thermal factors. By comparing the precipitation distribution of Urb5w-5ah and Urb5w (Figure 9A), it was found that the precipitation difference in the PRDUA after the addition of AH was mainly distributed in the southern part of Guangzhou, and the overall precipitation area shifted southwards, while the other two areas of heavy precipitation were mainly manifested as an increase in precipitation intensity, and the location of precipitation was basically unchanged. With the addition of new AH, the AH in urban areas led to an increase in 2 m temperature (Figure 9B), which triggered turbulent motion upwards in the vertical direction. The more the 2 m temperature increased, the stronger the updraft and the more unstable the atmosphere became, accelerating the onset of convection and precipitation. At the same time, with the addition of AH (Figure 9E), there was a significant upward sensible heat flux in all urban areas. The central difference of the strong sensible heat flux reached 100 W/m2, while there was no significant change in the surrounding non-urban areas. The center of upward latent heat flux after the addition of AH was mainly in the eastern part of Guangzhou and at the 2 m temperature maximum (Figure 9F), with a maximum latent heat flux difference of 150 W/m2. By comparing the spatial distribution of 2 m specific humidity (Figure 9C), it is apparent that there were lower values in the urban areas with higher temperatures due to the enhanced heating capacity of the ground surface, which made the lower-level water vapor conduct upwards to form precipitation at higher altitudes. The 10 m wind fields of the two experimental groups differed (Figure 9D) and there were no areas with higher wind speeds, indicating that the simulated 10 m wind fields of the two experimental groups were basically the same throughout the PRDUA. By quantifying the effect of AH on precipitation in the warm area of the PRD region, it can be seen that the near-surface temperature and upward heat flux in the urban area increased significantly after the addition of AH; plus, the water vapor near the surface was lifted rapidly, leading to an increase in precipitation intensity and a shift in precipitation location to the southeast. The effect on the 10 m wind field, meanwhile, was negligible.
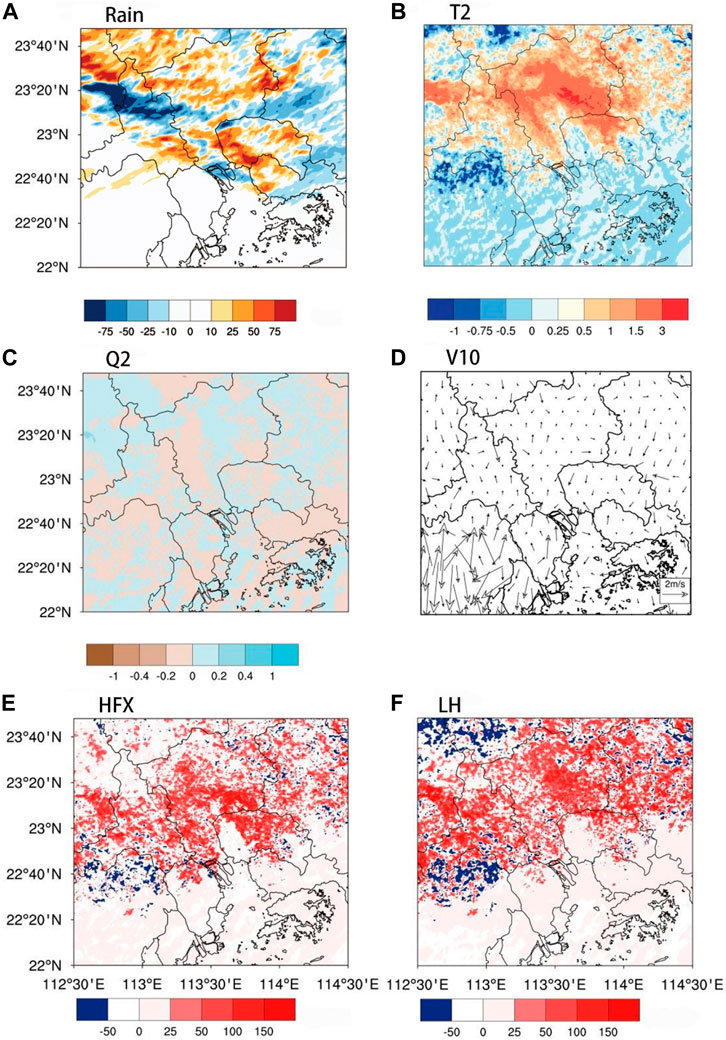
FIGURE 9. Similar to Figure 7 but for the difference between the Urb5w-5ah and Urb5w experimental groups.
To study the influence of the UCM and AH on the local circulation, latitude–height sections (22.50°–24.00°N) over the PRDUA (113.5°E) at 1200 LST 20 April of the wind and air temperature as well as the potential pseudo-relative temperature were analyzed (Figures 10, 11). Figures 10A–E shows that all of five experimental groups produced higher temperatures over the PRDUA, especially the experimental groups with AH parameters (Figures 10B,D). The area with relatively high temperatures was accompanied by a strong updraft caused by the convergence and uplifting of low-level southerly winds over the PRDUA. The warm and humid air from the ocean was lifted to the upper level, which was conducive to rainfall. It can be seen from Figures 10B,D that the vertical updraft in the Urb1w_1ah experimental group was mainly in the south of Guangzhou city (23.00°N), while in the Urb5w_5ah experimental group it was mainly over Guangzhou city (23.17°N). The Urb5w_5ah experimental group improved the location of the simulated temperature and updraft relative to the Urb1w_1ah experimental group, indicating the Urb5w_5ah experimental group better simulated the effect of urban heat emissions. The original model with a single underlying surface applied in the Urb1w_1ah experimental group was unable to precisely simulate the effect of urban heat emissions, leading to the precipitation center shifting in the south (Figure 7A). This shows that the newly constructed model with five types of underlying surface and AH applied in the Urb5w_5ah experimental group produced results that were closer to reality.
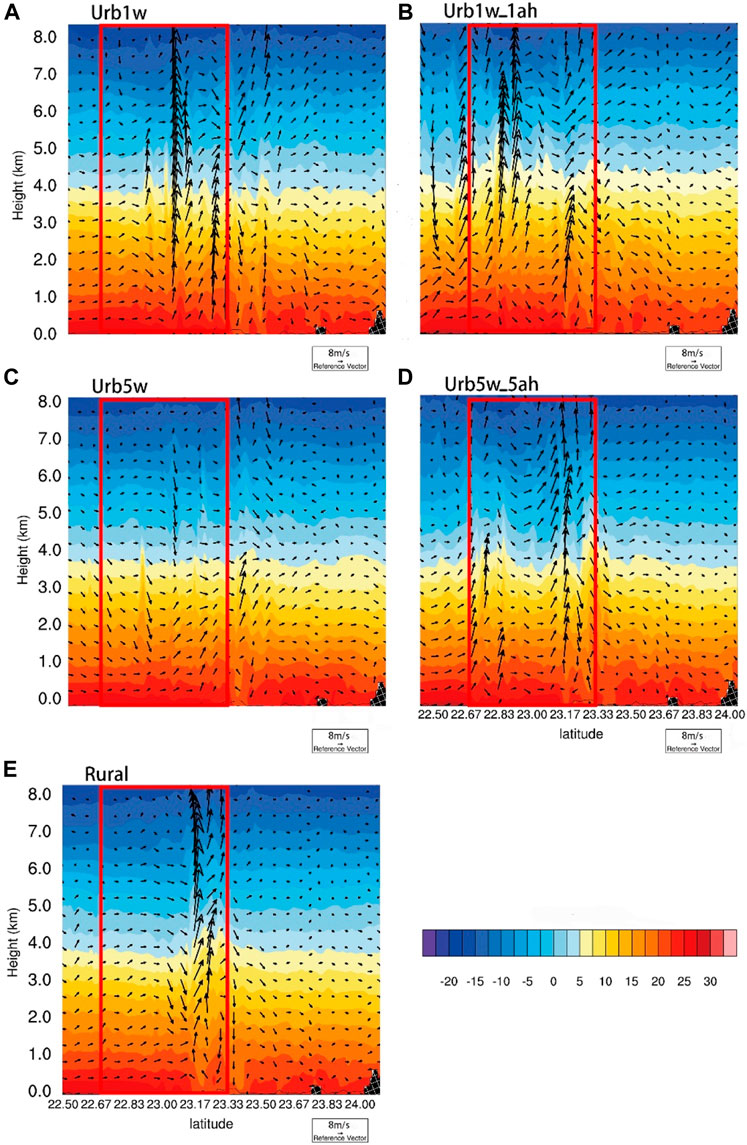
FIGURE 10. Latitude–height sections (22.50°–24.00°N; black line in Figure 1D) over the PRDUA (113.5°E) at 1200 LST 20 April of the wind (arrows; unit: m·s−1) and air temperature (color shading; unit: °C) in the (A) Urb1w, (B) Urb1w_1ah, (C) Urb5w, (D) Urb5w_5ah and (E) Rural experimental group, respectively. The red frame represents the PRDUA. For clarity, the vertical velocity is multiplied by 10.
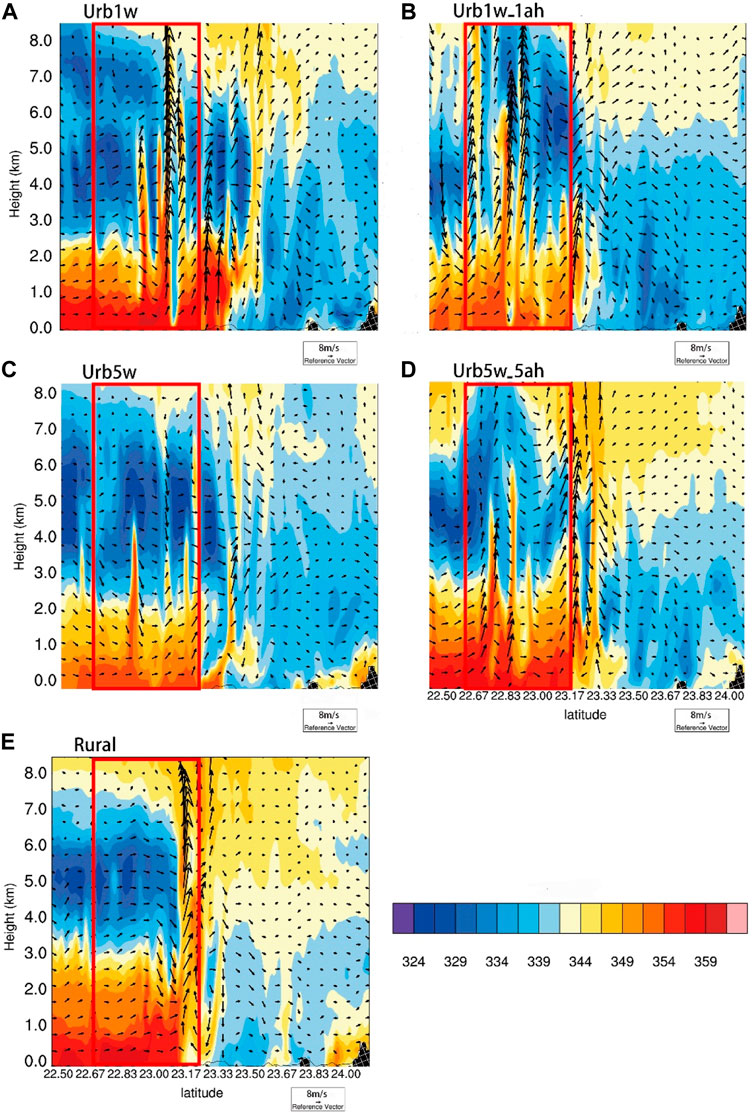
FIGURE 11. As in Figure 10 except for the wind and pseudo-relative potential temperature.
Figures 11A–E shows that the low-level air over the PRDUA in all five experimental groups was warm and humid, which was conductive to the generation of unstable atmospheric conditions and the triggering of convection. The five experimental groups yielded different areas of unstable atmosphere over the PRDUA. Comparing Figures 11B,D, the maximum potential pseudo-relative temperature simulated by the Urb1w_1ah experimental group was 347 K, while in the Urb5w_5ah experimental group it was 354 K, indicating the atmospheric conditions simulated by the Urb5w_5ah experimental group, which applied the newly constructed five types of underlying surface, were more unstable. Compared to the Urb1w_1ah experimental group without the AH parameters (Figure 11C), the Urb5w_5ah experimental group with the AH parameters produced a strong updraft over the PRDUA and the low-level high potential pseudo-relative temperatures extended higher. The unstable, warm and humid air was conducive to rainfall.
In short, the Urb5w_5ah experimental group simulated the strong unstable atmosphere and the high-temperature area over the PRDUA before rainfall. This changed the simulated intensity and falling area of the precipitation over the PRDUA.
The structure of the horizontal wind field is an important factor affecting precipitation. Based on the wind profile radar measurements at Xinhui (Figures 12A1–A6), Luogang (Figures 12B1–B6) and Zengcheng (Figures 12C1–C6) stations, the simulated wind fields in the five experimental groups were evaluated. Luogang and Zengcheng stations are at approximately the same latitude, while Luogang and Xinhui stations are at approximately the same longitude. Figure 12 shows time–height sections of the horizontal winds at the three stations. The precipitation began at 1055 LST 20 April and reached a maximum of 32 mm/h at 1200 LST 20 April in the Luogang area. Before the occurrence of precipitation at Luogang Station (1000 LST 20 April), the low-level southerly winds within 1–2 km reached a maximum of 12 m s−1 (Figure 12B1). Strong westerly winds blew above 2 km and the maximum wind speed exceeded 13 m s−1 at 3 km. At this moment, the wind direction changed clockwise from south to southwest and, according to the principle of thermal wind, there would have been strong warm advection below 2.5 km. When the strongest precipitation occurred at Luogang Station (1200 LST 20 April), there were northwesterly winds below 2 km and the wind speed reduced to 8 m s−1 compared to the previous southerly winds at 1100 LST. The southerly wind blew mainly above 2.5 km and rose in height with the intensification of precipitation. At 1300 LST, the wind direction changed counterclockwise from northwest to west within 1–6 km, indicating cold advection in this zone along with a relatively stable atmosphere and a gradual weakening of precipitation. The strong southerly winds turned into westerly winds above 3 km during 1,200–1300 LST 20 April and the area of wind speeds exceeding 12 m s−1 extended to lower levels. The results of the horizontal wind field simulated by the five experimental groups showed that the simulation effect of the horizontal wind structure was good during the precipitation process in the Luogang area. In order to study the effect of AH on the horizontal wind, comparing Figures 12B2,B3 with Figure 12B4,B5 shows that the simulated southerly winds below 2 km were consistent at 1100 LST. However, at 1200 LST, only Urb5w_5ah (Figure 12B2) and Urb1w_1ah (Figure 12B4) simulated the strong northwesterly winds in a consistent manner with the observed wind field at 1 km and there were southerly winds within 3–4 km that were able to reach a maximum of 12 m s−1, and the upper westerly winds produced strong vertical shear of the horizontal winds. With the inclusion of the localized UCM (compare Figures 12B3–B5), the southerly winds simulated in the Urb5w experimental group below 2 km converged and lifted in the urban area and turned clockwise into the southwesterly winds during 1,200–1300 LST 20 April (Figure 12B3). There were no strong southerly winds below 2 km; only a strong southwesterly jet formed within 2–5 km at 1200 LST (Figure 12B3). However, the southerly winds simulated in the Urb1w experimental group were still presented, and the wind speeds of the southwesterly winds were smaller than those in the Urb5w experimental group within 2–5 km at 1200 LST (Figure 12B3). In order to explore the variation of the horizontal wind field in Luogang and surrounding areas during the precipitation process, Xinhui Station to the south of Luogang Station, and Zengcheng to the east of Luogang Station, were selected for analysis. Precipitation in the Xinhui area started at 1300 LST 20 April, and in the Zengcheng area it started at 1100 LST 20 April. The area of Xinhui is less urbanized than Luogang, and the level of urban construction is relatively low. The southerly wind speeds were not as strong as at Luogang station before the rainfall occurred at Xinhui station below 2 km at 1200 LST (Figure 12A1). Southerly winds continued to exist at 1–3 km during 1,300–2000 LST (Figure 12A1). It was found that the urban canopy had a weaker convergence effect on the low-level winds in the Xinhui area. Zengcheng and Luogang stations are located in the center of the city, and Zengcheng Station is located downwind of Luogang Station. During the precipitation process, the structure of the horizontal wind field was the same as that at Luogang station within 0–6 km. However, the westerly jet above 3 km in Zengcheng was stronger than that in Luogang (Figure 12C1), indicating that the urban canopy had a strengthening effect on the westerly winds. Under the influence of AH, the warm advection was strengthened and the downstream precipitation increased with the enhancement of warm advection at 0.5–3 km and cold advection above the warm advection. The UCM enhanced the convergence of the southerly and southwesterly winds during the precipitation process.
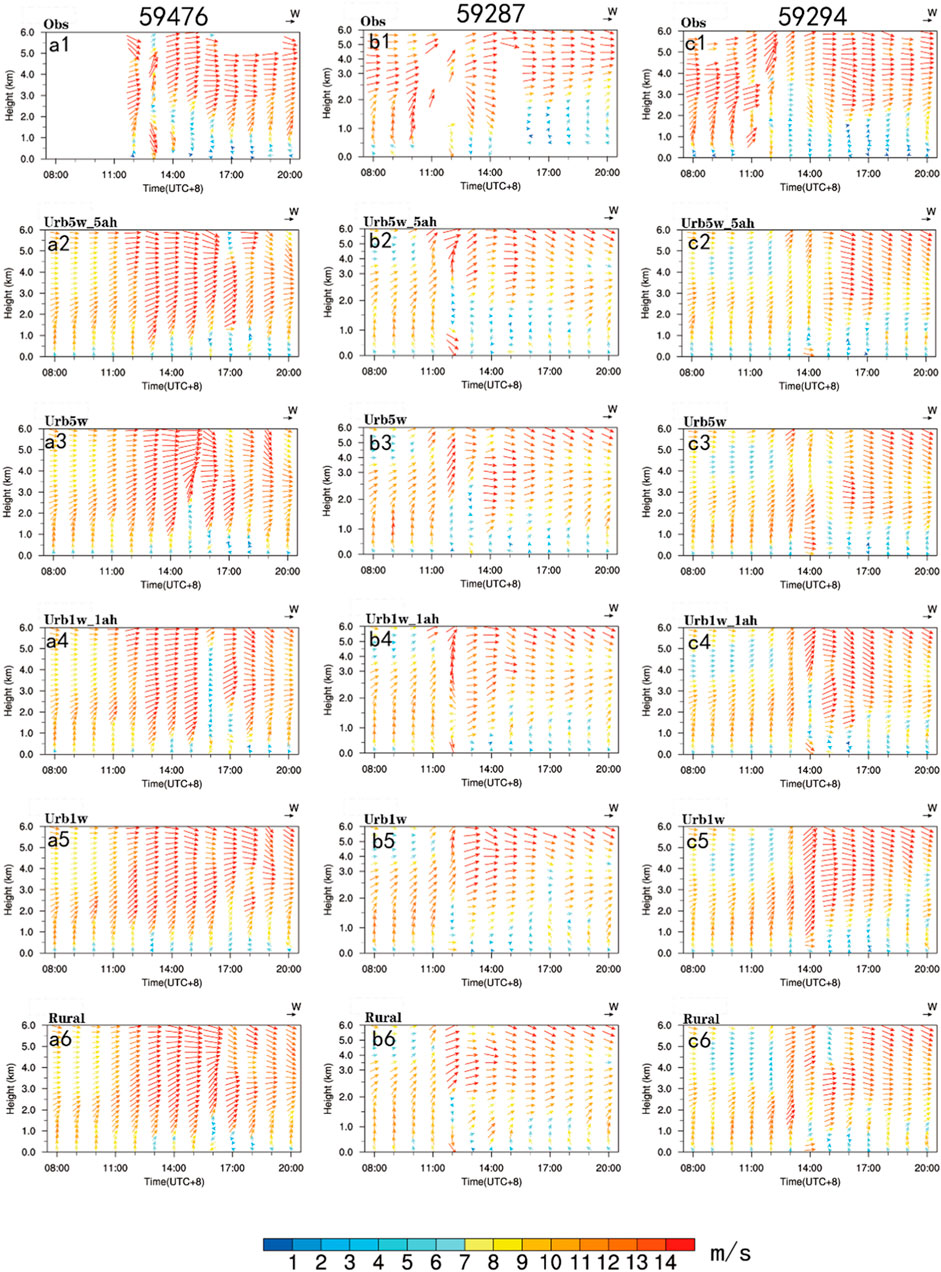
FIGURE 12. Time–height sections of horizontal wind direction (arrows) and wind speed (color shading) from 0,800 to 2000 LST 20 April at (A) Xinhui Station, (B) Luogang Station, and (C) Zengcheng Station.
This study has only assessed one typical warm-sector heavy rainfall event in South China. The newly constructed underlying-surface and corresponding AH parameters improved the simulated patterns of precipitation and meteorological elements, but deficiencies remain, such as stronger precipitation and inaccurate high-level wind fields prior to the precipitation. Further assessment and analysis with more precipitation events is needed.
In this study, localized urban surface parameters with a new and improved AH parameters were updated in the UCM of WRF4.1 based on the LCZ system over the PRDUA. Taking a typical warm-sector heavy rainfall process in the PRDUA on 20 April 2019 as an example, five experimental groups of different schemes were designed to explore the simulation of warm-sector heavy rainfall based on the localized UCM. In addition, the effects of the type of urban surface and various AH parameters and their relative contributions to the thermodynamic mechanism of the precipitation were investigated. The main conclusions can be summarized as follows.
1) All five experimental groups simulated several heavy precipitation centers on 20 April 2019. However, there were obvious differences in precipitation intensity as well as their fall areas. Comparatively, the simulated heavy precipitation in the Urb5w_5ah experimental group was closest to the observed results, showing an RMSE index improvement of 8.8% and indicating that the new localized surface and AH parameters in the UCM of WRF4.1 led to better simulation of this warm-sector heavy rainfall event in the PRDUA. Compared with observations from wind profile radar, the localized UCM enhanced the accuracy of the simulated horizontal wind field convergence at high and low levels in the urban area, leading to better simulation of the spatial pattern and intensity of precipitation in urban downtown areas relative to other schemes. In contrast, improved AH enhanced the accuracy of the simulated intensity of LLJs and vertical movement, resulting in significantly stronger precipitation in the downwind-direction zone in southeastern Guangzhou.
2) By comparing the observed and simulated wind fields in urban areas (Luogang and Zengcheng) and suburban areas (Xinhui), it was found that the low-level southerly winds rotated clockwise with the upper-level westerly convergence before precipitation at both urban sites, and since Zengcheng is located to the east of Luogang, a stronger westerly rush band was formed after the wind field convergence in the upwind Luogang area. Xinhui is located in a rural area and to the south of Luogang. There were marginal changes in the directions of wind fields at the high and low levels in the rural area, with prevailing southwesterly winds. Over the urban areas, the AH forced the low-level southerly winds to be stronger, while the northwesterly winds that occurred at 1 km from the precipitation occurrence time forced the precipitation to move towards the southeast of the city.
3) With the updates provided by the localized UCM, the complex canopy structure forced the low-level southerly winds to change faster in the direction of the wind during upward transmission in the urban areas, and the unstable energy near the ground was more easily conducted to the upper layer, thereby promoting precipitation in the urban area. The improved AH parameters was important in enhancing the simulated precipitation in the downwind-direction zone of the urban areas.
Generally, our findings are helpful for us to improve the simulating skill of warm-sector heavy rainfall over high-density urban areas, as well as to enhance the understanding of the impact mechanism of urbanization on warm-sector heavy rainfall. More case studies will be conducted in the future.
The raw data supporting the conclusion of this article will be made available by the authors, without undue reservation.
Conceptualization, YY and XB; methodology and software, ZH; formal analysis, ZH, LZ, WL, YY, and XB; data curation, ZH, LH, and XB; writing—original draft preparation, ZH; writing—review and editing, ZH, LZ, WL, LH, YY, and XB; supervision, YY and XB; funding acquisition, YY and XB. All authors have read and agreed to the submitted version of the manuscript.
This study is supported by Natural Science Foundation of China (42175098 and 42222503).
We thank Institute of Urban Meteorology of CMA for providing LCZ data and Guangdong Meteorological Service for providing automatic weather stations data and wind profiler radar data. We acknowledge the High Performance Computing Center of Nanjing University of Information Science and Technology for their support of this work.
The authors declare that the research was conducted in the absence of any commercial or financial relationships that could be construed as a potential conflict of interest.
All claims expressed in this article are solely those of the authors and do not necessarily represent those of their affiliated organizations, or those of the publisher, the editors and the reviewers. Any product that may be evaluated in this article, or claim that may be made by its manufacturer, is not guaranteed or endorsed by the publisher.
Bougeault, P., and Lacarrere, P. (1989). Parameterization of orography-induced turbulence in a mesobeta--scale model. Mon. Wea. Rev. 117 (8), 1872–1890. doi:10.1175/1520-0493(1989)117<1872:pooiti>2.0.co;2
Chen, X., Ding, Z., Liu, C., Chang, Y., and Zhu, C. (2012). Statistic analysis on the formation system of warm-sector heavy rainfall in May and June from 2000–2009. J. Trop. Meteorology (in Chinese) 28 (5), 707–718. doi:10.3969/j.issn.1004-4965.2012.05.010
Chen, X., Zhang, F., and Zhao, K. (2017). Influence of monsoonal wind speed and moisture content on intensity and diurnal variations of the mei-yu season coastal rainfall over South China. J. Atmos. Sci. 74 (9), 2835–2856. doi:10.1175/jas-d-17-0081.1
Chen, X., Zhao, K., Xue, M., Zhou, B., Huang, X., and Xu, W. (2015). Radar-observed diurnal cycle and propagation of convection over the Pearl River Delta during Mei-Yu season. J. Geophys. Res. Atmos. 120 (24), 12557–12575. doi:10.1002/2015jd023872
Ching, J. (2013). A perspective on urban canopy layer modeling for weather, climate and air quality applications. Urban Clim. 3, 13–39. doi:10.1016/j.uclim.2013.02.001
Du, Y., and Chen, G. (2018). Heavy rainfall associated with double low-level jets over southern China. Part I: Ensemble-based analysis. Mon. Weather Rev. 146 (11), 3827–3844. doi:10.1175/mwr-d-18-0101.1
Du, Y., and Chen, G. (2019). Heavy rainfall associated with double low-level jets over southern China. Part II: Convection initiation. Mon. Weather Rev. 147 (2), 543–565. doi:10.1175/mwr-d-18-0102.1
Grell, G. A., and Dévényi, D. (2002). A generalized approach to parameterizing convection combining ensemble and data assimilation techniques. Geophys. Res. Lett. 29 (14), 38-1–38-4. doi:10.1029/2002gl015311
He, L., Chen, C., and Kong, Q. (2016). A review of studies on prefrontal torrential rain in South China. J. Appl. Metelorological Sci. (in Chinese) 27 (5), 559–569. doi:10.11898/1001-7313.20160505
Huang, S., Li, Z., Bao, C., Yu, Z., Chen, H., Yu, S., et al. (1986). Heavy rainfall over southern China in the pre-summer rainy season. Guangdong, China: Guangdong Science and Technology Press. (in Chinese).
Iacono, M. J., Delamere, J. S., Mlawer, E. J., Shephard, M. W., Clough, S. A., and Collins, W. D. (2008). Radiative forcing by long-lived greenhouse gases: Calculations with the AER radiative transfer models. J. Geophys. Res. 113 (D13), D13103. doi:10.1029/2008jd009944
Jiang, S., Zhan, W., Yang, J., Liu, Z., Huang, F., Lai, J., et al. (2020). Urban heat island studies based on local climate zones: A systematic overview. Acta Geogr. Sin. 75 (9), 1860–1878. doi:10.11821/dlxb202009004
Jiang, Z., Zhang, D. L., Xia, R., and Qian, T. (2017). Diurnal variations of presummer rainfall over southern China. J. Clim. 30 (2), 755–773. doi:10.1175/jcli-d-15-0666.1
Li, M., Li, C., Chen, F., Zheng, Q., Chen, Q., Zhang, C., et al. (2020). Parameter analysis of on-orbit volumetric measurement using cavity resonance. Acta Astronaut. 05 (59), 113–122. doi:10.1016/j.actaastro.2019.10.003
Li, N., Yang, J., Qiao, Z., Wang, Y., and Miao, S. (2021). Urban thermal characteristics of local climate zones and their mitigation measures across cities in different climate zones of China. Remote Sens. 13 (8), 1468. doi:10.3390/rs13081468
Li, W., Bi, X., Sheng, L., Luo, Y., and Sun, J. (2021). Modulations of synoptic weather patterns on warm-sector heavy rainfall in SouthSouth China: Insights from high-density observations with principal component analysis. Front. Earth Sci. 9. doi:10.3389/feart.2021.678230
Li, X., Pang, C., Liang, W., Huang, M., and Jiang, R. (2015). Analysis on characteristics of the strong convenction over the Bay of bengal as precursory signal of continuous torrential rain in guangxi. Meteorology (in Chinese) 41 (11), 1383–1389. doi:10.7519/j.issn.1000-0526.2015.11.008
Li, Z., Luo, Y., Du, Y., and Chan, J. C. L. (2020). Statistical characteristics of pre-summer rainfall over South China and associated synoptic conditions. J. Meteorological Soc. Jpn. 98 (1), 213–233. doi:10.2151/jmsj.2020-012
Lin, L., Feng, Y., and Huang, Z. (2006). Guangdong weather forecast technical manual, 18. Beijing, China: Meteorological Press, 145–150. (in Chinese).
Lin, L., Gao, T., Luo, M., Ge, E., Yang, Y., Liu, Z., et al. (2020). Contribution of urbanization to the changes in extreme climate events in urban agglomerations across China. Sci. Total Environ. 744, 140264. doi:10.1016/j.scitotenv.2020.140264
Luo, Y., Wu, M., Ren, F., Li, J., and Wong, W. K. (2016). Synoptic situations of extreme hourly precipitation over China. J. Clim. 29 (24), 8703–8719. doi:10.1175/jcli-d-16-0057.1
Luo, Y., Xia, R., and Chan, J. C. L. (2020). Characteristics, physical mechanisms, and prediction of pre-summer rainfall over South China: Research progress during 2008–2019. J. Meteorological Soc. Jpn. 98 (1), 19–42. doi:10.2151/jmsj.2020-002
Miao, S., Chen, F., Li, Q., and Fan, S. (2011). Impacts of urban processes and urbanization on summer precipitation: A case study of heavy rainfall in beijing on 1 august 2006. J. Appl. Meteorology Climatol. 50 (4), 806–825. doi:10.1175/2010jamc2513.1
Molnár, G., Gyöngyösi, A. Z., and Gál, T. (2019). Integration of an LCZ-based classification into WRF to assess the intra-urban temperature pattern under a heatwave period in Szeged, Hungary. Theor. Appl. Climatol. 138 (1–2), 1139–1158. doi:10.1007/s00704-019-02881-1
Mu, Q., Miao, S., Wang, Y., Li, Y., He, X., and Yan, C. (2019). Evaluation of employing local climate zone classification for mesoscale modelling over Beijing metropolitan area. Meteorol. Atmos. Phys. 132 (3), 315–326. doi:10.1007/s00703-019-00692-7
Mughal, M. O., Li, X., Yin, T., Martilli, A., Brousse, O., Dissegna, M. A., et al. (2019). High-resolution, multilayer modeling of Singapore’s urban climate incorporating local climate zones. J. Geophys. Res. Atmos. 124 (14), 7764–7785. doi:10.1029/2018jd029796
Niu, G. Y., Yang, Z. L., Mitchell, K. E., Chen, F., Ek, M. B., Barlage, M., et al. (2011). The community noah land surface model with multiparameterization options (Noah-MP): 1. Model description and evaluation with local-scale measurements. J. Geophys. Res. 116 (D12), D12109. doi:10.1029/2010jd015139
Oke, T. R., Mills, G., Christen, A., and Voogt, J. A. (2017). Urban climates. Cambridge, United Kingdom: Cambridge University Press.
Patel, P., Karmakar, S., Ghosh, S., and Niyogi, D. (2020). Improved simulation of very heavy rainfall events by incorporating WUDAPT urban land use/land cover in WRF. Urban Clim. 32, 100616. doi:10.1016/j.uclim.2020.100616
Stewart, I. D., and Oke, T. R. (2012). Local climate zones for urban temperature studies. Bull. Am. Meteorological Soc. 93 (12), 1879–1900. doi:10.1175/bams-d-11-00019.1
Thompson, G., Field, P. R., Rasmussen, R. M., and Hall, W. D. (2008). Explicit forecasts of winter precipitation using an improved bulk microphysics scheme. Part II: Implementation of a new snow parameterization. Mon. Weather Rev. 136 (12), 5095–5115. doi:10.1175/2008mwr2387.1
Tse, J. W. P., Yeung, P. S., Fung, J. C. H., Ren, C., Wang, R., Wong, M. M. F., et al. (2018). Investigation of the meteorological effects of urbanization in recent decades: A case study of major cities in Pearl River Delta. Urban Clim. 26, 174–187. doi:10.1016/j.uclim.2018.08.007
Wan, Q., Wang, B., Wong, W. K., Hu, Z., Jou, B. J. D., Lin, Y., et al. (2017). The southern China monsoon rainfall experiment (SCMREX). Bull. Am. Meteorological Soc. 98 (5), 999–1013. doi:10.1175/bams-d-15-00235.1
Wong, M. M. F., Fung, J. C. H., Ching, J., Yeung, P. P. S., Tse, J. W. P., Ren, C., et al. (2019). Evaluation of uWRF performance and modeling guidance based on WUDAPT and NUDAPT UCP datasets for Hong Kong. Urban Clim. 28, 100460. doi:10.1016/j.uclim.2019.100460
Wu, M., and Luo, Y. (2016). Mesoscale observational analysis of lifting mechanism of a warm-sector convective system producing the maximal daily precipitation in China mainland during pre-summer rainy season of 2015. J. Meteorol. Res. 30 (5), 719–736. doi:10.1007/s13351-016-6089-8
Wu, N., Zhuang, X., Min, J., and Meng, Z. (2020). Practical and intrinsic predictability of a warm-sector torrential rainfall event in the South China monsoon region. J. Geophys. Res. Atmos. 125 (4). doi:10.1029/2019jd031313
Yang, Y., Guo, M., Ren, G., Liu, S., Zong, L., Zhang, Y., et al. (2022). Modulation of wintertime canopy urban heat island (CUHI) intensity in Beijing by synoptic weather pattern in planetary boundary layer. Journal of Geophysical Research: Atmospheres, 127, e2021JD035988. doi:10.1029/2021JD035988
Zeng, W., Chen, G., Du, Y., and Wen, Z. (2019). Diurnal variations of low-level winds and precipitation response to large-scale circulations during a heavy rainfall event. Mon. Weather Rev. 147 (11), 3981–4004. doi:10.1175/mwr-d-19-0131.1
Zhang, L., Zhi, X. F., and Karray, F. (2010). Retinal vessel extraction by matched filter with first-order derivative of Gaussian. Comput. Biol. Med. 30 (4), 438–445. doi:10.1016/j.compbiomed.2010.02.008
Zheng, Y., Miao, S., Bao, Y., and Liu, K. (2017). Interaction of anthropogenic heat emission from building cooling system and meteorological environment. Plateau Meteorol. (in Chinese) 36 (2), 562–574. doi:10.7522/j.issn.1000-0534.2016.00005
Zhong, S., Qian, Y., Zhao, C., Leung, R., and Yang, X. Q. (2015). A case study of urbanization impact on summer precipitation in the Greater Beijing Metropolitan Area: Urban heat island versus aerosol effects. J. Geophys. Res. Atmos. 120 (2010), 10, 903–910, 914. doi:10.1002/2015jd023753
Zhou, T., Yu, R., Chen, H., Dai, A., and Pan, Y. (2008). Summer precipitation frequency, intensity, and diurnal cycle over China: A comparison of satellite data with rain gauge observations. J. Clim. 21 (16), 3997–4010. doi:10.1175/2008jcli2028.1
Zhou, L., Liu, S., Yang, Y., Ren, G., Yu, M., Zhang, Y., and Li, Y. (2021). Synergistic Influence of Local Climate Zones and Wind Speeds on the Urban Heat Island and Heat Waves in the Megacity of Beijing, China. Front. Earth Sci. 9:673786. doi:10.3389/feart.2021.673786
Keywords: urban canopy model, anthropogenic heat, warm-sector heavy rainfall, weather research and forecasting model, pearl delta urban agglomeration
Citation: Huang Z, Yang Y, Bi X, Zong L, Li W and Huang L (2022) Localized urban canopy model and improved anthropogenic heat parameters in the weather research and forecasting model: Simulation of a warm-sector heavy rainfall event over the pearl river delta urban agglomeration. Front. Environ. Sci. 10:1078820. doi: 10.3389/fenvs.2022.1078820
Received: 24 October 2022; Accepted: 25 November 2022;
Published: 06 December 2022.
Edited by:
Zhiyuan Hu, Sun Yat-sen University, ChinaReviewed by:
Ben Yang, Nanjing University, ChinaCopyright © 2022 Huang, Yang, Bi, Zong, Li and Huang. This is an open-access article distributed under the terms of the Creative Commons Attribution License (CC BY). The use, distribution or reproduction in other forums is permitted, provided the original author(s) and the copyright owner(s) are credited and that the original publication in this journal is cited, in accordance with accepted academic practice. No use, distribution or reproduction is permitted which does not comply with these terms.
*Correspondence: Xueyan Bi, YmlpeHlAMTYzLmNvbQ==
†These authors have contributed equally to this work and share first authorship
Disclaimer: All claims expressed in this article are solely those of the authors and do not necessarily represent those of their affiliated organizations, or those of the publisher, the editors and the reviewers. Any product that may be evaluated in this article or claim that may be made by its manufacturer is not guaranteed or endorsed by the publisher.
Research integrity at Frontiers
Learn more about the work of our research integrity team to safeguard the quality of each article we publish.