- 1School of Finance and Public Economics, Shanxi University of Finance and Economics, Taiyuan, China
- 2School of Applied Mathematics, Shanxi University of Finance and Economics, Taiyuan, China
As the main strategy for the coordinated development of China’s ecological economy in the future, the carbon peaking and carbon neutrality strategy is an important response strategy to solve the two major problems of China’s urbanization process: the industrial structure is biased toward tradition and the economic development is biased toward high carbon. Under this development prospect, how to coordinate ecological development and economic development through the transformation of the industrial structure and form a unified development situation is an important issue for the development of the ecological economy. To solve this problem, the research starts with the theory of industrial structure change and ecological efficiency, puts forward two kinds of ecological efficiency assumptions, and establishes a mathematical model based on the C-D production function and cost function for the impact of industrial structure change on ecological efficiency. On this basis, a spatial model is formed, and empirical analysis is carried out for the important domestic ecological economic zone - the Yangtze River Economic Belt. The research results show that the industrial structure of the eco-economic zone will have a significant positive impact on ecological efficiency. At the same time, under the effect of inter-city cooperation, ecological efficiency has a significant spatial spillover effect. At the same time, the spatial lag factor and spatial error factor of urban agglomeration in the Yangtze River Delta are significant at the 10% and 5% levels, and the spatial lag factor and spatial error factor of urban agglomeration in the middle and long reaches are significant at the 5% level. It can be seen that the spatial dependence and linkage of ecological effects are strong, and there is a relatively significant interaction.
1 Introduction
In the process of economic development of urbanization, it is inevitable that economic development will consume resources and pollute the environment. The overdraft of extensive economic development on resources and environment is likely to have a negative impact on the future ecological environment and economic development. Therefore, whether from the perspective of social significance or economic significance, ecological transformation of the economic development path is the only way for social and economic development (Weber and Cabras, 2019; Bryndin, 2020; O’Hara and Baker, 2020). With the proposal of the dual carbon strategy, the regional ecological economic development mode has been coordinated in a path. Therefore, it is necessary to break down the dual carbon strategic objectives in batches and in different places and formulate an ecological and economic development path that conforms to the actual development of the region based on the current industrial structure and environmental and ecological status of different regions. In the dual carbon strategy, the regional industrial structure is linked to the ecological status, and the concept of ecological efficiency, as an important ecological environment concept related to economic performance and environmental performance, can be used as an important indicator to measure the development of regional ecological economy. Ecological efficiency refers to keeping resource loss and environmental pollution at the lowest level on the basis of maximizing economic benefits. The production efficiency of traditional industries is relatively low, and the development of industrial technology is the process of upgrading the industry from low production efficiency to high production efficiency, which is also the process of industrial structure transformation and industrial factor integration (Tu et al., 2019; Wang et al., 2021; Bai et al., 2022). Under the trend of scientific industrial structure, production factors are constantly transferred from low efficiency industries to high efficiency industries, so as to improve the allocation efficiency of production factors, improve the ecological efficiency, reduce carbon emissions, and achieve the effect of carbon peaking (Wang et al., 2019; Gu et al., 2021; Feng and Wu, 2022). In this process, due to the difference between the regional location environment and the natural environment, the adopted industrial structure transformation methods are also different, and the impact of industrial structure transformation on the formation of ecological efficiency in the region is also different. Therefore, when formulating a path to achieve the dual carbon strategic goal, the impact mechanism between industrial structure and ecological efficiency must be analyzed, Only in this way can we put forward the transformation strategy of industrial structure that conforms to the regional development mode more accurately. Therefore, this study starts from the analysis of the mechanism before the formulation of the strategy, starts from the correlation mechanism between the industrial structure transformation and ecological efficiency, and analyzes the impact benefits between the two. With the goal of improving ecological benefits, it provides a theoretical basis for the formulation of the industrial structure transformation strategy and the realization of the batch and differential dual carbon strategy development path.
2 Theoretical analysis and research hypothesis
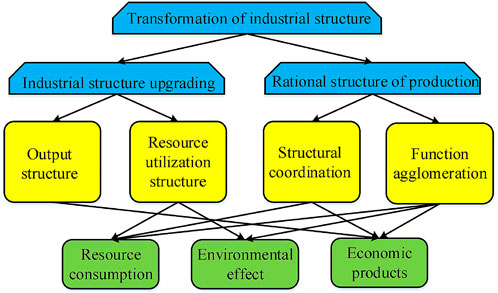
The industrial structure refers to the proportion of different industries and different sectors within the industry in the overall national economy. The transformation of industrial structure refers to the resource flow and the change of resource proportion formed by the flow of production factors among the three major industries, including both the changes formed by the replacement of leading industries and the industrial changes formed by the differences in technological cycles. This industrial adjustment is the process of industrial rationalization (Tian et al., 2019a; Hu et al., 2020; Chen et al., 2022). Another corresponding factor is industrial upgrading. The industrial structure can be divided into two dimensions: quality and quantity. The quality dimension refers to the distribution of the technology development level and industrial performance level of each industry, that is, from the perspective of scale performance, capital intensity, and the proportion of technology intensity. The quantitative dimension refers to the analysis from the perspective of the proportion of industries in the national economy. The change of industrial structure refers to the change of resource tilt and proportion caused by the flow of production resources among different industries. This change can be driven by the change of industrial proportion in different periods and leading industries, or by cyclical technological development and changes in social environment. Different promotion methods will form different industrial structure patterns, which will affect social and economic development, The main ways of industrial structure reform are industrial rationalization and industrial upgrading. The impact path of industrial rationalization and industrial upgrading on ecological efficiency is shown in Figure 1.
Industrial upgrading refers to the organic and ecological development of the overall industrial structure, the improvement of the overall industrial technology level, knowledge level and export-oriented level. Ecological efficiency refers to the level of control over resource consumption and environmental impact in the production process to meet the needs of improving human life quality (Tian et al., 2019b; Li et al., 2019; Wang and Liu, 2020). In the process of industrial structure upgrading, as the industry has changed from the traditional extensive type to the refined type and from the low-end processing type to the high-end knowledge type, resource consumption and environmental pollution are often reduced. The process of industrial structure rationalization corresponds to the adjustment of the whole industry, which promotes the reasonable distribution and coordination of resources among industries, and adjusts the unreasonable industrial structure, so that resources can be effectively allocated. This process will affect the industrial production structure and main production methods, and then affect the ecological efficiency (Wang et al., 2019; Xiong et al., 2019; Zheng et al., 2020). Although the rationalization of industrial structure can make the distribution among industries more coordinated and produce more large-scale economic effects, the large-scale development of this industry will also increase industrial input and resource consumption on the other hand. At the same time, in the process of rational distribution, high-end industries will continue to concentrate, and the manufacturing industry will be transferred outward, which will result in a high concentration of high-end industries and low pollution industries, However, the industries causing heavy pollution continue to expand to other regions, so it is easy to have a negative impact on local production efficiency in most regions. Based on the above theory, the study proposes Hypothesis 1.
3 Model construction
3.1 Mathematical model construction of the impact of industrial structure transformation on ecological efficiency
Before building the impact model of industrial structure transformation on ecological efficiency, it is necessary to measure the industrial structure effectively. Since industrial structure change mainly consists of industrial upgrading change and industrial rationalization change, the study mainly measures from these two aspects. There is no research on the industrial structure upgrading, which is mainly measured by the product of the proportion of industrial output value and industrial labor and industrial labor productivity
In Formula (1),
In Formula (2),
In Formula (1),
In Formula (2),
In Formula (5),
The cost function unit factor price measurement mechanism is introduced here, and the factor price is defined as the lowest cost price under the effect of fixed output, then the cost minimization problem can be transformed into the form with production factors, as shown in Formula (7).
In Formula (7),
Finally, the C-D production function containing the environment can be formed as shown in Formula (9).
When establishing the impact model of industrial structure transformation on production efficiency, three basic assumptions should be followed first. Hypothesis 1 is that all labor forces in the economic environment are homogeneous; Hypothesis 2 refers to that both the first and second industries are willing to pay for environmental pollution, which is reflected in the form of right price, and the proportion of the cost to the total industrial output value is expressed in
When the measurement value increases, it proves that the primary industry is constantly transferring to the secondary industry, which is the process of industrial structure upgrading. The constructed Lagrangian function is shown in Formula (9).
In Formula (11),
In this case, you can:
At this time, if
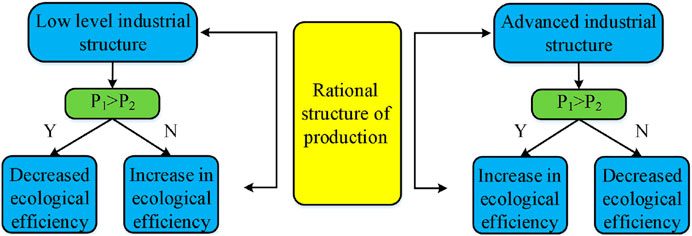
FIGURE 2. The relationship between rationalization of industrial structure and ecological efficiency.
It can be seen that under the two environments of low and advanced industrial structure, the rise and fall of production efficiency depends on the size of
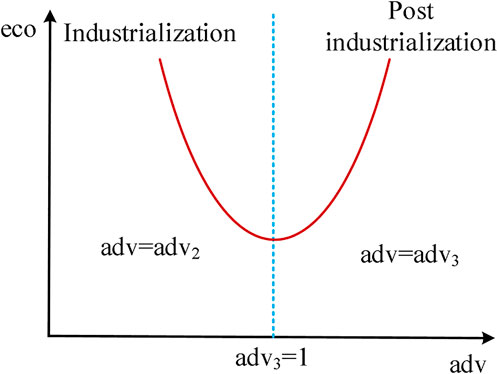
It can be seen from Figure 3 that when the ratio of the output value of the secondary industry to that of the tertiary industry is equal to 1, the highly U-shaped relationship of the ecological efficiency language industry institutions is at the bottom, while the first half of the stage is the industrialization stage when the proportion of the secondary industry rises, and the second stage of the later version is the post industrialization stage when the proportion of the tertiary industry rises. In the impact model of industrial structure rationalization on production efficiency, industrial structure rationalization refers to the deviation between the per capita output value in the industry and the per capita output value of the economy. The smaller the deviation value, the more reasonable the structure will be. The definition of industrial structure rationalization index is shown in Formula (15).
In Formula (15),
If
When the upgrading of power structure and industrial structure are in convergence, the industrial structure is the most reasonable. The specific change process is shown in Figure 4.
The rationalization of industrial structure, the upgrading of industrial structure and the upgrading of labor force will maintain a dynamic interaction relationship, as shown in Figure 5.
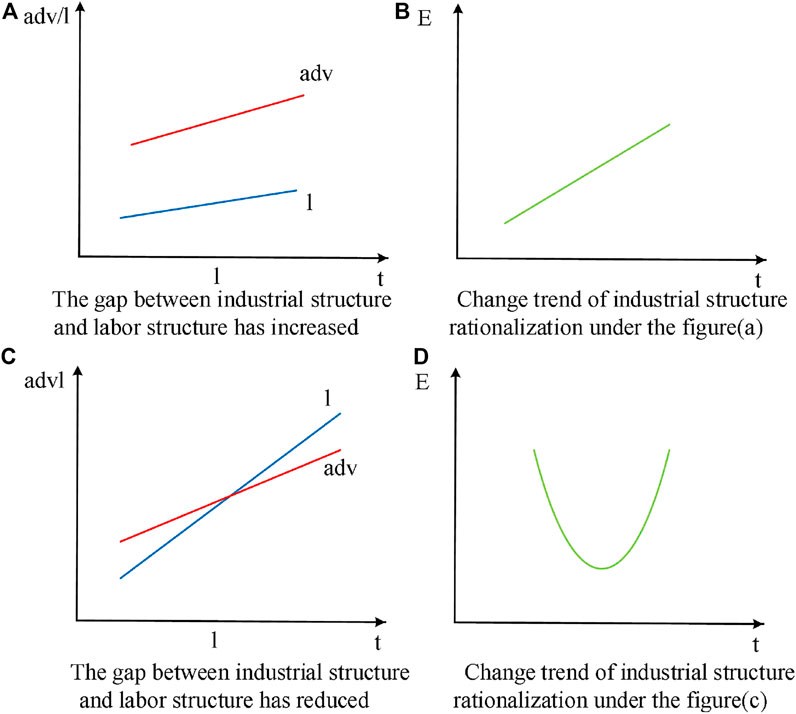
FIGURE 5. The relationship between industrial structure upgrading, rationalization and labor force upgrading.
It can be seen that the relationship between the rationalization of industrial structure, the upgrading of industrial structure and the upgrading of labor force is interactive and balanced.
3.2 Spatial model construction of the impact of industrial structure transformation on ecological efficiency
Spatial econometric model refers to the interaction of different regions in economic space to a certain extent, which includes both correlation and heterogeneity. The study mainly uses two models, SAR model and SEM model. SAR model is shown in Formula (18).
In Formula (18),
When applying the spatial measurement method, it is necessary to test the spatial correlation of the explained variables. MoranI method is mainly used for the study, as shown in Formula (20).
In Formula (18),
In Formula (21),
3.3 Model index selection
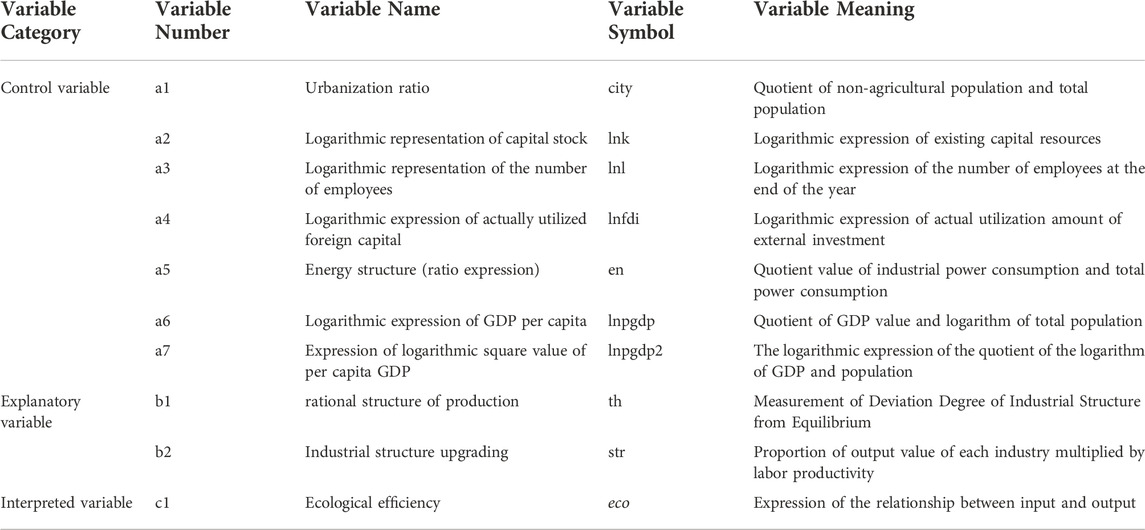
When selecting indicators, the study takes into account both feasibility and scientificity, that is, to ensure comprehensive theoretical interpretation and comprehensive collection of relevant indicator data. On this basis, the study divides model indicator variables into three main variable categories: control variable, explanatory variable and explained variable. Specific indicator symbols and indicator meanings are shown in Table 1.
It can be seen from Table 1 that the explained variables of the study are expressed by ecological efficiency as the main indicator, which represents the comparison between the value formed by economic development and the environmental pollution measurement value and resource consumption measurement value formed in the process of value formation. The evaluation system of ecological efficiency mainly includes two main dimensions: input and output. The input dimension mainly refers to the relevant variables of input in the production process, while the output mainly refers to the total value of products or services produced by the region. In terms of input, the research is mainly expressed in terms of environmental impact and resource consumption, while output is mainly expressed in the form of GDP. The explanatory variables are the rationalization of industrial structure and the upgrading of industrial structure. The rationalization of industrial structure is measured by the improved Theil index, and the upgrading of industrial structure is measured by multiplying the proportion of each industry in the total industry by the labor productivity of the corresponding industry. The control variables are mainly divided into urbanization rate, logarithmic representation of capital stock, logarithmic representation of the number of employees, logarithmic representation of the amount of actually utilized foreign capital, energy structure (ratio expression), logarithmic expression of per capita GDP, and logarithmic square expression of per capita GDP. Among them, the urbanization ratio, as an important symbol of the transformation of small-scale peasant economy in rural areas towards the development of urbanization and socialized cooperative economy, may also cause excessive resource consumption and environmental pollution in the rough development process while generating economic benefits. Therefore, the urbanization ratio is selected as one of the control variables in the study; The logarithm of capital stock represents the measurement of changes in investment and depreciation of urban fixed assets, that is, stock changes; The logarithm of the number of employees mainly measures the level of industrial input labor from the perspective of industry input employees, and labor input will also have a certain impact on ecological efficiency; The logarithm of the amount of actually utilized foreign capital is mainly measured against the resource consumption and environmental pollution caused by the inflow of foreign capital from the transfer of highly polluting industries from countries with higher economic development levels. To attract this inflow of foreign capital, countries with low economic development levels tend to formulate more preferential policies, which leads to the neglect of the environment and the resource burden of industrial development. The study converts the average exchange rate of each year into RMB during calculation, and then uses the CPI index to assist measurement; The energy structure mainly measures the energy consumption in the process of economic development. Since the energy consumption and environmental pollution caused by different types of energy, such as traditional energy and new energy, are different, the use of energy structure as a control variable can best reflect the impact of energy elements on ecological efficiency; Both the logarithm of GDP per capita and the logarithm square of GDP per capita are important factors to measure the level of economic development, so they are also important to control variables to explore the impact of economic development and industrial structure changes on ecological benefits.
3.4 Source and preliminary processing of model data
The original data used in the study are mainly from China Urban Statistical Yearbook and China Regional Economic Statistical Yearbook. In addition, it also includes the conceptual statistical annual reports of the regions involved. The missing data is supplemented by the moving average method. At the same time, the average exchange rate of each year shall be used to calculate the exchange rate.
4 Empirical analysis
4.1 An empirical analysis of the impact of industrial structure on ecological efficiency in integrated urban agglomeration
4.4.1 Auto correlation analysis
The research mainly selects the Yangtze River Ecological Economic Zone from 2013 to 2021 as the main research object. During the empirical analysis, the autocorrelation test and robustness test of variables are conducted first, and then the empirical analysis is divided into two aspects: the empirical analysis of the impact of the industrial structure of the overall urban agglomeration on the ecological efficiency and the empirical analysis of the impact of the industrial structure of the regionalized urban agglomeration on the ecological efficiency. In the part of variable autocorrelation test, MoranI index is not used as the main verification tool of spatial agglomeration effect, and the specific test results are shown in Table 2.
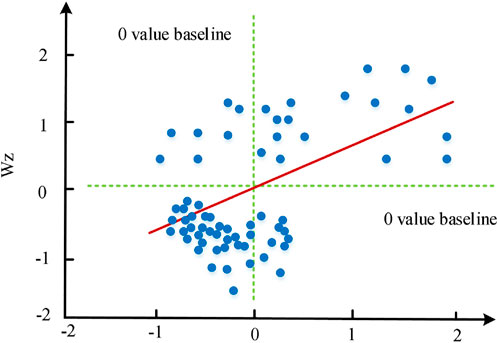
It can be seen from Table 2 that from 2013 to 2021, the MoranI index is greater than 0 and less than 1, and the overall value fluctuates around 0.300. The MoranI index from 2016 to 2017 is relatively low, but the MoranI index in other years has reached above 0.300. It can be seen that the Yangtze River Ecological Economic Belt has a high spatial correlation, and from the perspective of p-value, the p-value from 2013 to 2021 is less than 1%, It is statistically significant. It can be seen that the variables selected for the study have strong spatial auto correlation, which can be further used for spatial regression analysis. The MoranI scatter diagram formed on this basis is shown in Figure 6.
It can be seen from Figure 6 that the regional scattered points are basically distributed along the line from the bottom left to the top right, and the main regions are concentrated at the bottom left, with a slight outward scattered distribution. It can be seen that the ecological efficiency elements of the Yangtze River Ecological Economic Zone have a significant spatial correlation in regional distribution, that is, the regions with higher ecological economic efficiency also have higher ecological economic efficiency in their surrounding regions, while the regions with lower ecological economic efficiency also have lower ecological economic efficiency in their surrounding regions, Although the elements of ecological efficiency are geographically diffuse, the overall regional agglomeration effect is also significant.
4.1.2 Empirical analysis on the impact of industrial structure on ecological efficiency of integrated urban agglomeration
In the empirical analysis of the impact of industrial structure on ecological efficiency of the overall urban agglomeration, three models, OLS model (ordinary panel model), SAR model (spatial lag model) and SEM model (spatial error model), will be used for analysis. The specific empirical results are shown in Table 3.
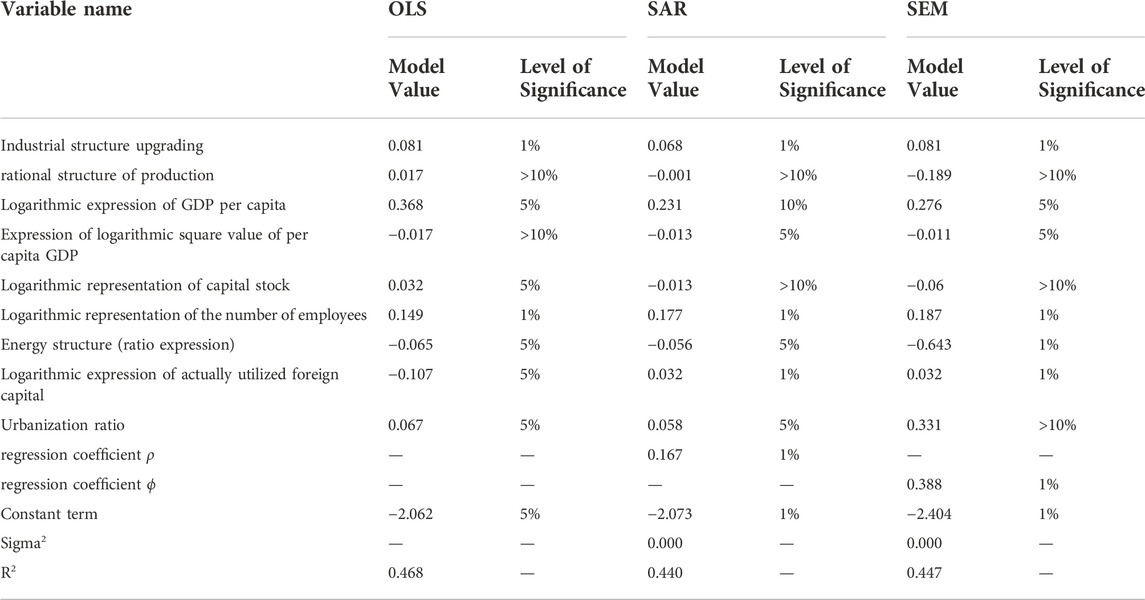
TABLE 3. Empirical analysis on the impact of industrial structure on ecological efficiency of integrated urban agglomeration.
It can be seen from Table 3 that from the two explanatory variables of industrial structure upgrading and industrial structure rationalization, the model values of the OLS model, SAR model, and SEM model on industrial structure upgrading variables are 0.081, 0.068 and 0.081 respectively, while the significance level is at 1% level, which shows that industrial structure upgrading is conducive to the improvement of ecological efficiency in the region. At the same time, the values of the two regression coefficients are 0.167 and 0.388 respectively, and both have passed the significance verification at the level of 1%. It can be seen that the industrial structure change of the Yangtze River Ecological Economic Zone will not only benefit the improvement of its ecological efficiency but also produce a relatively significant spatial spillover effect on the surrounding areas. Since the values of the regression coefficients are greater than 0, it can be judged that this spatial spillover effect is positive. However, from the perspective of industrial structure rationalization variables, the significance level of the three models is greater than 10%, which does not constitute statistical significance. It can be seen that industrial structure rationalization has no significant correlation with ecological efficiency. It can be seen that in the two explanatory variables, only industrial structure upgrading has a significant positive correlation with ecological efficiency, and industrial structure upgrading can significantly promote the level of ecological efficiency. From the perspective of control variables, the logarithmic expression of GDP per capita shows a significant positive correlation between the three models, while the logarithmic square expression of GDP per capita shows a negative significant impact on the SAR model and SEM model, which shows that the impact of economic variables on ecological efficiency presents an inverted U-shaped change pattern; The logarithmic representation of capital stock has a significant positive impact on regional ecological efficiency in the OLS model, while the logarithmic representation of the number of employees also has a significant positive impact on regional ecological efficiency. In contrast, the energy structure has a significant negative impact on regional ecological efficiency. This shows that among the three variables invested in the production process, capital, labor, and energy, Both the capital variable and labor variable can improve the regional ecological efficiency level, but the energy variable can reduce the regional ecological efficiency level. The input of capital variable and labor variable can explain the increase of ecological efficiency from the perspective that the increase of output is greater than the increase of input, while the input of energy variable will lead to the increase of energy input such as coal and electricity, thus reducing the level of ecological efficiency; The logarithm of the amount of actually utilized foreign capital reflects a negative coefficient of 5% significance level in the OLS model, but a positive coefficient of 1% significance level can be reflected in the SAR model and SEM model. It can be seen that the input of foreign capital variables has a significant negative impact on the local ecological efficiency, but a significant positive impact on the ecological efficiency spillover effect of surrounding areas; The urbanization rate has a significant positive impact on the level of ecological efficiency in the three models. The model used in the study is mainly based on the economic weight matrix. To verify the robustness of the model, the study replaced the economic weight matrix with the geographical weight matrix and carried out the further empirical analysis. The specific results are shown in Table 4.
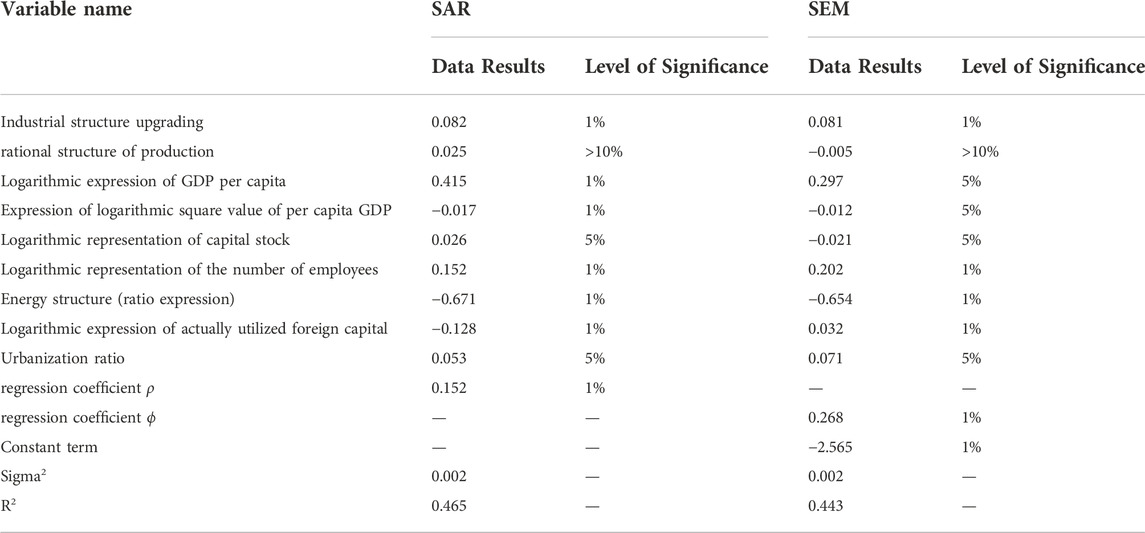
It can be seen from Table 4 that the data results of SAR model and SEM model that explain the variable industrial structure upgrading are 0.082 and 0.081 respectively, with a significance level of 1%. It can be seen that industrial structure upgrading is conducive to the improvement of ecological efficiency in the region. At the same time, the data results of SAR model and SEM model that explain the rationalization of variable industrial structure are 0.025 and -0.005 respectively, the significance level is>10%, lacking statistical significance. It can be seen that the rationalization of industrial structure is not conducive to the improvement of ecological efficiency in the region. The significant effect of explanatory variables is basically consistent with the economic weight matrix model. At the same time, by testing each variable in the control variables, it can be found that the significant effect of each control variable in the economic weight matrix model is basically the same. This shows that the regression analysis model designed in this study is robust.
4.2 Empirical analysis on the impact of industrial structure on ecological efficiency in regionalized and classified urban agglomerations
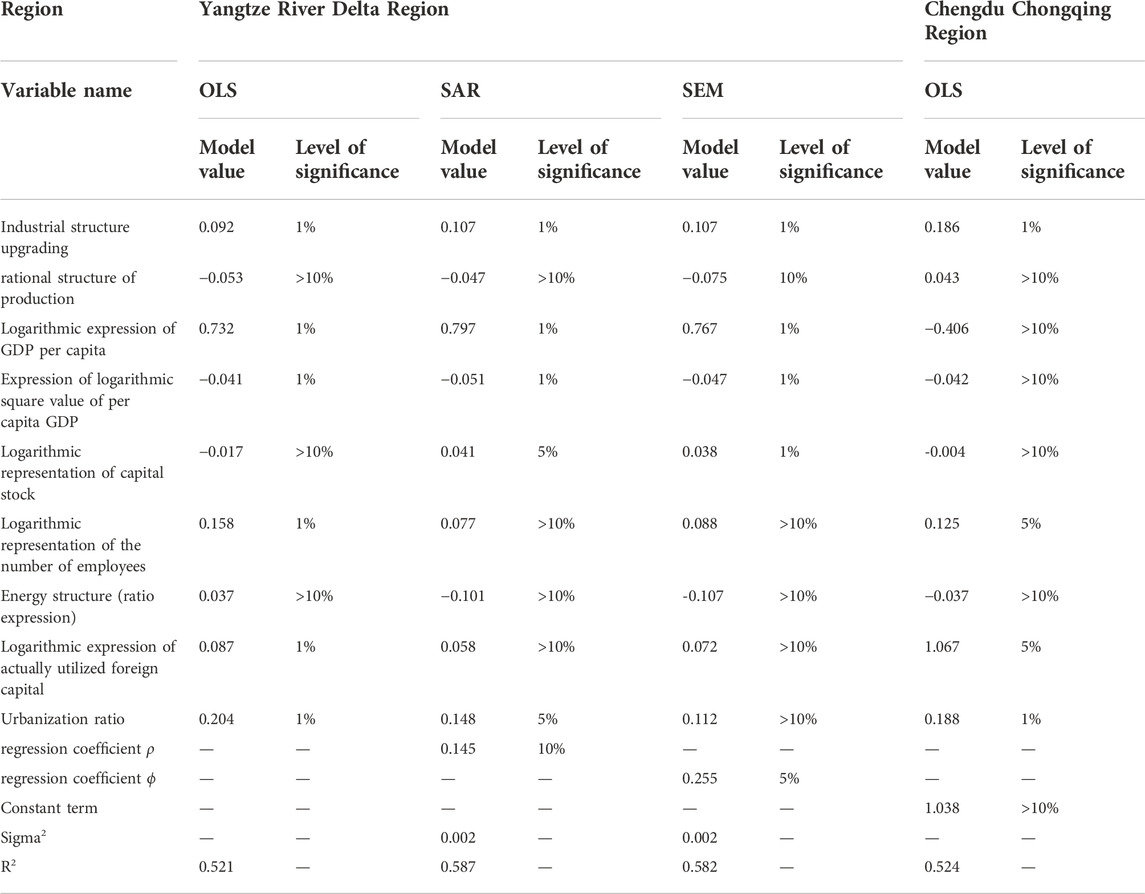
In the empirical analysis of the impact of industrial structure on the ecological efficiency of regionalized urban agglomeration, three models, the OLS model (ordinary panel model), SAR model (spatial lag model), and SEM model (spatial error model), are also used for analysis. The difference is that in this part of the study, the Yangtze River Ecological Economic Zone is divided into four main regions: the Yangtze River Delta, the middle reaches of the Yangtze River, Chengdu Chongqing, and central Guizhou and Yunnan. The Yangtze River Delta region includes 26 prefecture-level cities, the middle reaches of the Yangtze River region include 28 prefecture-level cities, the Chengdu Chongqing region includes 16 prefecture-level cities, and the central Guizhou Yunnan region includes 7 prefecture-level cities. In the four regions, the OLS model, SAR model, and SEM model are used to analyze the regions that pass the significance test of the regression coefficient, while the OLS model is used to analyze the regions that do not pass the significance test of the regression coefficient. Among them, the Yangtze River Delta region and the middle reaches of the Yangtze River passed the significance test of the regression coefficient, while the Chengdu Chongqing region and central Guizhou and Yunnan region failed to pass the significance test of the regression coefficient. The empirical analysis results of the Yangtze River Delta region and Chengdu Chongqing region are shown in Table 5.
It can be seen from Table 5 that in the Yangtze River Delta region, the two regression coefficients pass the significance test at the level of 10% and 5%, respectively. It can be seen that the ecological efficiency of the Yangtze River Delta region has a high spatial role relationship and spatial dependence, and the spatial spillover benefits of ecological efficiency are relatively significant. From the perspective of the two explanatory variables of industrial structure upgrading and industrial structure rationalization, the model values of the OLS model, SAR model, and SEM model in the industrial structure upgrading variables are 0.092, 0.107, and 0.107 respectively, while the significance level is at the level of 1%, which shows that industrial structure upgrading is conducive to the improvement of ecological efficiency in the region. At the same time, the model values of the OLS model, SAR model, and SEM model in the variables of industrial structure rationalization are -0.053, -0.047, and -0.075 respectively. The significance level of the OLS model and SAR model is more than 10%, lacking statistical significance, while the significance level of the SEM model is 10%. It can be seen that the impact of industrial structure rationalization on regional ecological efficiency is mainly reflected in the spatial spillover effect. From the comparison of coefficients, the value of industrial structure upgrading is relatively higher, which shows that the impact of industrial structure upgrading is more significant. From the perspective of control variables, the logarithmic expression of GDP per capita is a significant positive impact, and the logarithmic square value of GDP per capita is a significant negative impact; The logarithmic representation of the number of employees and the logarithmic representation of the capital stock show a significant positive correlation, and the regression results of the energy structure are not significant, which indicates that the labor and capital variables have a positive significant impact on the ecological efficiency, but the impact of the energy variables on the ecological efficiency is not significant; The logarithm of the actual amount of foreign capital used shows a 1% significance in the OLS model, which shows that foreign investment can promote the ecological efficiency in the local area. The urbanization ratio shows significant positive performance in the OLS model and SAR model. It can be seen that urbanization variables have a significant positive impact on ecological efficiency, which is conducive to the improvement of ecological efficiency. In the Chengdu Chongqing region, the two regression coefficients have not passed the significance level test, which shows that the cooperation effect of urban groups within the region has not yet appeared, but from the perspective of the OLS model, the industrial structure upgrading still has a significant positive impact on ecological efficiency, and among the control variables, the labor variable and foreign capital variable have more significant effects. On the whole, the industrial structure of the Chengdu Chongqing region still needs to develop in an environmentally friendly direction. The empirical analysis results of the middle and long reaches and central Guizhou and Yunnan are shown in Table 6.
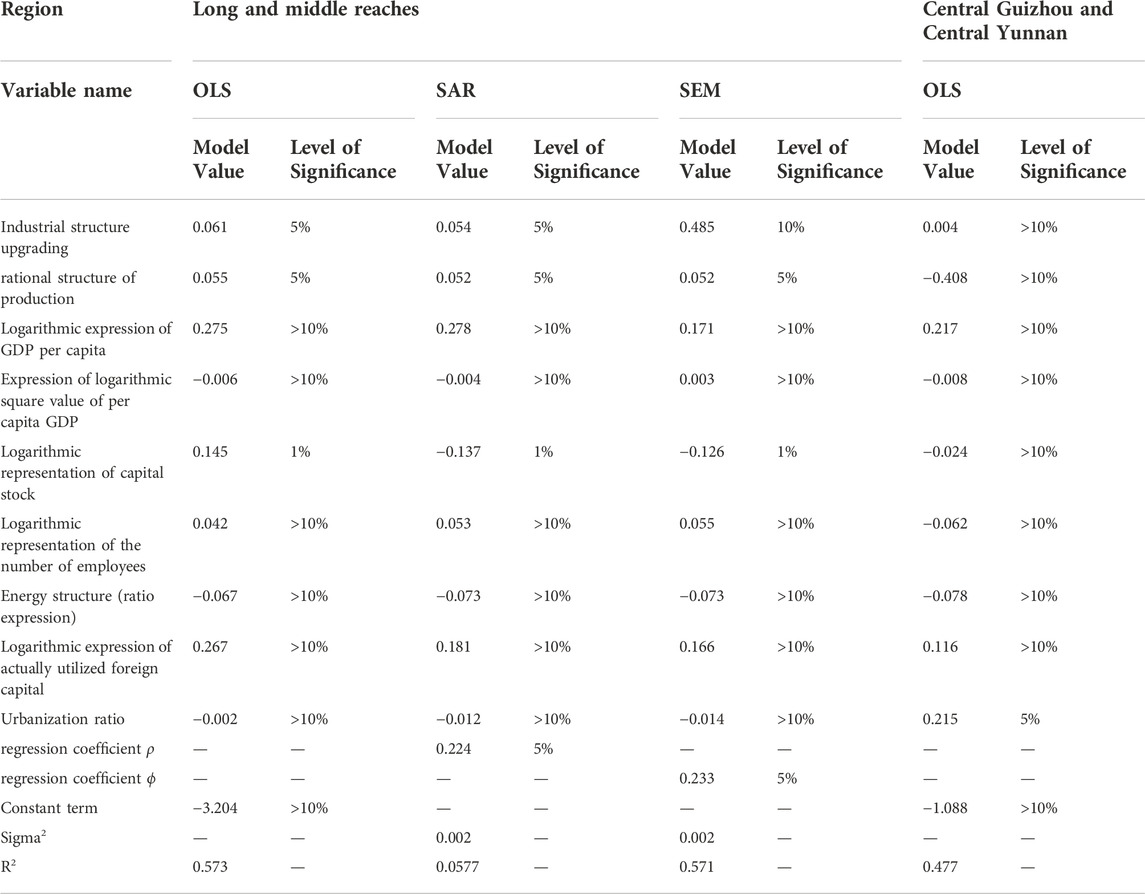
TABLE 6. Empirical results of the middle yangtze river region and the central guizhou yunnan region.
It can be seen from Table 5 that in the long and middle reaches, the two regression coefficients pass the significance test at the 5% level. It can be seen that the ecological efficiency in the long and middle reaches has a high spatial role relationship and spatial dependence, and the spatial spillover benefit of the ecological efficiency is relatively significant. From the two explanatory variables of industrial structure upgrading and industrial structure rationalization, the model values of the OLS model, SAR model, and SEM model in the industrial structure upgrading variables are 0.061, 0.054, and 0.052 respectively, and the significance level is at 5% and 10% significance levels respectively. It can be seen that industrial structure upgrading is conducive to the improvement of ecological efficiency in the region. At the same time, the model values of the OLS model, SAR model, and SEM model in the variables of industrial structure rationalization are 0.055, 0.052, and 0.052 respectively. The significance level of the OLS model and SAR model is at the 5% significance level. As the rationalization of industrial structure is a deviation from the value of the equilibrium state, it can be seen that the rationalization of industrial structure has a significant negative impact on the ecological efficiency in the region. From the comparison of coefficients, the value of industrial structure upgrading is relatively higher, which shows that the impact of industrial structure upgrading is more significant. From the perspective of control variables, the logarithmic expression of GDP per capita and the logarithmic square value of GDP per capita have no significant statistical significance; The logarithmic representation of the number of employees also lacks statistical significance, while the logarithmic representation of the capital stock shows a significant positive correlation in the OLS model, and a significant negative correlation in the SAR model and the SEM model, which shows that the capital variable has a more significant impact on the lag and spillover effects; The logarithm of the utilized foreign capital quota lacks significant statistical significance. The urbanization rate also lacks significant statistical significance. It can be seen that capital stock and foreign capital play a significant role in the improvement of ecological efficiency in the long and middle reaches. In the area of central Guizhou and central Yunnan, the two regression coefficients have not passed the significance level test, which shows that the cooperation effect of urban groups within the region has not yet appeared. However, from the perspective of the OLS model, the upgrading and rationalization of the industrial structure have not had a significant impact on the ecological efficiency, and in the control variables, all control variables except urbanization have not shown a significant impact, It can be seen that only urbanization will have a significant positive impact on production efficiency. In general, the industrial structure and urban cooperation effect in the central Guizhou Yunnan region have not yet taken shape. In general, the urban cooperation effect between the Yangtze River Delta and the middle reaches of the Yangtze River is relatively obvious, Under this kind of inter-city cooperation effect, the ecological efficiency has a significant spatial spillover effect, and Hypothesis 2 is valid. At the same time, in terms of industrial upgrading and industrial rationalization, industrial upgrading will have a significant positive impact on ecological efficiency in the regions that form the scale of ecological efficiency and ecological benefits, while in the regions that form a significant impact on industrial structure rationalization, industrial structure rationalization will have a significant negative impact on ecological efficiency. Once the assumption is established.
5 Conclusions and suggestions
In order to explore the impact of regional industrial structure transformation on ecological efficiency, the study proposes two types of assumptions on the correlation between production structure transformation and ecological efficiency, andC-D production function and cost function are the theoretical basis to establish a mathematical model of the impact of industrial structure transformation on ecological efficiency, and use SAR model and SEM model to form a spatial model. At last, the research uses the urban panel data of the Yangtze River Ecological Economic Zone from 2013 to 2021 as the data basis for empirical analysis. The research results show that, on the whole, The model values of OLS model, SAR model and SEM model on the variables of industrial structure upgrading are 0.081, 0.068 and 0.081 respectively, while the significance level is at the level of 1%. For the long and middle reaches where the rationalization of industrial structure is significant, the model values are 0.055, 0.052 and 0.052, respectively. The upgrading of industrial structure in ecological economic zones will have a significant positive impact on ecological efficiency, while the rationalization of industrial structure will have a significant negative impact on ecological efficiency. At the same time, from the perspective of spatial effect, under the city with obvious cooperation effect between the Yangtze River Delta and the middle reaches of the Yangtze River, the ecological efficiency has significant spatial spillover effect. The two types of assumptions proposed in the study are confirmed by regression analysis.
On the basis of this analysis, the following suggestions are put forward for the development of industrial structure and ecological efficiency of the Yangtze River Ecological Economic Zone: First, cities with high ecological efficiency levels in the Yangtze River Delta and the middle reaches of the Yangtze River should continue to play a leading role, drive the surrounding areas through effective space overflow, improve the convergence of regional ecological efficiency, and form ecological efficiency development regions with different centers; Secondly, we should effectively use the spatial transfer and driving effect of industrial structure between different regions to form a hierarchical industrial structure development system, promote the coupling of regional factors and production factors by promoting the optimization and transformation of industrial structure, and then reasonably improve the ecological efficiency and economic benefits; Thirdly, Chengdu Chongqing andIn regions such as central Guizhou and central Yunnan, where the effect of urban cooperation is not yet prominent, cooperation among cities should be strengthened to complement each other’s advantages and form a spatial effect, laying a good foundation for deepening the transformation of industrial structure and the development of ecological efficiency; Finally, large regions can form communication and interconnection through reasonable policy combination and economic guidance, so as to accelerate industrial adjustment, promote economic flow, and accelerate the development of Eco-efficient economy and society.
Data availability statement
The original contributions presented in the study are included in the article/supplementary material, further inquiries can be directed to the corresponding author.
Author contributions
YW: writing, reviewing, and editing. LW: investigation, supervisor.
Funding
This work was sponsored in part by National Social Science Foundation of China (20BJY068).
Conflict of interest
The author declares that the research was conducted in the absence of any commercial or financial relationships that could be construed as a potential conflict of interest.
Publisher’s note
All claims expressed in this article are solely those of the authors and do not necessarily represent those of their affiliated organizations, or those of the publisher, the editors and the reviewers. Any product that may be evaluated in this article, or claim that may be made by its manufacturer, is not guaranteed or endorsed by the publisher.
References
Akbar, U., Li, Q. L., Akmal, M. A., Shakib, M., and Iqbal, W. (2021). Nexus between agro-ecological efficiency and carbon emission transfer: Evidence from China. Environ. Sci. Pollut. Res. 28, 18995–19007. doi:10.1007/s11356-020-09614-2
Apriyanti, I. (2019). Analysis of oil palm production efficiency in PTPN IV gardens north sumatra. JASc j. Agribus. Sci. 3 (1), 45–51. doi:10.30596/jasc.v3i1.3707
Bai, D., Dong, Q., Khan, S. A. R., Chen, Y., Wang, D., and Yang, L. (2022). Spatial analysis of logistics ecological efficiency and its influencing factors in China: Based on super-SBM-undesirable and spatial dubin models. Environ. Sci. Pollut. Res. 29, 10138–10156. doi:10.1007/s11356-021-16323-x
Bryndin, E. (2020). Creation of social self-sufficient digital natural ecological economy. Resour. Environ. Econ. 2, 184–190. doi:10.25082/REE.2020.02.004
Chen, Y., Xu, Y., and Wang Zhong, Z. (2022). Air pollution effects of industrial transformation in the Yangtze River Delta from the perspective of spatial spillover. J. Geogr. Sci. 32, 156–176. doi:10.1007/s11442-021-1929-6
Feng, Y., and Wu, H. (2022). How does industrial structure transformation affect carbon emissions in China: The moderating effect of financial development. Environ. Sci. Pollut. Res. 29, 13466–13477. doi:10.1007/s11356-021-16689-y
Gu, B., Chen, F., and Zhang Kmarkram, H. (2021). The policy effect of green finance in promoting industrial transformation and upgrading efficiency in China: Analysis from the perspective of government regulation and public environmental demands. Environ. Sci. Pollut. Res. 28, 47474–47491. doi:10.1007/s11356-021-13944-0
Habibi, F., Khosravi, F., Kharrati, S., and Karimi, S. (2020). Simultaneous multi-area economic-environmental load dispatch modeling in presence of wind turbines by MOPSO. J. Electr. Eng. Technol. 15 (3), 1059–1072. doi:10.1007/s42835-020-00388-8
Haibo, C., Ke, D., Fangfang, W., and Ayamba, E. C. (2020). The spatial effect of tourism economic development on regional ecological efficiency. Environ. Sci. Pollut. Res. 27, 38241–38258. doi:10.1007/s11356-020-09004-8
Hu, Y., Jiang, H., and Zhong, Z. (2020). Impact of green credit on industrial structure in China: Theoretical mechanism and empirical analysis. Environ. Sci. Pollut. Res. 27, 10506–10519. doi:10.1007/s11356-020-07717-4
Kliment, M., Trebuna, P., Pekarcikova, M., Straka, M., Trojan, J., and Duda, R. (2020). Production efficiency evaluation and products' quality improvement using simulation. Int. J. Simul. Model. 19 (3), 470–481. doi:10.2507/ijsimm19-3-528
Lee, H. R., Yu, J., Yun, W. G., Nam, J., and Kim, K. J. (2019). Estimating environmental load of PSC beam bridge using standard quantities and resource DB model. KSCE J. Civ. Eng. 23 (3), 958–972. doi:10.1007/s12205-019-1013-2
Li, F., Frederick, S., and Gereffi, G. (2019). E-commerce and industrial upgrading in the Chinese apparel value chain. J. Contemp. Asia 49, 24–53. doi:10.1080/00472336.2018.1481220
Mohajan, H. K. (2021). Estimation of cost minimization of garments sector by cobb-douglas production function: Bangladesh perspective, Econ. Ser., 21. 2. doi:10.26458/21212
O’Hara, S., and Baker, D. (2020). . Local economies: Leading the way to an ecological economy, Sustainable wellbeing futures. Camberley, UK: Edward Elgar Publishing. 10.4337
Parente, C. E. T., Brusdzenski, G. S., Zonta, E., Lino, A. S., Azevedo-Silva, C. E., Dorneles, P. R., et al. (2020). Fluoroquinolones and trace elements in poultry litter: Estimation of environmental load based on nitrogen requirement for crops. J. Environ. Sci. Health, Part B 55 (12), 1087–1098. doi:10.1080/03601234.2020.1816794
Rahim, A., Hastuti, D. R. D., and Firmansyah, F. (2010). The applied of cobb-douglas production function with determinants estimation of small-scale fishermen's catches productions. Int. J. Oceans Oceanogr. 13, 1.
Rahim, A., Hastuti, D. R. D., and Firmansyah, F. (2019). The applied of cobbdouglas production function with determinants estimation of small-scale fishermen's catches productions. Int. J. Oceans Oceanogr. 13, 1. https://www.researchgate.net/publication/332631947_The_Applied_of_Cobb-Douglas_Production_Function_with_Determinants_Estimation_of_Small-Scale_Fishermen's_Catches_Production
Tian, K., Dietzenbacher, E., and Jong-A-Pin, R. (2019). Measuring industrial upgrading: Applying factor analysis in a global value chain framework. Econ. Syst. Res. 31, 642–664. doi:10.1080/09535314.2019.1610728
Tian, X., Bai, F., Jia, J., Liu, Y., and Shi, F. (2019). Realizing low-carbon development in a developing and industrializing region: Impacts of industrial structure change on CO2 emissions in southwest China. J. Environ. Manag. 233, 728–738. doi:10.1016/j.jenvman.2018.11.078
Tu, Z., Hu, T., and Shen, R. (2019). Evaluating public participation impact on environmental protection and ecological efficiency in China: Evidence from PITI disclosure. China Econ. Rev. 55, 111–123. doi:10.1016/j.chieco.2019.03.010
Vasyl’yeva, O. (2021). Assessment of factors of sustainable development of the agricultural sector using the Cobb-Douglas production function. Baltic J. Econ. Stud. 7, 37–49. doi:10.30525/2256-0742/2021-7-2-37-49
Wang, G., and Liu, S. (2020). Is technological innovation the effective way to achieve the “double dividend” of environmental protection and industrial upgrading? Environ. Sci. Pollut. Res. 27, 18541–18556. doi:10.1007/s11356-020-08399-8
Wang, K., Wu, M., Sun, Y., Shi, X., Sun, A., and Zhang, P. (2019). Resource abundance, industrial structure, and regional carbon emissions efficiency in China. Resour. Policy 60, 203–214. doi:10.1016/j.resourpol.2019.01.001
Wang, S., Wang, X., Lu, F., and Fan, F. (2021). The impact of collaborative innovation on ecological efficiency–empirical research based on China’s regions. Technol. Analysis Strategic Manag. 33, 242–256. doi:10.1080/09537325.2020.1812564
Weber, G., and Cabras, I. (2019). The ecological economy of georgescu-roegen.” in Economic Theory and Globalization. Heidelberg, Germany: Springer,
Xiong, S., Ma, X., and Ji, J. (2019). The impact of industrial structure efficiency on provincial industrial energy efficiency in China. J. Clean. Prod. 215, 952–962. doi:10.1016/j.jclepro.2019.01.095
Zhang, T., Shi, Z. Z., Shi, Y. R., and Chen, N. J. (2022). Enterprise digital transformation and production efficiency: Mechanism analysis and empirical research. Econ. Research-Ekonomska Istraživanja 35 (1), 2781–2792. doi:10.1080/1331677x.2021.1980731
Zhang, Y., Zhang, H., Fu, Y., Wang, L., and Wang, T. (2020). Effects of industrial agglomeration and environmental regulation on urban ecological efficiency: Evidence from 269 cities in China. Environ. Sci. Pollut. Res. 28, 66389–66408. doi:10.1007/s11356-021-15467-0
Keywords: industrial structure, ecological economy, ecological efficiency, CD production function, spatial econometric model
Citation: Wang Y and Wang L (2022) Study on the effect of industrial structure transformation on regional ecological efficiency in ecological economic zone under carbon peaking and carbon neutrality strategy. Front. Environ. Sci. 10:1078406. doi: 10.3389/fenvs.2022.1078406
Received: 24 October 2022; Accepted: 07 November 2022;
Published: 22 November 2022.
Edited by:
Junyuan Guo, Chengdu University of Information Technology, ChinaReviewed by:
Zhixiong Huang, Zhejiang University of Finance and Economics, ChinaHao Wang, Central University of Finance and Economics, China
Copyright © 2022 Wang and Wang. This is an open-access article distributed under the terms of the Creative Commons Attribution License (CC BY). The use, distribution or reproduction in other forums is permitted, provided the original author(s) and the copyright owner(s) are credited and that the original publication in this journal is cited, in accordance with accepted academic practice. No use, distribution or reproduction is permitted which does not comply with these terms.
*Correspondence: Yan Wang, d2FuZzMzMjg1QDE2My5jb20=
 Yan Wang
 Ladi Wang1