 Fengge Yao1
 Xiaomei Wang
- 1School of Finance, Harbin University of Commerce, Harbin, Heilongjiang, China
- 2School of Tourism and Culinary Arts, Harbin University of Commerce, Harbin, Heilongjiang, China
The industrial green technology innovation of a region is of great significance for promoting the high-quality development of the regional economy and promoting the construction of ecological civilization. Based on the panel data of 30 provinces (except Tibet) in China from 2010 to 2020, this paper uses the Data Envelopment Analysis model adding unexpected output to measure China’s industrial green technology innovation efficiency (IGTIE) under the common Frontier and regional Frontier. The results show that: 1) The industrial green technology innovation efficiency generally shows an upward trend, which is mainly due to technical progress and efficiency improvement. Under the common Frontier, IGTIE has an average annual growth of 6.54%, and under the regional Frontier, IGTIE has an average annual growth of 6.77%. 2) Whether under the common Frontier or the regional Frontier, the central region has obvious advantages in IGTIE compared with the western region and the eastern region. 3) Under the two frontiers, the western region is dominated by efficiency change. Finally, according to the empirical analysis results, specific policy recommendations are put forward for the improvement of China’s future industrial green technology innovation efficiency.
1 Introduction
Over the past 30 years, China’s economy has developed at a high speed with an average annual growth rate of nearly 10%. In 2020, the GDP has broken through the 100 trillion mark and reached 101.6 trillion yuan. According to the average annual exchange rate, China’s GDP in 2020 ranked second in the world after the United States, accounting for about 17% of the world’s GDP. In 1990, China’s GDP was only 1887.29 billion yuan, accounting for less than 2% of the world’s GDP. From the above data, we can see that China has achieved a huge economic take-off and amazing development feats. However, with the gradual reduction and disappearance of the traditional population and resource dividend, the problems of resource waste (Mele and Magazzino, 2020; Udemba et al., 2020; Magazzino and Mele, 2021), environmental pollution and ecological damage brought about by the past extensive economic growth model have become increasingly prominent (Zhang et al., 2022a; Zhang et al., 2022b; Ma et al., 2022).
China’s economy is shifting from high-speed development to high-quality development, and technological innovation plays a crucial role in green development (Vollenbroek, 2002; Sun et al., 2021; Wang et al., 2021). Green technology innovation is the core driving force of green development (Zhang and Li, 2020; Li and Song, 2022). However, green technology innovation is a new concept that combines traditional innovation with ecological protection (Yin et al., 2020; Lv et al., 2021). Many enterprises have insufficient awareness and concern about their existence in production activities (Van Hemel and Cramer, 2002; Hairuddin et al., 2012), resulting in weak foundation and slow development of green technology innovation research in China. Therefore, how to improve the efficiency of green technology innovation in China, so as to achieve green and high-quality economic development has become an urgent problem to be solved by the current government. Industry is the pillar of the national economy (Lin and Xu, 2018), but it is also the main producer of a series of problems such as resource shortage, environmental pollution, and ecological damage (Omer, 2008; Lieder and Rashid, 2016). The IGTIE is the endogenous power of industrial green development, so how to promote the IGTIE with industrial enterprises as the core has naturally become the top priority of the government’s work. Therefore, this paper uses the DEA model with negative output to measure the IGTIE of 30 provinces (except Tibet) in China from 2010 to 2020 under the common Frontier and group Frontier.
The rest part of this article is arranged as follows. Section 2 is the literature review. Section 3 introduces the methodology and data and the results and discussions are explained in Section 4. Relevant policy recommendations are presented in Section 5.
2 Literature review
Green technology innovation, also known as ecological technology innovation, is a kind of innovation (Oltra et al., 2010; Faucheux and Nicolaï, 2011). Generally, management innovation and technological innovation with the goal of protecting the environment are collectively referred to as green technological innovation (Jie, 2021). The efficiency of green technology innovation is a green evaluation definition based on the concept of green technology and technology innovation. In terms of measurement methods, it mainly includes single indicator measurement, Stochastic Frontier Analysis (SFA) and Data Envelopment Analysis (DEA). Among them, the single indicator measurement is mainly based on the achievements of green technology innovation, using the single indicator of green technology patents to measure the change of green technology innovation efficiency. Due to the limitation of indicator selection in the measurement process of single indicator method (Taques et al., 2021), it can not fully reflect the efficiency level of green technology innovation, and this method is used less (Hoskins and Mascherini, 2009). The SFA constructs the production Frontier and measures the relative effectiveness of Decision Making Units (DMUs) through distance functions (Wu et al., 2010; Yu et al., 2022). The SFA method is based on parameter analysis, which needs to set the form of production function in advance, and can decompose the error term into random error term and technical inefficiency rate term (Andries, 2011). However, the limitation of single output and improper function setting are prone to bias the analysis results (Royston et al., 2006; Brown et al., 2020).
In contrast, the DEA model is more widely used and more objective (Sueyoshi et al., 2009; Liu et al., 2013). Because this method is based on the theory of total factor productivity, it also considers the cross interaction between various investment factors in economic entities (Wang and Huang, 2007; Ployhart et al., 2014) and the impact on the effect of technological innovation. The DEA model is based on a non-parametric basis. It directly constructs the production Frontier through samples to avoid setting the production function, and uses linear programming to solve the relative efficiency value of the DMUs (Joumady and Ris, 2005; Amirteimoori and Kordrostami, 2010). Since DEA does not need to assume the specific production function form in advance, it has more advantages than SFA (Fall et al., 2018; Strange et al., 2021). And this method has been widely used to measure efficiency in recent years. Nurkse 1953) believed that the spatial development would tend to be balanced, and attributed it to the flow of production factors among regions, that is, the development degree of each region would eventually converge due to the regional flow of production factors. Conceição et al. (2006) studied 1429 manufacturing enterprises in Portugal under environmental constraints, and found that enterprise size and total exports have a positive impact on enterprise innovation performance. Nasierowski and Arcelus (2012) calculated the efficiency of green innovation from 2005 to 2009 using DEA method, and analyzed the input and output of green innovation in the innovation process. Amore and Bennedsen (2016) analyzed the relationship between corporate governance and green innovation using the data of American listed companies from 1976 to 1995. Generally, previous studies did not take into account the heterogeneity of different regions.
This paper focused on the industrial green innovation in the developing world, and the decarbonization in related sectors is also worthy to be noted. Thereinto, buildings show the most significant potential in cost-effectiove emission reduction, which is worthy to be discussed. Yan et al. (2022) developed for the first time with 8*14 matrix generalized Diviia index method to determine 14 factors and analyze provincial carbon change in residential building operation from 2000 to 2018. Xiang et al. (2022) assessed the progress of decarbonization of commercial building operations in 16 countries over the past 20 years by using the decomposition structure decomposition method, taking into account socio-economic, technological, climate and end use factors. It is found that the average carbon intensity of commercial building operations in 16 countries decreased by 1.94% every year from 2000 to 2019. Ma et al. (2022) estimated the decarburization level of commercial buildings in China’s five major cities through the generalized Diviia index method, and considered the impact of socio-economic, technological evolution and climate. It is found that the economic growth effect and energy consumption are the main driving factors for the surge of carbon emissions in megacities from 2000 to 2018.
In recent years, some scholars have made contributions to the research on the IGTIE. Du et al. (2019) studied IGTIE from 2009 to 2016 and found that from 2009 to 2016, the green technology innovation R&D efficiency of Chinese industrial enterprises was 0.855. Chen et al. (2021) studied IGTIE from 2008 to 2017 and found that there are obvious gaps in the efficiency of green technology innovation in different regions. Shen et al. (2022) sample span is 2005–2017 and found that on the whole, China has experienced a relatively low but gradually increasing IGTIE, which shows gradient changes among provinces, and regional differences are increasingly prominent. This paper aims to promote the IGTIE with industrial enterprises as the core. To sum up, the innovation of this paper is mainly reflected in the following three aspects: 1) From the research perspective, this paper introduces unexpected output, highlighting the importance of environmental issues for industrial technology innovation. 2) In terms of research methods, considering regional heterogeneity, this paper constructs a DDF model based on the common Frontier to evaluate IGTIE in different regions. 3) In terms of data and sample selection, this paper selects the input and output data of 30 provinces in China from 2010 to 2020. Compared with previous research data, the year is updated, which is more suitable for China’s development and changes, and can more accurately evaluate the current IGTIE situation in China. The research in this paper is of great significance for improving IGTIE and reducing the gap between regions.
3 Methodology and data
3.1 DDF model
First, we define environmental production technology, which refers to the possible set
Let
In this paper, the non-parametric DEA method is used to solve DDF. Compared with the parametric method, it has the advantage that it does not need to set any functions and parameters in advance, thus avoiding the influence of subjective factors, and the calculation results are more objective. The details are as Eq. 3:
3.2 Meta-Frontier model
When using DEA model to analyze IGTIE in different provinces of China, it is generally assumed that each evaluated DMU has the same or similar technology level, and then the reasons for technology ineffectiveness are studied. China has a vast territory, and there are large differences in resource endowment, industrial structure, development level, etc. Among provinces and cities. If these differences are not considered, and IGTIE comparison is conducted among these provinces and cities under the same technical level, the real IGTIE of each province cannot be obtained. In response to such problems, Battese et al. (2004) proposed a solution: first, divide each DMU into different groups according to a certain division standard, build a common Frontier and different regional Frontier, calculate the technical efficiency of the common Frontier and different group Frontier, and define the ratio of the two as the Technology Gap Ratio (TGR). On this basis, O’Donnell et al. (2008) constructed the group Frontier and common Frontier based on the DEA method.
For each DMU in the DEA model, output (
Suppose there is a subset
Group technology set
The distance functions
Under the framework of the common Frontier, the most important indicator is the “Technology Gap Ratio (TGR)”, which reflects the gap between the group Frontier and the common Frontier technology level. TGR is expressed as Eq. 5:
TGR closely links the common Frontier with the group Frontier, and can measure the technical efficiency gap of the same DMU under different frontiers. The larger the value, the closer the actual production efficiency is to the potential production efficiency. At the same time, this value can also reflect the necessity of dividing different groups. The smaller the TGR value is, the more necessary it is.
Considering the heterogeneity of technological Frontier in different regions, this paper uses Meta-Frontier Malmquist Luenberger (MML) index to bring different technological Frontier into the same technological Frontier for production efficiency analysis. This paper constructs MML index based on global benchmark technology (Oh, 2010). The calculation method is as Eq. 6:
Further decompose the MML index into efficiency change (EC) and technology change (TC).
Where
3.3 Data and variables
Based on the availability of data and the selection of indicators by scholars, the following indicators are finally selected as the basis for measuring China’s industrial green technology innovation efficiency. See Table 1 for details:
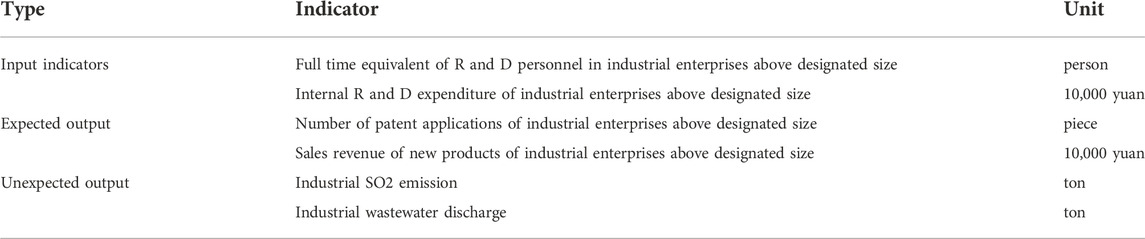
TABLE 1. Indicator selection.
Among them, input indicators are divided into human investment and capital investment. The full-time equivalent R and D personnel of industrial enterprises above the designated size is selected as the human investment, and the internal R and D expenditure of industrial enterprises above the designated size is selected as the capital input. The R and D price index in 2010 is taken as the base period for reduction. The expected output is the number of patent applications of industrial enterprises above designated size and the sales revenue of new products of industrial enterprises above designated size. The sales revenue of new products is deflated by the industrial GDP price index. According to He and Cai (2021), industrial SO2 emissions and industrial wastewater emissions are selected as unexpected outputs. Descriptive statistics of input and output indicators are shown in Table 2.
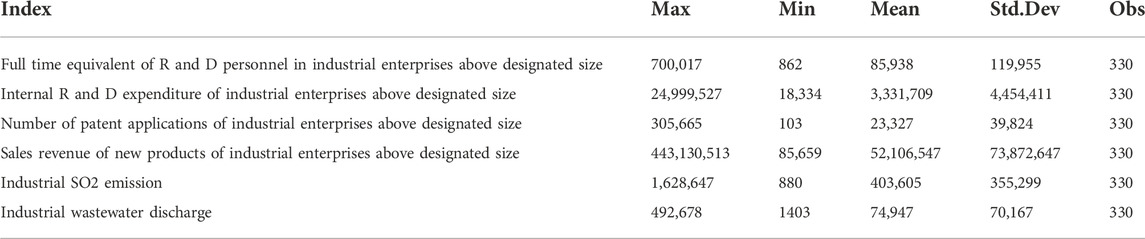
TABLE 2. Descriptive statistics of input and output indicators.
According to the principles of data availability and operability, excluding Hong Kong, Macao, Taiwan, and Tibet, the data of 30 provinces or municipalities in China over the 2010–2020 are selected for analysis and calculation. It is divided into three regions: the eastern region (Beijing, Guangdong, Hainan, Tianjin, Fujian, Hebei, Liaoning, Shandong, Jiangsu, Shanghai and Zhejiang), the central region (Anhui, Heilongjiang, Henan, Hubei, Jilin, Hunan, Jiangxi, Shanxi and Inner Mongolia) and the western region (Gansu, Chongqing, Sichuan, Guizhou, Guangxi, Shaanxi, Ningxia, Xinjiang, Yunnan and Qinghai). The selected data are mainly from “China Science and Technology Statistics Yearbook”, “China Statistics Yearbook”, “China Energy Statistics Yearbook” and “China Environment Statistics Yearbook” from 2010 to 2020.
4 Results and discussions
4.1 The overall change of IGTIE in China
As shown in Figure 1, from the average value of national IGTIE, from 2011 to 2020, the efficiency of China’s industrial enterprises showed a small upward trend. Under the common Frontier, from 1.0862 in 2011 to 1.1227 in 2020, and under the regional Frontier, from 1.0550 in 2011 to 1.1529 in 2020, both are positive growth, indicating that China’s industrial enterprises have been making progress in green technology innovation in the past decade. Under the overall national Frontier, the year when IGTIE reached its maximum was 2016 (1.1842), in which the value of EC contributed 4.97% and the value of TC contributed 13.48%. The year of minimum value is 2015 (0.9811), mainly due to the low level of EC (0.9760). At the regional Frontier, the year when IGTIE reached its maximum was 2016 (1.1822), in which the value of EC contributed 11.30% and the value of TC contributed 7.45%. The year of minimum value is 2014 (0.9948). The main reasons for the low IGTIE are the external environmental factors such as the intensity of environmental regulation, the intensity of market competition, the level of economic development, the industrial structure and the degree of opening to the outside world. Both the common Frontier and the group Frontier have the highest IGTIE in 2016. This is mainly because on 30 June 2016, the Ministry of Industry and Information Technology issued the “Industrial Green Development Plan (2016–2020)”, which requires solid promotion of cleaner production, significant reduction of pollution emissions, the creation of a benign green development environment, the overall level of industrial green development, and the promotion of China’s industrial transformation, upgrading and sustainable development, accelerate China’s step towards a manufacturing power.
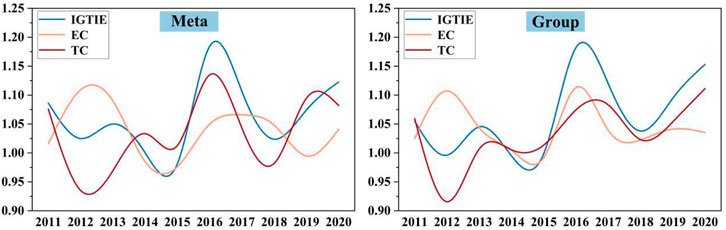
FIGURE 1. China’s IGTIE and its decomposition indexes during 2010–2020.
It can be seen from Figure 2 that there are significant differences in efficiency between different provinces. Under the common Frontier, the three provinces with the highest average IGTIE are Qinghai (1.2473), Heilongjiang (1.1330) and Jiangxi (1.1272). Among them, the IGTIE of Qinghai and Jiangxi declined slightly from 2016 to 2020, indicating that although the structure of input and output has gradually become reasonable, it still needs to develop towards the direction of steadily improving the efficiency value. Chongqing has the lowest efficiency value (0.9999), and the average IGTIE of all provinces is 1.0654. Although Qinghai is located in the inland area, in the process of technological innovation, the scientific and technological development trend is good, and it has achieved good environmental and economic benefits, but it has not driven the surrounding provinces with relatively poor efficiency. The future task is to drive the development of IGTIE in the western region of the surrounding while maintaining its own advantages. Chongqing, the lowest ranked city, has an efficiency of less than 1. This is because it is located in a mountainous area. In addition, its geographical location is relatively biased, its industrial foundation and technical level are weak, and the marginal output brought by scientific and technological input is less.
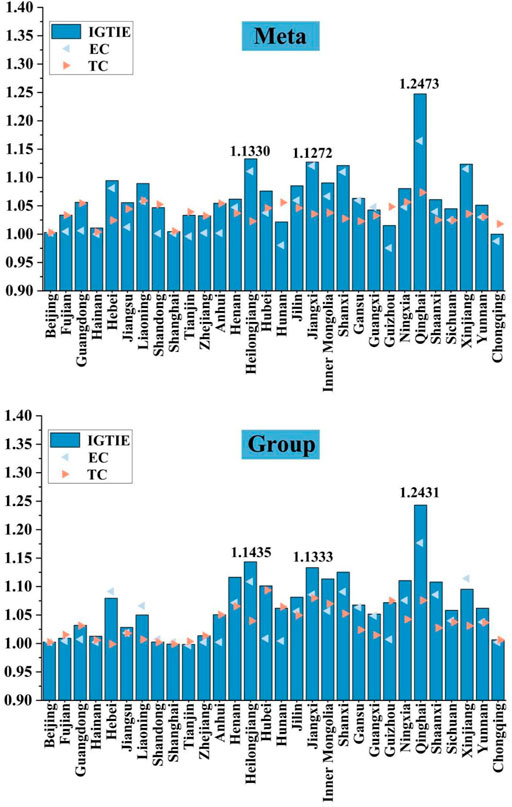
FIGURE 2. IGTIE and its decomposition target in different provinces.
In addition, it can also be seen that IGTIE in inefficient provinces showed an overall upward trend from 2010 to 2020, and the gap between provinces was gradually narrowing. Heilongjiang and other northeast regions attach importance to agricultural development, but also pay attention to investment and support for technological innovation of industrial enterprises. In addition, due to the vast land and sparse population, the region has attracted innovative talents in recent years. With the support of the national strategic policy of revitalizing the old industrial base in the northeast, the region continues to vigorously promote technological innovation to achieve a qualitative leap.
Under the regional Frontier, the three provinces with the highest average IGTIE are still Qinghai (1.2431), Heilongjiang (1.1435) and Jiangxi (1.1333). Tianjin has the lowest efficiency value (0.9984). The average IGTIE of all provinces is 1.0677. The number of regions higher than the national average is greater than the number of regions lower than the national average, indicating that the overall level of green technology innovation in China is at a high level. There are large differences between provinces, and the development is unbalanced. There is still much room for improvement in the future. It shows that the provinces can make good use of resources during the investigation period and make continuous efforts to realize the coordinated development of economy and environment. Both Heilongjiang and Jiangxi are located in the central region. As hubs connecting the eastern and western regions, they have perfect supporting facilities for technology development, high degree of marketization, and perfect relevant management systems. They are in the forefront of the country in terms of investment scale and output in science and technology research and development. Although Beijing and Shanghai have a high level of technology and management, developed economy, and are concentrated areas of talents and technology, they are densely populated, limited in resources, and greatly restricted in industrial development.
Shanxi has always been at a high efficiency level, which is because Shanxi is an important coal province in China, with rich resources and energy. Although the economic development model was extensive in the past, with the emphasis on environmental governance in recent years, IGTIE is at a better level. The overall development trend of Hebei Province is good. The possible reason is that Hebei is located in North China, close to Beijing as the capital, and has a superior geographical position. In recent years, Hebei has rapidly become a concentration of finance, science and technology and talents. In the future, it should continue to maintain a fast and stable high-quality development trend. The change index of technical efficiency in Shanghai and Tianjin is less than 1. Therefore, on the basis of a better development trend, the arrangement of technology input and output structure should be more reasonable, and technological innovation should be continuously strengthened to promote technological progress.
As shown in Figure 3, the TGR of Beijing and Zhejiang is 1, reaching the best Frontier, which indicates that the reform of science and technology management system in these provinces has achieved remarkable results. Shanghai, Anhui, Tianjin and Guangdong are also very close to the best Frontier, with TGR of 0.9995, 0.9964, 0.9922 and 0.9894 respectively. The gap with the common Frontier is only 0.05%, 0.36%, 0.78% and 1.06% respectively. Yunnan (0.7967), Hubei (0.7897), Sichuan (0.7818), Shaanxi (0.7096) and Guizhou (0.6914) are far away from the best Frontier, with a gap of 20.33%, 21.03%, 21.82% and 29.04% respectively from the common Frontier. There is a great room for progress. In a word, due to the large geographical span of China and the unbalanced development between many provinces and cities, the geographical and environmental factors have derived the differences in the economic environment, political environment, market environment and internal environment of enterprises in various provinces, making the efficiency of green technology innovation in various provinces different. In addition, the strong technological innovation ability of some provinces has failed to drive the development of backward regions. It is necessary to accelerate regional coordinated development and narrow provincial differences.
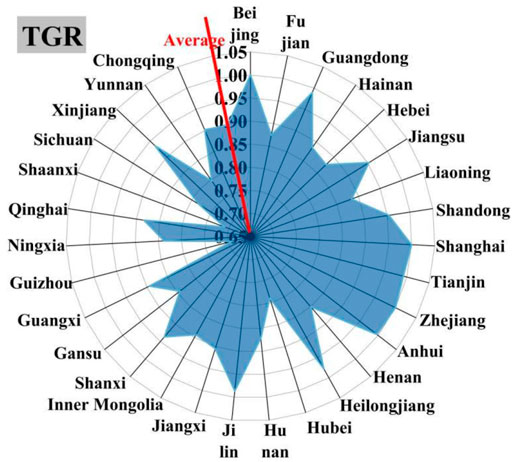
FIGURE 3. TGR in different provinces.
4.2 The change of IGTIE in different regions
As shown in Figure 4, the change trend of IGTIE in the eastern and central regions is basically the same, both of which are characterized by two phased peaks (2016 and 2019). The efficiency of green technology innovation is not very stable, and they are the key areas for future policies. After the small peak in 2013, the western region experienced a steady development stage and reached another peak in 2020. Compared with the rising trend of IGTIE in the central region, the efficiency level in the western and eastern regions is not only characterized by a significantly lower absolute level, but also shows a difference in the growth rate. The differences in green technology R&D investment, market incentive mechanism, innovation policy synergy and other aspects in different regions at different times lead to obvious differences in their IGTIE. Among them, the central and western regions take 2014 as the watershed. After 2014, the efficiency value of green technology innovation in the central region has been higher than that in the western region, indicating that with the rise of the central region and the implementation of the city cluster strategy in the middle reaches of the Yangtze River, the IGTIE in the central region has been rising.
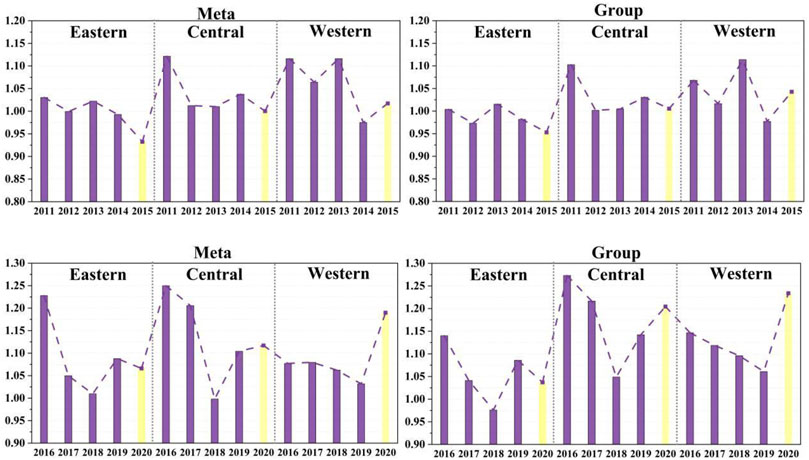
FIGURE 4. IGTIE in three regions during 2010–2018.
In 2012, 2013 and 2018, the value of EC in the eastern region was greater than 1, and the value of TC was less than 1. Although the value of TC in 2013 was less than 1, the IGTIE increased compared with the previous year, mainly because the growth of technical efficiency offset the negative impact of the technological recession, indicating that the level of technological progress still needs to be improved. In 2014, the value of EC was less than 1, the value of TC was greater than 1, and IGTIE was 0.9928, showing a negative growth. In 2015, there was a greater decline. This change needs attention. This year’s TC and EC were both negative, which directly led to the reduction of IGTIE. In the future, it should find the right development direction, continue to strengthen green technology innovation, and gradually achieve rapid and stable development. In 2016, the value of IGTIE was the highest, due to the joint promotion of the two indexes, and the fastest growth of TC in this year, indicating that the improvement of technological progress promoted the improvement of IGTIE. In 2018, although both the values of EC and TC were greater than 1, TC had a weak pulling effect, making IGTIE greater than one but still not exceed the growth rate of the previous year. The value of IGTIE in the central region was the lowest in 2018, mainly due to the decline of technological progress, which exceeded the positive impact of technical efficiency improvement. The value of IGTIE in the western region was the lowest in 2014. In general, under the common Frontier, IGTIE shows an average annual growth trend of 6.54%, with an average annual growth of 3.75% for EC and 3.63% for TC. Under the regional Frontier, IGTIE has an average annual growth of 6.77%, with an average annual growth of 4.23% for EC and 3.46% for TC.
As shown in Figure 5, under the common Frontier, the average annual IGTIE of the eastern region, central region and western region is 1.0419, 1.0857 and 1.0729 respectively. Under the regional Frontier, the average annual IGTIE is 1.0207, 1.1030 and 1.0874 respectively. The growth of IGTIE in the eastern region is mainly attributed to the growth of TC, which shows that the industrial enterprises in the eastern region have relatively strong independent innovation ability and rapid technological level improvement. The growth of IGTIE in the central and western regions mainly depends on the growth of EC. The reason may be that in recent years, with the acceleration of industrial restructuring, industries have been transferred from the eastern region to the central and western regions on a large scale. The industrial agglomeration effect has greatly improved the technical efficiency change index of industrial enterprises in the central and western regions. From the perspective of the three regions, the values of IGTIE, EC and TC indices show a decreasing trend in the central region, the western region and the eastern region.
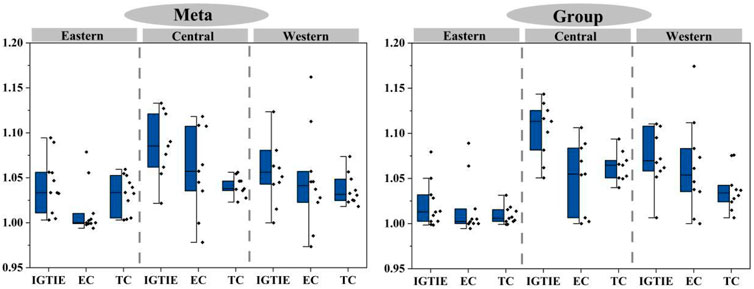
FIGURE 5. Average IGTIE and its decomposition target in three regions.
China’s IGTIE presents an obvious unbalanced spatial distribution pattern of “central-western-eastern”. From the dynamic evolution trend of the three major economic sectors, the change trend of the whole country and the eastern, central and western regions is almost the same. IGTIE varies greatly among regions, which is highlighted by the long-term adherence to the direction of intelligent, green and low-carbon industrial development in some regions, as well as the high attention paid to environmental protection. It makes IGTIE reach the global Frontier, while in other provinces, there is a large space for efficiency improvement.
As shown in Figure 6, the average TGR of the eastern region is 0.9460, the central region is 0.9117, and the western region is 0.8274. The three regions have not reached the best Frontier technology level, and are 5.40%, 8.83% and 17.26% behind the common Frontier respectively. Although the IGTIE of the central region is relatively high, there is still a certain gap from the optimal Frontier. Although the IGTIE of the eastern region is relatively low, it is relatively close to the optimal Frontier, which indicates that the technology level of the eastern region is advanced and the industrial green technology level is relatively high. The gap between TGR and common Frontier in the western region is the largest.
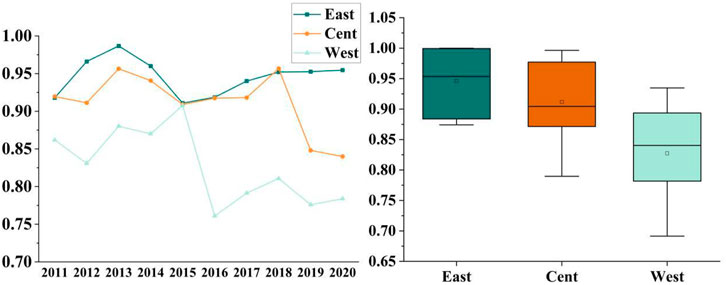
FIGURE 6. Average TGR in different regions.
5 Conclusion and policy recommendations
Based on the panel data of 30 provinces (except Tibet) in China from 2010 to 2020, this paper uses the DEA model adding unexpected output to measure China’s IGTIE under the common Frontier and group Frontier. The following conclusions are drawn:
Firstly, IGTIE shows an overall upward trend, which is mainly due to technical progress and efficiency improvement. Under the common Frontier, IGTIE has an average annual growth of 6.54%, of which EC contributes 3.75% and TC contributes 3.63%. Under the regional Frontier, IGTIE has an average annual growth of 6.77%, of which EC contributes 4.23% and TC contributes 3.46%. Compared with the value of TC, the value of EC contributes more. Secondly, Whether in the common Frontier or under the regional Frontier, the central region has obvious advantages in IGTIE compared with the western region and the eastern region. Under the common Frontier, the values of IGTIE of the three regions are 1.0419, 1.0857 and 1.0729 respectively. Under the regional Frontier is 1.0207, 1.1030 and 1.0874 respectively, which are greater than 1. Thirdly, Under the common Frontier, the values of EC of the three regions are 1.0128, 1.0571 and 1.0470 respectively, and the values of TC are 1.0322, 1.0405 and 1.0369 respectively; Under the regional Frontier, the values of EC of the three regions are 1.0160, 1.0517 and 1.0628 respectively, and the values of TC values are 1.0090, 1.0630 and 1.0373 respectively. Under the two frontiers, the western region is dominated by EC. (Whitaker, 1953).
Based on the actual situation of China’s industrial enterprises, the following policy recommendations are proposed:
1) China should take corresponding measures according to the specific causes of the lack of efficiency in each province. China has a vast territory, and the economy and culture of each province are quite different. It should speed up the balanced development of technology and economy in each region, formulate policies that favor the central and western regions, formulate relevant preferential policies to attract funds and high-quality scientific and technological talents, and promote the improvement of green technology innovation.
2) Industrial enterprises should improve the level of innovation management and enhance the awareness of green technology innovation. Encourage and guide scientific and technological R&D personnel to enhance innovation ability based on green growth and promote green innovation transformation and upgrading. In addition, enterprises need to constantly adjust their investment direction, research direction and achievement transformation direction, and actively respond to the changing market demand. It should actively promote the integration of production, teaching and research.
3) The government should formulate the standards for green scientific and technological enterprises. As the main body of regulating the enterprise innovation system, the government should start from the investment in technological innovation, energy consumption intensity, pollutant emissions and the transformation and application of innovation achievements. Implement the reward and punishment mechanism, and give preferential tax relief policies and R and D subsidies to enterprises that meet the standards; Take punitive measures against enterprises with high pollution and implement the market trading mechanism of emission rights.
This paper is an essential attempt to study the China’s industrial green technology innovation efficiency from the regional aspects, which can be used for reference by future studies. However, there are still some room for expansion and limitations for the future work. Firstly, although the latest available data has been used, it still lags behind. If the data is updated, this study should be further enriched. Secondly, it will be interesting to see how the method can be applied to analyze the industrial green technology innovation efficiency of other countries. It is equally hoped this paper can be able to spur more research in the direction of industrial green technology innovation to design several policies for improving industrial green technology innovation efficiency and ultimately reducing pollution emissions.
Data availability statement
Publicly available datasets were analyzed in this study. This data can be found here: The data underlying the results presented in the study are available from “China Science and Technology Statistics Yearbook”, “China Statistics Yearbook”, “China Energy Statistics Yearbook” and “China Environment Statistics Yearbook”. https://data.cnki.net/yearbook/Single/N2022010277 https://data.cnki.net/yearbook/Single/N2021110004 https://data.cnki.net/yearbook/Single/N2022060061 https://data.cnki.net/yearbook/Single/N2022030234.
Author contributions
Conceptualization, Methodology, Software: FY; ZQ Data curation, Writing- Original draft preparation, ZQ Writing- Reviewing, Supervision, ZQ; XW.
Funding
This research was funded by the National Social Science Foundation Program of China (17BJY119).
Conflict of interest
The authors declare that the research was conducted in the absence of any commercial or financial relationships that could be construed as a potential conflict of interest.
Publisher’s note
All claims expressed in this article are solely those of the authors and do not necessarily represent those of their affiliated organizations, or those of the publisher, the editors and the reviewers. Any product that may be evaluated in this article, or claim that may be made by its manufacturer, is not guaranteed or endorsed by the publisher.
References
Amirteimoori, A., and Kordrostami, S. A Euclidean distance-based measure of efficiency in data envelopment analysis[J]. Optimization, 2010, 59(7): 985–996. doi:10.1080/02331930902878333
Amore, M. D., and Bennedsen, M. Corporate governance and green innovation[J]. J. Environ. Econ. Manag., 2016, 75: 54–72. doi:10.1016/j.jeem.2015.11.003
Andries, A. M. The determinants of bank efficiency and productivity growth in the Central and Eastern European banking systems[J]. East. Eur. Econ., 2011, 49(6): 38–59. doi:10.2753/EEE0012-8775490603
Battese, G. E., Rao, D. S., and O'donnell, C. J. A metafrontier production function for estimation of technical efficiencies and technology gaps for firms operating under different technologies[J]. J. Prod. analysis, 2004, 21(1): 91–103. doi:10.1023/B:PROD.0000012454.06094.29
Brown, T., Mann, B., Ryder, N., Subbiah, M., Kaplan, J., Dhariwal, P., et al. Language models are few-shot learners[J]. Adv. neural Inf. Process. Syst., 2020, 33: 1877–1901. doi:10.48550/arXiv.2005.14165
Chambers, R. G., Chung, Y., and Färe, R. Profit, directional distance functions, and Nerlovian efficiency[J]. J. Optim. theory Appl., 1998, 98(2): 351–364. doi:10.1023/A:1022637501082
Chen, W., Pan, L., Lin, C., Zhao, M., Li, T., and Wei, X. Efficiency evaluation of green technology innovation of China’s industrial enterprises based on SBM model and EBM model[J]. Math. Problems Eng., 2021, 2021, 1,11. doi:10.1155/2021/6653474
Conceição, P., Heitor, M. V., and Vieira, P. S. Are environmental concerns drivers of innovation? Interpreting Portuguese innovation data to foster environmental foresight[J]. Technol. Forecast. Soc. Change, 2006, 73(3): 266–276. doi:10.1016/j.techfore.2004.11.009
Du, J., Liu, Y., and Diao, W. Assessing regional differences in green innovation efficiency of industrial enterprises in China[J]. Int. J. Environ. Res. Public Health, 2019, 16(6): 940. doi:10.3390/ijerph16060940
Fall, F., Akim, A., and Wassongma, H. DEA and SFA research on the efficiency of microfinance institutions: A meta-analysis[J]. World Dev., 2018, 107: 176–188. doi:10.1016/j.worlddev.2018.02.032
Faucheux, S., and Nicolaï, I. IT for green and green it: A proposed typology of eco-innovation[J]. Ecol. Econ., 2011, 70(11): 2020–2027. doi:10.1016/j.ecolecon.2011.05.019
Hairuddin, H., Noor, N. L. M., and Ab Malik, A. M. Why do microenterprise refuse to use information technology: A case of batik microenterprises in Malaysia[J]. Procedia - Soc. Behav. Sci., 2012, 57: 494–502. doi:10.1016/j.sbspro.2012.09.1216
He, Y. J., and Cai, D. Y. Analysis on the efficiency of green technology innovation of industrial enterprises in the Yangtze River delta and its influencing factors. Chongqing Soc. Sci. 2021. 1: 49–63.
Hoskins, B. L., and Mascherini, M. Measuring active citizenship through the development of a composite indicator[J]. Soc. Indic. Res., 2009, 90(3): 459–488. doi:10.1007/s11205-008-9271-2
Jie, H. Overall optimization model of efficiency and performance of green technology innovation. Sustain. Comput. Inf. Syst., 2021, 30: 100501. doi:10.1016/j.suscom.2020.100501
Joumady, O., and Ris, C. Performance in European higher education: A non-parametric production frontier approach[J]. Educ. Econ., 2005, 13(2): 189–205. doi:10.1080/09645290500031215
Li, B., and Song, P. Driving force mechanism of the core green technology innovation of equipment manufacturing enterprises towards industry 5.0 in China[J]. Math. Problems Eng., 2022, 2022. 1, 18. doi:10.1155/2022/1404378
Lieder, M., and Rashid, A. Towards circular economy implementation: A comprehensive review in context of manufacturing industry[J]. J. Clean. Prod., 2016, 115: 36–51. doi:10.1016/j.jclepro.2015.12.042
Lin, B., and Xu, M. Regional differences on CO2 emission efficiency in metallurgical industry of China[J]. Energy Policy, 2018, 120: 302–311. doi:10.1016/j.enpol.2018.05.050
Liu, J. S., Lu, L. Y. Y., Lu, W. M., and Lin, B. J. A survey of DEA applications[J]. Omega, 2013, 41(5): 893–902. doi:10.1016/j.omega.2012.11.004
Lv, C., Shao, C., and Lee, C. C. Green technology innovation and financial development: Do environmental regulation and innovation output matter?[J]. Energy Econ., 2021, 98: 105237. doi:10.1016/j.eneco.2021.105237
Ma, M., Feng, W., Huo, J., and Xiang, X. Operational carbon transition in the megalopolises’ commercial buildings[J]. Build. Environ., 2022, 2022a: 109705. doi:10.1016/j.buildenv.2022.109705
Magazzino, C., and Mele, M. On the relationship between transportation infrastructure and economic development in China[J]. Res. Transp. Econ., 2021, 88: 100947. doi:10.1016/j.retrec.2020.100947
Mele, M., and Magazzino, C. A machine learning analysis of the relationship among iron and steel industries, air pollution, and economic growth in China[J]. J. Clean. Prod., 2020, 277: 123293. doi:10.1016/j.jclepro.2020.123293
Nasierowski, W., and Arcelus, F. J. About efficiency of innovations: What can be learned from the innovation union scoreboard index[J]. Procedia - Soc. Behav. Sci., 2012, 58: 792–801. doi:10.1016/j.sbspro.2012.09.1057
O’Donnell, C. J., Rao, D. S., and Battese, G. E. Metafrontier frameworks for the study of firm-level efficiencies and technology ratios[J]. Empir. Econ., 2008, 34(2): 231–255. doi:10.1007/s00181-007-0119-4
Oh, D. A global Malmquist-Luenberger productivity index[J]. J. Product. Anal., 2010, 34(3): 183–197. doi:10.1007/s11123-010-0178-y
Oltra, V., Kemp, R., and De Vries, F. P. Patents as a measure for eco-innovation[J]. Int. J. Environ. Technol. Manag., 2010, 13(2): 130–148. doi:10.1504/IJETM.2010.034303
Omer, A. M. Energy, environment and sustainable development[J]. Renew. Sustain. Energy Rev., 2008, 12(9): 2265–2300. doi:10.1016/j.rser.2007.05.001
Ma, M., Chen, M., Feng, W., et al. What decarbonized the residential building operation worldwide since the 2000s[J]. Petroleum Sci., 2022. doi:10.1016/j.petsci.2022.10.016
Ployhart, R. E., Nyberg, A. J., Reilly, G., and Maltarich, M. A. Human capital is dead; long live human capital resources![J]. J. Manag., 2014, 40(2): 371–398. doi:10.1177/0149206313512152
Royston, P., Altman, D. G., and Sauerbrei, W. Dichotomizing continuous predictors in multiple regression: A bad idea[J]. Stat. Med., 2006, 25(1): 127–141. doi:10.1002/sim.2331
Shen, W., Shi, J., Meng, Q., Chen, X., Liu, Y., Cheng, K., et al. Influences of environmental regulations on industrial green technology innovation efficiency in China[J]. Sustainability, 2022, 14(8): 4717. doi:10.3390/su14084717
Strange, N., Bogetoft, P., Aalmo, G. O., Talbot, B., Holt, A. H., and Astrup, R. Applications of DEA and SFA in benchmarking studies in forestry: State-of-the-art and future directions[J]. Int. J. For. Eng., 2021, 32(1): 87–96. doi:10.1080/14942119.2021.1914809
Sueyoshi, T., Shang, J., and Chiang, W. C. A decision support framework for internal audit prioritization in a rental car company: A combined use between DEA and ahp[J]. Eur. J. Operational Res., 2009, 199(1): 219–231. doi:10.1016/j.ejor.2008.11.010
Sun, H., Edziah, B. K., Kporsu, A. K., Sarkodie, S. A., and Taghizadeh-Hesary, F. Energy efficiency: The role of technological innovation and knowledge spillover[J]. Technol. Forecast. Soc. Change, 2021, 167: 120659. doi:10.1016/j.techfore.2021.120659
Taques, F. H., López, M. G., Basso, L. F., and Areal, N. Indicators used to measure service innovation and manufacturing innovation[J]. J. Innovation Knowl., 2021, 6(1): 11–26. doi:10.1016/j.jik.2019.12.001
Udemba, E. N., Magazzino, C., and Bekun, F. V. Modeling the nexus between pollutant emission, energy consumption, foreign direct investment, and economic growth: New insights from China[J]. Environ. Sci. Pollut. Res., 2020, 27(15): 17831–17842. doi:10.1007/s11356-020-08180-x
Van Hemel, C., and Cramer, J. Barriers and stimuli for ecodesign in SMEs[J]. J. Clean. Prod., 2002, 10(5): 439–453. doi:10.1016/S0959-6526(02)00013-6
Vollenbroek, F. A. Sustainable development and the challenge of innovation[J]. J. Clean. Prod., 2002, 10(3): 215–223. doi:10.1016/S0959-6526(01)00048-8
Wang, E. C., and Huang, W. Relative efficiency of R&D activities: A cross-country study accounting for environmental factors in the DEA approach[J]. Res. Policy, 2007, 36(2): 260–273. doi:10.1016/j.respol.2006.11.004
Wang, K. H., Umar, M., Akram, R., and Caglar, E. Is technological innovation making world" greener"? An evidence from changing growth story of China[J]. Technol. Forecast. Soc. Change, 2021, 165: 120516. doi:10.1016/j.techfore.2020.120516
Whitaker, T. K. Problems of Capital Formation in Underdeveloped Countries [M]. Irish: Basil Blackwell, 1953. https://www.jstor.org/stable/30098507
Wu, T. H., Chen, M. S., and Yeh, J. Y. Measuring the performance of police forces in Taiwan using data envelopment analysis[J]. Eval. Program Plan., 2010, 33(3): 246–254. doi:10.1016/j.evalprogplan.2009.09.001
Xiang, X., Ma, M., Ma, X., Chen, L., Cai, W., Feng, W., et al. Historical decarbonization of global commercial building operations in the 21st century[J]. Appl. Energy, 2022, 322: 119401. doi:10.1016/j.apenergy.2022.119401
Yan, R., Xiang, X., Cai, W., and Ma, M. Decarbonizing residential buildings in the developing world: Historical cases from China[J]. Sci. Total Environ., 2022, 847: 157679. doi:10.1016/j.scitotenv.2022.157679
Yin, S., Zhang, N., and Li, B. Improving the effectiveness of multi-agent cooperation for green manufacturing in China: A theoretical framework to measure the performance of green technology innovation[J]. Int. J. Environ. Res. Public Health, 2020, 17(9): 3211. doi:10.3390/ijerph17093211
Yu, M. M., See, K. F., and Hsiao, B. Integrating group frontier and metafrontier directional distance functions to evaluate the efficiency of production units[J]. Eur. J. Operational Res., 2022, 301(1): 254–276. doi:10.1016/j.ejor.2021.10.054
Zhang, S., Ma, M., Li, K., Ma, Z., Feng, W., and Cai, W. Historical carbon abatement in the commercial building operation: China versus the US[J]. Energy Econ., 2022b, 105: 105712. doi:10.1016/j.eneco.2021.105712
Zhang, S., Ma, M., Xiang, X., Cai, W., Feng, W., and Ma, Z. Potential to decarbonize the commercial building operation of the top two emitters by 2060[J]. Resour. Conservation Recycl., 2022a, 185: 106481. doi:10.1016/j.resconrec.2022.106481
Keywords: China, industrial green technology innovation efficiency, meta-frontier methods, DEA, regional heterogeneity
Citation: Yao F, Qin Z and Wang X (2022) Industrial green technology innovation efficiency of China. Front. Environ. Sci. 10:1076974. doi: 10.3389/fenvs.2022.1076974
Received: 22 October 2022; Accepted: 14 November 2022;
Published: 24 November 2022.
Edited by:
Kangyin Dong, University of International Business and Economics, ChinaReviewed by:
Minda Ma, Lawrence Berkeley National Laboratory, United StatesShufan Zhang, Chongqing University, China
Luigi Aldieri, University of Salerno, Italy
Copyright © 2022 Yao, Qin and Wang. This is an open-access article distributed under the terms of the Creative Commons Attribution License (CC BY). The use, distribution or reproduction in other forums is permitted, provided the original author(s) and the copyright owner(s) are credited and that the original publication in this journal is cited, in accordance with accepted academic practice. No use, distribution or reproduction is permitted which does not comply with these terms.
*Correspondence: Xiaomei Wang, d2FuZ3hpYW9tZWloc2RAc2luYS5jb20=