 Xiaojuan Xiong
 Tajul Ariffin Masron
 Tutik Wiryanti Gondo3
- 1College of Economics, Zhengzhou University of Economics and Business, Zhengzhou, China
- 2School of Management, Universiti Sains Malaysia, Penang, Malaysia
- 3Widya Mataram, Jakarta, Indonesia
Introduction: The requirement for more funds has been a significant challenge for China’s heavily polluting enterprises (HPEs) to embark on green innovation.
Methods: This study takes China’s 2012 Green Credit Guidelines (GCGs) as a quasi-natural experiment to examine their effect on the quality and quantity of green innovation in HPEs. Using the data of Chinese listed companies from 2007 to 2020 and the difference-in-differences (DID) model.
Results: We found that the Green Credit Guidelines could significantly improve the number of enterprises’ green innovation but not their quality.
Discussion: As part of the potential solutions, this study proposes 1) the implementation of specific green fiscal policies to complement the existing green credit policies by the government, 2) a more comprehensive range of green financing products by financial institutions, and 3) the active development of funding from non-bank sources, such as venture capital or commercial credit.
1 Introduction
There has been a global consensus that green innovation has become a fundamental force and an essential support for promoting sustainable development and building a beautiful homeland (Yan et al., 2020; Hong et al., 2021). From a macro perspective, green innovation helps reconcile the direct relationship between ecological protection and steady economic growth (Wang K et al., 2019; Zhang D et al., 2021). Microscopically, green innovation can directly affect pollutant emissions and is a crucial way for companies to make the green transition (Gupta and Barua, 2018; Wang and Wang, 2021). As one of the main contributors to carbon emissions, the green innovation performance of companies plays a crucial role in global sustainable development. This study investigates whether the implementation of the Green Credit Guidelines (GCGs) can stimulate green innovation in heavily polluting enterprises (HPEs) in China and, if so, through which mechanisms.
The green credit policy is an international practice based on the Equator Principles and is widely valued around the world (Zhang K et al., 2021). In 1998, the Government of Lithuania launched the NEFCO-APINI credit line, which has successfully facilitated the financing of clean production projects. The US federal economic stimulus package, created in 2009, provides loan guarantees for renewable energy and power transmission technologies. In 2012, the UK government established the Green Investment Bank, which provides guarantees and equity investment to fund green projects. Furthermore, in 2019, the UK published the green finance strategy, which aims to promote the greening of finance by engaging the government to channel private sector funding toward cleaner and greener production. On 4th July 2022, the European Central Bank incorporated climate change considerations into the euro monetary policy framework to support the green transformation of the economy. Its concerns had been i) increasing its holdings of corporate bonds that are beneficial for protecting the environment, ii) restricting financing and debt issuance by companies with high carbon emissions, and iii) requiring banks to give greater weight to environmental factors in granting loans and risk controls.
China’s green credit policy started late. It was first introduced in 2007 in the Opinions on the Implementation of Environmental Protection Policies and Regulations to Prevent Credit Risks, jointly issued by the former State Environmental Protection Administration, the People’s Bank of China, and the former China Banking Regulatory Commission (Zhang Q et al., 2021), and then, the China Banking Regulatory Commission issued the Green Credit Guidelines (GCGs) in 2012 to guide the banking financial institutions in the development of green credit services and evaluating their effectiveness. It was the first nationwide policy and a landmark. The green credit policies shifted from mainly guiding banks to build awareness of sustainable development before 2012 to focusing on evaluation and improvement of policy implementation after 2012 (Ling et al., 2020). According to the statistics from the China Banking Regulatory Commission, in 2020, green loans from 21 major banks in China accounted for only 4% of the total banking sector loans.1 This percentage grew to 10.6% in 2021. Although its proportion had increased, it was still at a low level when compared with the funding demands of green investment in real economy (Wang X et al., 2019).
At this time, more theoretical research should have been conducted in this area. The Porter hypothesis (1995) suggests that a well-designed environmental regulation can create an innovative compensatory effect, simultaneously promoting economic development and achieving ecological optimization. Jaffe and Palmer (1997) and Brunnermeier and Cohen (2003) have empirically confirmed that environmental regulation promotes American corporate innovation to a certain extent. The literature on the impact of green credit policies has also paid attention to enterprises’ credit financing costs (Su and Lian, 2018; Liu et al., 2019; Jin et al., 2021; Li et al., 2022), investments (Huang and Lei, 2021; Zhang S et al., 2021; Liu et al., 2022), pollutant emissions (Zhang Y et al., 2021; Xiao et al., 2022), and firm performance (Ding et al., 2020; Yao et al., 2021; Zhang and Vigne, 2021). Nevertheless, there is a lack of literature on the relationship between GCGs and green innovation in firms, especially in HPEs. Considering the high environmental and social risks of HPEs (Wang and Wang, 2021), it is vital to examine whether GCGs stimulate their green innovation capacity because it plays a decisive role in the effectiveness of green credit policies in promoting green transformation of companies.
Therefore, we have tried to fill the research gaps by examining the impacts of China’s 2012 GCGs on HPEs’ green innovation. The focus has been on the effectiveness of GCGs on the quality and quantity of green innovation in HPEs. Using the difference-in-differences (DID) model, we found that GCGs have a significant and stable positive effect on the number of green innovations in HPEs when compared with non-HPEs, but show no substantial improvement in quality. Furthermore, we also analyzed i) the heterogeneous effect of GCGs on green innovation and ii) the mechanism of GCGs on green innovation. Our findings suggest that the influence of GCGs is more pronounced in HPEs with state ownership, higher financial constraints, less market competition, and less local government intervention. It has also been observed that GCGs promote green innovation by increasing corporate financing costs and reducing corporate bank credit resources and commercial credit.
This study has three innovative points. First, it enriches the literature with the findings that the GCGs can stimulate green innovation in HPEs, providing new microcosmic evidence of the Porter hypothesis in developing countries. The conclusion has an important practical significance in promoting green and low-carbon development. Second, most of the literature on green innovation ignores the heterogeneity of green innovation, and the data focus on the overall green innovation performance of regions or firms (Stefan and Paul, 2008; Sánchez-Medina et al., 2015; Shao et al., 2020; Tang et al., 2020; Peng et al., 2021). By conducting research on both the quantitative and qualitative aspects according to the type of green innovation, we expand theoretical research on the impact of environmental and economic regulations on green innovation and provide a more straightforward pathway for the objective evaluation of the implementation of GCGs. Third, we investigate the effect mechanism of the GCGs on corporate green innovation and explore the impact of heterogeneous behavior from three dimensions: corporate characteristics, market competition, and government intervention. The relevant conclusions deepen the understanding of the impact of GCGs on corporate green innovation, providing a valuable reference for future improvement and optimization of green financial policies.
The organization of this study is as follows. The second section compares the literature and formulates the hypotheses. The third section deals with research methodology and data. The fourth section displays the empirical results. The fifth section is further discussion. The sixth part is the conclusion and suggestion.
2 Literature review and research hypotheses
2.1 Description of Green Credit Guidelines
Under the Equator Principles, the green credit policies are an international practice whereby financial institutions consider the environmental impact of businesses when lending. The green credit policy aims to promote environmental protection and governance and, more importantly, allocate resources from high-pollution and energy-consuming industries to sectors with advanced concepts and technologies. China’s green credit policy can be traced back to 1995 when the People’s Bank of China issued the Circular on Issues Related to the Implementation of Credit Policy and Strengthening Environmental Protection Work. The document stipulates that the financial sector at all levels should review the borrower’s environmental assessment when granting credit. Since then, green credit policies have been improved, and related research has become increasingly advanced. In 2012, the former China Banking Regulatory Commission issued the Green Credit Guidelines. When compared with previous green finance policies, the GCGs set more detailed and specific requirements for financial institutions, emphasizing that financial institutions should take factors such as energy conservation and environmental protection as an essential basis for credit decisions.
The 2012 GCGs of China have had two specific characteristics: first, GCGs are the first nationwide policy that connects environmental protection and loan finance and combines punishment and reward. By making clean investments more available and easier to finance while raising the entry criteria and financing costs for polluting investments, the GCGs force enterprises to strengthen green innovation and achieve transformation through credit allocation (Xu and Li, 2020; Wang and Wang, 2021). Second, GCGs regulate the relationship between local governments, banks, and companies. China’s financial system is dominated by indirect financing, and green credit is the most critical green financial instrument. The GCGs can complement the government’s fiscal policy, creating a rational allocation of funds to guide enterprises in their green transformation. According to the China Green Finance Research Report (2022), in 2021, the balance of China’s domestic and foreign currency green loans was RMB 15.9 trillion, accounting for over 90% of all green financing and ranking first in the world in terms of stock size. Therefore, the findings based on GCGs represent the role of green finance.
2.2 Empirical review
Given the focus of this study, several areas need attention, namely, the literature on the impact of green credit policies on pollution control, energy protection, environmental effects, and green development (Huang and Zhang, 2021; Peng and Zheng, 2021; Zhang D et al., 2021; Zhang K et al., 2021; Tian et al., 2022). For example, Peng and Zheng (2021) have found that green finance significantly improves energy efficiency, regional resources, economic development, and the degree of marketization all of which influence this significant positive effect. Zhang Q et al. (2021) have confirmed that GCGs are essential in mitigating sulfur dioxide and wastewater emissions. Tian et al. (2022) have found that by directing the flow of funds, green credit policies can support green technology innovation in heavy polluting industries, thus supporting the development of green industries while curbing emissions from polluting industries.
Other studies have also observed the effect of implementing green credit policies on commercial banks and enterprises. There is a rich discussion of established studies on the impact of green credit policies on the performance of commercial banks, but more consensus are yet to emerge. Some studies have found that green credit policies have an enhancing effect on the overall competitiveness of commercial banks, which is achieved by reducing the risk level of commercial banks, and that risk control plays a part in mediating the effect (Cui et al., 2018; Luo et al., 2021; Yin et al., 2021; Lian et al., 2022). However, some scholars have different opinions. They believe that the return of green credit business is low because carrying out green credit will increase the operating cost of commercial banks, thus harming the development quality of commercial banks. This negative effect is more evident in small- and medium-sized businesses (Han et al., 2019; Wanting, X., 2020; Yin X., 2021). At the enterprise level, most of the literature focuses on the relationship between green credit policies and firms’ investment and financing profiles (Liu et al., 2019; Huang and Lei, 2021; Zhang S. et al., 2021; Li et al., 2022; Liu et al., 2022). For example, Liu et al. (2022) demonstrated that the Chinese energy sector receives an overall excessive level of green investment (overinvestment) when compared with the estimated optimal investment level. Zhang Q. et al. (2021) found that GCGs affect the size of loans to environmentally friendly manufacturing firms, with small- and medium-sized firms receiving more loans than larger ones. Liu et al. (2019) have confirmed that the debt financing capacity in heavily polluting enterprises significantly reduces because of the GCGs.
However, a relatively small portion of the literature has examined the impact of green credit policies on corporate green innovation and developed two different perspectives. The first is the negative impact, a view based on the neoclassical economic theory that regulating the environment hampers firms’ green innovation by increasing their environmental expenditures (Gollop and Roberts, 1983) and hindering their willingness and ability to innovate (Stucki et al., 2018; Ling et al., 2020; Zhang Y. et al., 2022; Zhang Z. et al., 2022). The second proposition, by contrast, is the Porter hypothesis (Porter and Linde, 1995), which argues that appropriate environmental regulation helps firms innovate because the improvement in production technology brought about by the innovation can partially or wholly offset the cost of environmental protection. Many scholars have also empirically confirmed the establishment of the Porter’s hypothesis. For instance, Wang et al. (2022) have considered that the GCGs significantly improve the quality of green innovation in polluting enterprises. Hong et al. (2021), Hu et al. (2021), Wang and Li (2022), Yu (2021), and Zhang Y. et al. (2022) have arrived at a similar result, and yet, in some recent studies, Wang Y. et al. (2019) and Song et al. (2020) have observed that environmental regulation hinders firm innovation, but the relationship becomes facilitated over time.
In summary, based on the many research results, the following points are less considered in the existing relevant studies: first, there is less use of microenterprise data. Most studies use regional- or industry-level data, which can hardly reflect the differences among enterprises. Second, the impact mechanism and heterogeneity of green credit policies on different types of green innovation of enterprises should be explored more. Third, most existing research examine the impact on innovation by using emission fees and R&D subsidies as proxy variables of environmental regulations or mixing the effects of other environmental policies in the same period. The role of green credit policies in green innovation of enterprises is yet to be confirmed. The implementation of GCGs in 2012 was an exogenous event for firms, and its green credit penalty effect mainly applies to HPEs (Wang and Wang, 2021). This study uses a DID model with HPEs and non-HPEs as experimental and control groups to investigate whether and how the GCGs affect green innovation in microenterprises.
2.3 Research hypothesis—Green credit policy and green innovation
According to the 2012 GCGs, banking financial institutions should consider energy conservation, emission reduction, and other factors necessary for credit decision-making. For enterprises that have already been granted credit, if environmental problems occur, their credit should also be terminated. This means that the capital allocation function of the GCGs has an all-stage environmental governance role. With higher financing thresholds, financing costs, and environmental pollution costs, HPEs may rely on green innovation to be environmentally and socially responsible.
Moreover, the GCGs also require financial institutions to establish information exchange and dynamic tracking and supervision mechanisms with relevant government departments, which makes enterprises face double pressure. Firms may choose green innovation once the cost of bank credit and government penalties due to environmental mismanagement is high and exceeds the expected cost of green innovation. Accordingly, this study formulates the following hypothesis.
H1a: The GCGs improve the green innovation of HPEs.
Green innovation consists of green invention patents and green utility model patents. The former has a higher threshold and complex examination process and usually requires a more elevated and extended investment (Liao et al., 2020). The GCGs have led to a tightening of the funds available to HPEs. On the one hand, banks restrict credit to HPEs because of their higher environmental and social risks (Wang and Wang, 2021). On the other hand, HPE holds more stranded assets (meaning infrastructure investments that do not yield economic returns due to climate policies, market regulation, etc.) than other companies (Zhang Y. et al., 2021). They prefer to access green credit by upgrading existing assets rather than undertaking innovative green invention projects. So, we develop the following hypotheses.
H1b: Compared with green invention patents, the GCGs can better promote the performance of green utility model patents of HPEs.
2.4 Research hypothesis—Moderating effect of corporate, market, and government
After analysis, GCGs can promote green innovation in HPEs by increasing financial credit constraints. When firms face higher financing constraints, they are more inclined to take responsibility for environmental protection through green innovation, thus satisfying the lending requirements for green credit and obtaining the funds needed for their operations (Hu et al., 2021). Due to the high risk and investment characteristics of green invention patent innovation, the GCGs may also force capital-strapped enterprises to upgrade existing equipment and technology to achieve green transformation. Otherwise, they will have to bear high financing costs and environmental regulatory non-compliance costs. Therefore, we propose the following hypothesis.
H2a: The financial constraints positively moderate the promoting effects of the GCGs on the overall and green utility patent performance of HPEs.
Schumpeter’s theory states monopoly is naturally conducive to innovation, and fierce market competition is not beneficial to enterprises’ green innovation, especially patent invention innovation. In the context of intense market competition, on the one hand, enterprises have limited pricing power, small profit margins, and difficulty in obtaining information, while on the other hand, innovation activities call for more substantial capital support and are characterized by long cycles and high investment. Corporate management will likely reduce investment in green innovation based on a short-sighted perspective. Accordingly, this study proposes the following hypothesis.
H2b: The market competition negatively moderates the promoting effects of the GCGs on the overall and green utility patent performance of HPEs.
In China, local governments are responsible executors of green credit policies. They can influence banks’ lending decisions through government regulation and conduct administrative interventions in the form of direct funds. Traditional heavy industries are the providers of most products and remain a vital component of the national economy. When local government officials face more pressure for promotion, they tend to introduce backward or even eliminated enterprises to be added to the GDP (Wang et al., 2022). The local government’s neglect of the positive role of green innovation makes the GCGs inefficient, and firms need more incentives to engage in high-quality green innovation. Therefore, the higher the intensity of local government intervention, the lower the positive impact of GCGs on green innovation. Thus, the following hypothesis is proposed.
H2c: The local government intervention negatively moderates the promoting effects of the GCGs on the overall and green utility patent performance of HPEs.
2.5 Research hypothesis—Mediation effect of debt financing costs, credit resources, and commercial credit
Green innovation requires more significant capital investment, longer R&D cycles, and greater risks than general innovation. As a result of GCGs, financial institutions take environmental and social performance as the basis for credit decision-making, align credit allocation to HPEs, and convey to the society that HPEs have a higher level of operational risk. On the one hand, it aggravates the financing cost and bank credit financing scale of HPEs. On the other hand, upstream and downstream partners are also affected by the transmission of signals and have to adjust their credit decisions after a comprehensive assessment of the business risks of enterprises. Thus, we put forward the following hypotheses.
H3a: Given the increasing credit financing cost of HPEs, the GCGs force enterprises to improve their green innovation.
H3b: Given the limited credit resources for HPEs, the GCGs force enterprises to improve green innovation.
H3c: Given the limited commercial credit for HPEs, the GCGs force enterprises to improve their green innovation.
3 Methodology
3.1 Data
China’s green credit policy was designed in 2007 and formally implemented in 2012; hence, China’s listed firms from 2007 to 2020 were chosen as the original samples. The year of implementation of the GCGs was 2012, and we focus on the innovative performance of HPEs relative to non-HPEs around 2012. Furthermore, according to the key evaluation indicators for the implementation of green credit, enterprises are classified into three categories: A, B, and C. This study defines enterprises under category A as highly polluting enterprises.2 They can be divided into nine subsectors based on the degree of adversity of their impact on the environment and society. After excluding financial firms, non-performing listed firms,3 bankrupt firms, and firms with significant missing data, the sample of this study consists of 14,090 observations from 1,288 listed companies. Our data come from three sources. First, the number of patent applications for green inventions is from the China National Intellectual Property Office (CNIPA).4 We define seven main fields of green patents according to the international patent classification in the Green List of International Patent Classification issued by the World Intellectual Property Organization (WIPO) in 2010.5 Second, corporate and financial data were mainly obtained from the China Economic and Financial Research Database (CSMAR) and the China Research Data Service Database (CNRDS). Third, other macro data come from the National Bureau of Statistics of China (NBSC).
3.2 Models
The Green Credit Guidelines in 2012 provided a good exogenous shock condition for the research of the green credit policy (Zhang K. et al., 2021; Wang et al., 2022). When the policy is exogenous, the DID method can effectively alleviate the endogenous problems. Moreover, the DID method controls for unobservable individual heterogeneity between samples and is widely used in studies evaluating policy efficiency. The key to using the DID method for policy evaluation is that the research samples must be divided into two categories: affected by the policy, namely, the treatment group, and not affected by the policy, which is called the control group. In this study, we also use this method to evaluate the impact of the GCGs on green innovation, setting HPEs as the treatment group and the remaining as the control group. The DID model is as follows:
As Eq. 1 shows, i and t indicate the firm and year, respectively. This study measures the green innovation of enterprises by the number of green patent applications (Wang and Wang, 2021; Zhang Z. et al., 2022). ln Patent i,t represents the logarithm of the number of green innovation applications by firm t in year i plus one, as measured by lnTotal, lnInva and lnUma. Specifically, we add up the number of green invention patent applications (Inva) and green utility model patent applications (Uma) to obtain the total green innovation (Total). The former is used to measure green innovation quality and the latter to express quantity. This approach was also used by Liao et al. (2020); Wang and Wang (2021), and Zhang Y. et al. (2022). Considering the right-skewed distribution characteristics of the green patent application data, we obtain lnTotal, lnInva, and lnUma by adding 1 to the number of green patent applications and taking the natural logarithm. There are two independent variables: the treated group (Treat) and policy implementation (Post). Following the specification of the abovementioned DID model , Treat is a dummy variable equal to 1 if the enterprise is among the HPEs, and Post is the time dummy variable equal to 1 if it is in the period 2012–2020. Controls are a group of control variables consisting of enterprise size, firm age, fixed asset ratio, growth ability, ownership concentration, total debt ratio, cash flow, market value, profitability, market power, and equity nature. ε is the residual term. If α1 is significantly positive, H1(H1a and H1b) is valid. We construct the following model and further analyze the moderating effect of corporate, market, and government to test the hypothesis H2a, H2b and H2c:
As shown by Eq. 2, there are three variables to measure our moderators. First, the corporate financial constraint (FC) is represented by the SA index. Second, we use market competition (Competi) which is equal to the selling expenses divided by the operating income, to measure the moderating effect of the market (Ye and Wu, 2022). Last, we use the intensity of environmental regulation in each province (Gov_Invest) to represent local government intervention, with a specific indicator equal to the amount of regional environmental investment divided by regional industrial value added (Liu and He, 2021; Zhang Y. et al., 2022). The coefficients of Treat × Post × FC are to test the moderating effect of corporate financing constraints; Treat × Post × Competi is the moderating effect of market competition, and Treat × Post × Gov_Invest is the moderating effect of local government intervention.
We further test the mediator effect of debt financing costs (Dedt), credit resources (Totalloan), and commercial credit (Cc) as shown in Eqs 3, 4:
As highlighted in Eqs 3, 4, the mediators are debt financing costs (Dedt), credit resources (Totalloan), and commercial credit (Cc). The cost of debt financing is expressed as the ratio of financial expenses divided by total liabilities (Hong et al., 2021). Credit resources or Totalloan is measured by the total bank loans of the enterprise, which equals the sum of short-term borrowings and long-term borrowings, divided by the value of total assets. Commercial credit is calculated as the ratio of the sum of accounts payable, bills payable, and accounts received in advance to total assets (Xiao et al., 2014; Lian et al., 2015; Yu, 2021). Eq. 3 shows the effect of GCGs on the mediating variables, and Eq. 4 shows the mediating effect of the mediating variable. If the coefficients
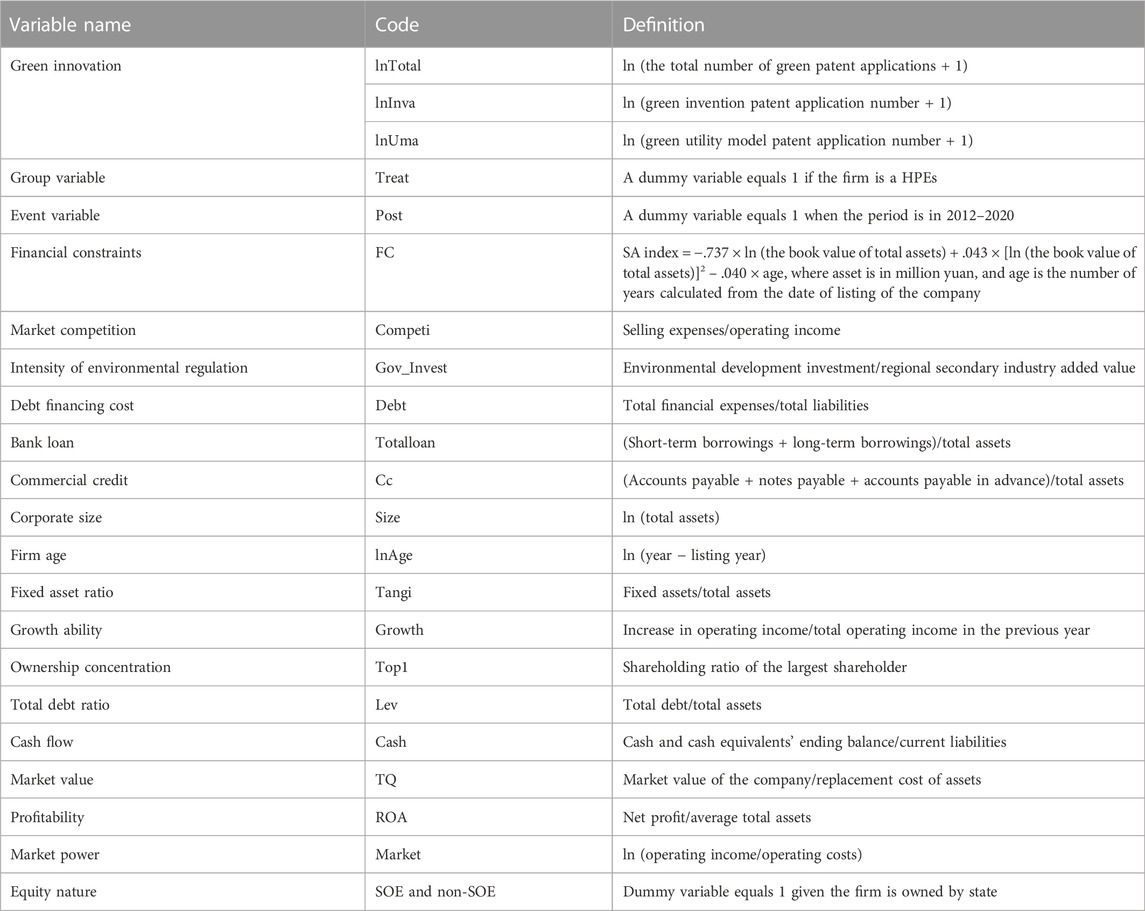
TABLE 1. Variable definitions.
3.3 Summary statistics
As shown in Table 2, the mean of lnTotal, lnInva, and lnUma is .281, .203, and .162, respectively, showing that the overall level of green innovation of Chinese enterprises is not high. The standard deviation is .757, .636, and .526, respectively, showing that there is a certain difference in the number of green invention patent applications among the sample companies. Other variables are basically consistent with the available literature and will not be repeated here.
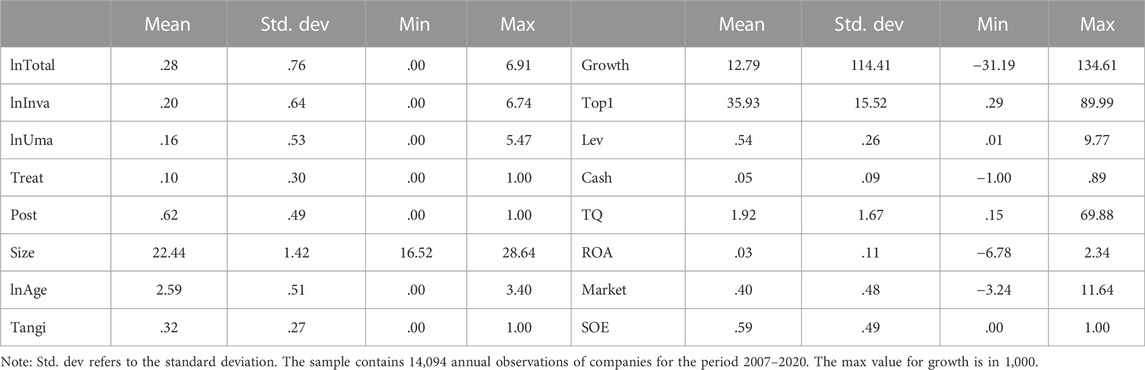
TABLE 2. Descriptive statistics.
3.4 Correlation analysis
The outcome of the correlation analysis is presented in Table 3. We can observe that the variables are correlated, but the absolute value of the correlation coefficient does not exceed the critical value of .6. It indicates that there is no serious multicollinearity problem between the variables, and we can carry out the next regression step.
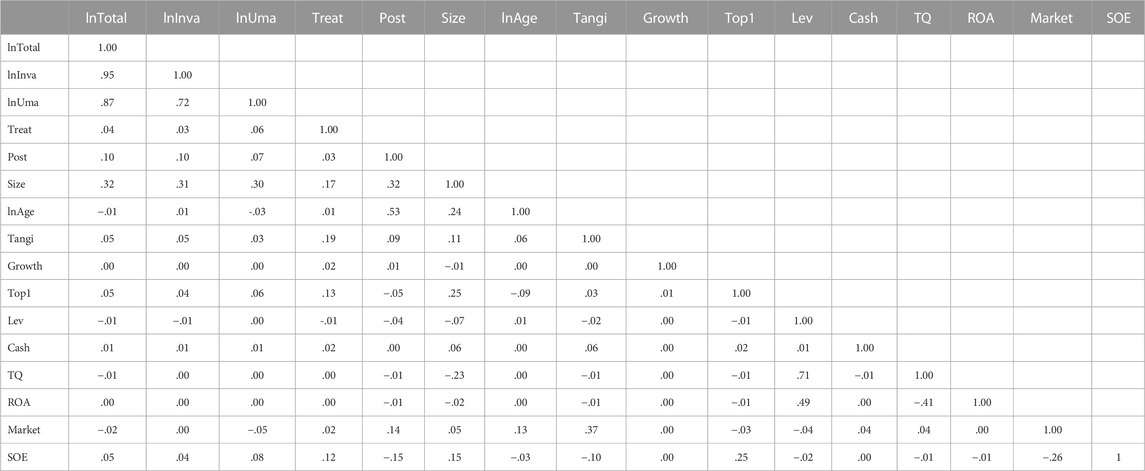
TABLE 3. Correlation analysis.
4 Empirical results
4.1 Baseline results
Based on Eq. 1, Table 4 gives the effect of the GCGs on the green innovation of HPEs. Columns 1–3 report the regression results with the control variables not included and 4– 6 report the results of adding control variables and introducing dual fixed effects of firm and time. Also, columns 7–9 present the regression results for regional fixed effects based on columns 4– 6. Except for column 5, the coefficients of the DID are all significantly positive, at least at a 5% critical level, showing that GCGs significantly stimulate green innovation in HPEs. In columns 4 and 7, the coefficient of the DID is significantly positive, at least at 5%. After introducing the province fixed effect, the coefficient is .123. In other words, after the implementation of the GCGs, the total number of green patent applications in HPEs is increased by 12.3%, indicating that the GCGs have significantly increased their green innovation output.
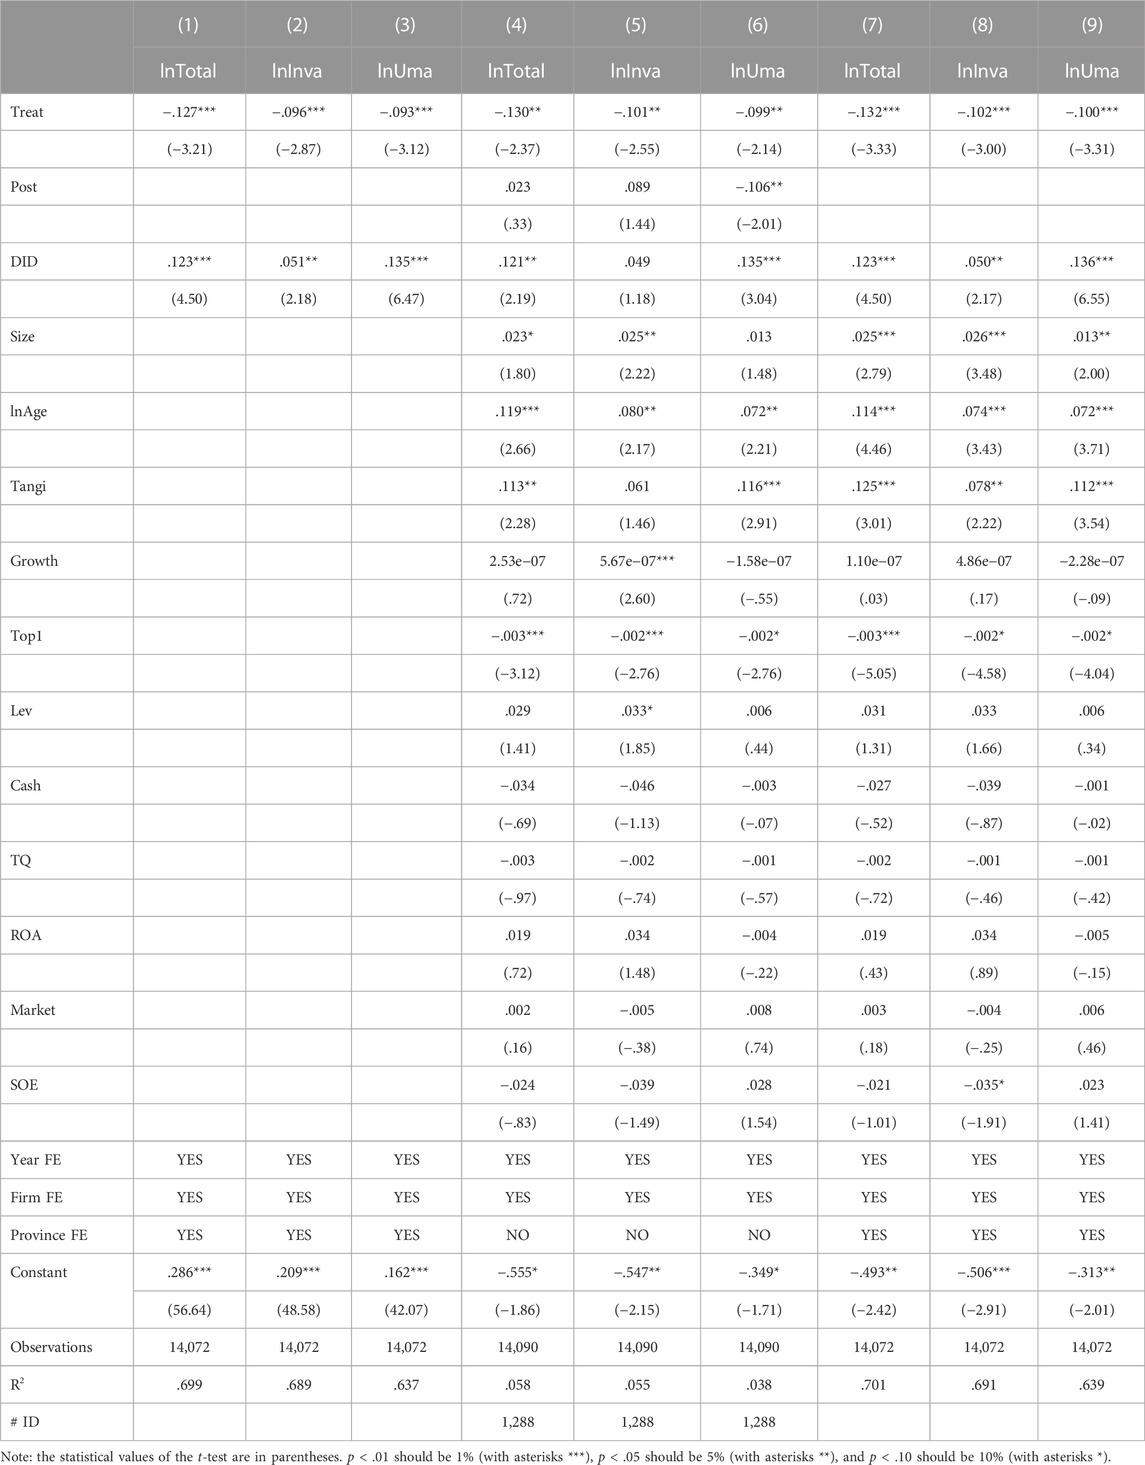
TABLE 4. Baseline results.
In columns 5 and 8, the coefficient of the DID is only significantly positive at the 5% level after the introduction of province fixed effects, indicating that the GCGs have a limited impact on improving the quality of green innovation in HPEs. According to columns 6 and 9, the coefficients of the DID are both significantly positive at the 1% level. After introducing the province fixed effect, the coefficient is .136. In other words, the number of green utility model patents in HPEs is increased by 13.6% because of the GCGs, further indicating that the GCGs have significantly increased the green innovation output of HPEs. This verifies the H1, which means that the GCGs have promoted the quantity of green innovation considerably in HPEs but still have to improve the quality significantly. In other words, the GCGs have sufficient incentives for “quantity” in the green innovation process of HPEs, while the motivation for “quality” is insufficient.
4.2 Parallel trend test
The underlying assumption of the DID method is the parallel trends. Namely, the experimental and control groups are guaranteed to maintain the same change trend before the event. This ensures that the exogenous event is the only driver of the difference. We use an event study method to test this assumption (Zhang Z. et al., 2022). Specifically, we select 2012 as the base period and establish several dummy variables representing the years before and after the implementation of GCGs, respectively. As shown in Table 5, the variables before policy implementation (Before5 to Before1) are almost insignificant and negative for all lnTotal, lnInva, and lnUma. But they are positive for lnTotal and significantly positive for lnUma. This shows that our sample is consistent with the parallel requirement and can be used in the following DID model.
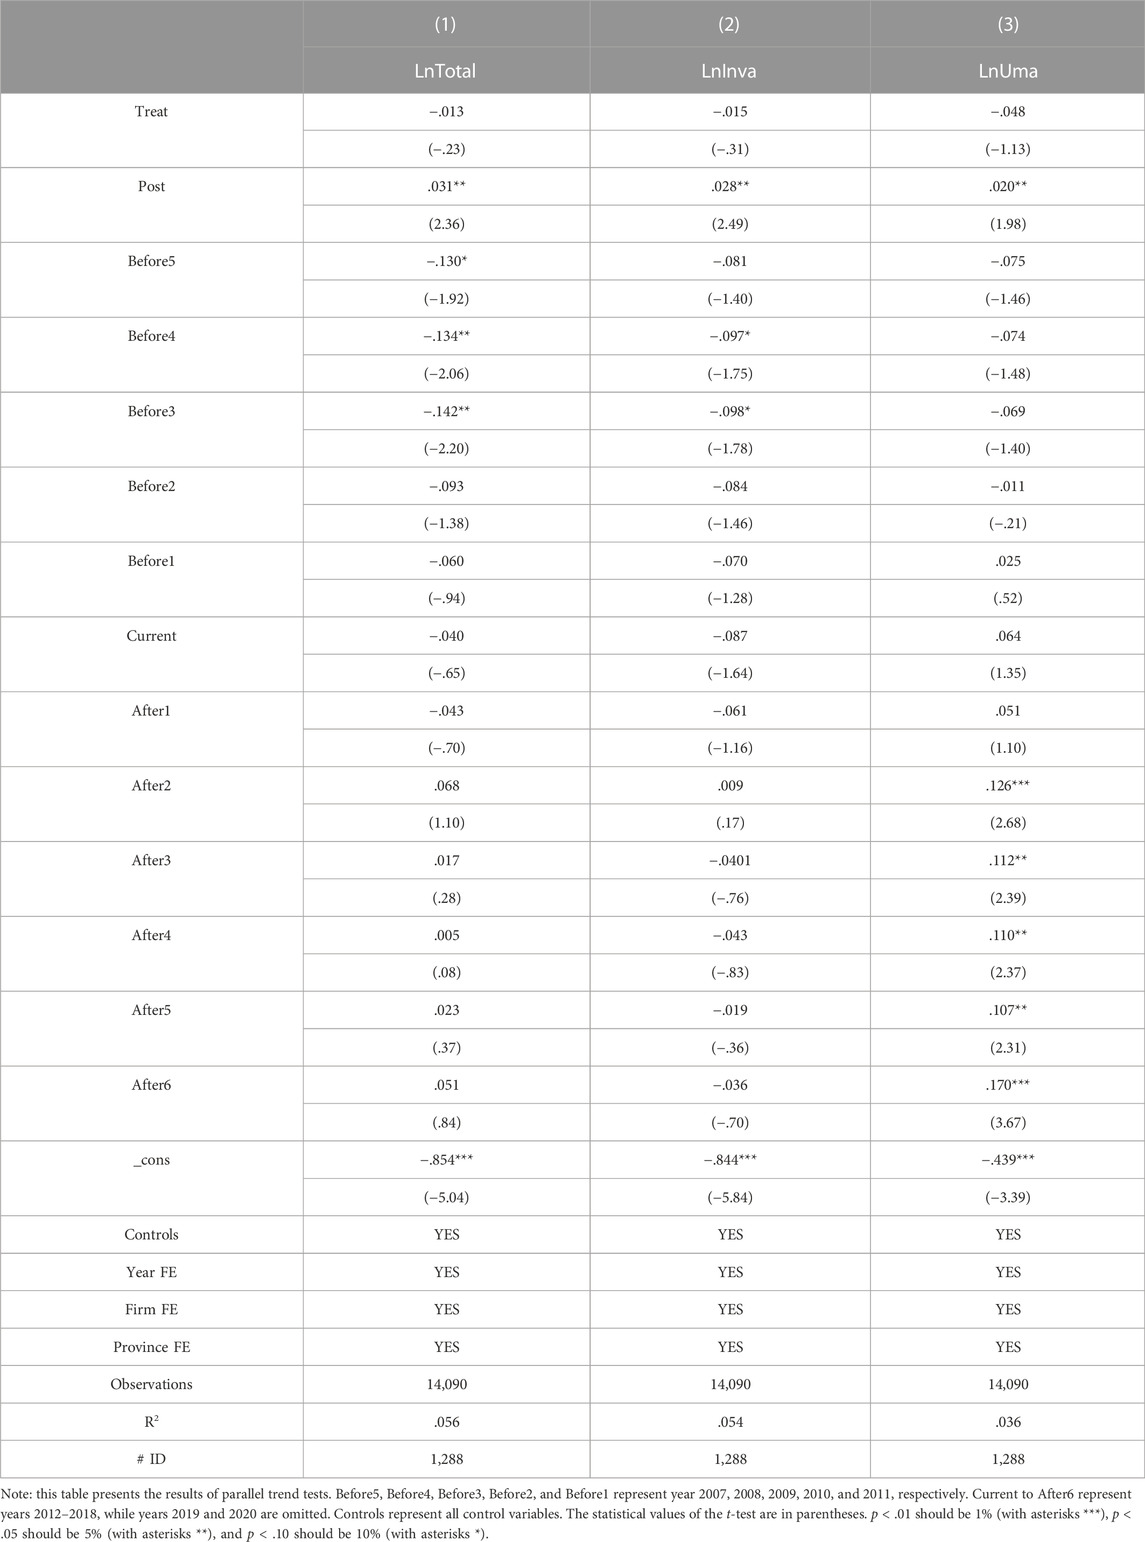
TABLE 5. Parallel trend test.
Figure 1 shows the parallel trends of green innovation output in different industries from 2007 to 2020.6 As shown in Figure 1, before the GCGs, the average number of green invention patents in HPEs and non-HPEs are the same over time, but the gap between the two widens significantly after the GCGs. This suggests that the GCGs played a role, and the parallel trend hypothesis is largely satisfied.
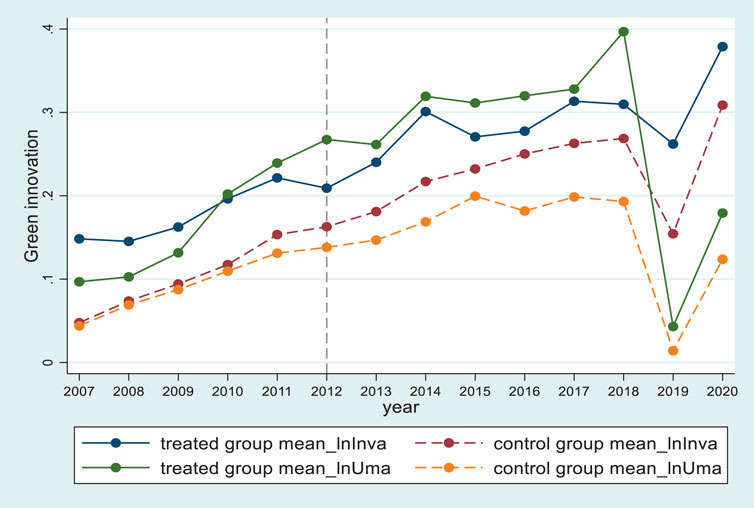
FIGURE 1. Parallel trend test. Note: the solid line is the average number of HPEs, and the dotted line is the average number for the non-HPEs.
4.3 Alternative estimation methods
Given the left-truncated nature of the patent data, we report the results of the double Tobit regressions controlling for firms, time, and province fixed effects in columns 1–3 of Table 6. The coefficient of the DID on the three dependent variables is significant and positive at 5%, 10%, and 1%, respectively. This is nearly in line with the results reported in Table 4.
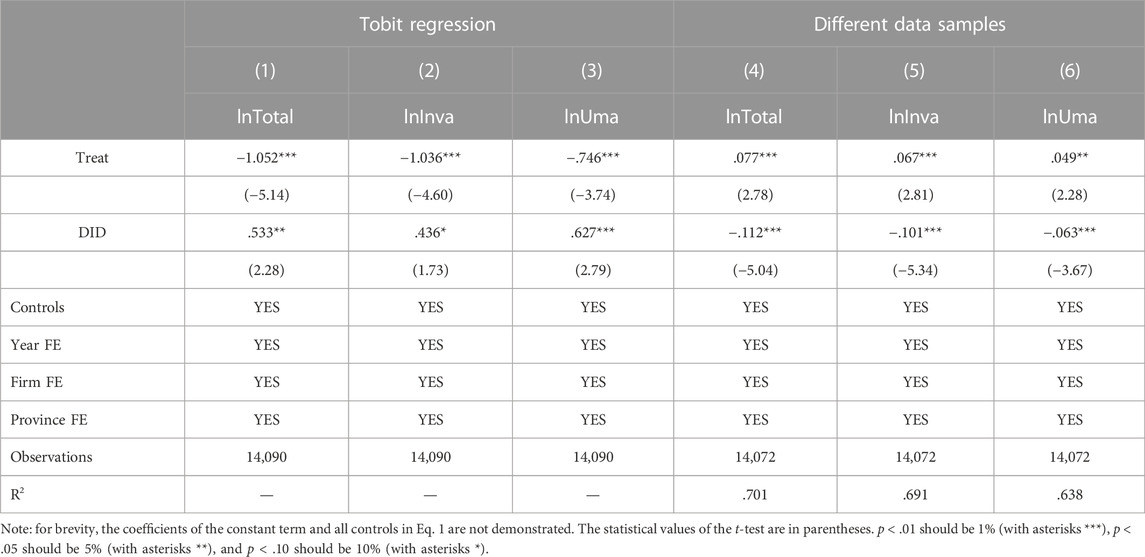
TABLE 6. Alternative regression methods and different data samples.
4.4 Analysis with different data samples
According to the “Key Evaluation Indicators of GCGs Implementation,” in addition to category A, construction, production, and business activities of category B will also have adverse environmental and social consequences. However, the difference between category A and category B is that this problem is easier to eliminate through slow-release measures. However, enterprises under category B with insufficient mitigation measures for environmental and social risks will still be included. Therefore, according to the industries of class B (which include 25 industries such as cotton printing, dyeing, and finishing, wool dyeing and finishing, linen dyeing and finishing, and silk screening, dyeing, and finishing), we change the scope of the HPEs. If a listed company belongs to the aforementioned 25 industries, we identify it as among the HPEs. The regression result is reported in columns 4–6 of Table 6. The coefficient of the DID is all significantly negative at 1%, showing that the GCGs have considerably reduced the green innovation performance of category B enterprises. Therefore, when enterprises face more significant environmental and social risks, the implementation of GCGs will form a significantly positive incentive for their green innovation, which confirms the aforementioned conclusion.
4.5 Subsample: Excluding the year 2017
Owing to the statistical standards of patent applications switched in 2017, we re-regressed after excluding patent applications in 2017. As shown in columns 1–3 of Table 7, the sign and significance of the DID coefficients are consistent with those in Table 4.
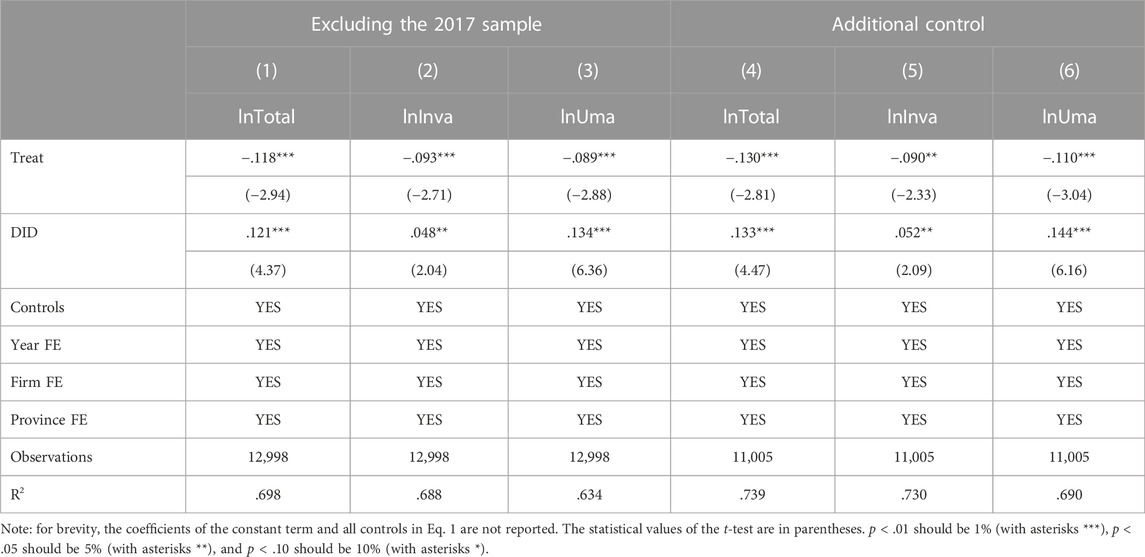
TABLE 7. Robustness checks: Excluding the 2017 samples and additional controls.
4.6 Additional controls
Furthermore, we add two additional variables into Eq. 1, which are the amount of government subsidy that the company receives each year (Gov_sub) and whether the company discloses its environmental management status (public), both of which come from the CNRDS database. Government subsidies increase a firm’s resources to innovate (Gu et al., 2018), while environmental disclosure forces firms to engage in green behavior to gain positive external attention (Li et al., 2019), both of which ultimately promote green innovation. According to the “Guidelines for Environmental Information Disclosure of Listed Companies” issued by the Shanghai Stock Exchange in 2008, enterprises began to publish environmental management information in 2008. Accordingly, if the enterprise publishes environmental management information, it is 1. Otherwise, it is 0. Looking at columns 4–6 of Table 7, the sign and significance of the coefficients of the DID remain essentially the same as in Table 4.
4.7 Eliminating interference of important factors
Considering that the report of the 18th National Congress of the Communist Party of China, which proposed that “the construction of ecological civilisation should be given prominence”, also occurred in 2012, this study introduces two variables to eliminate the influence of the above factors. The first variable is the degree of disclosure of pollution source supervision information in the place where the listed company is registered. This variable is measured by the annual PITI published by the Institute of Public Environment (IPE). Since 2008, the IPE has comprehensively evaluated the degree of publicity of pollution source supervision information in key environmental protection cities across the country and released an annual report. The PITI includes supervision information, self-monitoring, interactive responses, emission data, and EIA information. The second variable is the pollution degree of fog in the place where the listed company is registered. CNRDS released the city-level PM2.5 annual average concentration (μɡ/m³) from 1998 to 2019. The original data of PM2.5 annual average concentration are taken from the global satellite-based monitoring released by the Center for Socioeconomic Data and Application of Columbia University. Table 8 shows the regression result. We can observe that the coefficients of the DID basically stay the same as the previous conclusions.
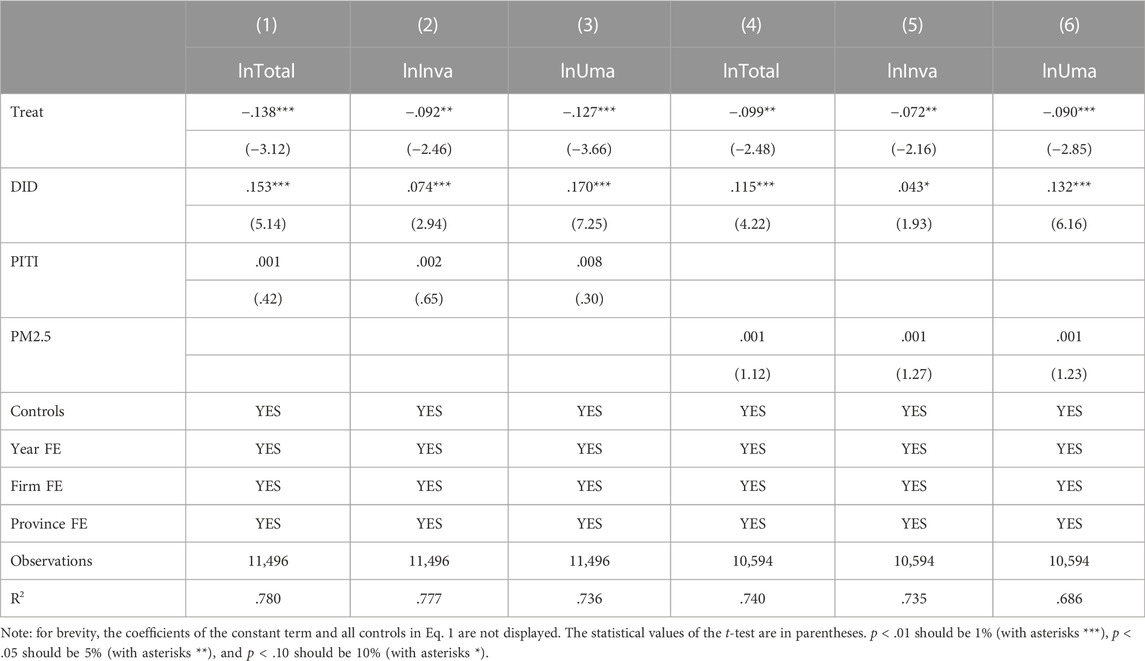
TABLE 8. Robustness checks: Eliminating the interference of important factors.
5 Further discussion
5.1 Effect of enterprise characteristics
Due to differences in the ownership structure of companies, market competition level, and local government intervention, the effect of the GCGs on green innovation among HPEs should be further examined. In this study, the sample is divided into two subsamples: enterprises owned by the state and those not based on the type of enterprise ownership. The coefficients of the DID of the state-owned enterprises in Table 9 are positive and significant. By contrast, non–state-owned enterprises are negative and insignificant, which means that the GCGs have a more substantial role in facilitating green innovation in HPEs with state-owned ownership. This effect on green utility model patents is more effective than green invention patents. This may be because state-owned enterprises (SOEs) have greater awareness and resources to support their green innovation than non-SOEs.
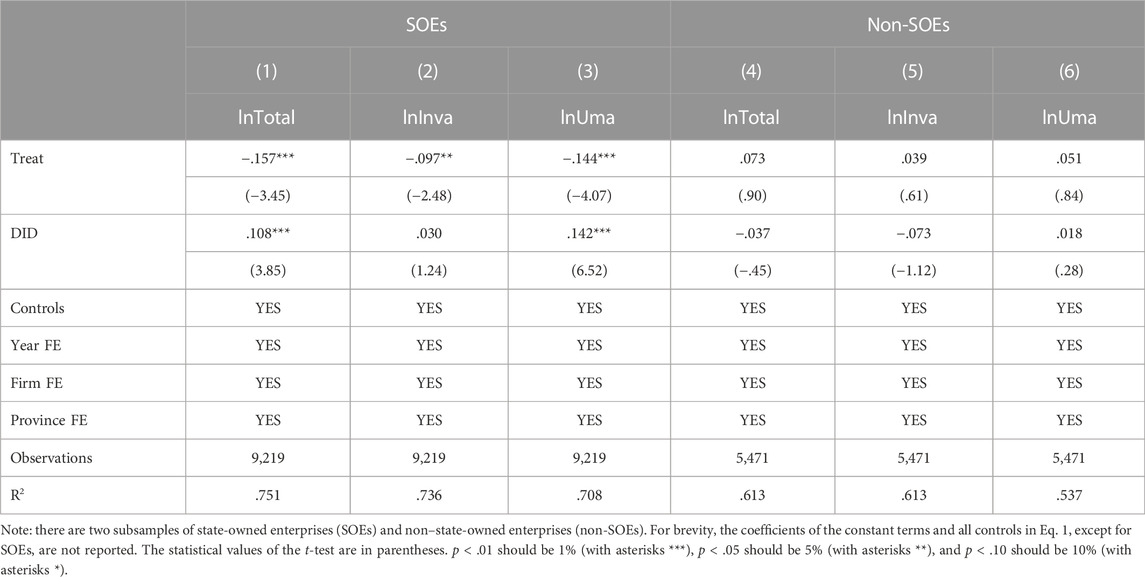
TABLE 9. Effect of enterprise characteristics: SOEs and non-SOEs.
Based on Eq. 2, we next use the SA index developed by Hadlock and Pierce (2010) to analyze the moderating effect of the level of financial constraints on firms. The coefficients of the three interaction items in Table 10 are significant and positive at 1%, indicating that the level of financial constraint on enterprises holds a positive moderating effect. The financing constraints faced by firms reinforce the role of GCGs in promoting their green innovation. The reasons may be that the higher stranded assets of HPEs are difficult to realize and have already faced insufficient liquidity, coupled with the requirements of bank green credit for corporate social and environmental performance. It makes them face greater financing constraints and forces them for green innovation even more. This result confirms hypothesis H2a.
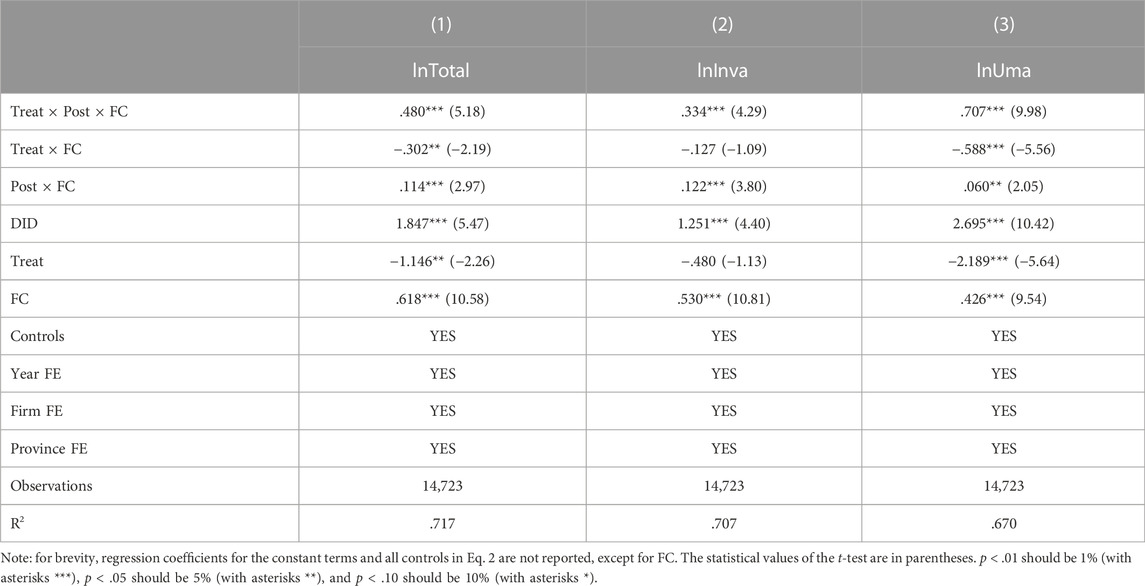
TABLE 10. Effect of enterprise characteristics: Corporate financing constraints.
5.2 Effect of market competition
Then, we test the moderating effect of market competition. As shown in Table 11, the coefficients of Treat × Post × Competi in columns 1 and 3 are significantly negative at the 1% level, and the coefficient in column 2 is significantly negative at the 10% level, suggesting that the level of market competition weakens the promotion effect of GCGs on green innovation in HPEs. The greater the market competition, the smaller the effect of GCGs on enterprises’ green innovation, but the impact on green innovation quality in HPEs is weaker. The H2b hypothesis is also confirmed.
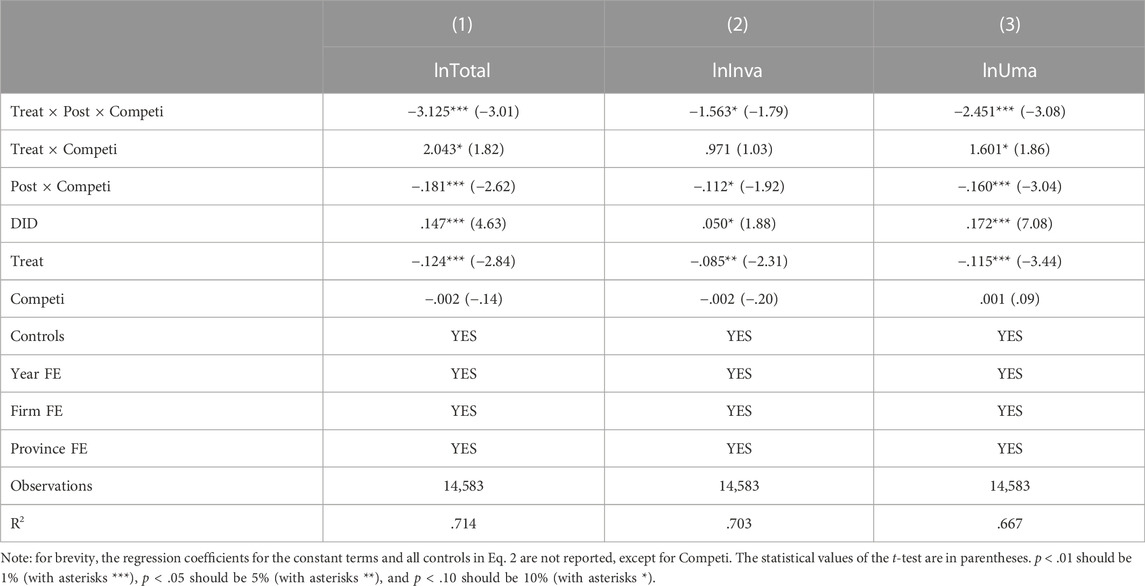
TABLE 11. Effect of market competition.
5.3 Effect of government intervention
To test hypotheses H2c, we analyzed the effect of local government intervention. The coefficients of Treat × Post × Gov_Invest in Table 12 are negative and significant at 1% level in columns 1 and 3, showing that local government intervention can significantly reduce the GCGs’ contribution to the quantity of green innovation in HPEs, but it does not have a significant impact on its quality of green innovation. This may be because government intervention influences the direction of industrial development in a region, with traditional manufacturing being favored because of its ability to bring faster results to the area. In the context of green credit policies, they often adopt simple technological upgrades for green upgrading to receive credit support from banks. Thus, hypothesis H3a is confirmed.
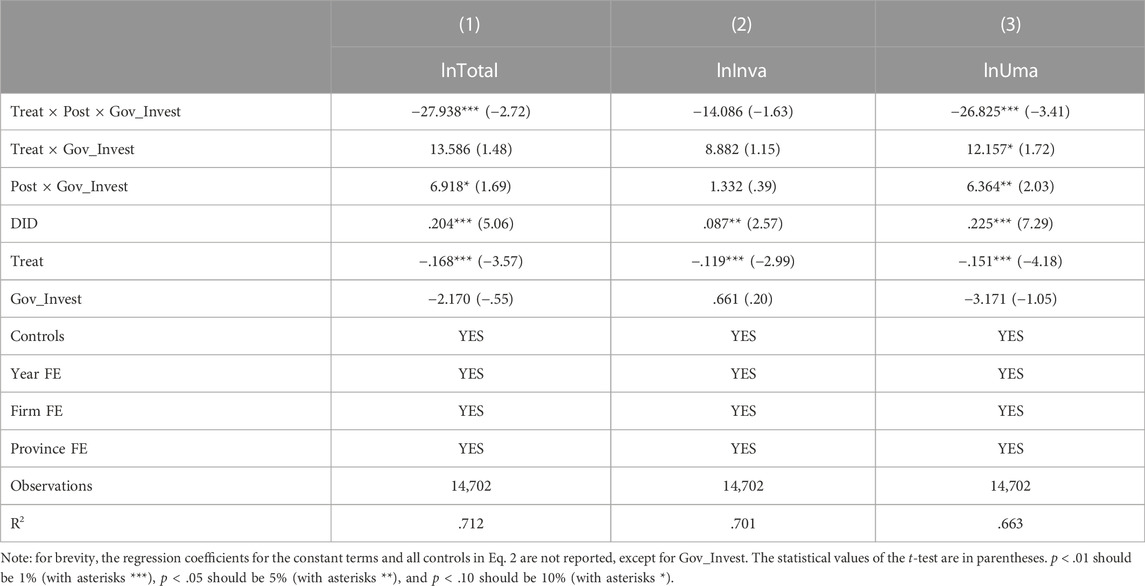
TABLE 12. Effect of government intervention.
5.4 Mediation effect of debt financing cost
To further investigate the mechanism of GCGs’ impact on green innovation, we use the causal step method to test the mediating effect. First, it has been verified that the overall impact of GCGs on green innovation in HPEs exists. Second, model (3) is regressed to judge the effect of GCGs on the mediating variable. At last, regression model (4) is carried out to test the direct effect
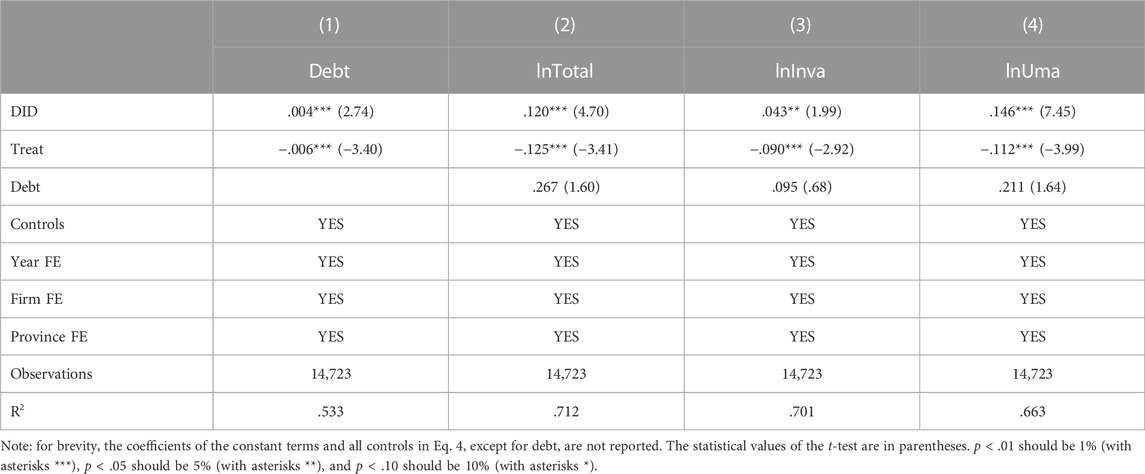
TABLE 13. Mediation effect test of debt financing cost.
5.4 The mediation effect of Totalloan
We use the total bank borrowings as a mediator variable to verify the GCGs on green innovation of HPEs through credit resource allocation.
As shown in Table 14, the coefficient of the DID in column 1 is significant and negative at 1%, showing that GCGs decrease the total loan of HPEs when compared with non-HPEs. The regression coefficient of the total loan on HPEs green innovation in columns 2–4 is not significant, so a bootstrap test (500 samplings) is required. The 95% confidence intervals for the indirect and direct effects after testing of lnTotal, lnInva, and lnUma are (−.7395 and −.5524), (.0364 and .1377), (−.5750 and −.4200), (−.0049 and .0790) and (−.5358 and −.4008), and (.0849 and .1580), respectively. The mediating effect of total loans on the total output and green utility model innovation of HPEs is significant. Together, the coefficients of the DID in columns 2–4 are significant and positive at 5%. Overall, the GCGs reduce the overall bank credit resources of enterprises and thus promote their number of green innovations. Still, the mediation effect of their green innovation quality is insignificant. Hypothesis H3b is confirmed.
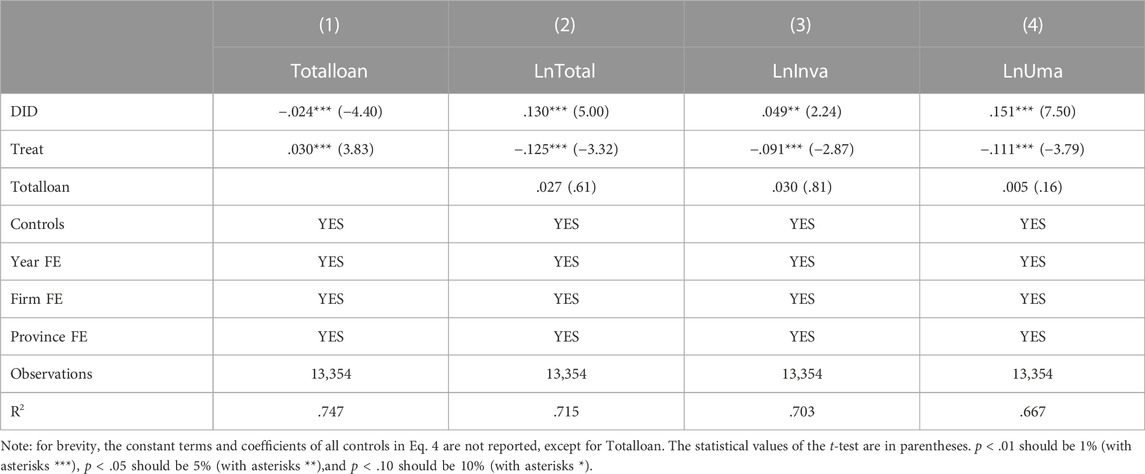
TABLE 14. Mediation effect test of Totalloan.
5.5 Mediation effect of commercial credit
The results of the mediating effect of commercial credit are presented in Table 15. In column 1, the coefficient of the DID is significant and negative at 10%, showing that the GCGs decrease the commercial credit of HPEs when compared with non-HPEs. Columns 2–4 reveal that the effect of commercial credit on green innovation in HPEs is significantly positive at 1%, showing that increasing commercial credit can increase the green innovation output of HPEs. At the same time, the coefficient of the DID in columns 2 and 4 is significantly positive at 1%. Thus, commercial credit has a significant partial mediation effect between the GCGs on the total output and green utility model innovation of HPEs, indicating that the GCGs enhance green innovation quantity by decreasing commercial credit of enterprises. This result confirms hypothesis H3c.
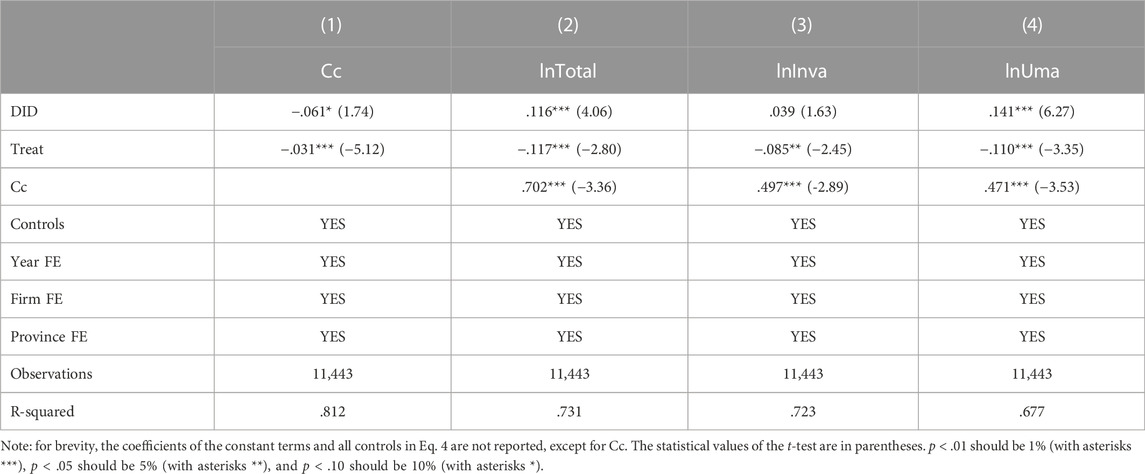
TABLE 15. Mediation effect test of commercial credit.
Ultimately, the mechanism by which GCGs influence green innovation of HPEs is through both increasing the cost of credit financing and limiting the amount of bank and social capital available.
6 Conclusion and policy implications
We have reached three conclusions. First, the GCGs have significantly promoted green innovation quantity in HPEs but are yet to improve the quality substantially. A series of robustness tests also validated our conclusions. Second, considering enterprise characteristics, market, and government, the promotion effect of the GCGs is higher in HPEs with state ownership, higher financial constraints, less market competition, and less local government intervention. Third, the GCGs increase the financing cost of HPEs, reducing their total bank credit resources and commercial credit and then stimulating their number of green innovations. Our findings further confirm the existence of the Porter hypothesis in developing economies and inform the development of green credit policies and green transitions to enhance sustainable development in developing economies with large populations.
The aforementioned empirical results show that the implementation of GCGs inhibits the flow of funds to HPEs and acts as a significant credit resource allocation, forcing them to engage in green innovation. To effectively form a “government-led, enterprise-oriented, market-driven, and socially participatory” model and achieve sustainable development goals, this study proposes the following policy recommendations:
First, the alignment of the fiscal policy with the green credit policy should be promoted. The government should further improve the implementation of green innovation for enterprises, such as providing government subsidies to those with actual technological innovation needs while strengthening the supervision of their funds to ensure their use. It will result in several primary and pilot demonstration projects with sound emission reduction effects that can be replicated.
Second, refined policy measures should be formulated to promote the implementation of green credit. Drawing on the Equator Principles, banks should comprehensively assess the contribution of enterprises in terms of environmental protection and social responsibility commitment. HPEs should strengthen innovation, and banks can offer a combination of short-term green financial products such as green credit, green funds, green insurance, green stocks, green bonds, and carbon finance, as well as long-term funding sources for enterprises to purchase environmental protection and R&D equipment.
Third, green credit policies should be leveraged to promote the transformation and upgrading of enterprises. Enterprises should aim to harmonize social responsibility and economic benefits, accelerating technological change, management transformation, and development transformation in terms of corporate strategy and the entire production cycle. Green credit funds should be actively invested in corporate R&D and proactively sought to transform and upgrade. In addition, enterprises should actively broaden their financing channels, such as introducing venture capital funds, seeking financial support, and entirely using the capital market.
Fourth, the role of commercial credit is valued for helping enterprises to develop green. The implementation of the GCGs will not only exacerbate HPEs’ credit constraints but also reduce their commercial credit financing, inhibiting their green innovation. Enterprises should attach great importance to the direct and spillover effects of green credit policies and effectively promote green transformation and development to seek more external financial support and promote green innovation.
Data availability statement
The original contributions presented in the study are included in the article/Supplementary Material; further inquiries can be directed to the corresponding author.
Author contributions
XX: conceptualization, methodology, investigation, data curation, validation, writing–original draft, writing–review and editing, and funding acquisition. TM: conceptualization, supervision, and writing–review and editing. TG: validation, writing-review and editing.
Funding
This research was supported by the Key research Project of higher education institutions in Henan Province, grant number 23A790027.
Conflict of interest
The authors declare that the research was conducted in the absence of any commercial or financial relationships that could be construed as a potential conflict of interest.
Publisher’s note
All claims expressed in this article are solely those of the authors and do not necessarily represent those of their affiliated organizations, or those of the publisher, editors, and reviewers. Any product that may be evaluated in this article, or claim that may be made by its manufacturer, is not guaranteed or endorsed by the publisher.
Abbreviations
HPEs, heavily polluting enterprises; GCGs, Green Credit Guidelines; DID, difference-in-differences model; CNIPA, China National Intellectual Property Office; WIPO, World Intellectual Property Organization; CSMAR, China Economic and Financial Research Database; CNRDS, China Research Data Service Database; NBSC, National Bureau of Statistics of China; PITI, Pollution Source Regulatory Information Disclosure Index.
Footnotes
1The 21 banks include the Industrial and Commercial Bank of China, China Construction Bank, Agricultural Bank of China, Bank of China, Bank of Communications, Post and Reserve Bank, Industrial Bank, China Merchants Bank, CITIC Bank, Minsheng Bank, Pudong Development Bank, Everbright Bank, Ping An Bank, Huaxia Bank, Bank of Beijing, Guangfa Bank, Shanghai Bank, Jiangsu Bank, Zheshang Bank, Bank of Nanjing, and Bank of Ningbo.
2Heavily polluting enterprises are nine industries: (i) nuclear power generation, (ii) hydroelectric power generation, (iii) water conservancy and inland river port engineering construction, (iv) coal mining and washing industry, (v) oil and gas mining, (vi) ferrous metal mining and selection, (vii) non-ferrous metal mining and selection, (viii) non-metal mining and selection, and (ix) other mining industries.
3There are two types of problematic stocks, namely, ST and *ST. ST refers to the company that has been operating at a loss for two consecutive years, and special treatment is given to trading in the shares of listed companies with unusual financial or other conditions. *ST is a stock that has been operating at a loss for three consecutive years and has a delisting warning.
4Reference websites for data resources are as follows: https://english.cnipa.gov.cn/col/col2942/index.html for CNIPA. https://cn.gtadata.com/for CSMAR. https://www.cnrds.com/for CNRDS. http://www.stats.gov.cn/tjsj./ndsj/for NBSC.
5Green patents include 1) alternative energy production, nuclear power generation, energy saving, transportation, waste management, agriculture, or forestry, and 2) administrative, regulatory, or design aspects.
6The number of patent applications received by the State Intellectual Property Office of China in 2019 fell for the first time in nearly 24 years, as China undertook an overall regulatory transformation to optimize the structure of applications and improve their quality.
References
Brunnermeier, S. B., and Cohen, M. A. (2003). Determinants of environmental innovation in US manufacturing industries. J. Environ. Econ. Manag. 45 (2), 278–293. doi:10.1016/s0095-0696(02)00058-x
Cui, Y., Geobey, S., Weber, O., and Lin, H. (2018). The impact of green lending on credit risk in China. Sustainability 10 (6), 2008. doi:10.3390/su10062008
Ding, N., Ren, Y. N., and Zuo, Y. (2020). Do the losses of the green-credit policy outweigh the gains? A PSM-DID cost-efficiency analysis based on resource allocation. J. Financial Res. 4, 112–130.
Gollop, F. M., and Roberts, M. J. (1983). Environmental regulations and productivity growth: The case of fossil-fueled electric power generation. J. political Econ. 91 (4), 654–674. doi:10.1086/261170
Gu, X. M., Chen, Y. M., and Pan, S. Y. (2018). Economic policy uncertainty and innovation: Evidence from listed companies in China. Econ. Res. J. 53 (2), 109–123.
Gupta, H., and Barua, M. K. (2018). A framework to overcome barriers to green innovation in SMEs using BWM and Fuzzy TOPSIS. Sci. Total Environ. 633, 122–139. doi:10.1016/j.scitotenv.2018.03.173
Hadlock, C. J., and Pierce, J. R. (2010). New evidence on measuring financial constraints: Moving beyond the KZ index. Rev. financial Stud. 23 (5), 1909–1940. doi:10.1093/rfs/hhq009
Han, Z., Xu, H., and Tu, K. (2019). “Research on the effectiveness of green credit policy-based on the empirical study of 19 listed banks in China,” in 2019 3rd International Conference on Data Science and Business Analytics (ICDSBA), Turkey, 11-12, 2019, 202–205.
Hong, M., Li, Z., and Drakeford, B. (2021). Do the green credit guidelines affect corporate green technology innovation? Empirical research from China. Int. J. Environ. Res. Public Health 18 (4), 1682. doi:10.3390/ijerph18041682
Hu, G., Wang, X., and Wang, Y. (2021). Can the green credit policy stimulate green innovation in heavily polluting enterprises? Evidence from a quasi-natural experiment in China. Energy Econ. 98, 105134. doi:10.1016/j.eneco.2021.105134
Huang, L., and Lei, Z. (2021). How environmental regulation affect corporate green investment: Evidence from China. J. Clean. Prod. 279, 123560. doi:10.1016/j.jclepro.2020.123560
Huang, H., and Zhang, J. (2021). Research on the environmental effect of green finance policy based on the analysis of pilot zones for green finance reform and innovations. Sustainability 13 (7), 3754. doi:10.3390/su13073754
Jaffe, A. B., and Palmer, K. (1997). Environmental regulation and innovation: A panel data study. Rev. Econ. statistics 79 (4), 610–619. doi:10.1162/003465397557196
Jin, Y., Gao, X., and Wang, M. (2021). The financing efficiency of listed energy conservation and environmental protection firms: Evidence and implications for green finance in China. Energy Policy 153, 112254. doi:10.1016/j.enpol.2021.112254
Li, D., Tang, F., and Jiang, J. (2019). Does environmental management system foster corporate green innovation? The moderating effect of environmental regulation. Technol. Analysis Strategic Manag. 31 (10), 1242–1256. doi:10.1080/09537325.2019.1602259
Li, W., Cui, G., and Zheng, M. (2022). Does green credit policy affect corporate debt financing? Evidence from China. Environ. Sci. Pollut. Res. 29 (4), 5162–5171. doi:10.1007/s11356-021-16051-2
Lian, L. S., Chen, C., and Bai, J. (2015). Industrial policy and allocation of credit resources. Econ. Manag. J. 12, 1–11.
Lian, Y., Gao, J., and Ye, T. (2022). How does green credit affect the financial performance of commercial banks?—evidence from China. J. Clean. Prod. 344, 131069. doi:10.1016/j.jclepro.2022.131069
Liao, Z., Weng, C., and Shen, C. (2020). Can public surveillance promote corporate environmental innovation? The mediating role of environmental law enforcement. Sustain. Dev. 28 (6), 1519–1527. doi:10.1002/sd.2101
Ling, S., Han, G., An, D., Hunter, W. C., and Li, H. (2020). The impact of green credit policy on technological innovation of firms in pollution-intensive industries: Evidence from China. Sustainability 12 (11), 4493. doi:10.3390/su12114493
Liu, R. Z., and He, C. (2021). Research on the threshold effect of environmental regulation on income inequality of urban residents. China Soft Sci. 08, 41–59.
Liu, X., Wang, E., and Cai, D. (2019). Green credit policy, property rights and debt financing: Quasi-natural experimental evidence from China. Finance Res. Lett. 29, 129–135. doi:10.1016/j.frl.2019.03.014
Liu, L., Zhao, Z., Zhang, M., and Zhou, D. (2022). Green investment efficiency in the Chinese energy sector: Overinvestment or underinvestment? Energy Policy 160, 112694. doi:10.1016/j.enpol.2021.112694
Luo, S., Yu, S., and Zhou, G. (2021). Does green credit improve the core competence of commercial banks? Based on quasi-natural experiments in China. Energy Econ. 100, 105335. doi:10.1016/j.eneco.2021.105335
Peng, J., and Zheng, Y. (2021). Does environmental policy promote energy efficiency? Evidence from China in the context of developing green finance. Front. Environ. Sci. 299. doi:10.3389/fenvs.2021.733349
Peng, H., Shen, N., Ying, H., and Wang, Q. (2021). Can environmental regulation directly promote green innovation behavior?-based on situation of industrial agglomeration. J. Clean. Prod. 314, 128044. doi:10.1016/j.jclepro.2021.128044
Porter, M. E., and Linde, C. Van Der. (1995). Green and competitive: Ending the stalemate green and competitive. Harv. Bus. Rev. 73 (5), 120–134.
Sánchez-Medina, P. S., Díaz-Pichardo, R., Bautista-Cruz, A., and Toledo-López, A. (2015). Environmental compliance and economic and environmental performance: Evidence from handicrafts small businesses in Mexico. J. Bus. Ethics 126 (3), 381–393. doi:10.1007/s10551-013-1945-2
Shao, S., Hu, Z., Cao, J., Yang, L., and Guan, D. (2020). Environmental regulation and enterprise innovation: A review. Bus. Strategy Environ. 29 (3), 1465–1478. doi:10.1002/bse.2446
Song, M., Wang, S., and Zhang, H. (2020). Could environmental regulation and R&D tax incentives affect green product innovation? J. Clean. Prod. 258, 120849. doi:10.1016/j.jclepro.2020.120849
Stefan, A., and Paul, L. (2008). Does it pay to be green? A systematic overview. Acad. Manag. Perspect. 22 (4), 45–62. doi:10.5465/amp.2008.35590353
Stucki, T., Woerter, M., Arvanitis, S., Peneder, M., and Rammer, C. (2018). How different policy instruments affect green product innovation: A differentiated perspective. Energy Policy 114, 245–261. doi:10.1016/j.enpol.2017.11.049
Su, D. W., and Lian, L. L. (2018). Does green credit affect the investment and financing behavior of heavily polluting enterprises. J. Finance Res. 12, 123–137.
Tang, K., Qiu, Y., and Zhou, D. (2020). Does command-and-control regulation promote green innovation performance? Evidence from China's industrial enterprises. Sci. Total Environ. 712, 136362. doi:10.1016/j.scitotenv.2019.136362
Tian, C., Li, X., Xiao, L., and Zhu, B. (2022). Exploring the impact of green credit policy on green transformation of heavy polluting industries. J. Clean. Prod. 335, 130257. doi:10.1016/j.jclepro.2021.130257
Wang, Y., and Li, M. (2022). Credit policy and its heterogeneous effects on green innovations. J. Financial Stab. 58, 100961. doi:10.1016/j.jfs.2021.100961
Wang, X., and Wang, Y. (2021). Research on the green innovation promoted green credit policies. J. Manag. World 6, 173–188.
Wang, H., Qi, S., Zhou, C., Zhou, J., and Huang, X. (2022). Green credit policy, government behavior and green innovation quality of enterprises. J. Clean. Prod. 331, 129834. doi:10.1016/j.jclepro.2021.129834
Wang, K., Sun, X., and Wang, F. (2019). Green finance, financing constrains and the investment of polluting enterprise. Contemp. Econ. Manag. 41, 83–96.
Wang, X., Zhang, C., and Zhang, Z. (2019). Pollution haven or porter? The impact of environmental regulation on location choices of pollution-intensive firms in China. J. Environ. Manag. 248, 109248. doi:10.1016/j.jenvman.2019.07.019
Wang, Y., Pan, D., Yu, P., and Liang, X. (2019). China’s incentive policies for green loans: A DSGE approach. J. Finance Res. 11, 1–18.
Wanting, X. (2020). Research on the impact of green credit on the financial performance of commercial banks. Financial Eng. Risk Manag. 3 (1), 127–136. doi:10.23977/ferm.2020.030119
Xiao, H. L., Tang, Q. Q., and Zhou, M. H. (2014). The effect of debt on innovation investment pattern: An empirical study based on R&D heterogeneity. Sci. Res. Manag. 10, 77–85.
Xiao, Z., Yu, L., Liu, Y., Bu, X., and Yin, Z. (2022). Does green credit policy move the industrial firms toward a greener future? Evidence from a quasi-natural experiment in China. Front. Environ. Sci. 719. doi:10.3389/fenvs.2021.810305
Xu, X., and Li, J. (2020). Asymmetric impacts of the policy and development of green credit on the debt financing cost and maturity of different types of enterprises in China. J. Clean. Prod. 264, 121574. doi:10.1016/j.jclepro.2020.121574
Yan, Z., Zou, B., Du, K., and Li, K. (2020). Do renewable energy technology innovations promote China's green productivity growth? Fresh evidence from partially linear functional-coefficient models. Energy Econ. 90, 104842. doi:10.1016/j.eneco.2020.104842
Yao, S., Pan, Y., Sensoy, A., Uddin, G. S., and Cheng, F. (2021). Green credit policy and firm performance: What we learn from China. Energy Econ. 101, 105415. doi:10.1016/j.eneco.2021.105415
Ye, H. Y., and Wu, X. Q. (2022). Green credit policy, green technology innovation and transformation and up-grading of enterprise: Based on regulation effects of market competition. West Forum Econ. Manag. 33 (2), 56–96.
Yin, W., Zhu, Z., Kirkulak-Uludag, B., and Zhu, Y. (2021). The determinants of green credit and its impact on the performance of Chinese banks. J. Clean. Prod. 286, 124991. doi:10.1016/j.jclepro.2020.124991
Yin, X. (2021). Research on the impact of green credit on the financial performance of commercial banks. Finance Mark. 6, 71. doi:10.18686/fm.v6i1.3267
Yu, B. (2021). How does the green credit policy impact on heavy pollution firms’ technological innovation? Bus. Manag. J. 11, 35–51.
Zhang, D., and Vigne, S. A. (2021). The causal effect on firm performance of China's financing–pollution emission reduction policy: Firm-level evidence. J. Environ. Manag. 279, 111609. doi:10.1016/j.jenvman.2020.111609
Zhang, D., Tong, Z., and Zheng, W. (2021). Does designed financial regulation policy work efficiently in pollution control? Evidence from manufacturing sector in China. J. Clean. Prod. 289, 125611. doi:10.1016/j.jclepro.2020.125611
Zhang, K., Wang, Y., and Huang, Z. (2021). Do the green credit guidelines affect renewable energy investment? Empirical research from China. Sustainability 13 (16), 9331. doi:10.3390/su13169331
Zhang, Q., Xu, L., Wang, K., and Shi, X. (2021). What effect did the Green Credit Policy have on China's energy or emission intensive firms? Int. J. Emerg. Mark. doi:10.1108/ijoem-04-2021-0555
Zhang, S., Wu, Z., Wang, Y., and Hao, Y. (2021). Fostering green development with green finance: An empirical study on the environmental effect of green credit policy in China. J. Environ. Manag. 296, 113159. doi:10.1016/j.jenvman.2021.113159
Zhang, Y., Xing, C., and Tripe, D. (2021). Redistribution of China’s green credit policy among environment-friendly manufacturing firms of various sizes: Do banks value small and medium-sized enterprises? Int. J. Environ. Res. Public Health 18 (1), 33. doi:10.3390/ijerph18010033
Zhang, Y., Li, X., and Xing, C. (2022). How does China's green credit policy affect the green innovation of high polluting enterprises? The perspective of radical and incremental innovations. J. Clean. Prod. 336, 130387. doi:10.1016/j.jclepro.2022.130387
Keywords: green credit policy, Green Credit Guidelines, green innovation, heavily polluting enterprises, China
Citation: Xiong X, Masron TA and Gondo TW (2023) Can the green credit policy stimulate green innovation of heavily polluting enterprises in China?. Front. Environ. Sci. 10:1076103. doi: 10.3389/fenvs.2022.1076103
Received: 21 October 2022; Accepted: 29 December 2022;
Published: 17 January 2023.
Edited by:
Irfan Ullah, Nanjing University of Information Science and Technology, ChinaReviewed by:
Arshad Ali, Greenwich University, PakistanFarman Ullah Khan, Bahria University, Pakistan
Copyright © 2023 Xiong, Masron and Gondo. This is an open-access article distributed under the terms of the Creative Commons Attribution License (CC BY). The use, distribution or reproduction in other forums is permitted, provided the original author(s) and the copyright owner(s) are credited and that the original publication in this journal is cited, in accordance with accepted academic practice. No use, distribution or reproduction is permitted which does not comply with these terms.
*Correspondence: Tajul Ariffin Masron, dGFtc0B1c20ubXk=