 Xiaoyan Zhang
 Weiyan Ma
94% of researchers rate our articles as excellent or good
Learn more about the work of our research integrity team to safeguard the quality of each article we publish.
Find out more
ORIGINAL RESEARCH article
Front. Environ. Sci. , 13 January 2023
Sec. Environmental Economics and Management
Volume 10 - 2022 | https://doi.org/10.3389/fenvs.2022.1073395
The economic linkages between cities within the Yangtze River Economic Belt city cluster are important for precisely implementing the Yangtze River Economic Belt strategy. Accordingly, this study used the revised gravity model, social network method, and spatial Durbin model to analyze the economic linkage strength, spatial-temporal differentiation, and driving factors of the three major city cluster in the Yangtze River Economic Belt from 2006–2020. The results confirm that the Chengdu-Chongqing urban agglomeration has formed a network structure with Chengdu and Chongqing as the two poles; the urban agglomeration in the middle reaches of the Yangtze River has formed a point-axis development pattern of Wuhan, Changsha and Nanchang. The Yangtze River Delta urban agglomeration formed a multi-center radiation and sub-network development pattern. Additionally, the characteristics of network structure significantly affected the flow of factors, the level of economic development was the basis for strengthening communication and cooperation between cities. Meanwhile, the advanced industrial structures played an important role in promoting industrial linkages, and human capital exerts an obvious spatial spillover effect. Therefore, these three major urban agglomerations should implement differentiated development strategies and enhance the synergy of their linkage networks, thus promoting high-quality development.
With the accelerated development of regional integration process, material, energy and information are constantly exchanged between regions, and a regional economic network with interconnection and interaction is formed day by day. As complex social phenomena, the flow and exchange of various elements between cities may affect economic linkages and networks. In addition to reducing the cost of economic activity and promoting effective division of labor pattern, close economic ties between cities enable the rapid diffusion of information, technology, and capital, stimulating potential knowledge innovation and experiencing diffusion. The central place theory is a key building block of economic geography and an empirically plausible description of city systems. It describes how a city hierarchy is formed (Hsu et al., 2014). Scholars of regional science, urban studies, and geography have long been interested in the spatial interactions between cities and regions as they convey the spatial structure of a region (Ye et al., 2021). Regions continuously exchange various materials, personnel, and information with other region. After that, the “geospatial flow” theory enters the field of study of regional economic linkages. The study of regional spatial structure has gradually shifted from internal urban characteristics to external urban relations. An apparent shift toward inter-city relationships can be observed in urban studies literature, producing a spectacular landscape of urban network study in general (Jinliao et al., 2022). Urban network studies have highlighted the importance of the structural advantages of cities in contemporary global and regional economic systems (Martinus and Sigler, 2017). There seems to be general agreement on the fact that the regions have become increasingly integrated and highly complex, with cross-border spatial connections and spatial dependencies (Zhang et al., 2020). Overall, the existing studies on economic linkages have mainly focused on the spatial association of “adjacent” or “nearby” regions.
Although many studies focused on the description and dynamic changes in the city network, only few have analyzed the factors influencing the formation of the city network from the perspective of empirical analysis (Chong and Pan, 2020). The networks paradigm was based on the inter-city network formed by various flows (e.g., people, information, and goods) and showed the presence of horizontal and complementary relationships among cities of similar size, and not the vertical and ‘one-sided’ relationships. Different cities play different roles in the economic linkage network, and geographical proximity brings about the possibility of inter-city factor flow and lower transaction costs. Node location, hierarchical node distribution, network heterogeneity and diversity, network connectivity, and the degree of network aggregation are important factors affecting network function and structure (Wang Z. et al., 2020). Highly influential nodes with special properties are critical to the structure and function of a network (Li and Xiao, 2021). Inter-regional interconnection promotes economic growth, and urban economic growth provides innovative elements for regional innovation, such as technology, capital, talent, and information. The formation of the urban economic network results from the development and improvement of commodity economy, the social division of labor, and professional collaboration (Chen and Jiang, 2022). The level of regional economic development affects the spatial interaction of economic linkages and the evolution of its network structure and is also, the basis for exchange and cooperation of cities within urban clusters. Cities with higher levels of economic development are more capable of gathering economic factors and promoting the interpenetration of economic activity subjects and economic factors. Intra-sectoral linkages will become increasingly crucial in promoting industrial upgrading as industrialization evolves to a higher level (Mao et al., 2020). One of the purposes of inter-city exchanges is to form industrial complementarities; an industrial structure gives rise to industrial linkages. The interactive development between cities relies on industrial linkages, and the improvement and upgrading of industrial structures can deepen inter-city exchanges and cooperation and form inter-regional assemblages based on industrial cooperation. The flow of people determines the development of an urban economic network structure. When people gather, there are more development plans, and the city’s economic level will naturally be higher (Chen and Jiang, 2022). Human capital is an important influencing factor for regional economic growth, and inter-city exchange and cooperation partly rely on the spatial movement of population to achieve knowledge spillover. Urban agglomerations can promote the free flow and efficient comprehensive utilization of resource elements and further promote regional development to form a reasonable development pattern and a sound coordinated development mechanism (Dong and Li, 2022). Factor diffusion and agglomeration in cities are also important factors that cause changes in urban economic linkage networks. Various types of production factors diffuse and agglomerate among different regions through various channels to further enhance inter-regional economic linkages. This highlights the significant impact of these factors on regional economic linkages.
To sum up, the existing studies focused on the economic linkage of urban agglomerations inter-city economic linkage measurement, spatial network structure and effect (Martinus and Sigler, 2017), evolutionary characteristics, functional diffusion variability of central cities, economic linkage impacts on economic efficiency (Chen and Jiang, 2022), economic linkage network structure (Chong and Pan, 2020), etc. However, these researches rarely considered the importance of network structural characteristics on urban economic linkages and the factors influences economic linkages and generate regional spatial spillover effects. In terms of research methodology, QAP analysis methods were mainly applied (Li et al., 2022), without paying attention to the spatial spillover effects of the influencing factors.
The circulation and reorganization of resources in a network promotes agglomeration, and when a city’s network links are located in a way that facilitates resource agglomeration, its centrality is critical (SASSEN, 2010). Combing the topological property (transitivity) with the spatial properties can help people better understand the formation process of economic linkage networks. This study uses spatial measures to clarify the spatial effects of factors influencing economic linkage networks, explores what factors and to what extent these factors influence the formation of economic linkage network, which enriches the theoretical system and research framework of city economic linkage. And the practical contribution is to propose differentiated development strategies and planning for the three major city clusters in the Yangtze River Economic Belt.
Therefore, it is critical to answer the following three questions: 1) How are the economic linkages within the three major city groups, which are in the upper, middle and lower reaches of the Yangtze River Economic Belt? 2) What are the developmental patterns of spatial-temporal divergence? 3) What are the key drivers? This study used a nested matrix of economic and geographical distances to overcome the limitations of traditional spatial association and analyzed the economic linkages, influencing factors, and spatial effects of the three major urban agglomerations in the Yangtze River Economic Belt.
The Economic Belt is an area with the city as the central point, the Yangtze River as the axis, and the basin as the surface. The Yangtze River Economic Belt, spanning three major regions, eastern, central, and western China (Wang Y. et al., 2022), shoulders the important task of promoting the development of the west, driving the rise of central China, undertaking the integration of the Yangtze River Delta, and accelerating the coordinated development of the country’s regions. As the most crucial urban agglomeration in the upper reaches of the Yangtze River, these cities of the Chengdu-Chongqing Urban Agglomeration are highly connected (Lu et al., 2022). The middle reaches of the Yangtze River urban agglomeration can be further divided into the Wuhan urban agglomeration, the Chang-Zhu-Tan urban agglomeration, and the Poyang Lake urban agglomeration, with a total land area of 32.61 × 10⁴ ha, making it the largest urban agglomeration in China (Ma et al., 2022). Centering on Shanghai, the Yangtze River Delta urban agglomeration is highly developed and interconnected, with an extensive regional division of labour, significant spill-over effects, and synergized urban development (Zhu et al., 2023). On this basis, the outlined development plan for Chengdu-Chongqing urban agglomeration, the middle reaches of the Yangtze River urban agglomeration, and the Yangtze River Delta urban agglomeration released. These three agglomerations played an indispensable role in promoting coordinated regional development. More and more scholars have focused on developing the three urban agglomerations.
According to the “Chengdu-Chongqing City Cluster Development Plan”, “Yangtze River Midstream City Cluster Development Plan,” and “Yangtze River Delta City Cluster Development Plan”, 16 cities are chosen from the Chengdu-Chongqing city cluster, 31 cities are chosen from the middle reaches of the Yangtze River city cluster, and 27 cities are chosen from the Yangtze River Delta city cluster, a total of 74 cities are included in this study. Cities’ details are presented in Appendix A. In 2006, China’s Eleventh Five-Year Plan clearly proposed that “urban agglomerations should be the main form of urbanization, and regions with conditions for urban agglomeration development should strengthen integrated planning, with mega-cities and big cities as leaders, and play the role of central cities”. In 2020, the national 14th Five-Year Plan of China proposed to “smooth the domestic circulation, improve the mechanism of regional cooperation and mutual assistance, and build a modernized urban area”. The rapid growth of China’s cities and changes in regional planning during the period 2006–2020 indicate that urban economic linkages have gradually evolved into networks. Given the starting point of large-scale urbanization in China and the national and regional planning stages, for this reason, the year from 2006–2020 was selected as the research period in this research. The data were mainly obtained from the City Statistical Yearbook of China, the EPS public database, statistical yearbooks of provinces and cities, and the shortest road distance data from Baidu Maps.
The gravity model is based on Isaac Newton’s gravitational law (Aydın and Ülengin, 2022) and is one of the methods used to calculate the intensity of economic linkages between regions. The economic linkage intensity indicates the degree of economic and social linkages between two cities (Wu et al., 2017). Based on the classical gravity model, this study referred to the modified gravity model of (Fan and Xiao, 2021) to calculate the economic linkages between cities. To highlight the directivity of economic linkages, G was measured by the proportion of gross domestic product to the sum of gross domestic product of the two linked cities. The calculation formula is as follows:
where
The SNA method is an interdisciplinary analytical method based on graph theory tools and algebraic models that use relationships as the basic unit for analysis (Huo et al., 2022). Interregional economic links are characterized by a network structure, and the use of social network analysis enables the correct analysis of individuals who are not independent of each other in their relationships. To investigate the evolution of economic linkage network and the factors affecting the formation of the city network, we needed to construct the economic linkage network and then calculate the index reflecting the connectivity degree of the city in the economic linkage network.
First, the network density measures the overall network characteristics of the network, which is the ratio of the sum of the actual number of ties generated between network nodes to the sum of the theoretical maximum number of ties generated by all network nodes. This index reflects the closeness of the association between network nodes. The greater the network density, the closer the connection between network nodes, and the stronger the ability to influence each other (Reza HabibAgahi et al., 2022).
Second, centrality is one of the essential metrics in graph and network theory and is used to asses a node’s relevance, or structural importance, in the network. The centrality measure defines a node’s importance in a network (Camacho et al., 2020). The centrality metric can be used to determine the position of a node in the network and its influence. The centrality of a point measures the influence or position of an individual as a network node in an entire network. The degree centrality potential of the graph is used to study whether the entire network structure graph tends to concentrate at a certain node or nodes. However, point centrality evaluates the local centrality index of a node and measures its connectivity in the network, without considering whether it can control others. In contrast, betweenness centrality quantifies the number of times a node acts as a bridge along the shortest path between two other nodes and is, therefore, a control ability index.
Spatial autocorrelation is characterized by a correlation in a signal between nearby locations in space (Cao et al., 2019). One potential application of spatial autocorrelation analysis is to study clusters and dispersion for a given dataset (Kumari et al., 2019). To evaluate the distribution pattern of economic linkage potential, we used global Moran’s I and local Moran’s I to conduct spatial autocorrelation analysis. The z-score and p-value were used to evaluate the significance of the index.
The global Moran index tests whether neighboring areas in the entire study area are similar, dissimilar (spatially positively and negatively correlated), or independent of each other. The calculation formula is as follows.
where
The local Moran’s index is used to test whether similar or dissimilar observations are clustered in a local area. The local Moran’s index of a region is used to measure the degree of association between the region and its neighboring regions. The calculation formula is as follows.
The symbolic meaning is the same as that of the global Moran index. The results were divided into four categories: non-significant, high-high clustering, low-low clustering, high-low clustering, and low–high clustering.
Based on analyzing the influential factors driving changes in economic linkages, we first developed a panel fixed-effects model. The economic linkage potential value, which represents the strength of a city’s economic linkage with other cities, is defined as the average attractiveness and radiance of the city, and the data were logarithmized. This study used the value of economic linkage potential as the explained variable.
where ln represents the natural logarithm of the variable, rel is the value of the economic linkage potential, Net represents the network structure features, Dev is economic development level, Ind is the industrial structure, Hum is human capital, and Fac is the capability of factor aggregation and diffusion.
Where a is the coefficient of the explanatory variable, u is the individual effect, v is the time effect, and s is the random perturbation term.
The most frequently used spatial econometric models include the spatial lag model (SLM), the spatial error model (SEM), and the SDM (Yang et al., 2022). The spatial Durbin model (SDM) is a combined extended form of the spatial lag model (SLM) and the spatial error model (SEM) that considers both the spatial correlation of the dependent variable and the spatial correlation of the independent variables. This study drew on the ideas of (Ruan and Zhang, 2021) to build the following SDM model:
where
In spatial measurement, the combined effect of explanatory variables on the explained variables is divided into direct and indirect effects, where the direct effect is the change in a city’s independent variables leading to a change in its own dependent variables and the indirect effect is the spatial spillover effect of the explanatory variables. Therefore,
The strength of economic linkages was derived using the modified gravity model. Among the three major city groups in the Yangtze River Economic Belt, each city has links to other cities, resulting in a directed asymmetric city-by-city matrix. A total of 1,872 city pairs were obtained by calculation. Table 1 lists the top 20 city pairs in terms of economic linkage intensity in 2020. From the perspective of the entire city network, the economic linkage values increased along with emerging linkages, and the city network seemed to be more intensive in 2020 than in 2006.
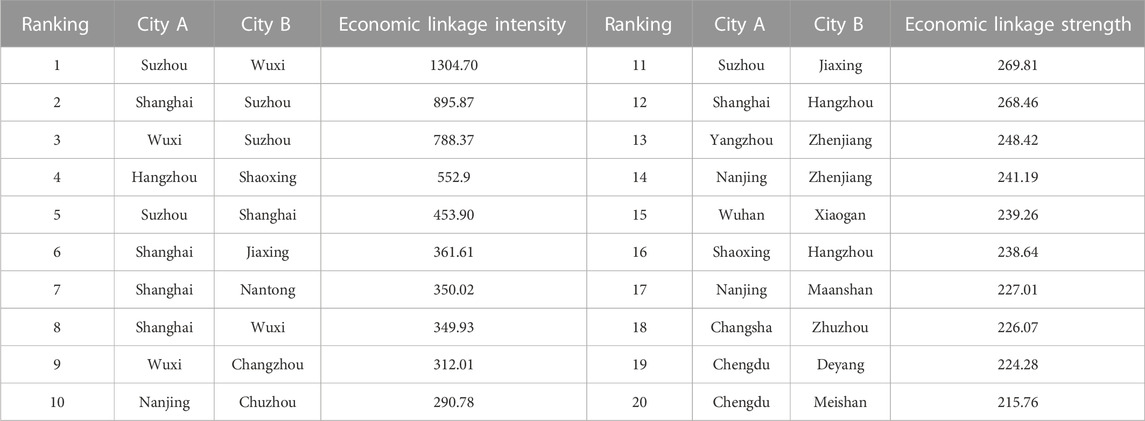
TABLE 1. Top 20 city pairs in terms of economic linkage intensity in 2020.
The comparison shows that most of the top 20 city pairs, belong to the Yangtze River Delta city cluster. In comparison, the Chengdu-Chongqing city cluster and the middle reaches of Yangtze River city cluster have only two pairs of cities selected, indicating that the economic ties between cities in the Yangtze River Delta city cluster are strong and relatively close. In the Chengdu-Chongqing city cluster, Chengdu to Meishan, Chengdu to Deyang, Zigong to Neijiang, and Chongqing to Mianyang were the top city pairs in terms of economic linkage intensity in 2006–2010, 2011–2012, 2013, 2017–2020, and 2014–2016, respectively. Among the cities in the middle reaches of Yangtze River, Huanggang to Ezhou, and Wuhan to Xiaogan were the top cities in terms of economic linkage intensity in 2006–2019 and 2020, respectively. In the Yangtze River Delta urban agglomeration, Suzhou to Wuxi was the top city pair in terms of economic linkage intensity in 2006–2020. They have formed a continuous and stable economic linkage.
From the perspective of a complete city network, some cities stand out as major nodes within the network. We use ArcGIS software to map out the complete city network of economic linkages among cities in the three major city clusters in the Yangtze River Economic Belt in 2020 and normalized it according to the maximum value of economic tie strength. Figures 1–3 show the intensity of economic ties among the Chengdu-Chongqing urban agglomeration, middle reaches of Yangtze River urban agglomeration, and Yangtze River Delta urban agglomeration, respectively, in 2020. Figure 1A, Figure 2A, and Figure 3A show all urban economic linkages, while Figure 1B, Figure 2B, and Figure 3B show the effects presented after excluding urban linkages with economic linkage strength less than or equal to 0.01. The connection values were divided into five ranges, represented by line color and thickness.

FIGURE 1. Economic linkage intensity of cities in Chengdu-Chongqing city cluster in 2020 (A,B).
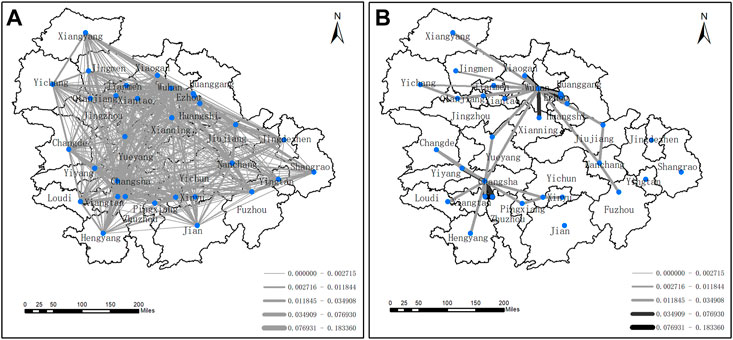
FIGURE 2. Intensity of economic ties in the middle reaches of the Yangtze River urban agglomeration in 2020 (A,B).
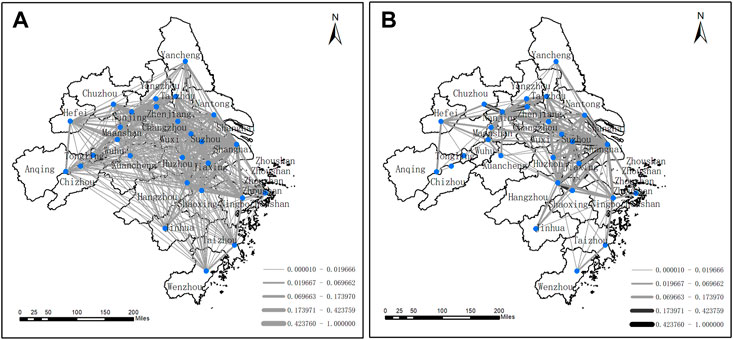
FIGURE 3. Strength of economic ties in the Yangtze River Delta city cluster in 2020 (A,B).
In Figure 1, the Chengdu-Chongqing urban agglomeration in 2020 formed a network of economic links with Chengdu and Chongqing as the two poles, which radiate to influence geographically close cities. Other than these two cities, the economic linkages between other cities are relatively weak, but all have economic interactions with neighboring cities. Figure 2 shows that the midstream Yangtze River urban agglomeration formed an economic linkage network with Wuhan, Changsha, and Nanchang as the three poles in 2020. However, Wuhan and Changsha have a relatively greater ability to radiate and influence neighboring cities, and Nanchang has less ability to radiate and influence neighboring cities. As the middle reaches of Yangtze River city cluster have more cities, relying on the radiation effect of Wuhan, Changsha, and Nanchang, a point-axis economic linkage pattern is formed within the city cluster. As shown in Figure 3, the Yangtze River Delta urban agglomeration is more mature, with several cities closely connected, and the role of polarization pattern is weakened, relying on multi-point development. Some cities with similar geographic locations, but far from the central cities, can also form several small economic networks with neighboring cities to realize network development. The Yangtze River Delta city cluster has stronger economic ties than the Chengdu-Chongqing city cluster and the middle reaches of the Yangtze River city cluster.
The strength of the connectivity between any two inter-linked cities was determined by the number of social ties each city-dyad possessed. Calculating the strength of economic ties, economic linkage intensity matrices of 16 × 16, 31 × 31 and 27 × 27 for the three major urban agglomerations were obtained. Methodologically, we employed the social network software UCINET to undertake a network analysis.
The Chengdu-Chongqing urban agglomeration, the Yangtze River Delta urban agglomeration, and the Yangtze River midstream urban agglomeration, respectively, rank in terms of descending order of network density. The network density of the three major urban agglomerations was relatively flat from 2006–2020 without major fluctuations, among which the cities in the Chengdu-Chongqing urban agglomeration were more closely connected and had a stronger ability to influence each other (Figure 4). In Figure 5, the Chengdu and Chongqing cities have the least number of cluster relationships, the middle Yangtze River urban cluster has the highest, and the difference between the Yangtze River Delta urban cluster and the middle Yangtze River urban cluster is smaller.
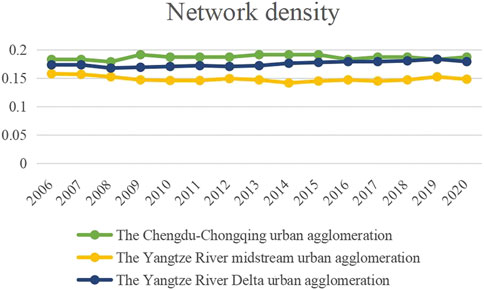
FIGURE 4. Network density of the three major urban agglomerations in the Yangtze River economic belt.
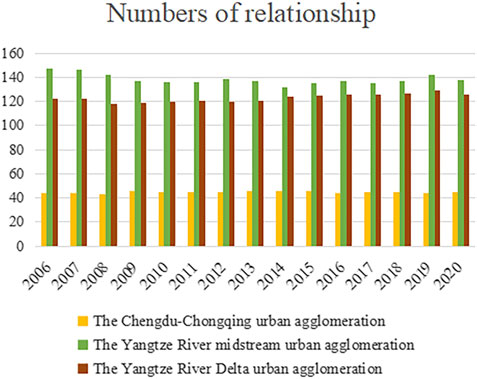
FIGURE 5. Number of relationships among the three major city groups in the Yangtze River economic belt.
UCINET was used to calculate the degree centrality of all cities in the three major urban agglomerations of the Yangtze River Economic Zone, divided into point-out and point-in. Point-in degree is the strength of the ability to receive influence from other cities, and degree centrality potential (divided into point-in and point-out central potentials) measures the overall centrality of the network.
In the Chengdu-Chongqing urban agglomeration, the cities with a higher degree of point-out are Chongqing and Chengdu, and the cities with a higher degree of point-in are Chengdu, Zigong, Nanchong, and Yibin; in the middle reaches of the Yangtze River urban agglomeration, the cities with a higher degree of point-out are Wuhan, Changsha, and Nanchang, and the cities with a higher degree of point-in are Wuhan, Changsha, Jingzhou, Zhuzhou, and Yichun; in the Yangtze River Delta urban agglomeration, the cities with a higher degree of point-out are Shanghai, Nanjing, Wuxi, Suzhou, Hangzhou, Changzhou, and Ningbo, and the cities with a higher degree of point-in are Shanghai, Nanjing, Wuxi, Changzhou, Suzhou, Yangzhou, Taizhou, and Jiaxing. From this, it can be seen that the central cities in the urban agglomeration influence the rest of the cities by radiation, while most of the cities other than the central cities have weak radiation influence and are in the state of being influenced by radiation.
As seen in Table 2, the central point-in potential is highest in the Chengdu-Chongqing urban agglomeration, second highest in the Yangtze River Delta urban agglomeration, and lowest in the Yangtze River midstream urban agglomeration, whereas the central point-out potential is lowest to highest in the Chengdu-Chongqing urban agglomeration, the Yangtze River midstream urban agglomeration, and the Yangtze River Delta urban agglomeration, respectively. The point-in and point-out center potential of the three major urban agglomerations did not change significantly between 2006 and 2020, while the point-in center potential is higher than the point-out center potential. This indicates that most of the cities in the three major urban agglomerations are still under the influence of radiation from regional central cities, among which the Yangtze River Delta urban agglomeration is more mature. In contrast, the Chengdu-Chongqing urban agglomeration and the middle reaches of Yangtze River urban agglomeration have more room for development.
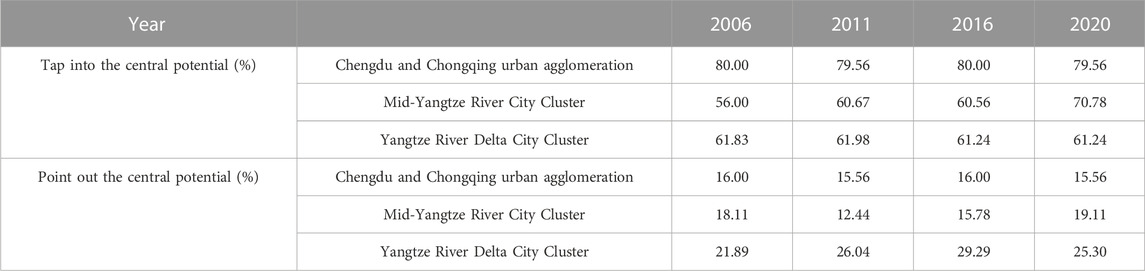
TABLE 2. Degree central potential of the three major urban agglomerations in the Yangtze River Economic Belt.
Furthermore, based on the calculation of betweenness centrality in the three major urban agglomerations of the Yangtze River Economic Belt, we used the natural breakpoint method of ArcGIS software to visualizing them.
In 2006–2020, the betweenness centrality of Chongqing, Chengdu, Zigong, and Nanchong in the Chengdu-Chongqing urban agglomeration decreased, indicating that the control ability of these cities was slowly decreasing, while the betweenness centrality of Luzhou increased, indicating that its economic linkages with other cities in the urban agglomeration gradually increased. The betweenness centrality of the remaining cities remained unchanged. The betweenness centrality of Chengdu, Meishan, and Chongqing forms a high–value area. These cities have a strong control ability and are the “key link” in connecting cities in the city cluster, while the betweenness centrality of Yibin, Zigong, and Nanchong are in the middle, and the betweenness centrality of the other cities forms a low–value area (Figure 6).
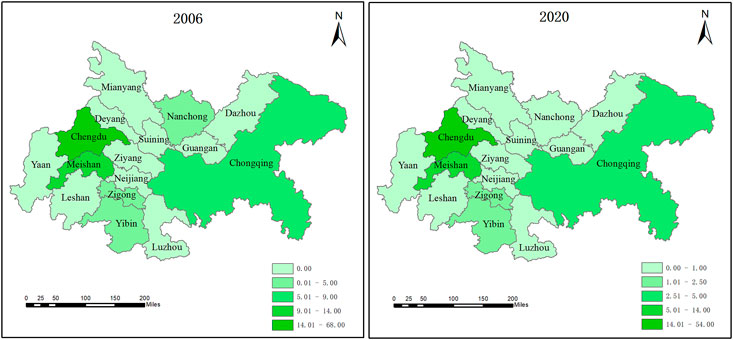
FIGURE 6. The betweenness centrality of 2006 and 2020 in Chengdu-Chongqing urban agglomeration.
The betweenness centrality of cities in the middle reaches of Yangtze River urban agglomeration was relatively more complicated during the period 2006–2020. The betweenness centrality of Wuhan, Xiangyang, Jingmen, Changsha, Hengyang, and Yichun gradually increased over the 15 years, Huangshi, Jingzhou, Xiantao, Zhuzhou, Xiangtan, Yueyang, Loudi, Nanchang, and Pingxiang have declined in betweenness centrality, and the betweenness centrality of Xiaogan, Ezhou, Tianmen, Jingdezhen, Xinyu, Yingtan, and Ji’an has not changed. Notably, the betweenness centrality of Yichang, Qianjiang, and Yiyang showed a rising followed by a falling trend; the betweenness centrality of Huanggang and Xianning fluctuated; the betweenness centrality of Changde fluctuated and was only at a higher position in 2008, 2012 and 2013; the betweenness centrality of Jiujiang gradually rose in 2017, and the betweenness centrality of Fuzhou and Shangrao only increased in 2019–2020. As seen in Figure 7, the northern cities of Wuhan and Xiangyang drive Yichang, Jingmen, and Jingzhou to form a high-value region and achieve block development, while the southern cities of Changsha, Yichun, and Nanchang drive Hengyang and Zhuzhou to form a high-value region and show a strip distribution. The central cities of Yiyang, Yueyang, and Jiujiang serve as bridges to connect the southern and northern cities.
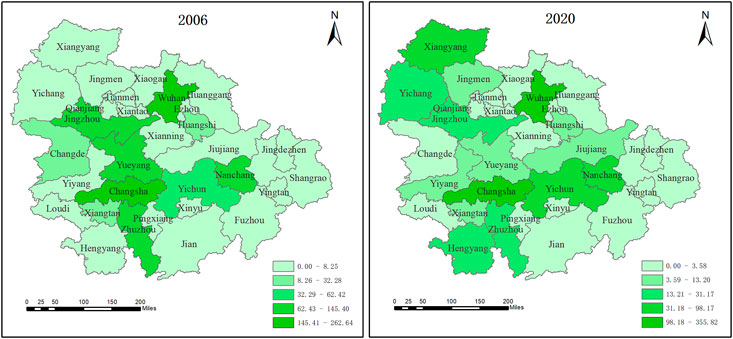
FIGURE 7. The betweenness centrality of 2006 and 2020 in the middle reaches of Yangtze River urban agglomeration.
From 2006–2020, the betweenness centrality of Shanghai, Changzhou, Nantong, Ningbo, Hefei, and Wuhu in the Yangtze River Delta urban agglomeration showed an increasing trend, while that of Wuxi, Suzhou, and Taizhou showed a slowly decreasing trend, that of Maanshan was higher only in 2006–2010 and then decreases to zero. Yangzhou, Zhenjiang, Taizhou, and Huzhou showed fluctuations. Hangzhou showed a decreasing and then increasing trend, while the rest of the city showed no fluctuations. From Figure 8, it can be seen that the betweenness centrality of the Yangtze River Delta urban agglomeration forms the high-value area of Hangzhou, Shanghai, Suzhou, Wuxi, Changzhou, Nanjing, and Hefei and gradually shows a belt-like distribution pattern.
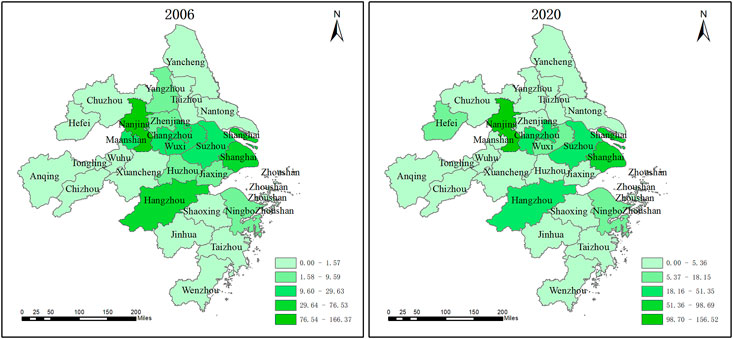
FIGURE 8. The betweenness centrality of 2006 and 2020 in Yangtze River Delta city cluster.
On the basis of theoretical discourse, two types of data are involved: economic linkage and explanatory variables. The first type of data for economic linkage was calculated using a gravity correction model. The second type of explanatory data adopted here was based on city-level factors, which are listed in Table 3. The point-out degree, point-in degree, and betweenness centrality of cities were selected in the network structure characteristics to measure the ability of cities to radiate influence on other cities, receive influence from other cities, and control in urban clusters, respectively. The level of economic development was measured by per capita GDP; cities with higher levels of development have a greater ability to aggregate economic factors. Industrial structure was measured by advanced industrial structure, and the ratio of the value-added of tertiary industry to the value-added of secondary industry reflected the service orientation of the economy. Human capital was measured as the number of college students per 10,000 people, which is the basis of regional innovation and continuously promotes regional economic growth. Factor diffusion and agglomeration were measured by per capita fixed asset investment and total retail sales of social consumer goods, respectively. The smooth flow of factors between cities enhances economic ties.
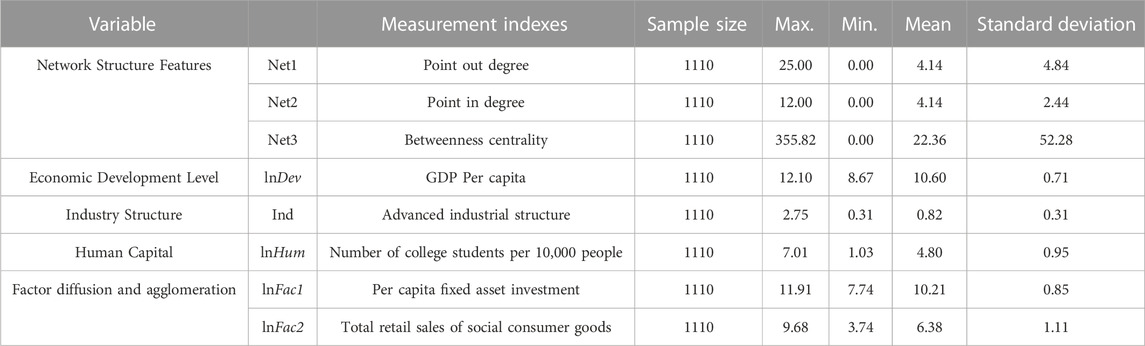
TABLE 3. Descriptive statistics of variables used in regression analysis.
Before testing the SDM, we analyzed the spatial correlations of the economic linkages. Spatial dependence and correlations of the dependent variables were examined to determine whether it was necessary to use a spatial econometric model. Therefore, the global Moran and local Moran indices were introduced to explore the spatial association of economic linkages. The global Moran index was calculated using Stata15, and the nested matrix of economic and geographical distances was used as the spatial weight matrix. Table 4 shows a more significant spatial global autocorrelation in the economic linkage potential values of cities within the three major urban agglomerations in the Yangtze River Economic Belt from 2006 to 2020 at the 99% confidence level. The Moran index and Z-score are positive, so their distributions are spatially significantly correlated.
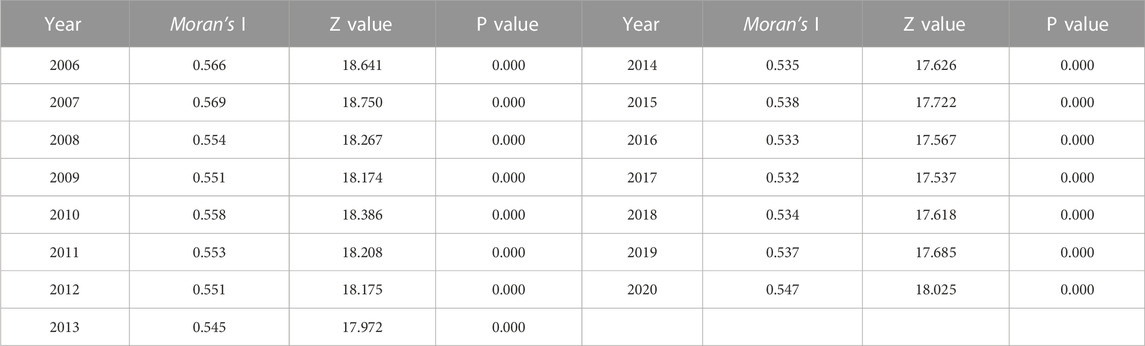
TABLE 4. Analysis results of the Global Moran index.
The global Moran index was decomposed to each city in the three major urban agglomerations in the Yangtze River Economic Belt to obtain the local Moran index. This study used Stata15 to plot the local Moran index scatter plots of the potential values of economic linkages in 2006 (Figure 9) and 2020 (Figure 10). It can be seen that the distribution of economic linkage potentials changed less in 2020 compared to 2006.
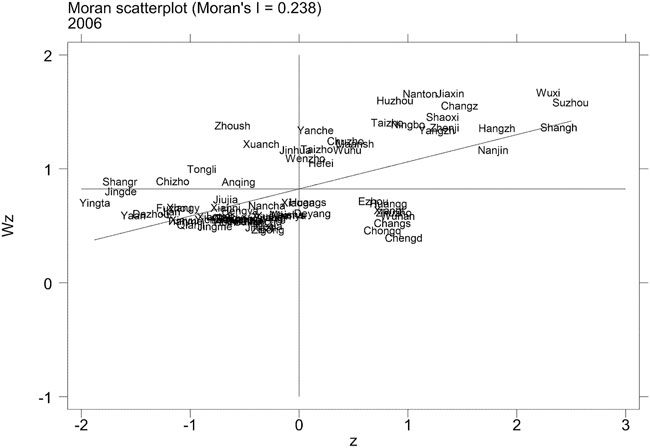
FIGURE 9. Local Moran index scatter plot in 2006.
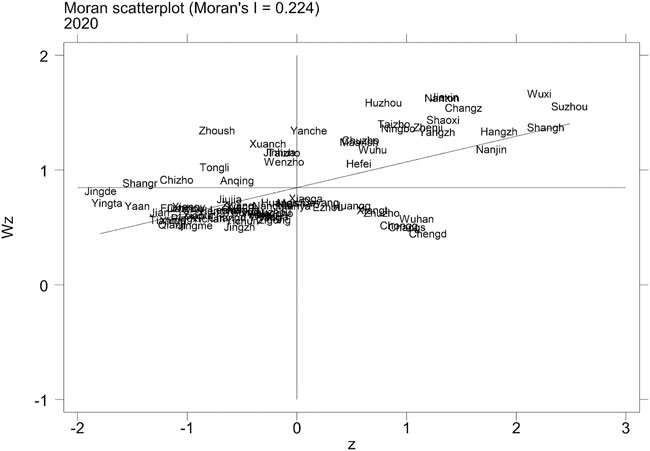
FIGURE 10. Local Moran index scatter plot in 2020.
Most of the economic linkage potential values of cities in the three major urban agglomerations in the Yangtze River Economic Belt in 2020 were distributed in the first and third quadrants, showing the spatial distribution characteristics of high-high and low-low aggregation, indicating a high spatial aggregation of economic linkage potential values. Some cities were scattered in the second quadrant, such as Zhoushan, Xuancheng, Tongling, Anqing, Chizhou, Shangrao, and Jinhua, showing the spatial distribution of low-high aggregation, whereas others were scattered in the fourth quadrant, such as Chongqing, Chengdu, Wuhan, Changsha, Zhuzhou, Xiangtan, Huanggang, Ezhou, and Xiaogan, showing the spatial distribution characteristics of high-low aggregation. The cities distributed in the first quadrant mostly belong to the Yangtze River Delta city cluster, and cities distributed in the second and third quadrants mostly belong to the middle reaches of Yangtze River city cluster. Most cities in the fourth quadrant are the central cities and edge cities of the Chengdu-Chongqing city cluster and the middle reaches of the Yangtze River city cluster.
To avoid spurious regression issues in our empirical analysis, the HT unit root test and VIF test were required for each variable. The results indicate that they were all stationary variables that could be used in an empirical analysis. The LM test and HAUSMAN test were first used to select a suitable spatial econometric model; the test results listed in Table 5. The LM lag test and LM error test results indicate the existence of spatial lag or spatial error effects, and reject the mixed OLS model. In addition, the results of the HAUSMAN rejected the hypothesis of random effects; therefore, a fixed model was chosen. Because the spatial Durbin model may include both spatial error and spatial lag effects, model robustness tests were necessary. This study used the LR and Wald tests to further test whether the spatial Durbin model degenerates into a spatial error and spatial lag model. The LR test compared the spatial Durbin model with the spatial lag and spatial error models, with statistics of 25.89 and 31.85, respectively, with p-values all significant at the 1% level. The results of Wald test also showed that the spatial Durbin model did not degenerate into spatial error and spatial lag models, so the spatial Durbin model was chosen.
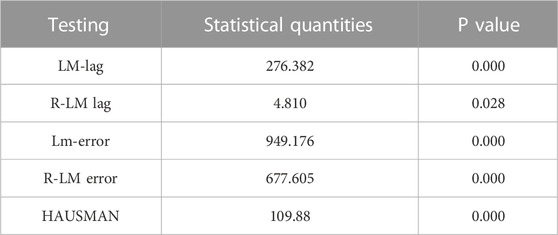
TABLE 5. Results of the LM and HAUSMAN tests.
To reasonably examine the effects of explained variables on economic linkage, three different types of spatial Durbin model were constructed: time-fixed model, space-fixed model, and space-time fixed model. The spatial Durbin time fixed effects model was selected after comparative analysis using the LR test.
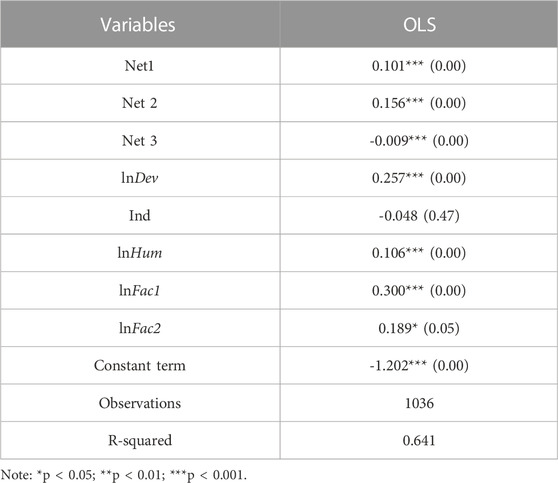
As shown in Table 6, in the traditional OLS model, point-out degree, point-in degree, GDP per capita, number of college students per 10,000 people, fixed asset investment per capita, and total retail sales of consumer goods all significantly and positively affect the value of economic linkage potential at the 1% level. This demonstrates that enhancing the radiating and radiated power of cities helps strengthen economic linkages, while the increase in the level of economic development, the accumulation of human capital, and the enhancement of the diffusion and agglomeration capacity of urban factors also have positive effects on enhancing economic linkages between cities. Moreover, the betweenness centrality is significantly negative at the 1% level, while the increase in urban resource control has a weak negative effect on economic linkage potential, and the advanced industrial structure has a negative but insignificant effect. In the regression results of the spatial Durbin model, the spatial autocorrelation coefficient rho is significantly negative at the 1% level, proving the existence of spatial spillover effects. Compared to the traditional OLS model, only the sign direction of advanced industrial structure and total retail sales of social consumer goods changed in the spatial Durbin model.
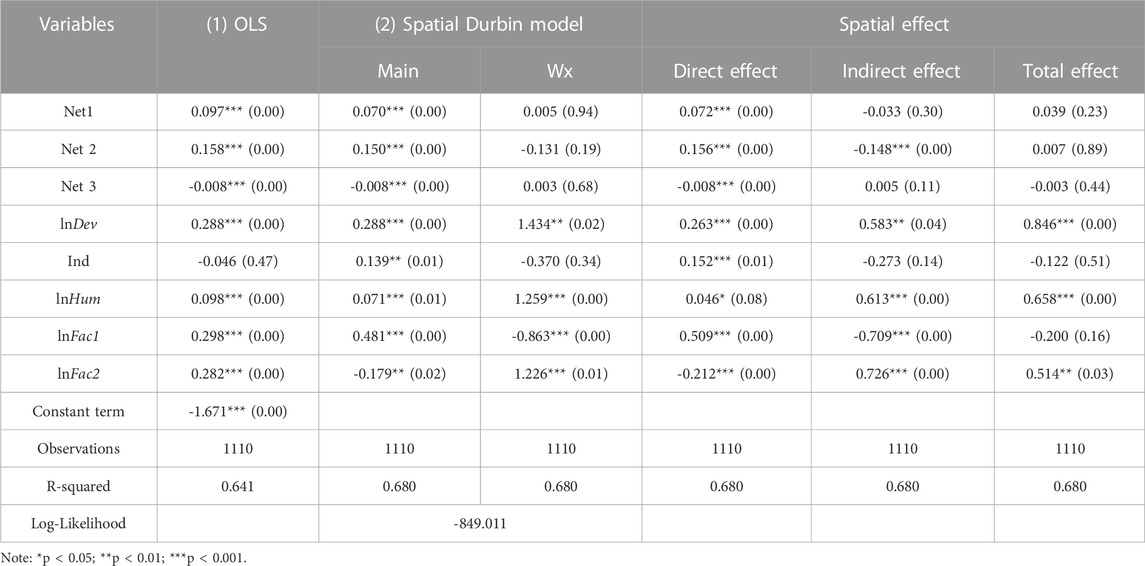
TABLE 6. Estimation results of the spatial Durbin model and spatial effects.
This study decomposed the spillover effects into direct and indirect effects. Direct effects represented local effects that measured the impacts of explanatory factors on economic linkages. Indirect effects represented spillover effects, which measured the impacts of explanatory factors on economic linkages in neighboring areas.
From the network structure characteristics, the coefficients of the direct effects of point-out and point-in were all significantly positive at the 1% level, and the indirect effects were all negative. However, only the point-in was significant at the 1% level, and the total effects were all positive. That is, the increase in city point-out and point-in directly increased the city’s economic linkages with other cities, while the increase in point-in of neighboring cities had a negative spillover effect on the city’s economic linkages. Most of the cities in the three major urban agglomerations in the Yangtze River Economic Belt had higher point-in than point-out degrees. They were in a period of radiation influence by the central cities, with the surrounding non-central cities in a situation of seizing economic resources. Meanwhile, the direct effect of intermediate centrality was significantly negative at the 1% level, the indirect effect was positive, and the total effect was negative, all of which were insignificant, indicating that the centrality index had no significant effect on economic ties because the cities with higher centrality were mainly a few central cities in the three major urban agglomerations in the Yangtze River Economic Belt. Non-center cities rely heavily on the center city to develop connectivity to regions outside the city cluster. Such a hub-and-spoke system increases the total connectivity of non-center cities but reduces their direct connectivity to cities outside the city cluster (Wang K. et al., 2020).
The direct, indirect and total effects of GDP per capita on the economic development level were all significantly positive at 1% level. The indirect effect was larger than the direct effect. Cities with higher economic development levels had positive spillover effects on neighboring cities in addition to enhancing their economic ties with the outside world, indicating that cities with higher economic development levels have good comparative advantages. Their ability to radiate influence on neighboring cities was stronger, so they could establish closer economic ties with cities in urban agglomeration.
Moreover, the direct effect of the advanced industrial structure was significantly positive at the 1% level, while the indirect and total effects were negative but not significant, indicating that the higher the degree of the advanced industrial structure of a city, the closer its economic ties with neighboring cities, and the advanced industrial structure releases structural dividends and promotes industrial integration among cities. Industrial functional organization, structural upgrading, and spatial transfer are important driving forces for the growth of city clusters. Promoting the transformation and upgrading of the industrial structure is the core of economic development strategies and industrial policy (Wang C. et al., 2022).
From the perspective of human capital, the direct, indirect and total effects were significantly positive at the 10%, 1%, and 1% levels, respectively. The indirect effect was significantly larger than the direct effect. The knowledge spillover brought about by human capital significantly and positively affects neighboring regional cities and strengthens the economic linkage exchange and cooperation between cities while promoting regional economic growth. Knowledge spillovers and human capital likely affect the total factor productivity (Hu, 2021).
Finally, in the agglomeration and diffusion capacity of factors, the direct effect of per capita fixed asset investment was significantly positive at the 1% level, the indirect effect was significantly negative at the 1% level, and the total effect was negative, but not significant. This indicates that the increase in the city’s own per capita fixed asset investment intensifies the agglomeration of resources, while the negative spatial spillover effect indicates that the increase in per capita fixed assets in neighboring cities attracts the agglomeration of factors and reduces the economic linkage of the city. In addition, the direct effect of total retail sales of consumer goods was significantly negative at the 1% level, while the indirect and total effects were significantly positive at the 1% and 5% levels, respectively. The indirect effect was larger than the direct effect, indicating that the agglomeration and diffusion of factors have positive effects on strengthening inter-city economic ties.
This study tested the robustness of the model by replacing the spatial weight matrices. As shown in Table 7, significant changes in the direction of the sign of the spatial effects of the point entry degree and advanced industrial structure occurred, while the sign direction and significance of the direct, indirect, and total effects of the remaining variables did not change significantly. Because the nested matrix is more stringent than the geographic distance matrix, the robustness of the previous findings was verified.
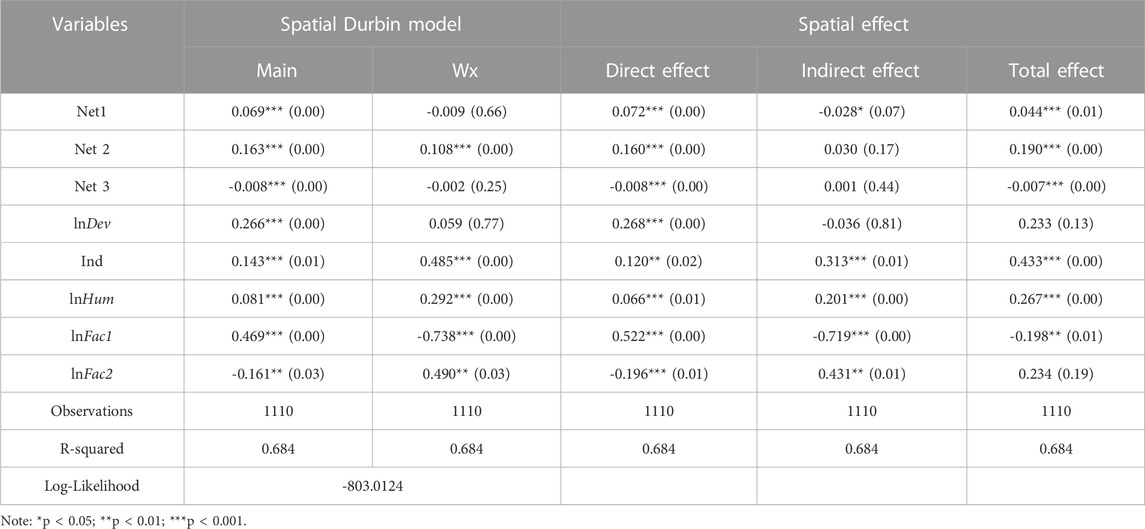
TABLE 7. Estimation results of the replaced spatial weight matrices.
Although panel data can solve the problem of omitted variables to some extent, if the regression model contains endogenous explanatory variables, robustness tests considering the endogeneity of the model are still required, and the explanatory variables and the explained variables here may have the problem of mutual causality. This study adopted a one-period lagged regression of the explanatory variables to eliminate the causal relationship between the explanatory and explained variables and to prove the robustness of the estimation results. The details are presented in Appendix B.
This study calculated the directed economic linkages through a modified gravity model and portrayed the economic linkage network using network density and centrality analysis. We took the three urban agglomerations in the Yangtze River Economic Belt as an example to examine the influence of network structure characteristics, economic development level, industrial structure, human capital, factor diffusion, and agglomeration. This study revealed useful and encouraging findings. First, from the perspective of economic ties within urban agglomerations, the overall economic ties within the three major city clusters of the Yangtze River Economic Belt showed an upward trend each year. The intensity of economic linkages of the Yangtze River Delta city cluster was greater than that of the Chengdu-Chongqing city cluster, and the middle reaches of Yangtze River city cluster. The Yangtze River Delta city cluster had the strongest economic and closer ties, forming multi-center city radiation and regional sub-network response pattern. While the intensity of economic ties between the Chengdu-Chongqing urban agglomeration and the middle reaches of Yangtze River urban agglomeration was relatively sparse compared to the Yangtze River Delta urban agglomeration, the Chengdu-Chongqing urban agglomeration has formed a spatial network pattern with Chengdu and Chongqing as the two poles. The city cluster in the middle reaches of the Yangtze River has formed a point-axis development pattern of Wuhan, Changsha, and Nanchang. A stable and continuous economic connection was formed among the central cities of the Yangtze River Delta city cluster, and the development of the remaining cities was driven by radiation.
Second, in terms of the network structure of urban agglomerations, the network density of the three major urban agglomerations in the Yangtze River Economic Belt developed relatively smoothly from 2006–2020. Owing to the influence of cities, most cities were still in a period of radiation influenced by the central cities. Chengdu and Chongqing had the highest betweenness centrality in the Chengdu-Chongqing urban agglomeration, which attracted the surrounding talents and capital. The northern part of the middle reaches of the Yangtze River urban agglomeration formed the block development of high-value areas with betweenness centrality and the strip distribution in the south, while the central cities in the Yangtze River Delta urban agglomeration played a relatively weaker role and formed a strip distribution of high-value areas.
Third, in the factors affecting the economic linkages of urban agglomerations, the increase in the point-out and point-in degrees of cities directly increased the economic linkages with other cities. Furthermore, the improvement in the level of economic development directly enhanced the radiation-driving ability of cities and had a positive spillover effect on neighboring cities. An advanced industrial structure positively impacted the formation of industrial links between cities and the outside world. Specifically, the improvement and upgrading of industrial structures can deepen exchange and cooperation between cities and promote the formation of effective industrial links between regions. In addition, human capital accelerates intercity factor transfers and generates significant knowledge spillovers to neighboring cities. On the one hand, cities’ factor diffusion and agglomeration ability will promote the flow of economic development factors between cities. On the other hand, neighboring cities’ increased factor agglomeration and diffusion ability will have a “containment” effect, such as the “siphon effect” of the central cities of urban clusters.
Based on the above analysis, the following recommendations are proposed for developing economic linkage. First, the three major city clusters should implement differentiated development strategies, breakthrough administrative barriers, and spatial distance restrictions. Specifically, the Yangtze River Delta city cluster should further focus on cultivating multi-center node cities within the city cluster based on its geographical location and advantageous development of resource endowment and play the role of a sub-network within the city cluster. We suggest that the Chengdu-Chongqing city cluster should further extend the radiation range of Chengdu and Chongqing poles based on the original economic network pattern to realize the circular flow of economic factors within the city cluster, while preventing the formation of the two poles between “central collapse.” The city cluster in the middle reaches of the Yangtze River should give full play to the radiation-driven role of the central cities of Wuhan, Changsha, and Nanchang, promote the agglomeration of economic factors in a hierarchy, and realize the penetration of economic advantages across the hierarchy.
Second, this study empirically outlined the overall structure of the economic network of three major city clusters and made some suggestions. For example, city clusters should actively function as network clusters of existing economic linkages while improving the uneven development of network structures and enhancing the synergy of the overall network. Central cities should expand the radiation diffusion and demonstration drive effect, node cities should strive to play a bridge role, and edge cities should be integrated into the economic sub-network. As the structure of the economic linkage network within the three major urban agglomerations in the Yangtze River Economic Belt is different, the urban agglomerations should also focus on the development of small- and medium-sized cities and peripheral cities while playing the role of regional central cities as radiation drivers, such as Deyang in the Chengdu-Chongqing city group; Zhuzhou, Huanggang, Huangshi, and Ezhou in the middle reaches of the Yangtze River city group; and Zhoushan, Tongling, Anqing, and Xuancheng in the Yangtze River Delta city group. It should nurture functional small- and medium-sized cities with special features, grow counties’ economic development, and increase their status or power in the economic network.
Third, it is necessary to create a platform to strengthen economic ties between cities by increasing the level of economic development. In terms of industrial policy, it is important to focus on enhancing the advanced degree of industrial structure, constructing inter-city industrial chains by category, exploring new modes of industrial transfer cooperation, and actively encouraging the Yangtze River Delta city cluster to build industrial parks in Chengdu-Chongqing, and the middle reaches of the Yangtze River city cluster to realize benefit sharing. Meanwhile, gives full play to the knowledge spillover effect of human capital to strengthen economic ties within urban agglomerations while improving their innovation capacities. Finally, cities should actively leverage their urban location advantage to accelerate the diffusion and agglomeration of factors, while avoiding the “siphon” effect of central cities such as Chengdu, Chongqing, Wuhan, Changsha, Nanchang, Shanghai, Nanjing, Hangzhou, etc., to reduce the adverse competition among cities for resource factors and form an orderly and stable interactive development situation.
This study analyses the economic linkage network structures of the three major urban agglomerations in the Yangtze River Economic Belt, and explores the relevant spillover effects of network structure characteristics, economic development levels and other influencing factors on economic linkages. But there are some limitations requiring further research. First, measuring city strength through population and GDP and built-up area is not comprehensive. Future research can correct the gravity model by evaluating the comprehensive strength of the city using a multi-indicator evaluation system (Zhang et al., 2022). Second, in the process of measuring the structural characteristics of urban networks, betweenness centrality cannot apply to large networks because of the high time complexity (Zhao et al., 2022). Therefore, future research could look for more effective ways to identify influential nodes in networks of economic linkages. Furthermore, the economic linkage of cities that do not participate in city cluster planning should be further discussed in depth. Future research could compare and contrast the impact of participating in urban cluster planning on urban economic linkage.
The original contributions presented in the study are included in the article/Supplementary Material, further inquiries can be directed to the corresponding author.
All authors listed have made a substantial, direct, and intellectual contribution to the work and approved it for publication. The first draft of the manuscript was written by WYM, XYZ and SHS. All authors commented on previous version of the manuscript.
The research was financially supported by National Social Science Foundation of China (No. 19ZDA089) and National Social Science Foundation of China (No. 19BMZ085) and Project of The Ministry of Education of China (No. 16YJC850014).
We would like to thank Editage (www.editage.cn) for English language editing.
The authors declare that the research was conducted in the absence of any commercial or financial relationships that could be construed as a potential conflict of interest.
All claims expressed in this article are solely those of the authors and do not necessarily represent those of their affiliated organizations, or those of the publisher, the editors and the reviewers. Any product that may be evaluated in this article, or claim that may be made by its manufacturer, is not guaranteed or endorsed by the publisher.
The Supplementary Material for this article can be found online at: https://www.frontiersin.org/articles/10.3389/fenvs.2022.1073395/full#supplementary-material
Aydın, U., and Ülengin, B. (2022). Is ignoring the zero market a panacea? A comparison of gravity models for Turkish international air cargo. Res. Transp. Bus. Manag. 45, 100870. doi:10.1016/j.rtbm.2022.100870
Camacho, D., Panizo-Lledot, Á., Bello-Orgaz, G., Gonzalez-Pardo, A., and Cambria, E. (2020). The four dimensions of social network analysis: An overview of research methods, applications, and software tools. Inf. Fusion 63, 88–120. doi:10.1016/j.inffus.2020.05.009
Cao, X., Ouyang, S., Yang, W., Luo, Y., Li, B., and Liu, D. (2019). Transport accessibility and spatial connections of cities in the guangdong-Hong Kong-Macao greater bay area. Chin. Geogr. Sci. 29 (5), 820–833. doi:10.1007/s11769-019-1034-2
Chen, Y., and Jiang, A. (2022). Spatial characteristics and complexity of the urban economic network structure based on the secure Internet of Things. Sustain. Comput-Infor. 35, 100729. doi:10.1016/j.suscom.2022.100729
Chong, Z., and Pan, S. (2020). Understanding the structure and determinants of city network through intra-firm service relationships: The case of Guangdong-Hong Kong-Macao Greater Bay Area. Cities 103, 102738. doi:10.1016/j.cities.2020.102738
Dong, J., and Li, C. (2022). Structure characteristics and influencing factors of China's carbon emission spatial correlation network: A study based on the dimension of urban agglomerations. Sci. Total. Environ. 853, 158613. doi:10.1016/j.scitotenv.2022.158613
Fan, J., and Xiao, Z. (2021). Analysis of spatial correlation network of China’s green innovation. J. Clean. Prod. 299, 126815. doi:10.1016/j.jclepro.2021.126815
Hsu, W.-T., Holmes, T. J., and Morgan, F. (2014). Optimal city hierarchy: A dynamic programming approach to central place theory. J. Econ. Theory. 154, 245–273. doi:10.1016/j.jet.2014.09.018
Hu, G.-G. (2021). Is knowledge spillover from human capital investment a catalyst for technological innovation? The curious case of fourth industrial revolution in BRICS economies. Technol. Forecast. Soc. 162, 120327. doi:10.1016/j.techfore.2020.120327
Huo, T., Cao, R., Xia, N., Hu, X., Cai, W., and Liu, B. (2022). Spatial correlation network structure of China's building carbon emissions and its driving factors: A social network analysis method. J. Environ. Manage. 320, 115808. doi:10.1016/j.jenvman.2022.115808
Jinliao, H., Xianpeng, W., and Gang, Z. (2022). Creative city networks: A social network analysis of a virtual community of designers in China. Cities 123, 103578. doi:10.1016/j.cities.2022.103578
Kumari, M., Sarma, K., and Sharma, R. (2019). Using Moran's I and GIS to study the spatial pattern of land surface temperature in relation to land use/cover around a thermal power plant in Singrauli district, Madhya Pradesh, India. Remote Sens. Appl. Soc. Environ. 15, 100239. doi:10.1016/j.rsase.2019.100239
Li, S., and Xiao, F. (2021). The identification of crucial spreaders in complex networks by effective gravity model. Inf. Sci. 578, 725–749. doi:10.1016/j.ins.2021.08.026
Li, Y., Zhu, Z., Guan, Y., and Kang, Y. (2022). Research on the structural features and influence mechanism of the green ICT transnational cooperation network. Econ. Anal. Policy. 75, 734–749. doi:10.1016/j.eap.2022.07.003
Lu, H., Zhang, C., Jiao, L., Wei, Y., and Zhang, Y. (2022). Analysis on the spatial-temporal evolution of urban agglomeration resilience: A case study in chengdu-chongqing urban agglomeration, China. Int. J. Disast. Risk. Re. 79, 103167. doi:10.1016/j.ijdrr.2022.103167
Ma, L., Xiang, L., Wang, C., Chen, N., and Wang, W. (2022). Spatiotemporal evolution of urban carbon balance and its response to new-type urbanization: A case of the middle reaches of the Yangtze River urban agglomerations, China. J. Clean. Prod. 380, 135122. doi:10.1016/j.jclepro.2022.135122
Mao, X., Luan, X., and Huang, X. (2020). How does inter-sectoral linkage affect the environmental performance of a transitioning region: Evidence from the Yangtze River Economic Belt, China. Resour. Environ. Sustain. 1, 100002. doi:10.1016/j.resenv.2020.100002
Martinus, K., and Sigler, T. J. (2017). Global city clusters: Theorizing spatial and non-spatial proximity in inter-urban firm networks. Reg. Stud. 1-13, 1–13. doi:10.1080/00343404.2017.1314457
Reza HabibAgahi, M., Agha Mohammad Ali Kermani, M., and Maghsoudi, M. (2022). On the Co-authorship network analysis in the process mining research community: A social network analysis perspective. Expert. Syst. Appl. 206, 117853. doi:10.1016/j.eswa.2022.117853
Ruan, W.-Q., and Zhang, S.-N. (2021). Can tourism information flow enhance regional tourism economic linkages? J. Hosp. Tour. Manag. 49, 614–623. doi:10.1016/j.jhtm.2021.11.012
SASSEN, S. (2010). Global inter-city networks and commodity chains: Any intersections? Glob. Netw. 10, 150–163. doi:10.1111/j.1471-0374.2010.00279.x
Wang, C., Miao, W., and Lu, M. (2022). Evolution of the Chinese industrial structure: A social network perspective. Technol. Forecast. Soc. 184, 121972. doi:10.1016/j.techfore.2022.121972
Wang, K., Jiang, C., Ng, A. K. Y., and Zhu, Z. (2020). Air and rail connectivity patterns of major city clusters in China. Transp. Res. A-Pol. 139, 35–53. doi:10.1016/j.tra.2020.07.002
Wang, Y., Duan, X., Wang, L., and Zou, H. (2022). Spatial temporal patterns and driving factors of industrial pollution and structures in the Yangtze River Economic Belt. Chemosphere 303 (2), 134996. doi:10.1016/j.chemosphere.2022.134996
Wang, Z., Liu, Q., Xu, J., and Fujiki, Y. (2020). Evolution characteristics of the spatial network structure of tourism efficiency in China: A province-level analysis. J. Destin. Mark. Manage. 18, 100509. doi:10.1016/j.jdmm.2020.100509
Wu, Q., Fan, J., Zhang, H., and Ye, Y. (2017). The spatial impacts model of trans-strait fixed links: A case study of the pearl River Delta, China. J. Transp. Geogr. 63, 30–39. doi:10.1016/j.jtrangeo.2017.07.003
Yang, T., Zhou, K., and Ding, T. (2022). Air pollution impacts on public health: Evidence from 110 cities in Yangtze River Economic belt of China. Sci. Total. Environ. 851 (1), 158125. doi:10.1016/j.scitotenv.2022.158125
Ye, X., Li, S., and Peng, Q. (2021). Measuring interaction among cities in China: A geographical awareness approach with social media data. Cities 109, 103041. doi:10.1016/j.cities.2020.103041
Zhang, W., Zhuang, X., Lu, Y., and Wang, J. (2020). Spatial linkage of volatility spillovers and its explanation across G20 stock markets: A network framework. Int. Rev. Financ. Anal. 71, 101454. doi:10.1016/j.irfa.2020.101454
Zhang, Y., Zhang, Y., Zhang, H., and Zhang, Y. (2022). Evaluation on new first-tier smart cities in China based on entropy method and TOPSIS. Ecol. Indic. 145, 109616. doi:10.1016/j.ecolind.2022.109616
Zhao, J., Wen, T., Jahanshahi, H., and Cheong, K. H. (2022). The random walk-based gravity model to identify influential nodes in complex networks. Inf. Sci. 609, 1706–1720. doi:10.1016/j.ins.2022.07.084
Zhu, Z., Zheng, Y., and Xiang, P. (2023). Deciphering the spatial and temporal evolution of urban anthropogenic resilience within the Yangtze River Delta urban agglomeration. Sustain. Cities. Soc. 88, 104274. doi:10.1016/j.scs.2022.104274

Keywords: economic linkages, network structure, spatial-temporal differentiation, driving factors, urban cluster
Citation: Zhang X, Ma W and Sheng S (2023) Understanding the structure and determinants of economic linkage network: The case of three major city clusters in Yangtze River Economic belt. Front. Environ. Sci. 10:1073395. doi: 10.3389/fenvs.2022.1073395
Received: 18 October 2022; Accepted: 29 December 2022;
Published: 13 January 2023.
Edited by:
Qaiser Abbas, Ghazi University, PakistanReviewed by:
Shujahat Haider Hashmi, Bahria University, PakistanCopyright © 2023 Zhang, Ma and Sheng. This is an open-access article distributed under the terms of the Creative Commons Attribution License (CC BY). The use, distribution or reproduction in other forums is permitted, provided the original author(s) and the copyright owner(s) are credited and that the original publication in this journal is cited, in accordance with accepted academic practice. No use, distribution or reproduction is permitted which does not comply with these terms.
*Correspondence: Weiyan Ma, Y3RndW13eUAxNjMuY29t
Disclaimer: All claims expressed in this article are solely those of the authors and do not necessarily represent those of their affiliated organizations, or those of the publisher, the editors and the reviewers. Any product that may be evaluated in this article or claim that may be made by its manufacturer is not guaranteed or endorsed by the publisher.
Research integrity at Frontiers
Learn more about the work of our research integrity team to safeguard the quality of each article we publish.