 Xian Zhang
 Shengbo Xie
 Yingjun Pang
94% of researchers rate our articles as excellent or good
Learn more about the work of our research integrity team to safeguard the quality of each article we publish.
Find out more
ORIGINAL RESEARCH article
Front. Environ. Sci., 04 January 2023
Sec. Drylands
Volume 10 - 2022 | https://doi.org/10.3389/fenvs.2022.1073257
The intersection angles of the railway trend and wind direction are different in practical engineering, resulting in different sand hazard intensities. This research explores the characteristics of the wind-sand flow field, wind speed change, and sand accumulation near railway embankments with different wind angles to reveal the formation mechanism of sand hazards. A numerical simulation of the wind-sand flow field around embankments under wind angles of 15°, 30°, 45°, 60°, 75°, and 90° with different friction wind speeds is conducted on the basis of the Euler two-phase flow model; moreover, the variation law of wind speed and the characteristics of sand accumulation distribution near the railway are discussed. Results indicate that when the wind-sand flow moves to the embankment, it is obstructed and forms different velocity zones. The deceleration zone on both sides of the embankment and the acceleration zone above the embankment increase remarkably with the increase in wind angle. When the friction wind speed is constant, the greater the wind angle, the greater the variation of wind speed near the surface around the embankment, which is more evident on the leeward side of the embankment. The sand accumulation amount on both sides increases with the increase in the wind angle. Under a wind angle of 30°, almost no sand accumulated on the leeward side slope. With the increase in friction wind velocity, the sand accumulation amount on the windward side of the other embankment decreased except for the embankment with a wind angle of 90°, and that on the leeward side of the other embankments decreased except for the embankment with a wind angle of 15°. These results provide a theoretical basis for the route survey and design of the railways in blown sand areas and the optimization of prevention and control measures.
Blown sand environment, terrain, vegetation, railway design, and other factors along the railway jointly affect the railway sand hazards. The survey and design of traffic lines in sandy areas are important factors to ensure safe operation (Duan et al., 2022). With the development and construction of transportation in arid regions, an increasing number of railways cross the windy-sandy areas and are threatened by wind-blown sand at different degrees along the lines. The problem of railway wind-sand disasters has become serious (Zhang et al., 2014; Xie et al., 2017). To reduce the dangers of blown-sand activities to traffic lines, many researchers have conducted substantial research on wind energy environments along the railway, characteristics of wind-sand flow structure, and control measures (Li et al., 2011a; Cheng et al., 2014; Yao et al., 2015; Cheng et al., 2016; Yu et al., 2020). Many studies have also been conducted on the route survey and design of the cross-section of embankments to explore the laws of wind-blown sand movement around the embankment and reduce blown-sand hazards (Sun et al., 2018; Yu et al., 2019). Among them, the different angles between the route direction and the wind direction are the important parameters for studying wind-blown sand movement near the traffic line (Wang et al., 1997; Li et al., 2011). Theoretically, the route selection shall be parallel to or form a small angle with the dominant wind direction as far as possible (Feng et al., 2012). However, in consideration of multiple factors, the angle between wind direction and the route direction forms different angles in practical engineering (Li et al., 2011a; Bao et al., 2017). Even if the wind angle is small, it will still cause sand hazard to the railway (Xie et al., 2020a and 2021). And the wind angle is closely related to the thickness of accumulative sand along the lines (Chen et al., 2020). At present, relevant research in China and abroad mainly show the following aspects: the qualitative evaluation of embankment sand hazard under different wind angles (Li et al., 2005), law of sand sediment on embankment under crosswind (Cui et al., 2017), conveying sand performance of embankment with different wind angles (Ma et al., 2008), influence of wind direction on embankment sediment transport (Wu et al., 2008), flow field characteristics of opencut tunnel under different wind angles (Yan et al., 2019). Most of these studies focus on the qualitative study of sand accumulation around the line under different wind angles through wind tunnel tests and field observations. Few studies have explored the characteristics of the flow field and wind-sand flow movement under different wind angles through numerical simulation to reveal the mechanism of sand damage. Moreover, systematic research on the characteristics of wind-sand flow field around the embankment under different wind angles has yet to be reported. Therefore, by establishing embankment models for numerical simulation, this research attempted to explore and analyze the influence of the angle between railway trend and wind direction on the flow field around the embankment, revealed the formation mechanism of sand hazards in railway embankment under different angles, and provided theoretical basis for railway embankment engineering design and wind-sand disaster prevention.
In this research, the Euler two-phase flow model was used to study the near-surface wind-sand movement around the embankment with different wind angles. In this model, the gas and solid phases are regarded as continuous media that exist together and permeate each other, and the sum of their volume fractions is 1, that is,
Mass Conservation Equation:
Momentum Conversation Equation:
where αg, αs are the volume fraction of gas phase and sand phase, respectively; t is the time; ρg, ρs are the density of gas phase and sand phase, respectively; νg, νs are the velocity vector of gas phase and sand phase, respectively; Ug, Us are the velocity of gas phase and sand phase, respectively; τg, τs are the surface stress tensor of gas phase and sand phase, respectively; p is the same pressure shared by two phases; ps is the sand phase pressure; g is the gravitational acceleration; Kgs = Ksg, which is the momentum exchange coefficient of gas phase and solid phase, respectively.
This study used the standard k-ε turbulence model. Air was defined as an incompressible flow without heat exchange. Based on multiphase fluid theory, the gas phase was the main phase, and the sand phase was the dilute phase. The volume fraction of the sand phase was 0.02 (Wang et al., 2020). The turbulence was assumed to be fully developed.
Turbulent Kinetic Energy Equation:
Turbulent Dissipation Rate Equation:
where ui is the component of velocity along the i direction; t is the time; ρ is the air density; k is the turbulent kinetic energy; ε is the turbulent dissipation rate; μ is the dynamic viscosity; μt is turbulent viscosity; Gk is the turbulent kinetic energy generated by the average velocity gradient; σk, σε are the Trump constant corresponding to the turbulent kinetic energy and dissipation rate, σk = 1.0, σε = 1.3; C1ε and C2ε are the constants, C1ε = 1.44, C2ε = 1.92.
ICEM CFD in ANSYS Workbench was used to establish a three-dimensional model and meshing. The length of the calculation domain was 250 m, the width was 15 m, and the height was 30 m. The embankment model is a class-Ⅰ double-track railway based on the Design Specifications for Railway Subgrade (TB10001-2016, China), which conforms to the relevant provisions of embankment design in blown-sand areas. The embankment was 8 m at the top width and 5 m in height. The slope ratio was 1:1.75 (slope angle was 30°). The embankment model was set 40 m away from the entrance to develop the wind-sand flow fully. The direction of the wind-sand flow at inlet was constant, and the embankment trend was changed, so that the angle between them changed. Six angle between the model and the wind direction (15°, 30°, 45°, 60°, 75°, and 90°) were selected. To improve the computation efficiency and ensure the accuracy of numerical simulation, the numerical model used an unstructured mesh to meet the flow domain. The mesh type was Tetra/Mixed, and Robust (octree) was used for the turbulent boundary layer. The wind-sand flow field around the railway embankment was simulated, which was closely related to the wind speed. Therefore, take the wind speed of section x = 40 m for independence verification, and compare the wind speed at three points (40, 7.5, 5), (40, 7.5, 15), and (40, 7.5, 25). Take the grid number of 0.57, 0.73, 1.13, 1.53, and 3.8 million for grid independent verification, and take 0.01, 0.025, 0.05, 0.1, and 0.2 s for step time independence verification. It can be seen from Figure 1 that with the increase of the grid number, the wind speed of the three points changed little, indicating that the grid number had little impact on the calculation results. The wind speeds were basically unchanged under different time steps. Considering the calculation accuracy and calculation period, the number of grids in the calculation was 1.13 million, and the time step was 0.1 s. The grids on the ground and embankment are relatively dense, and the rest is relatively sparse. The average grid quality was about 0.85. The average grid aspect ratio and average orthogonal quality coefficient were greater than 0.85 and close to 1, indicating that the grid quality was good. The model dimension and model mesh are shown in Figure 2.
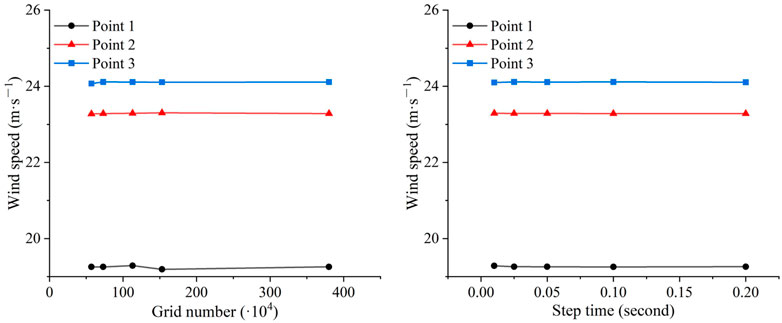
FIGURE 1. The grid independence test and time step test.
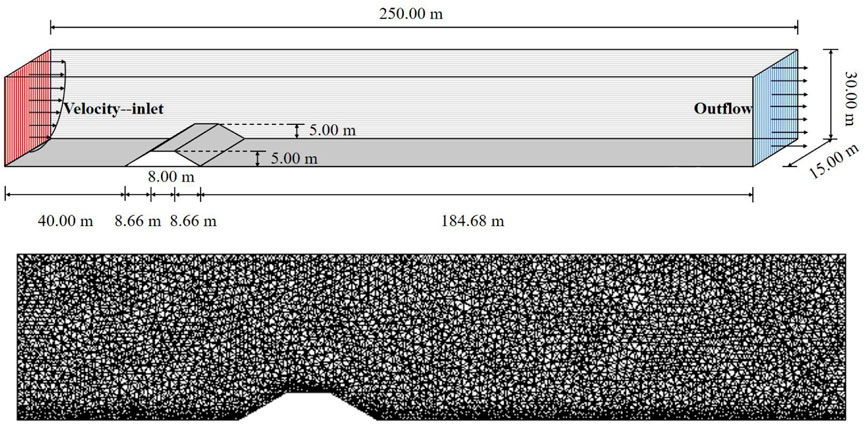
FIGURE 2. The simulation domain and model mesh.
The left side of the model was defined as Velocity-inlet. The right side of the model was the outlet, which adopted the fully developed outflow boundary condition (Outflow). The top and both sides of the boundary were set as Symmetry, and the ground and the embankment were defined as nonslip walls. The wind speed at the inlet adopted the logarithmic equation of wind speed profile by user-defined operations:
where μ is the horizontal wind speed at height z; k is the Karman constant (0.4); μ* is friction velocity; z0 is the bed roughness. The friction velocities of 0.43 m s−1 and 0.53 m s−1 are selected for numerical simulation, and the corresponding bed roughness is 0.0013 and 0.0011 mm, respectively (Xie et al., 2020b).
The Euler two-fluid model was used to simulate the unsteady wind-sand flow. In the simulation process, the inlet turbulence intensity was set to 5%. The spatial discretization used the second-order upwind method. The Phase Coupled SIMPLE was used to solve the model. The time step was set to 0.1 s. Sand diameter is generally 0.075–0.25 mm in the wind-sand flow (Li et al., 2016). Therefore, the parameters in Fluent were as follows: sand particle size ds = 10−4 m, sand density ρs = 2650 kg m−3, sand viscosity μs = 0.047 kg (m s)−1 (Wang et al., 2020), air density ρg = 1.225 kg m−3, and air viscosity μg = 1.789 × 10⁻⁵ Pa s. The gas pressure was set as standard atmospheric pressure. Granular was selected for collision viscosity, Schaeffer was selected for frictional viscosity, and the packing limiting was 0.63. Considering the force between the gas phase and the solid phase, the lift coefficient was Saffman-mei, and the drag coefficient was the Syamlal-obrien.
To ensure the reliability of the numerical simulation results, wind tunnel experiments were conducted to determine the flow field characteristics under a wind speed of 12 m s−1 with a wind angle of 90°. The layout of wind tunnel experiment was shown in Figure 3. The field mobile wind tunnel of the Key Laboratory for Desert and Desertification, Chinese Academy of Sciences (CAS) was used for experiments, and the test section had dimensions of 6 × 0.63 × 0.63 m. The boundary layer thickness at the bottom is 12–15 cm. The embankment model of the wind tunnel experiment was created in the proportion of 1:100. The blockage ratios was 7.94%. The numerical simulation used the same calculation domain and initial conditions as the wind tunnel experiment. This experiment basically meeted the similarity of flow state and wind speed profile distribution, and conformed to the similarity principle. As shown in Figure 4, a comparison of the wind speed profiles at the entrance, windward slope foot, embankment top center, and leeward slope foot in wind tunnel experiment and numerical simulation reveals that the two results were consistent, verifying the rationality of the flow field setting in the numerical simulation. Then, the setting was used to calculate the flow field around the embankment with different wind angles.
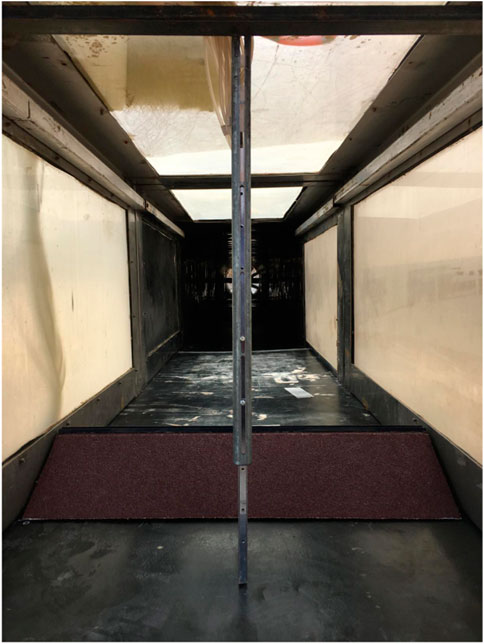
FIGURE 3. Layout photograph of the wind tunnel experiment.
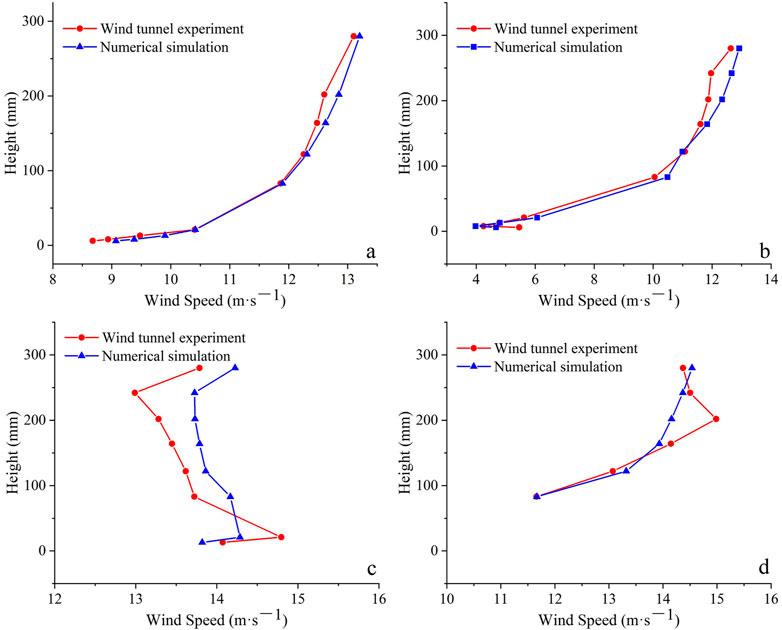
FIGURE 4. Comparison of velocity profile between wind tunnel experiment and numerical simulation [(A). The entrance; (B). The windward slope foot; (C). The embankment top center; (D). The leeward slope foot].
Figure 5 shows the velocity field nephograms around the embankments at various wind angles under different friction velocities. They were selected to analyze the flow field variations with calculation time t = 20 s and the section y = 7.5 m. The wind-sand flow was blocked when crossing the embankments, destroying the natural balanced conditions. Different wind speed zones, which could be divided into windward slope deceleration zone, speed lifting zone, embankment high-speed zone, and leeward slope deceleration zone were formed around the embankments (Zhang et al., 2010; Shi et al., 2014). The figure shows that the existence of an embankment weakened the wind speed near the ground on the windward side. With the decrease in wind direction angle, the slope of the section where the wind-sand flow crossed the embankment slowed down, and the slope length of that become longer. The retarding effect of embankment on airflow decreased, and the range of deceleration zone at the windward side slope foot decreased. The airflow on the windward slope was lifted in the vertical direction when it was close to the embankment, and it rapidly climbed along the windward slope. When the airflow converged at the windward slope shoulder of the embankment, the wind speed increased to form an acceleration zone. With the decrease in wind angle, the range of the conflux acceleration zone above the embankment gradually decreased. The leeward slope was located in the wind shadow zone, where the wind-sand flow jumped over the embankment and decelerated at the slope foot to generate a vortex and form a turbulent flow zone. As shown in Figure 6, its range decreased with the decrease in wind angle. When the airflow was far away from the embankment, it started to diffuse, its speed increased slowly, and it returned to the initial state. Regardless of the friction wind velocity, the turbulent flow zones on the leeward side of the embankment under the wind angles of 15° and 30° were not evident. A comparison of the velocity nephograms of embankments with different wind angles under the friction wind velocity of 0.43 and 0.53 m s−1, revealed that the flow field distribution near the embankment was the same. With an increase in friction wind velocity, the range of the acceleration zone above the embankment and the deceleration zone on the leeward side widened. In addition, regardless of the friction wind velocity, the range of the deceleration zone at the windward side slope foot of the embankment, the acceleration zone above the embankment, and the turbulent flow zone at the leeward side all widened with the increase in wind angle.
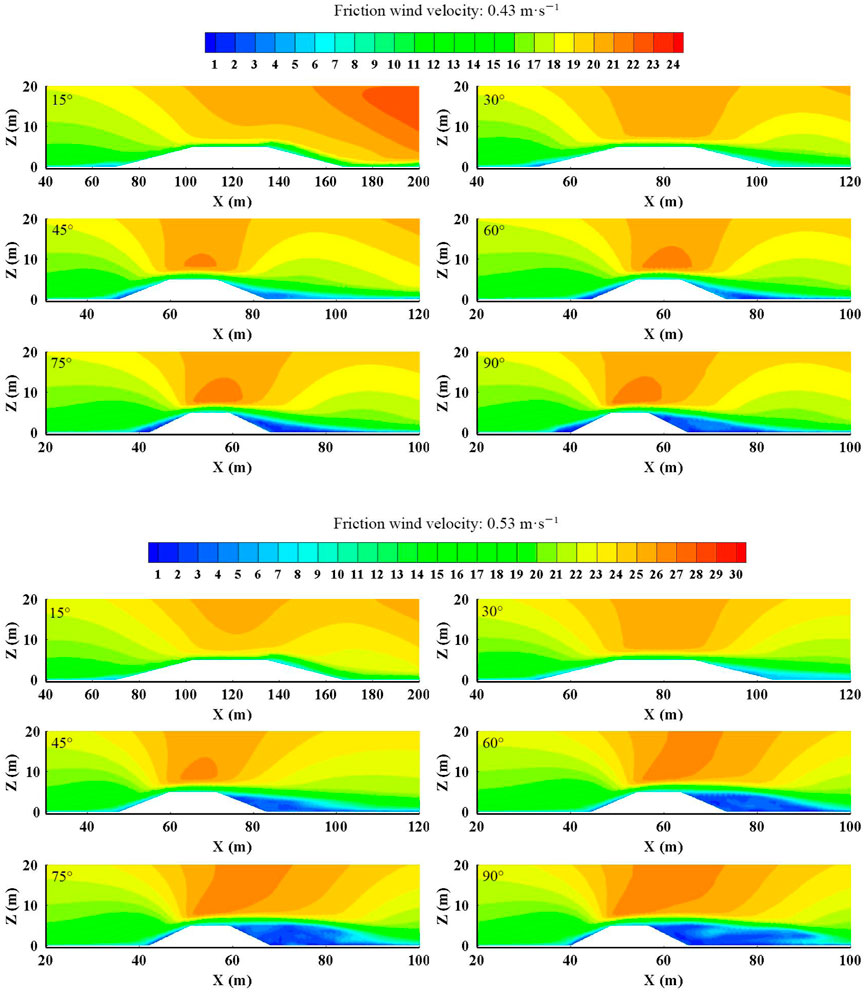
FIGURE 5. Velocity contours of embankment under different wind angles (Unit: m s−1).
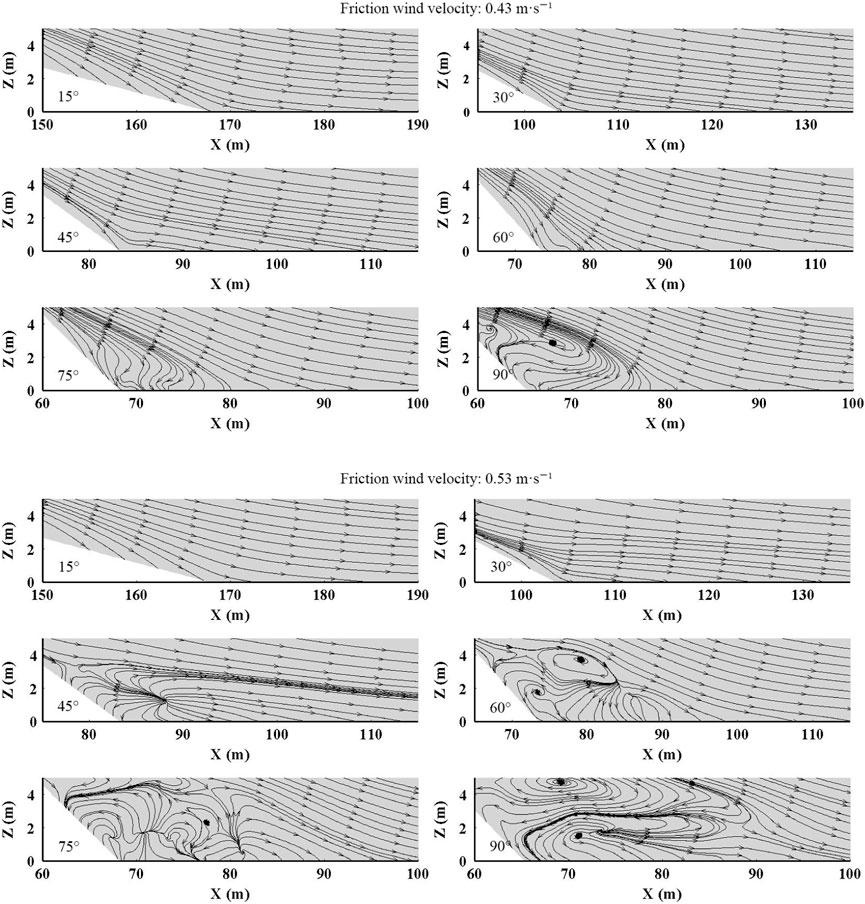
FIGURE 6. Streamline diagram of the leeward side of the embankments.
To explore further the distribution of wind-sand flow field around the embankment and reveal the formation mechanism of embankment sand hazard with different wind angles, the change of wind speed at heights of 0.1, 0.3, and 0.5 m was analyzed. As shown in Figure 7, the velocity of airflow near the embankment decreased sharply, and the minimum wind speed at the windward slope foot increased with the decrease in wind angle. The minimum wind speeds at the height of 0.3 m with wind angles of 15°, 30°, 45°, 60°, 75°, and 90° were 5.09, 3.86, 2.70, 1.77, 1.50, and 1.02 m s−1, respectively, which were almost all lower than the threshold wind speed. Therefore, sand particles could easily accumulate on the windward slope. After the airflow reached the windward slope, the wind speed distribution became sharper along the slope, forming an acceleration zone at the slope shoulder and a deceleration zone at the lower area of the embankment top. When the airflow crossed the embankment and reached the leeward side, the wind speed declined sharply. The minimum wind speed at the foot of the leeward side also increased with the decrease in wind angle. The minimum wind speed at the height of 0.3 m with wind angles of 15°, 30°, 45°, 60°, 75°, and 90° were 10.16, 6.93, 3.33, 3.75, 2.67, and 1.98 m s−1, respectively. The wind speed on the leeward slope of the embankment with a wind angle of 15° decreased twice, and the minimum wind speed on the slope was smaller than the minimum wind speed at the foot of the slope. Under wind angles of 15° and 30°, the minimum wind speed at the foot of the leeward slope was greater than the threshold wind speed. Therefore, compared with embankments with other wind angles, sand particles did not easily to accumulate at the foot of the leeward side slope at wind angles of 15° and 30°. In conclusion, the smaller the wind angle, the smaller the variation range of wind speed along the embankment, which indicated that the influence of the embankment on wind-sand flow was smaller.
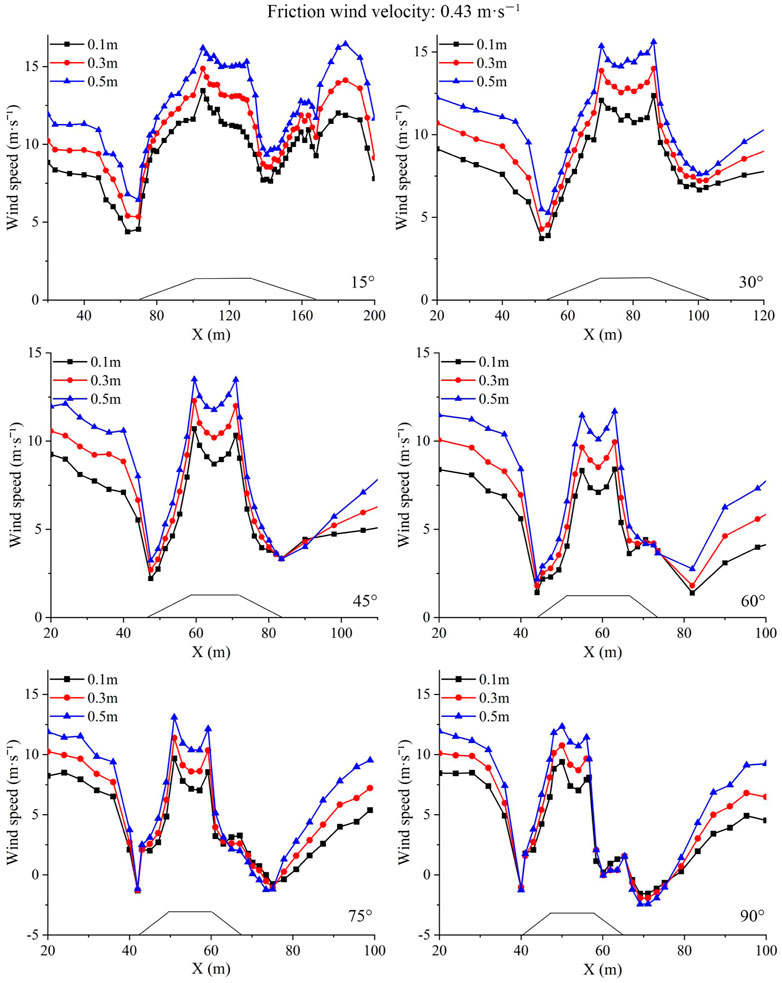
FIGURE 7. Horizontal velocity variation of six intersection angles between wind direction and embankment direction.
Figure 8 shows the curves of wind speed profile at the windward slope foot, windward slope shoulder, embankment center, leeward slope shoulder, and leeward slope foot with different wind angles. By comparing the wind speed profiles at the characteristic locations of the embankment with different wind angles, the change of flow field can be seen directly. The figure shows that under the same characteristic location, the variation trends of wind speed profiles at different wind angles were consistent. The wind speed near the surface at the windward slope foot increased with the decrease in wind angle. At about 9 m above the ground, the airflow tended to accelerate slowly with the increase in height. The greater the wind angle, the larger the air velocity. The airflow velocity of the windward slope shoulder, embankment center, and leeward slope shoulder increased remarkably within 5 m above the embankment. The air velocity then became stable after 10 m from the embankment surface and was similar at each wind angle. The air velocity reached the maximum at a certain height with the increase of height. The air velocity at this height increased with the increase of wind angle. The slope foot on the leeward side was the turbulent flow zone, and the change of the flow field was relatively complex. The air velocity considerably varied with different wind angles. The height of the turning point where the air velocity tended to be stable decreased with the decrease in wind angle. In conclusion, the airflow at the leeward slope foot of the embankment was greatly affected by the wind angle. The smaller the wind angle, the smaller the enhancement of airflow speed with height at the top of the embankment.
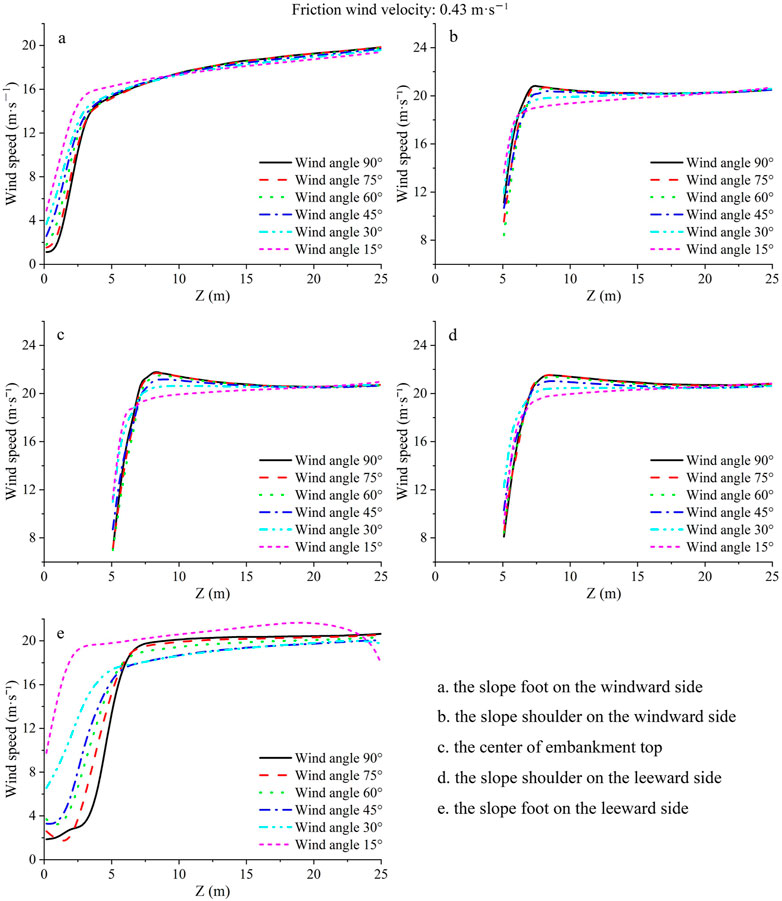
FIGURE 8. Wind speed profiles at different locations on the embankment.
Figure 9 shows the distribution of sand deposition under different wind angles when the friction wind speed was 0.43 m s−1 and the calculation time was 20 s. The figure shows that when the wind-sand flow passed through the embankments, the sand particles were mainly distributed on both sides of the embankment. The sediment amount on both sides of the embankment decreased with decreasing of wind angle. Due to the vortex flow on the leeward side, the sand accumulation on the leeward side slope is less than that on the windward side slope. For the embankment with a small wind angle, the embankment acts as a lateral guide to the wind-sand flow on the windward side, and sand particles flow along the embankment. Especially for the embankment with a wind angle of 15°, and there is almost no sand deposition on the leeward side.
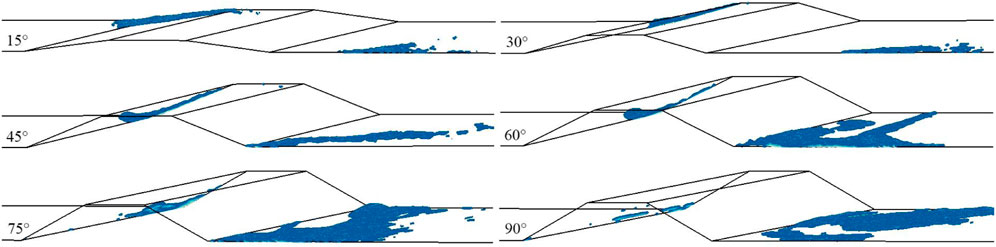
FIGURE 9. Sand Distribution diagram of embankment under different wind angles.
Different sand prevention measures shall be taken for different wind angles. The smaller wind angle can avoid the direct influence of wind erosion on the embankment. But the sand on the windward side of the embankment shall be cleaned regularly to prevent the sand particles from jumping onto the track bed. At a larger wind angle, the airflow was obviously separated, which was easy to cause sand accumulation and wind erosion. Therefore, before the wind-sand flow reaches the embankment, sand prevention measures shall be taken to reduce the sediment transport capacity of the wind-sand flow, so as to reduce the sand deposition on the embankment surface and leeward side.
The sand volume fraction of the windward slope and leeward slope were calculated, which can more accurately compare the sand accumulation state of embankment under different wind angles. The sand volume fraction on the windward side with wind angles of 90° and 75° were similar. The sand volume fraction on the leeward side with the wind angles of 30° and 15° were similar. The Table 1 shows that the amount of deposited sediment was greater in friction wind speed of 0.53 m s−1 than that in friction wind speed of 0.43 m s−1. With increasing of wind speed, except for the wind angle of 90°, the sand deposition on the windward side slope of the embankments with other wind angles decreased relatively; Except for the wind angle of 15°, the sand deposition on the leeward side slope of the embankments with other wind angles increased relatively. Regardless of friction wind velocity, the sand deposition on the windward side slope of the embankment at each wind angle was greater than that on the leeward side slope, and the sand deposition on both sides decreased with decreasing of wind angle.
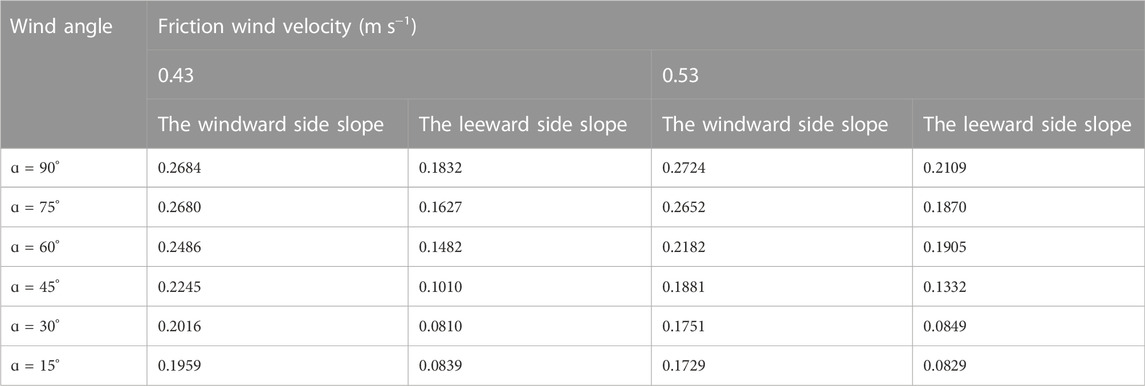
TABLE 1. Sand volume fraction on the windward side slope and the leeward side slope of the embankment.
When the wind-sand flow crosses the embankment, the original size of the embankment section is affected by the wind angle. As shown in Figure 10, the top view of the embankment is on the left, and the side view of the embankment is on the right. The red area represents the embankment cross-section with the wind angle of 60°. The blue area represents the embankment cross-section with the wind angle of 90°. It is obvious that the size of embankment section with an angle of 60° is larger than that with an angle of 90°. With decreasing of wind angle, the slope angle of the embankment section decreases, the slope length becomes longer, and the top surface of the embankment becomes wider. When the slope ratios increase, the airflow is easily blocked and converges at the slope foot, resulting in the pressure difference between the windward slope foot and the slope shoulder increasing. Moreover, it accelerates airflow, strengthening the wind erosion on the slope surface (Yu et al., 2018). The variation law in the embankment flow field with different wind angles is similar to that with different slope ratios (Yang et al., 2010). The range of the deceleration zone at the windward side foot, the deceleration zone at the leeward side foot, and the acceleration zone at the top of the embankment gradually decrease with the decrease in wind angle. With the decrease in wind angle, the wind speed around the embankment is less affected and changes more slowly, and the wind erosion effect on the embankment decreases (Li et al., 2011). Sand sediment is closely related to the change of wind speed around the embankment. When the wind speed decreases, the corresponding sand transport capacity decreases, and the sand particles are easily to fall and accumulate on the roadbed. The greater the wind angle, the stronger the variation range of wind speed around the embankment, which seriously affects the sand movement. Regardless of friction velocity and wind angle, the sand accumulation amount at the windward side foot is greater than that at the leeward side foot, which is consistent with other research results (Zhang et al., 2011). When the wind-sand flow is close to the embankment, the velocity component is affected by the embankment direction. The streamline of the section parallel to the ground under different wind angles is shown in Figure 11. The figure reveals that the embankment direction guides the wind speed streamline, and the velocity component perpendicular to the embankment direction decreases. Under a wind angle of 90°, the direction of the streamline is almost perpendicular to the embankment direction. With the decrease in wind angle, the streamline direction tends to be parallel to the embankment tendency. The sand particles carried in the wind-sand flow move along the guidance direction. Sand sediment is more likely to appear on the windward side than that on the leeward side. In summary, the wind angle changes the size of the embankment section and the wind speed component acting on the embankment, leading to the change of the flow field and the sand accumulation state around the embankment with different wind angles.
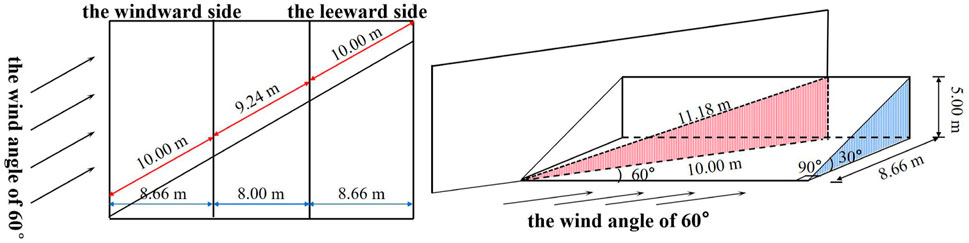
FIGURE 10. Top and side views at an angle of 60° between the embankment direction and the wind direction.
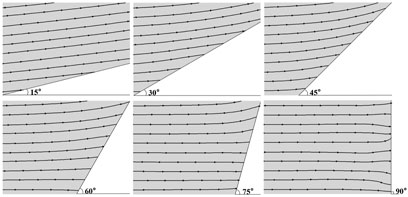
FIGURE 11. Streamline of the windward side of the embankments.
Based on the Euler two-phase flow model, this research studied the characteristics of the flow fields near railway embankments with different wind angles, the law of wind speed changes around embankments, and the sand accumulation. The following conclusions are drawn: the wind-sand flow was blocked when it passed through the embankment and formed different wind velocity zones. With the decrease in wind angle, the deceleration zone at the foot of the windward slope, the acceleration zone at the top of the embankments, and the deceleration zone at the leeward slope of the embankment became smaller. With the decrease of wind angle, the overall change of wind speed near the surface tends to be gentle, and the variation amplitude of wind speed profile at each characteristic position decreases. The sand volume fraction on the slopes on both sides of the embankment decreases with the decrease of wind angle. The sand volume fraction on the windward side is greater than that on the leeward side. Under different wind angles, the form and amount of sand accumulation around the embankment are obviously different, so different sand prevention measures should be taken. When the wind angle is small, the sand particles jumping into the track bed shall be cleaned in time under smaller wind angle; The sediment transport capacity of wind-sand flow should be reduced under large wind angle.
The original contributions presented in the study are included in the article/Supplementary Material, further inquiries can be directed to the corresponding author.
SX and XZ contributed to conception and design of the study. XZ organized the database. SX and XZ performed the statistical analysis. XZ wrote the first draft of the manuscript. SX, YP, and XZ wrote sections of the manuscript. All authors contributed to manuscript revision, read, and approved the submitted version.
This research project was funded by the National Natural Science Foundation of China (grant nos. 41877530 and 42077448). This project was supported by the Ordos Science and Technology Plan (grant no. 2021EEDSCXQDFZ013), the CAS “Light of West China” Program, and the Natural Science Foundation of Gansu Province for Distinguished Young Scholars (grant no. 22JR5RA049).
The authors declare that the research was conducted in the absence of any commercial or financial relationships that could be construed as a potential conflict of interest.
All claims expressed in this article are solely those of the authors and do not necessarily represent those of their affiliated organizations, or those of the publisher, the editors and the reviewers. Any product that may be evaluated in this article, or claim that may be made by its manufacturer, is not guaranteed or endorsed by the publisher.
Bao, F., and Dong, Z. B. (2017). Characteristic of sand-drift activities along the Qarhan Salt Lake section of Qinghai-Tibet Railway. J. Desert Res. 37, 621–625.
Chen, Y. N., Li, W. H., Yang, S. Q., and Xu, H. L. (2020). Environmental hazards in Xinjiang Line of New Eurasian Continental Bridge. Sci. China Ser. D-Earth. Sci. 45, 35–40. doi:10.1007/BF02878386
Cheng, J. J., Lei, J. Q., Li, S. Y., and Wang, H. F. (2016). Disturbance of the inclined inserting-type sand fence to wind-sand flow fields and its sand control characteristics. Aeolian Res. 21, 139–150. doi:10.1016/j.aeolia.2016.04.008
Cheng, J. J., and Xue, C. X. (2014). The sand-damage-prevention engineering system for the railway in the desert region of the Qinghai-Tibet plateau. J. Wind Eng. Industrial Aerodynamics 125, 30–37. doi:10.1016/j.jweia.2013.11.016
Cui, H., Du, L. M., and Niu, B. (2017). Distribution characteristics and accumulation process of sands around railway embankment. J. Dalian Jiaot. Univ. 38, 98–103. doi:10.13291/j.cnki.djdxac.2017.04.020
Duan, R. C., and Gao, Y. X. (2022). Research on design principle of route selection for disaster reduction and sand control engineering of railway in sandstorm area. Railw. Stand. Des. 66, 44–52. doi:10.13238/j.issn.1004-2954.202110120002
Feng, D. Q. (2012). Route selection of the Korla-Golmud Railway in storm sand area. Railw. Eng., 110–113.
Li, C., Gao, Y., and Huang, H. (2011b). Numerical simulation of wind erosion damage rules for desert highway. Rock Soil Mech. 32, 642–647. doi:10.16285/j.rsm.2011.s1.095
Li, K. C., Jiang, F. Q., Xue, C. X., Yang, Y. H., and Ge, S. C. (2011a). Characteristics of gobi sand -drift along south Xinjiang railway. J. Arid Land Resour. Environ. 25, 67–71. doi:10.13448/j.cnki.jalre.2011.05.034
Li, S. Y., Wang, D., and Lei, J. Q. (2005). Spatial distribution of sand drift disasters on road surface in the hinterland of the Taklimakan Desert. Arid. Land Geogr. 28, 93–97.
Li, X. J., and Jiang, F. Q. (2016). Numerical simulation analysis of response law of wind-blown sand flow around wind-break wall in gobi area. Railw. Stand. Des. 60, 47–51+60. doi:10.13238/j.issn.1004-2954.2016.03.011
Ma, S. H., Liu, T., Xue, J., and Chen, J. (2008). The study on wind speed spatial distribution and anti-sand performance about subgrade cross-section in desert highway. Desert Oasis Meteorology 1, 5–11.
Shi, L., Jiang, F. Q., and Han, F. (2014). Numerical simulation of response law of wind-blown sand flow around the railway embankment. J. China Railw. Soc. 36, 82–87.
Sun, X. L., Zhang, Y. Q., Zhang, J. T., Qin, S. G., and Zhou, J. X. (2018). Numerical simulation on the influence of subgrade of Qinghai-Tibet Railway on wind-sand movement. Sci. Silvae Sin. 54, 73–83.
Wang, W. B., Huang, N., and Dun, H. C. (2020). Analysis of wind-sand movement over sand dune with different railway forms downstream. Chin. J. Theor. Appl. 52, 680–688.
Wang, X. M., and Chen, G. T. (1997). Efficiencies and reasonable width for the mechanical sand-prevention system along the Trim Desert highway. J. Arid Land Resour. Environ. 04, 29–36.
Wu, S. Z., Liu, N., and Bo, T. L. (2008). Numerical simulation and wind tunnel experiment of flow field near the highways. J. Lanzhou Univ. Nat. Sci. 44, 27–34. doi:10.13885/j.issn.0455-2059.2008.04.023
Xie, S. B., Qu, J. J., Han, Q. J., and Pang, Y. J. (2020a). Wind dynamic environment and wind tunnel simulation experiment of bridge sand damage in Xierong section of Lhasa-Linzhi Railway. Sustainability 12, 5689. doi:10.3390/su12145689
Xie, S. B., Qu, J. J., Han, Q. J., and Pang, Y. J. (2020b). Experimental definition and its significance on the minimum safe distance of blown sand between the proposed Qinghai-Tibet Expressway and the existing Qinghai-Tibet Railway. Sci. China Technol. Sci. 63, 2664–2676. doi:10.1007/s11431-020-1613-0
Xie, S. B., Qu, J. J., and Pang, Y. J. (2017). Dynamic wind differences in the formation of sand hazards at high and low-altitude railway sections. J. Wind Eng. Industrial Aerodynamics 169, 39–46. doi:10.1016/j.jweia.2017.07.003
Xie, S. B., Qu, J. J., Pang, Y. J., Zhang, K. C., and Wang, C. (2021). Dynamic mechanism of blown sand hazard formation at the Jieqiong section of the Lhasa-Shigatse railway. Geomat. Nat. Hazards Risk 12, 154–166. doi:10.1080/19475705.2020.1863268
Yan, M., Wang, H. B., Zuo, H. J., and Li, G. T. (2019). Wind tunnel simulation of an opencut tunnel airflow field along the Linhe-Ceke Railway, China. Aeolian Res. 39, 66–76. doi:10.1016/j.aeolia.2019.04.007
Yang, S. Q., Liu, T., and Hao, P. W. (2010). Wind tunnel experiment on conveying sand performance about embankment of desert highway. China J. Highw. Transp. 23, 7–12+42. doi:10.19721/j.cnki.1001-7372.2010.01.002
Yao, H. L. (2015). The blown sand characteristics and sand hazards comprehensive protective system at the sand dune areas along the Dun-Ge Railway. J. Desert Res. 35, 555–564.
Yu, Y. P., Xiao, J. H., Qu, J. J., Li, F., Li, W. Q., Pan, D. M., et al. (2019). Wind tunnel simulation of aeolian sand process in subgrade section of two typical high-grade highway. J. Desert Res. 39, 68–79.
Yu, Y. P., Xiao, J. H., Qu, J. J., Wei, M. N., Pan, D. M., Hong, X. F., et al. (2018). Wind tunnel test on flow field of highway subgrade with different slope angles. J. Desert Res. 38, 464–472.
Yu, Y. P., Zhang, K. C., An, Z. S., and Zhang, Y. (2020). Dynamic environment of wind along the Dunhuang-Golmud Railway. J. Desert Res. 40, 41–48.
Zhang, J. P., Wang, Y. S., and Jiang, F. Q. (2011). Numerical analysis on the features of sand flow movement around the embankment of Lan-Xin Railway in gobi region. China Railw. Sci. 32, 14–18.
Zhang, K. C., Niu, Q. H., Qu, J. J., and Han, Q. J. (2010). Study on the characteristics of flow field and the mechanism of wind-blown sand disasters in the Tuotuohe Region along the Qinghai-Tibet Railway. Arid Zone Res. 27, 303–308. doi:10.3724/sp.j.1148.2010.00303
Keywords: railway embankment, numerical simulation, wind direction, wind-sand flow field, sand accumulation
Citation: Zhang X, Xie S and Pang Y (2023) Numerical simulation on wind-sand flow field around railway embankment with different wind angles. Front. Environ. Sci. 10:1073257. doi: 10.3389/fenvs.2022.1073257
Received: 18 October 2022; Accepted: 02 December 2022;
Published: 04 January 2023.
Edited by:
Z. Y. Yuan, Institute of Soil and Water Conservation (CAS), ChinaReviewed by:
Jian-Jun Cheng, Shihezi University, ChinaCopyright © 2023 Zhang, Xie and Pang. This is an open-access article distributed under the terms of the Creative Commons Attribution License (CC BY). The use, distribution or reproduction in other forums is permitted, provided the original author(s) and the copyright owner(s) are credited and that the original publication in this journal is cited, in accordance with accepted academic practice. No use, distribution or reproduction is permitted which does not comply with these terms.
*Correspondence: Shengbo Xie, eGllc2hlbmdib0BsYWIuYWMuY24=
Disclaimer: All claims expressed in this article are solely those of the authors and do not necessarily represent those of their affiliated organizations, or those of the publisher, the editors and the reviewers. Any product that may be evaluated in this article or claim that may be made by its manufacturer is not guaranteed or endorsed by the publisher.
Research integrity at Frontiers
Learn more about the work of our research integrity team to safeguard the quality of each article we publish.