 Changmei Liang
 Xiang Zhang
 Jie Liu5
94% of researchers rate our articles as excellent or good
Learn more about the work of our research integrity team to safeguard the quality of each article we publish.
Find out more
ORIGINAL RESEARCH article
Front. Environ. Sci., 12 January 2023
Sec. Water and Wastewater Management
Volume 10 - 2022 | https://doi.org/10.3389/fenvs.2022.1072505
This article is part of the Research TopicAnalysis and Modelling of Coupled Human-Nature Processes in Water Resources SystemsView all 8 articles
The cost-benefit is a key factor when selecting an appropriate sponge city construction scheme. The research of applying intelligent technology to find cost-benefit efficient planning and construction of sponge city is urgently required. This paper established a multi-objective simulation optimization framework of sponge city construction which considered minimization of runoff control rate, pollutant control rate and life-cycle cost Non-dominated sorting genetic algorithm (NSGA-II) was successfully coupled to Storm water management model to complete the simulation-optimization process. A case study in Xining, China, was conducted to demonstrate the proposed framework. The results of this research suggested that 1) different sponge city construction schemes lead to different runoff control rates and pollutant control rates although under the same investment; 2) the runoff control rate and pollutant control rate total suspended solids decreased with the increase of the rainfall return period, while the cost of sponge city construction increased with the increase of rainfall return period. Furthermore, for T = 2-year, the sponge facility exhibited the most stable control effect on runoff and pollutants among the three different return periods (T = 2-year, 5-year, 10-year); 3) sponge city construction exhibited a “cost-benefit” efficient interval. For T = 2-year, the cost-benefit high efficiency interval of sponge city construction is calculated between 1.2 billion and 1.8 billion; for T = 5-year, the interval is between 1.2 billion and 1.8 billion, while for T = 10-year, the interval is between 1.3 billion and 2.1 billion. The above observations provide reference for reasonable and effective sponge city construction in Xining, China.
With rapid economic developments, the global urbanization level continues to enhance, especially in China. Large permeable ground is converted into impermeable paving, such as roads, thus altering the natural hydrological cycle (Kong et al., 2017; Yang and Chui, 2018; Liang et al., 2020a). These changes result in larger runoff volume, higher peak runoff, earlier peak runoff time, and poorer water quality, which aggravate urban water problems, such as floods, water pollution (Butler et al., 2014; Liu et al., 2015). To mitigate this impact, sponge city, a new concept of urban water management inspired by the “Low Impact Development” (LID), has been proposed by Chinese government in 2013. In 2014, the Ministry of Housing and Urban-Rural Development issued detailed guidelines titled “Technical Guidance on Sponge City Construction” (Ministry of Housing and Urban-Rural Development, 2014; Wang et al., 2017). This guidelines provides technical instructions for alleviating urban water problems and building a sponge city with natural storage, purification, and infiltration (Jia, 2015; Wang et al., 2018; She et al., 2021). From 2015 to 2022, a total of 55 cities were selected as pilot sites to implement the sponge city project.
In sponge city construction practices, it is beneficial to construct sponge facilities on a large scale for runoff quantity and quality control. However, the cost of these facilities construction is very high (Xu et al., 2017). The amount, area, and type of sponge facilities are determined by different investment levels in response to different control effects (Leng et al., 2021; Wang et al., 2022; Yao et al., 2022). Hence, the cost-benefit analysis, the key factor for sponge city construction (Liao et al., 2015; Mei et al., 2018), should be considered by designers to select the optimal schemes.
Determining the optimal scheme with a cost-benefit effect is a complex multi-objective optimization problem, which requires considering the tradeoff between different objectives, such as total runoff volume, pollutant loads, and costs (Xu et al., 2017; Wang et al., 2022). At present, a few researchers have conducted studies on the multi-objective optimization layout (She et al., 2021; Gao et al., 2022; Yao et al., 2022); Eckart et al. (2018) proposed and developed a coupled optimization and simulation model by linking the Storm Water Management Model (SWMM) to the Borg Multi-objective Evolutionary Algorithm (Borg MOEA). They selected the minimizing peak flow in storm sewers, thus reducing the total runoff and minimizing the cost in order to find the optimal LID plan. Liu et al. (2019) developed an optimization tool (SWAT-BMP Optimization Tool 1.0) to enhance the types, quantities, and spatial locations of agricultural BMPs. As a result, the researcher was able to obtain maximum reductions in pollutant loadings with minimum costs. Leng et al. (2021) used SWMM and Non-dominated Sorting Genetic Algorithm Ⅱ (NSGA-Ⅱ) to obtain the cost-effectiveness curves in green-grey infrastructures synchronous optimization under different combination of green and grey infrastructures and different future scenarios which developed based on predicted land use and rainfall data. Wan et al. (2022) present a multi-objective optimization model, which involved three dimensions of objectives, namely cost, facility efficacy, and landscape quality, to accommodate real-world practices of sponge cities.
Research on sponge city optimization in China is increasing in-depth (She et al., 2021). However, studies have mostly concentrated on the effect analysis of sponge city construction, while few research have put stress on the comprehensively analysis the cost-benefit effective interval. The total runoff, peak runoff, and pollutant loads cannot be reduced beyond a certain level of investment to construct LID controls (Baek et al., 2015a). Pour et al. (2020) argued that the major challenges of sponge city construction were the identification of the best LID controls, efficient improvements in technical areas, and site-specific optimization of LID. Hence, research on the key measures of building sponge cities are not enough, and also the research of applying intelligent technology to find cost-benefit efficient planning and construction of sponge city is urgently required (Qiao et al., 2020; She et al., 2021).
The prime aim of this study is to comprehensively analyze the cost-benefit of sponge city construction through a multi-optimization model. This paper developed a simulation-optimization framework by coupling the SWMM and NSGA-Ⅱ, to generate cost-benefit information for determining the efficient interval of sponge city construction. The minimization of the runoff volume, pollutant discharge, and construction and operation costs were the objectives used to analyze the relationship between the investment and functionality of sponge city facilities under different rainfall return years (T = 2-year, 5-year, 10-year).
The theoretical framework for determining the cost-benefit interval for sponge city construction under different rainfall return periods is described in Figure 1. The hydrological model, the SWMM measures the performance of multiple sponge city construction schemes. The NSGA-Ⅱ algorithm is integrated with the SWMM to run the SWMM executable and compute the objective function using the SWMM outputs.
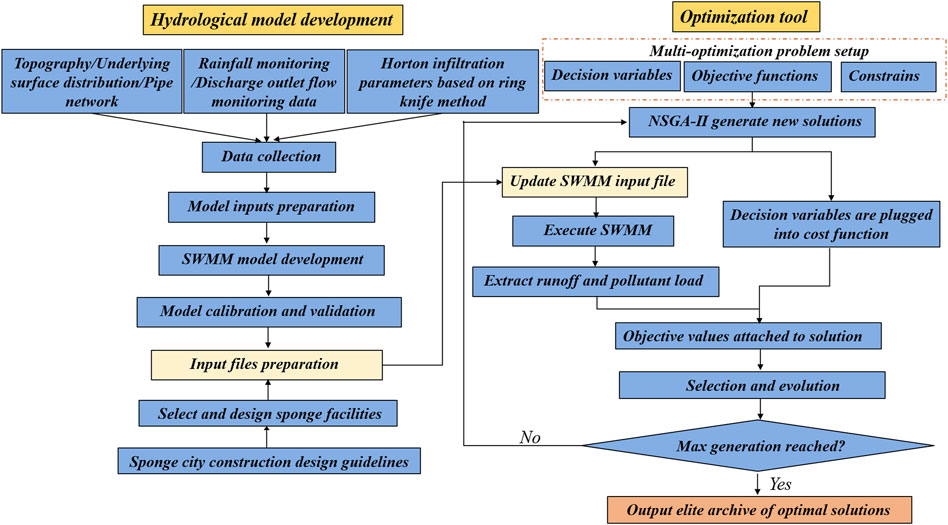
FIGURE 1. Flowchart of simulation-optimization model integration.
An urbanization watershed in Xining, China represented the study area in this paper. Its geographical coordinates are 101°77′E, 36°62′N (Figures 2A,B). The area has a continental plateau semi-arid climate, with a mean annual precipitation of 410 mm (90% of rainfall occurs between April and August). It covers an area of 21.3 km2 and has six distinct types of land use, including roads, green spaces, water, roofs, parking, and farmland. Impervious areas such as roads, parking lots, and roofs account for more than 40% of the area (Figure 2C). In addition, the Huangshui River flows through the area, forming the terminal for rainwater and sewage discharge. According to the Xining City Ecological Protection Bureau, the water quality of the Huangshui River is poor (http://shj.xining.gov.cn/Article/?id=147).
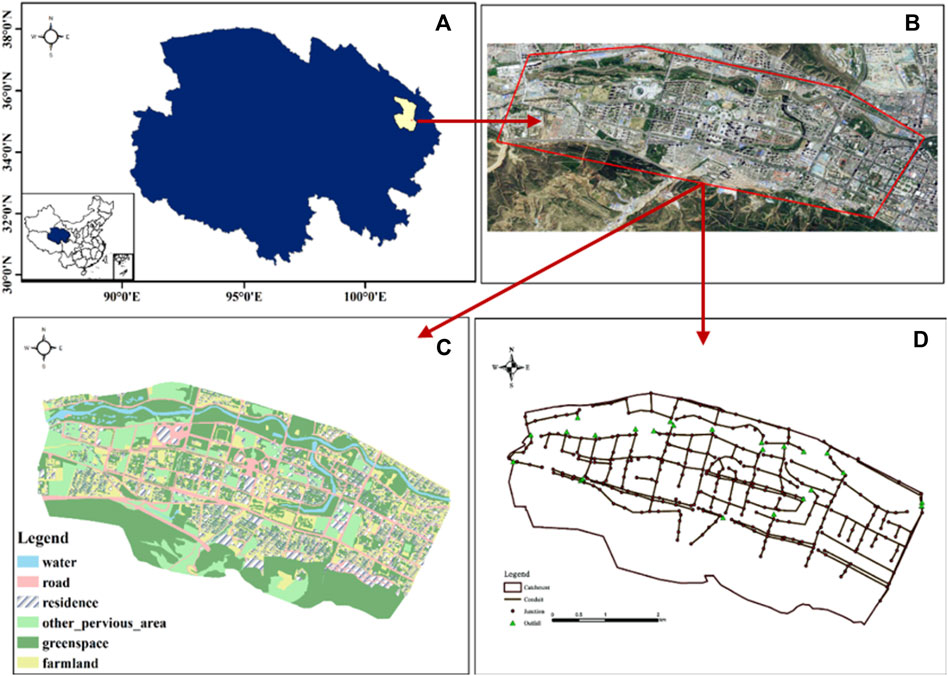
FIGURE 2. (A) Geographical location of the study area; (B) Image picture of the study area; (C) The land use of the study area; (D) The rain pipe network of study area.
The rainfall intensity-duration formula for Xining City may be written as follow (Liang et al., 2020b):
where q represents the rainfall intensity
According to 9 years of rainfall data (2010–2018) obtained from the Xining Meteorological Bureau, the rainfall in Xining City was dominated by a single striker type. Furthermore, the peak rainfall intensity occurred around r = .375, i.e., where r represented the time to peak ratio, with a range between 0 and 1. The Chicago rainfall pattern has commonly been applied to different Chinese cities, achieving satisfactory results (Qin et al., 2013; Gao et al., 2021). Therefore, this paper adopts the Chicago rainfall pattern to calculate the design rainfall process in Xining City. For the rainfall hyetographs, the rainfall duration was taken to be 120 min, while the time interval was set to 10 min. Figure 3 illustrates the design rainfall hyetographs for the three return periods (T = 2-year, 5-year, 10-year).
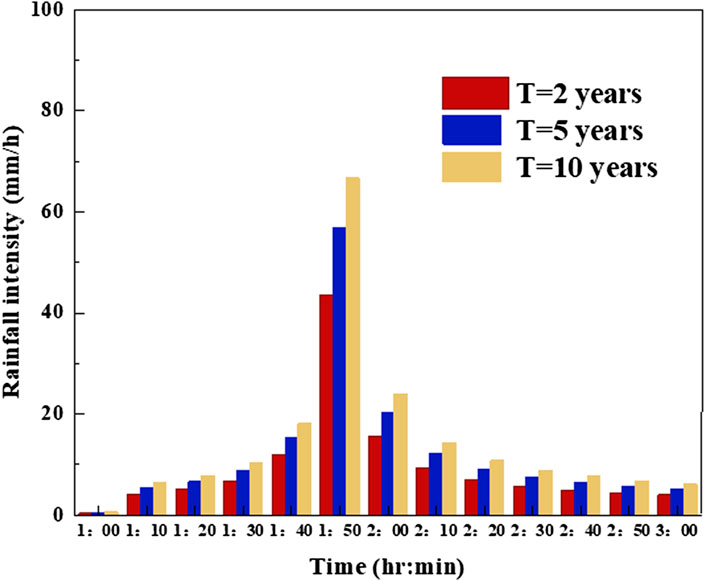
FIGURE 3. Rainfall distribution of Chicago rainfall patterns during three return periods.
This paper uses the EPA Storm Water Management Model (SWMM), developed by the Environmental Protection Agency in the United States, to simulate the urban hydrological process and analysis the effects of adding LID controls. The SWMM is a dynamic rainfall-runoff simulation model used for both single events and long-term simulations of runoff quantity and quality from urban areas (US EPA, 2015). It has been widely used to simulate urban runoffs, sewage pipes design, and urban drainage system. In particular, it has shown great potential in evaluating the effects of LID controls on the regulation of urban surface runoff water quality and quantity (Cipolla et al., 2016; Kong et al., 2017; Warsta et al., 2017). As the SWMM is an open-source software, it has been used to couple different algorithm for optimization (Eckart et al., 2018; Leng et al., 2021; Wang et al., 2022).
According to the topography and land use, the SWMM model divided the research area into 272 sub-catchments. Their properties were further obtained by satellite imagery and site inspection. In addition, 310 nodes, 311 conduits, and seventeen outlets were described as part of the Xining drainage network, as shown in Figure 4.
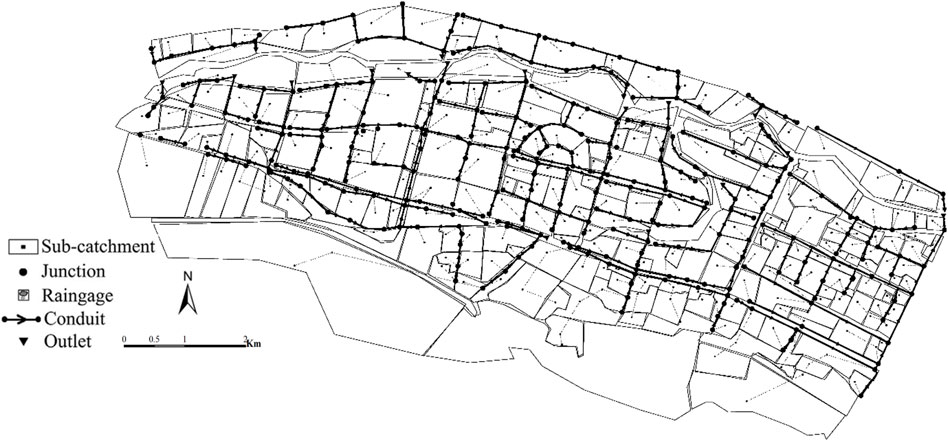
FIGURE 4. SWMM model generalization of the study area.
The surface runoff is calculated by solving both Manning’s equation and the water balance equation. The Horton model and the dynamic wave method simulate the infiltration process and the hydraulic calculations. Firstly, to determine the parameters of Horton’s model, this paper conducted a soil infiltration experiment. A total of 11 sites within the study area were selected and using the experimental results, the Horton parameters were obtained by the infiltration curve which showed in Figure 5.
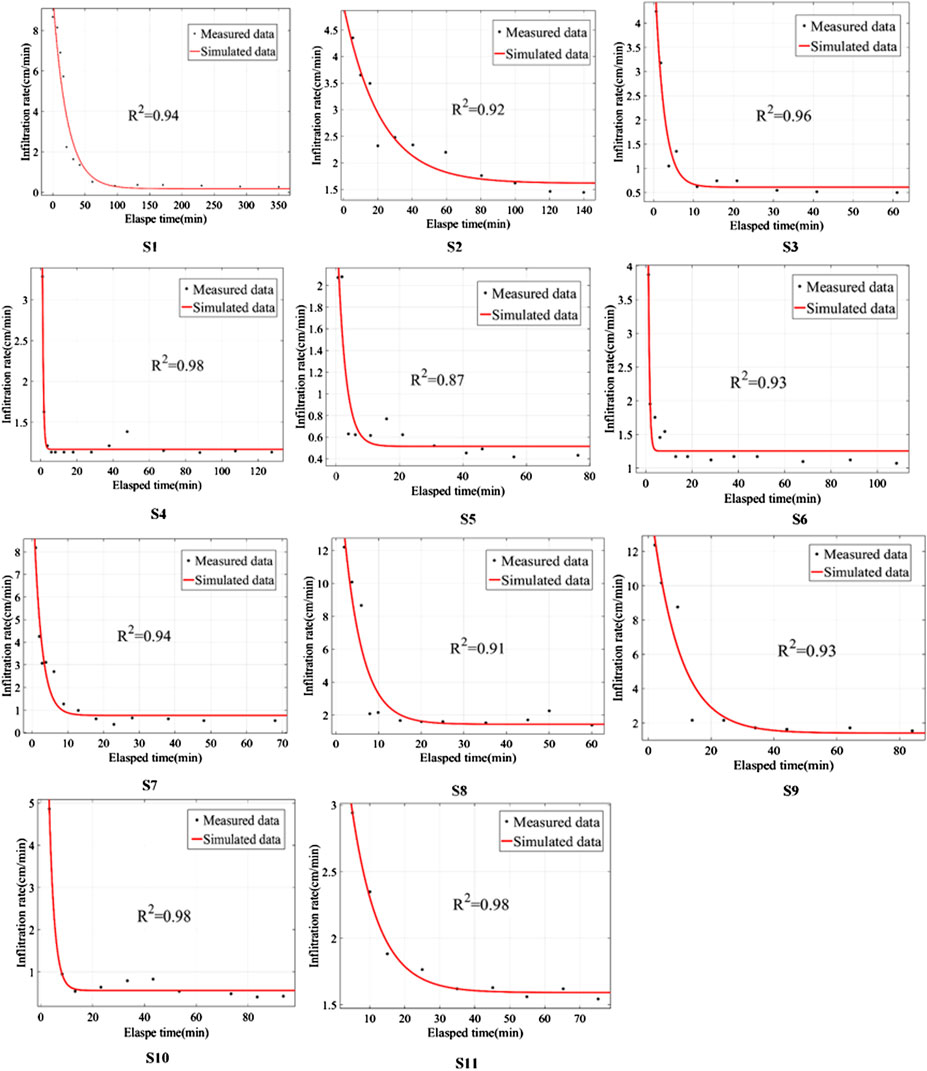
FIGURE 5. The Horton infiltration curves.
The geometric parameters of the sub-catchments, such as the area, impermeable ratio, were obtained from the DEM and land use. The pipe length, pipe diameter, and bottom elevation were obtained from the pipe network data (Figure 2D). According to Sponge City Construction requirements, the total suspended solids (TSS) were selected as the main water pollutant in water quality simulations. The build-up and wash-off function of land use types represent exponential functions, and their parameter setting is provided in Table 1 (Baek et al., 2015b; US EPA, 2015).
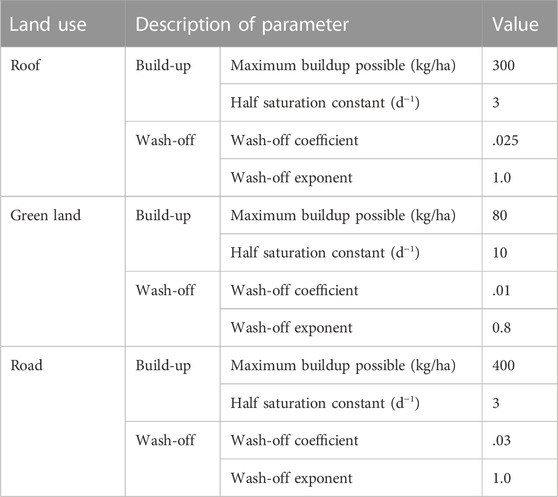
TABLE 1. Water quality model parameter value.
Figure 2C illustrates that there is a large area comprised of roads, residential housing and other impervious areas, which are all suitable for adopting the permeable pavement (PP) design and thus enhance their ground infiltration performance. Green space may be transformed into vegetative swale or rain gardens that would guide the runoff into corresponding biological cells and enhance the rainwater quality. Therefore, three types of sponge facilities, namely vegetative swales (VS), permeable pavements (PP), and rain gardens (RG) were used within the urban catchment. Their parameters were obtained from previous research (Qin et al., 2013; Baek et al., 2015b), as shown in Table 2.
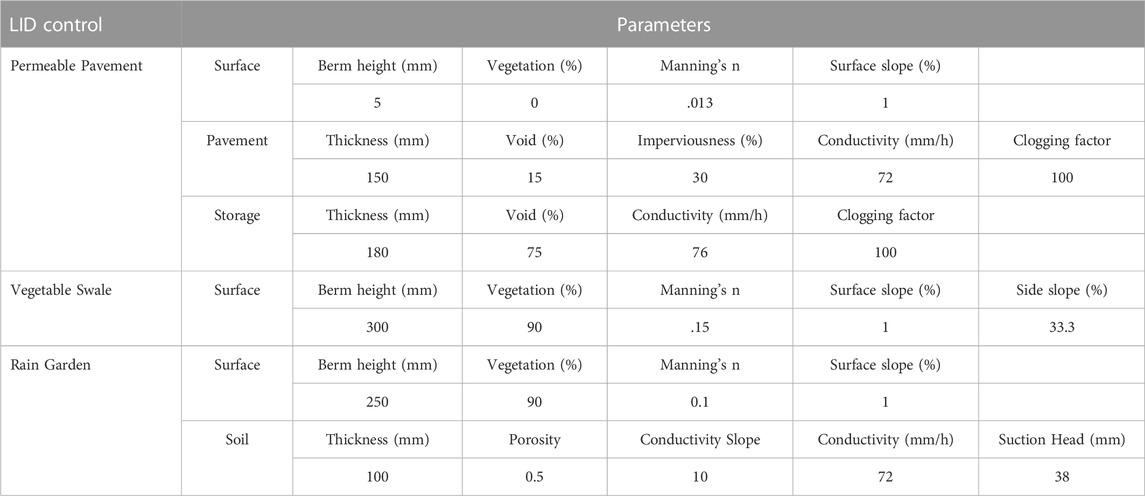
TABLE 2. Parameter values for each layer of sponge facility.
Flow data gathered from flow monitors in 17 different outlets and precipitation time series were used to calibrate the SWMM model. The measured rainfall runoff data are mainly used to calibrate Manning’s coefficient and uncertain parameters of surface depression storage to verify the reliability of the model. In the same study area, each sub-catchment has similar hydrological properties, these parameters can be extended to other sub-catchments. Hence, only one outlet flow was selected for further parameter calibration.
The hydrological module of the SWMM model was calibrated and validated by six rainfall events. . In 2017,TheSeptember 25th to October 3rd were used as the calibration period and October4th to 10th were used as the validation period. The Nash-Sutcliffe Efficiency index (NSE) and R2 were selected as the goodness-of-fit indexes to assess the model performance. In general, the calibration and validation results are satisfactory if the NSE and R2 are either greater or equal .5 (Liang et al., 2020a).
The quantitative assessment of the SWMM model performance is illustrated in Figure 6. At the calibration period, the comparison of the observed and simulated runoff hydrographs shows an NSE = .69 and an R2 = .75. The observed and simulated peak times are exactly the same, while the peak flows are almost identical. At the validation period, the NSE = .51 and the R2 = .72. This suggests that the SWMM model is acceptable for the study area and may be used to evaluate the effectiveness of sponge city construction (Liang et al., 2020b).

FIGURE 6. Comparison between measured and simulated data. (A) Calibration period, (B) Validation period.
The decision variables in the model represent design elements in a sponge city construction project, i.e., the sponge city facilities (Wan et al., 2008). In general, the scale of sponge city facility is the most important parameter affecting the cost and performance of green and grey infrastructures (Leng et al., 2021). Three kinds of commonly used sponge facilities, the vegetative swale (VS), permeable pavement (PP), and rain garden (RG) are examined in this study. The type, area, and location of these facilities represented the decision variables.
Multi-objective optimization has become a popular method of tradeoff solutions (Wang et al., 2022). According to the experiences from actual sponge city construction projects, this study set three objective functions: minimizing life-cycle cost, total runoff volume, total pollutant load.
The life-cycle cost is the most concerning factor in all construction projects (Wan et al., 2008). Weitman Dov (2021) compares the cost of traditional development with low impact development, showing that the LID reduces project cost by 15%–80%. In other words, this practice shows great potential in reducing cost through a reasonable sponge facility design scheme.
The present paper adopted the life cycle cost (LCC) evaluation method to calculate the cost of sponge city construction. The present value of cost (PVC) encompassed all costs, including initial cost, annual operation, and maintenance cost, and the salvage value (Mei et al., 2018). The LID control was assumed to incur zero land cost. The cost (PVCx,n) is determined by Eq. 2-2.
In the above equation, the
In Eq. 2-3, the symbol i represents the interval number from the last maintenance year to the design life year. This paper assumes that the interval is equal to 1. The
The present value factors
The objective function of runoff controls is determined by minimizing the sum of the runoff volume at each drainage outlet. A hydrologic and hydraulic simulation evaluation is conducted by calling the source code of the SWMM. The runoff target is defined through Eq. 2-5:
In the equation above, k represents the serial number of the outlet, while N denotes the total number of outlets. Moreover, Qk represents the runoff volume of the kth outlet.
This study selected TSS content as the pollutant load representative. It further used the sum of the TSS content at each drainage outlet to represent the pollution content after the implementation of the sponge city construction program. Water quality simulation was conducted by invoking the SWMM model. The pollutant load target is determined by Eq. 2-6:
In the equation above, k represents the serial number of the outlet, while N denotes the total number of outlets. In addition,
Green spaces and impervious road surfaces in each sub-catchment are determined according to the land use of the study area. The construction area constraints of the three types of sponge city facilities in the nth sub-catchment are set according to the green spaces and roads of the sub-catchment area. This is expressed as Eqs 2_7, 2_8:
In the above equations,
According to “The Technical Guide for Sponge City Construction,” the volumetric method is used to calculate the regulation and storage volume in cases where sponge city construction is designed with the total runoff and runoff pollution as the control objectives. This notion is defined through Eq. 2-9:
In the equation above, V denotes the total regulation and storage volume, while H represents the designed rainfall, determined according to the annual total runoff control rate index. φ denotes the comprehensive runoff coefficient and F represents the catchment area.
After sponge city construction, the sum of the runoff volume control scale of all sponge city facilities should be greater than or equal to the total volume that needs to be regulated and stored in the study area,
Based on land use, the weighted average coefficient method determines the runoff coefficient of the study area to be .52, as shown in Table 3. According to “The Technical Guide for Sponge City Construction,” the annual runoff control rate of the Xining City construction planning area is calculated as no less than 90%, while the corresponding designed rainfall is 15.6 mm. According to Eq. 2-9, the total regulating and storage volume is V ≥ 17,858.88 m3.
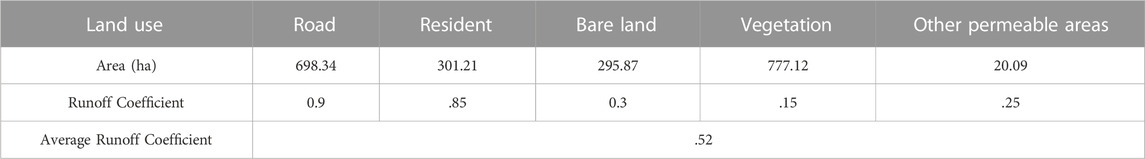
TABLE 3. The average runoff coefficient in the study area.
NSGA-Ⅱ is used as the optimization algorithm in this study for it could avoid the dilemma that traditional enumeration method cannot find the optimal solution and has been widely used in green infrastructures optimal design (Leng et al., 2021; Wan et al., 2022; Yao et al., 2022). The solution process was shown in Figure 7. The initial population is set to 200; the crossover rate is set as .9 and mutation rate is set as .03; The new solution generated is set as 500 by iteration. At the optimization process, NSGA-Ⅱ keeps writing the new solution (decision variables) into the input file of SWMM, and then calls its calculation engine to compute the outflow runoff and the total amount of TSS in the study area, to obtain the objective function value of each sponge city construction schemes.
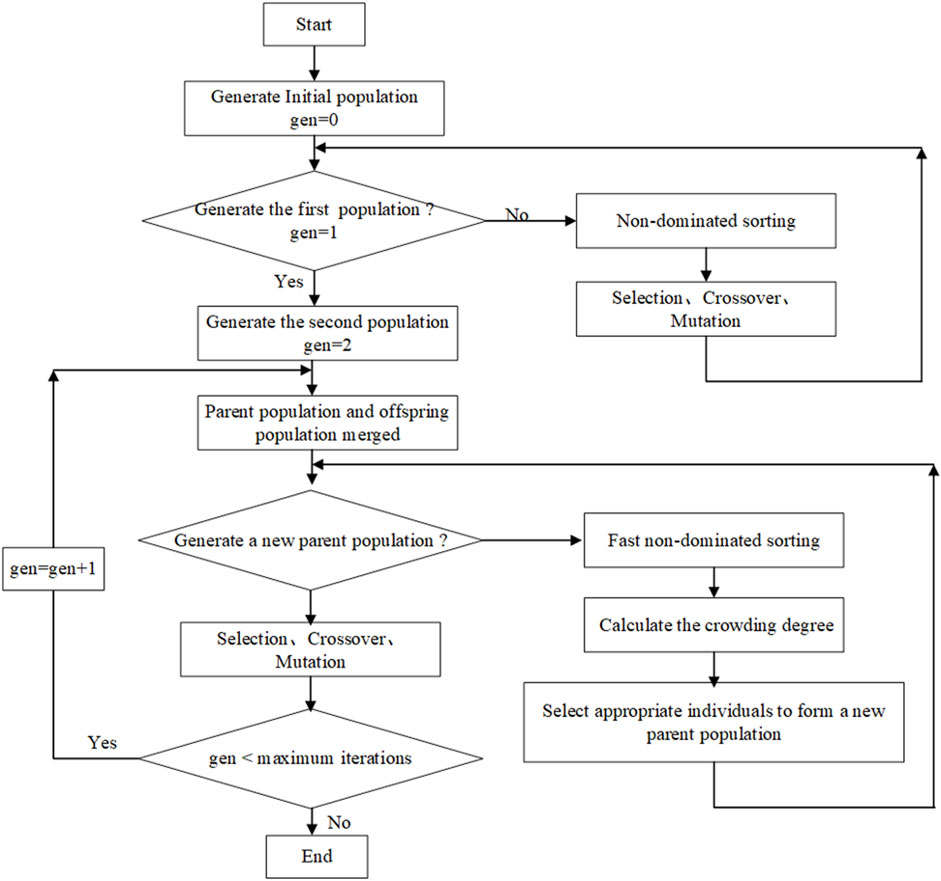
FIGURE 7. NSGA-Ⅱ calculation process.
As shown in Figure 8, the Pareto Front solution under different rainfall return periods (T = 2-year, 5-year, 10-year) provides an in-depth understanding of all the objectives and further visualizes the effectiveness of each investment level. Furthermore, each point represents a compromise solution between the selected objectives. Thus, decision-makers may choose one optimal solution from a range of potential ones, as well as include their preferences in the design process (Leng et al., 2021).
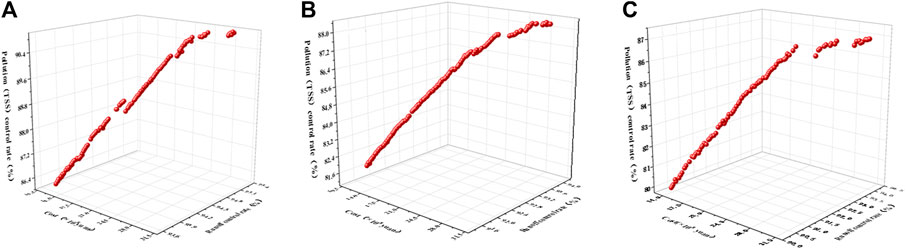
FIGURE 8. The Pareto Front solutions under three different periods [(A) T = 2-year; (B) T = 5-year; (C) T = 10-year].
As illustrated in Figure 8A, when the rainfall return period T = 2-year, the sponge city construction cost is between 1.2 billion and 2.8 billion yuan. Moreover, the runoff control rate is between 93% and 96%, while the pollutant control rate (TSS) is between 86% and 91%. As in Figure 8B, when the rainfall return period T = 5-year, the sponge city construction cost is measured between 1.2 billion and3.0 billion yuan, while the runoff control rate is between 91 and 94%, and the pollutant control rate (TSS) is between 82% and 88%. In Figure 8C, when the rainfall return period is T = 10-year, the sponge city construction cost is measured to be between 1.3 billion and 3.3billion yuan. The runoff control rate is between 90 and 93%, while the pollutant control rate (TSS) is between 79 and 87%. In general, the construction cost of sponge city has a positive correlation with the total runoff control rate and pollutant control rate (TSS).
Figure 9 illustrates the distribution range of each objective value in the Pareto solution set, which was obtained under the three rainfall return periods. A comparison of the three different rainfall return periods suggests that in the optimal solution set, the range of each objective value changes with the change of return period. Moreover, the runoff control rate and pollutant control rate (TSS) also decrease with the increase in rainfall return period. However, the cost of sponge city construction increases with the increase in rainfall return period. Furthermore, for T = 2-year, the sponge city facility has a relatively stable control effect on runoff and pollutants among the three different return periods.
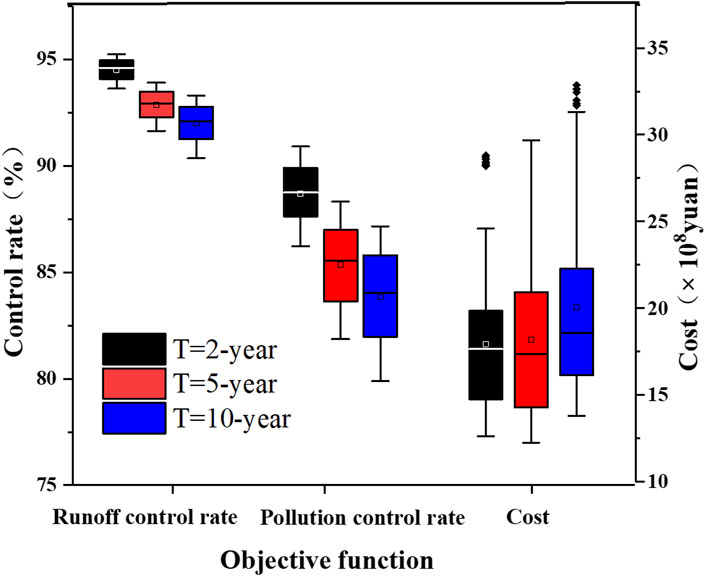
FIGURE 9. Objective values under different rainfall return periods.
For T = 2-year, the runoff control rate of the optimal solution set ranges from 93.63% to 95.25%. For T = 5-year, the runoff control rate is measured between 91.65% and 93.91%. For T = 10-year, the runoff control rate ranges from 90.36% to 93.31%. It indicates that an increase in the rainfall return period leads to a slight decrease in the runoff control rate, mainly because the infiltration rate of sponge facilities is constant. Furthermore, the super-osmotic production flow increases with the increase of rainfall intensity, while the runoff control is weaker, resulting in a runoff control rate decrease. In addition, the study area, i.e., Xining City, belongs to the semi-arid climate of continental plateau. There is not much rainfall within this region, and the soil moisture content is low, meaning that the runoff does not change significantly under different rainfall conditions.
In the three rainfall return periods, the sponge city facilities also exhibited different effects on the control rate of pollutants (TSS). For T = 2-year, the control rate of pollutants (TSS) of the optimal solution set was between 86.23% and 90.92%. For T = 5-year, the pollutant (TSS) control rate ranges from 81.86% to 88.33%. For T = 10-year, the pollutant control rate (TSS) was measured between 79.88% and 87.17%. The data above suggest that an increase in the rainfall return period causes the pollutant control rate (TSS) to slightly decrease. These findings are similar to the runoff control rate pattern, because the SWMM model calculates the water quality of different sponge facilities based on changes in water quantity.
During the three rainfall return periods, the construction cost also differed as a result of the different areas in which the sponge city facilities were located. For T = 2-year, the construction cost of the optimal solution set was between 1.26 billion and 2.87 billion yuan. For T = 5-year, the construction cost ranges from 1.22 billion to 2.96billion yuan. For T = 10-year, the construction cost was measured between 1.38 billion and 3.28 billion yuan. The above data suggest that an increase in the rainfall return period causes the sponge urban construction cost to gradually increase as well. Such a pattern is due to the increase in rainfall intensity. Because of the storage volume constraint, the construction area of sponge facilities increases to achieve the corresponding runoff control rate and pollutant control rate (TSS), thus causing the construction cost to increase as well.
To reflect the relationship between the cost, the runoff control rate, and the pollutant control rate (TSS), the three-dimensional Pareto front is projected onto the two-dimensional plane for further analysis. Figure 10 illustrates the runoff control rate and pollution control rate under different investments. It also indicates that different sponge city construction schemes lead to different runoff control rates and pollutant control rates under the same investment.
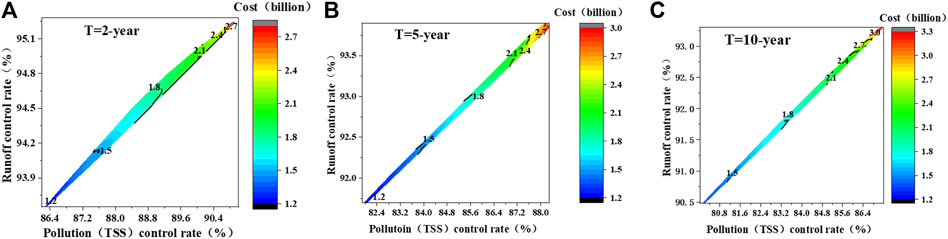
FIGURE 10. Runoff control rate and pollutant control rate under different investments conditions.
The cost-benefit curves (runoff control rate versus cost, pollutant control rate versus cost) under the three rainfall return periods are illustrated in Figure 11. The results indicate that optimizing the layout of sponge city facilities could control between 91.32% and 94.78% of the runoff and between 81.99% and 90.92% of pollutant loads, respectively. In addition, the corresponding cost is measured to be between 1.26 billion and 3.28 billion yuan. Furthermore, the convex trend that the curve slopes transform from steeper to flatter. Because of cost increases, the runoff and pollutant control rates improve obviously at the steeper section of curve. In other words, this cost range represents the high efficient interval. For T = 2-year, the cost-benefit high efficient interval of sponge city construction is measured between 1.2 billion and 1.8 billion yuan; For T = 5-year, the high efficient interval is between 1.2 billion and 1.8 billion yuan; For T = 10-year, the high efficient interval ranges between 1.3 billion and 2.1 billion yuan. As the cost of sponge city construction beyond this range, there is no considerable change in the runoff/pollutants control rate because of the limited treatment capabilities of sponge city construction.
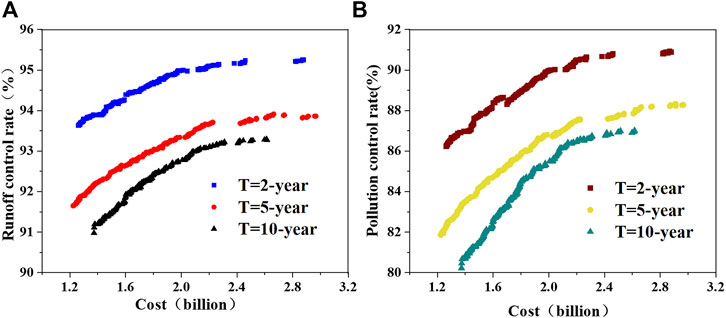
FIGURE 11. Water quantity-cost trade-off and water quality-cost trade-off curves under different return periods.
To analyze the cost-benefit high efficient interval for sponge city construction, this study established a multi-objective simulation-optimization framework of the urban drainage system. By coupling the SWMM and the NSGA-Ⅱ, this paper constructed the optimization model. The model considered three objectives, namely the runoff control rate, pollutant control rate, and life-cycle cost. Furthermore, the construction area and the storage volume of sponge facilities functioned as the constraint conditions. A case study in Xining, China, was conducted to demonstrate the proposed framework. The paper derives three main conclusions from the results.
(1) Sponge city construction reduces the runoff and pollution discharge as the cost increases. Furthermore, different sponge city construction schemes lead to different runoff control rates and pollutant control rates although under the same investment.
(2) The runoff control rate and the pollutant control rate (TSS) decrease as the rainfall return period increases. On the other hand, the cost of sponge city constrcution increases with the increase of the rainfall return period. In addition, for T = 2-year, the sponge city facility has a relatively stable control effect on the runoff and pollutants.
(3) Sponge city construction has a cost-benefit “high efficient interval”. The results of the multi-objective optimization indicated that for T = 2-year, the cost-benefit high efficiency interval is measured between 1.2 billion and 1.8 billion yuan; For T = 5-year, the high efficient interval is found between 1.2 billion and 1.8 billion yuan, while for T = 10-year, it is between 1.3 billion and 2.1 billion yuan.
The raw data supporting the conclusion of this article will be made available by the authors, without undue reservation.
Conceptualization, XZ and CL; Data curation, XZ; Formal analysis, XZ and JL; Funding acquisition, XZ and JL; Methodology, CL; Project administration, XZ; Resources, XZ; Software, CL; Supervision, XZ and JL; Validation, ST; Writing—original draft, CL; Writing—review and editing, ST. All authors have read and agreed to the published version of the manuscript.
This work was supported by the Key Research and Development Program of Hubei Provinve (No. 2021BCA128), National Natural Science Foundation of China Youth Foundation (52009092), Key scientific research projects of water conservancy in Hubei Province (No. HBSLKY202203).
The authors declare that the research was conducted in the absence of any commercial or financial relationships that could be construed as a potential conflict of interest.
All claims expressed in this article are solely those of the authors and do not necessarily represent those of their affiliated organizations, or those of the publisher, the editors and the reviewers. Any product that may be evaluated in this article, or claim that may be made by its manufacturer, is not guaranteed or endorsed by the publisher.
Baek, S. S., Choi, D. H., Jung, J. W., Lee, H. J., Lee, H., Yoon, K. S., et al. (2015a). Optimizing low impact development (LID) for stormwater runoff treatment in urban area, Korea: Experimental and modeling approach. Water Res. 86, 122–131. doi:10.1016/j.watres.2015.08.038
Baek, S. S., Choi, D. H., Jung, J. W., Lee, H. J., Lee, H., Yoon, K. S., et al. (2015b). Optimizing low impact development (LID) for stormwater runoff treatment in urban area, Korea: Experimental and modeling approach. Amsterdam, Netherlands: Elsevier.
Butler, D., Farmani, R., Fu, G., Ward, S., Diao, K., and Astaraie-Imani, M. (2014). A new approach to urban water management: Safe and sure. Procedia Eng. 89, 347–354. doi:10.1016/j.proeng.2014.11.198
Cipolla, S. S., Maglionico, M., and Stojkov, I. (2016). A long-term hydrological modelling of an extensive green roof by means of SWMM. Ecol. Eng. 95, 876–887. doi:10.1016/j.ecoleng.2016.07.009
Eckart, K., McPhee, Z., and Bolisetti, T. (2018). Multiobjective optimization of low impact development stormwater controls. J. Hydrol. 562, 564–576. doi:10.1016/j.jhydrol.2018.04.068
Gao, J., Li, J., Li, Y., Xia, J., and Lv, P. (2021). A distribution optimization method of typical LID facilities for sponge city construction. Ecohydrol. Hydrobiol. 21, 13–22. doi:10.1016/j.ecohyd.2020.09.003
Gao, Z., Zhang, Q. H., Xie, Y. D., Wang, Q., Dzakpasu, M., Xiong, J. Q., et al. (2022). A novel multi-objective optimization framework for urban green-gray infrastructure implementation under impacts of climate change. Sci. Total Environ. 825, 153954. doi:10.1016/j.scitotenv.2022.153954
Jia, H. (2015). China ’ s ambitious sponge city initiative: A monumental effort for green/gray infrastructure integration China ’ S ambitious sponge city initiative: A monumental effort for green/gray infrastructure. EWRI Curr. 14, 8–9.
Kong, F., Ban, Y., Yin, H., James, P., and Dronova, I. (2017). Modeling stormwater management at the city district level in response to changes in land use and low impact development. Environ. Model. Softw. 95, 132–142. doi:10.1016/j.envsoft.2017.06.021
Leng, L., Jia, H., Chen, A. S., Zhu, D. Z., Xu, T., and Yu, S. (2021). Multi-objective optimization for green-grey infrastructures in response to external uncertainties. Sci. Total Environ. 775, 145831. doi:10.1016/j.scitotenv.2021.145831
Liang, C., Zhang, X., Xia, J., Xu, J., and She, D. (2020a). The effect of sponge city construction for reducing directly connected impervious areas on hydrological responses at the urban catchment scale. Water Switzerl. 12, 1163. doi:10.3390/W12041163
Liang, C., Zhang, X., Xu, J., Pan, G., and Wang, Y. (2020b). An integrated framework to select resilient and sustainable sponge city design schemes for robust decision making. Ecol. Indic. 119, 106810. doi:10.1016/j.ecolind.2020.106810
Liao, Z., Chen, H., Huang, F., and Li, H. (2015). Cost–effectiveness analysis on LID measures of a highly urbanized area. Desalin. Water Treat. 56, 1–7. doi:10.1080/19443994.2014.964327
Liu, Y., Bralts, V. F., and Engel, B. A. (2015). Evaluating the effectiveness of management practices on hydrology and water quality at watershed scale with a rainfall-runoff model. Sci. Total Environ. 511, 298–308. doi:10.1016/j.scitotenv.2014.12.077
Liu, Y., Guo, T., Wang, R., Engel, B. A., Flanagan, D. C., Li, S., et al. (2019). A SWAT-based optimization tool for obtaining cost-effective strategies for agricultural conservation practice implementation at watershed scales. Sci. Total Environ. 691, 685–696. doi:10.1016/j.scitotenv.2019.07.175
Mei, C., Liu, J., Wang, H., Yang, Z., Ding, X., and Shao, W. (2018). Integrated assessments of green infrastructure for flood mitigation to support robust decision-making for sponge city construction in an urbanized watershed. Sci. Total Environ. 639, 1394–1407. doi:10.1016/j.scitotenv.2018.05.199
Ministry of Housing and Urban-Rural Development (2014). Sponge city construction technical guide - construction of low impact development rainwater systems (trial). Avaialble at: https://www.mohurd.gov.cn//wjfb/201411/W020141102041225.pdf.88
Pour, S. H., Wahab, A. K. A., Shahid, S., Asaduzzaman, M., and Dewan, A. (2020). Low impact development techniques to mitigate the impacts of climate-change-induced urban floods: Current trends, issues and challenges. Sustain. Cities Soc. 62, 102373. doi:10.1016/j.scs.2020.102373
Qiao, X. J., Liao, K. H., and Randrup, T. B. (2020). Sustainable stormwater management: A qualitative case study of the sponge cities initiative in China. Sustain. Cities Soc. 53, 101963. doi:10.1016/j.scs.2019.101963
Qin, H., peng, L., xi, Z., and Fu, G. (2013). The effects of low impact development on urban flooding under different rainfall characteristics. J. Environ. Manage. 129, 577–585. doi:10.1016/j.jenvman.2013.08.026
She, L., Wei, M., and You, X. (2021). Multi-objective layout optimization for sponge city by annealing algorithm and its environmental benefits analysis. Sustain. Cities Soc. 66, 102706. doi:10.1016/j.scs.2021.102706
US EPA (2015). Storm water management model user’s manual version 5.1. Washington, DC, USA: Office of Research and Development Water Supply and Water Resources Division.
Wan, S., Xu, L., Qi, Q., Yang, H., and Zhou, Y. (2008). Building a multi-objective optimization model for Sponge City projects. Int. Low. Impact Dev. 43, 101171–101217. doi:10.1016/j.uclim.2022.101171
Wan, S., Xu, L., Qi, Q., Yang, H., and Zhou, Y. (2022). Building a multi-objective optimization model for Sponge City projects. Urban Climate 43, 101171. doi:10.1016/j.uclim.2022.101171
Wang, H., Mei, C., Liu, J. H., and Shao, W. W. (2018). A new strategy for integrated urban water management in China: Sponge city. Sci. China Technol. Sci. 61, 317–329. doi:10.1007/s11431-017-9170-5
Wang, J., Liu, J., Mei, C., Wang, H., and Lu, J. (2022). A multi-objective optimization model for synergistic effect analysis of integrated green-gray-blue drainage system in urban inundation control. J. Hydrol. 609, 127725. doi:10.1016/j.jhydrol.2022.127725
Wang, Y., Sun, M., and Song, B. (2017). Public perceptions of and willingness to pay for sponge city initiatives in China. Resour. Conserv. Recycl. 122, 11–20. doi:10.1016/j.resconrec.2017.02.002
Warsta, L., Niemi, T. J., Taka, M., Krebs, G., Haahti, K., Koivusalo, H., et al. (2017). Development and application of an automated subcatchment generator for SWMM using open data. Urban Water J. 14, 954–963. doi:10.1080/1573062X.2017.1325496
Weitman, Dov, Anne, W., and Robert, G. (2021). Reducing stormwater costs through LID strategies and practices. Trauma Vict. 751–754. doi:10.4324/9780203782255-11
Xu, T., Jia, H., Wang, Z., Mao, X., and Xu, C. (2017). SWMM-Based methodology for block-scale LID-BMPs planning based on site-scale multi-objective optimization: A case study in tianjin. Front. Environ. Sci. Eng. 11, 1–12. doi:10.1007/s11783-017-0934-6
Yang, Y., and Chui, T. F. M. (2018). Integrated hydro-environmental impact assessment and alternative selection of low impact development practices in small urban catchments. J. Environ. Manage. 223, 324–337. doi:10.1016/j.jenvman.2018.06.021
Keywords: sponge city, cost-benefit, efficient interval, multi-objective optimization, SWMM
Citation: Liang C, Zhang X, Liu J, Liu L and Tao S (2023) Determination of the cost-benefit efficient interval for sponge city construction by a multi-objective optimization model. Front. Environ. Sci. 10:1072505. doi: 10.3389/fenvs.2022.1072505
Received: 17 October 2022; Accepted: 30 December 2022;
Published: 12 January 2023.
Edited by:
Yaoping Wang, The University of Tennessee, Knoxville, United StatesReviewed by:
Haozhi Pan, Shanghai Jiao Tong University, ChinaCopyright © 2023 Liang, Zhang, Liu, Liu and Tao. This is an open-access article distributed under the terms of the Creative Commons Attribution License (CC BY). The use, distribution or reproduction in other forums is permitted, provided the original author(s) and the copyright owner(s) are credited and that the original publication in this journal is cited, in accordance with accepted academic practice. No use, distribution or reproduction is permitted which does not comply with these terms.
*Correspondence: Xiang Zhang, emhhbmd4aWFuZ0B3aHUuZWR1LmNu
Disclaimer: All claims expressed in this article are solely those of the authors and do not necessarily represent those of their affiliated organizations, or those of the publisher, the editors and the reviewers. Any product that may be evaluated in this article or claim that may be made by its manufacturer is not guaranteed or endorsed by the publisher.
Research integrity at Frontiers
Learn more about the work of our research integrity team to safeguard the quality of each article we publish.