
94% of researchers rate our articles as excellent or good
Learn more about the work of our research integrity team to safeguard the quality of each article we publish.
Find out more
ORIGINAL RESEARCH article
Front. Environ. Sci. , 16 November 2022
Sec. Environmental Economics and Management
Volume 10 - 2022 | https://doi.org/10.3389/fenvs.2022.1071909
 Siliang Guo1,2*
 Yanhua Diao3
It is of great significance to analyze coupling coordination feature between urban spatial functional division (USFD) and green economic development for the realization of regional high-quality sustainable development. However, few studies have investigated the coupling between USFD and green economic development. Therefore, based on the analysis of the coupling and coordination mechanism between USFD and green development, this paper innovatively calculates the indicators of USFD and green economic development of 108 cities in the Yangtze River Economic Belt (YREB) from 2009 to 2019. Moreover, we explore the spatiotemporal patterns, evolution characteristics of the coupling degree between the USFD and green economic development using the improved entropy method, coupling model, kernel density estimation and spatial autocorrelation method, and further analyzes the influence factors with the Tobit regression method. The study found that: 1) During the study period, the development level of USFD and green economy in the YREB showed a fluctuating upward trend, but the development level was still low and there was a large space for improvement. 2) During the study period, the coupling coordination degree of USFD and green economy development in the YREB shows a favorable development trend of fluctuating growth, but it is still in the stage of moderate coupling and coordination development. The coupling degree shows a trend of polarization and the phenomenon of “high-value difference and low-value convergence” over time. 3) The spatial distribution of coupling coordination degree in each region is obviously different, and the middle and lower reaches are significantly higher than the upper reaches, and there are “club convergence” phenomenon and obvious H-H and L-L spatial agglomeration characteristics. 4) Technological innovation, industrial structure and physical capital have a significant positive impact on the coupling degree of the two systems, while human capital has a restraining effect on the growth of the coupling degree. There is heterogeneity in the extent and direction of the influence of each factor on the degree of coupling between the three agglomerations. These findings have significant policy implications for the region to facilitate rational division of labor and coordinated development of the green economy.
Spatial functional division is an essential path to promote regional economic development (Fujita and Tabuchi, 1997), an influential channel to promote spatial optimal allocation of factors (Duranton and Puga 2005), and a critical driver to lead to an optimized and rational industrial spatial layout (Li and Yang 2019). Regional urban systems, formed according to the different levels and scales of cities, are spatial vehicles for the layout of different industries. Urban spatial functional division (USFD) refers to a state in which different industries are spatially distributed to achieve optimal spatial efficiency. The USFD is an essential form of division of labor and cooperation between cities and conveys an influential mechanism of regional collaborative development (Duranton and Puga 2005). At the same time, the development of the green economy has become an inevitable requirement for the sustainable development of society, which provides the SFDU with a development orientation. Green economic development is an economic form based on ecological environmental protection and appropriate and reasonable development of resources to achieve sustainable development (Zhao et al., 2022). Therefore, the coupling and coordinated development of SFDU and green economic development is particularly crucial. The Yangtze River Economic Belt (YREB) is the largest economic belt in China, with the most abundant ecological resources and the strongest potential for development. At the same time, the YREB is also an inland river economic belt with global influence, a coordinated development belt for East-West interaction and cooperation, and a pioneer demonstration belt for ecological civilization along coasts, rivers and borders. YREB has an important mission in promoting high-quality economic development and coordinated regional development in China. However, due to the influence of natural conditions and government administration, the economic development of cities in the YREB has been very different, with severe industrial homogeneity and market segmentation, as well as an unreasonable division of industrial functions. Problems such as the weak foundation of pollution control in the Yangtze River and the heavy task of green economic transformation have existed for a long time (Liu et al., 2020; Lin et al., 2022), which have become bottlenecks restricting the high-quality and coordinated development of the YREB. The USFD is the key engine for the development of a green economy in the new era, and the development of green economy also provides the development foundation and environment for USFD. On the one hand, agglomerative effects, factor flow effects and collaborative governance effects arising from the USFD process have become important drivers for the development of green economy (Hou and Song, 2021; Chen et al., 2022; Cheng and Jin, 2022). On the other hand, the development of green economy provides a material basis for USFD, builds a green environment and promotes its green transformation, and further improves the internal quality of USFD (Perruchas et al., 2020; Bag et al., 2022). Therefore, in the face of the dual strategic goals of achieving regional coordinated development and green economic development in the YREB in the new period, it is of great theoretical and practical value to correctly understand the coupling and coordination relationship between USFD and green economic development, study its spatiotemporal evolution law and analyze its influencing factors.
The USFD is an inevitable stage after economic development reaches a certain level (Duranton and Puga, 2005). USFD refers to the functional division of different cities in a region according to their comparative advantages (Fujita and Tabuchi, 1997). In contrast to the traditional division of labor between departments and products, the USFD is a new type of division based on different nodes of the industrial chain within products, blurring industrial boundaries and breaking spatial constraints. In terms of space, it is the vertical separation of the industrial chain, and in terms of function, it is the differentiation of urban functions (Guo and Ma, 2022). The USFD reflects the spatial layout of different industries to achieve optimal spatial efficiency, which is an important form of labor division and cooperation between cities and conveys an important mechanism for regional cooperative development. In the form of USFD, it is easy for cities to form in-depth division and cooperation of industrial chain, which can effectively promote high-quality development of regional economy (Li and Yang, 2019; Fang et al., 2020). In terms of regional differences, Zhao and Bai (2012) found that the USFD of different regions in China was at a relatively low level, and even showed a downward trend to some extent. The Yangtze River Delta has initially formed a relatively clear pattern of USFD (Ma and Zhang, 2019), but there is still a huge space for growth in most regions. In terms of the economic effects, The USFD is an important approach leading to regional economic growth (Duranton and Puga, 2005; Zhao and Bai, 2012; Rigby et al., 2015). The functional division of labor formed between cities can help avoid industrial isomorphism and repetitive construction, and improve the economic complementarity and resource utilization efficiency between cities (Van Oort et al., 2009). Moreover, USFD helps to strengthen the comprehensive service management function of the central city, and thus has a significant positive spillover effect on the production efficiency of the manufacturing industry in the surrounding area (Otsuka et al., 2010; Yu et al., 2016). In terms of promoting coordinated regional development, Zhao and Wei (2015) pointed out that with the improvement of spatial functional division of labor, regional development gap shows a trend of first expanding and then narrowing, but the convergence effect of USFD in most regions of China has not been brought into play.
The green economic development is an important channel to regional sustainable development and the main path to solve problems linked to economic development, resources, and the environment in the twenty-first century (Zhao et al., 2010). While promoting the further improvement of the regional economy, green development needs to consider the rational allocation of resources and the improvement of the environmental protection quality. The current academic research on green economic development mainly focuses on the measurement of the level of green economic development (Chen et al., 2016; Chen et al., 2018; Li and Ji, 2021), the action mechanism (Li and Wu, 2016; He et al., 2018; Zhang H et al., 2022), and policy proposals to environmental factors (Ma et al., 2019; Yuan et al., 2020), and this helps us to recognize the form of green economic development and the effect mode of ecological environment, while the research on the relationship between green economic development and the driving factors of green economic development is relatively inadequate. This paper studies the interaction between green economic development and USFD in order to promote a virtuous cycle of spatial functional division and green economic development to provide a new promotion for regional sustainable development.
Existing studies on the relationship between USFD and economic development mainly focus on the impact of USFD on economic development, and the research conclusions are not consistent. First, the USFD has a significant role in promoting economic development (Wang and Peng, 2018; Shang and Chen, 2020; Song and Li, 2021). Second, the USFD has a significant non-linear influence on economic development (Su and Zhao, 2011; Qi and Zhao, 2014; Wang et al., 2015; Zhao and Wei, 2015). Only above a certain level can economic development be promoted effectively. Third, the USFD has adverse effects on economic development. For example, the USFD can 1) inhibit the overall efficiency improvement of the region (Lu and Chen, 2009), 2) squeeze the development of sub-central cities in urban agglomerations (Chen et al., 2019), and 3) bring higher land and transportation costs to enterprises (Zhao and Hou, 2019). In addition, a few scholars have studied the impact of economic development on the USFD and found that the level of economic development is an important factor to promote the USFD (Liang, 2004). Through the agglomeration of economic development attracting factors, the crowding effect and competition effect are generated to promote the transfer and agglomeration of industries at different industrial chain levels among cities of different levels, so as to improve the level of USFD. However, the large difference in regional economic development is not conducive to inter-regional industrial division of labor (Bi et al., 2018).
In summary, existing studies have focused on the impact of USFD on economic development, less attention is paid to the impact of USFD on green economic development, and there is a lack of research involving the coupling coordination relationship between the USFD and green economic development. In view of this, this paper takes 108 prefecture-level cities in the YREB as samples to quantitatively measure the coupling coordination level of USFD and green economic development. In this paper, the improved entropy model, coupled coordination degree model, kernel density estimation, spatial autocorrelation model and panel Tobit regression are used to explore the spatial-temporal pattern and evolution characteristics of the coupling degree between USFD and regional green economic development, and reveal the its driving factors. The marginal contributions of this paper are as follows: First, we propose a new metric for USFD, named weighted position entropy variation coefficient, based on an extension of an existing related study. At the same time, an index system to measure the level of green economic development in the city will be constructed. Second, previous studies have focused on single measurements and empirical analysis of USFD or green economic development. Based on measurements of USFD indicators and green economic development levels, we calculate the coupling of the two and analyze their spatial-temporal evolution properties, which enriches the research content of such problems. Third, we explore the drivers of the degree of coupling between USFD and green economy development, which can help facilitate effective decision-making for the coordinated development of USFD and green economy. The results of this paper can provide experience and reference for the green sustainable development of the urban economy in YREB and other watershed economies around the world.
The structure of this paper is as follows: Section 2 is theoretical analysis. Section 3 introduces the methodology and data. Section 4 analyzes the empirical results. Section 5 presents a discussion. Section 6 offers the conclusions.
The USFD is an important driver of green economic development. First, it is driven by the agglomerative effect. Under the USFD model, industries along the value chain form an orderly distribution and reasonable agglomeration among different cities. Cities form leading industries according to their own endowments, complement each other’s advantages and share resources with other cities, reduce adverse competition within the region, avoid homogeneous industrial structure and wasted resources, and improve the reallocation effect of factors and pollution reduction effect (Chen et al., 2022). In the context of digitalization, integrated platform transactions can accelerate the circulation of green products, cultivate residents’ green and low-energy consumption habits, and promote the transformation of urban economic development to a green direction (Zhang H et al., 2022). Second, it is driven by factor flow effect. On the basis of reasonable division of labor, cities in the region can realize free flow of products and factors between regions, and resources can be shared and interconnected within the region to achieve effective allocation (Li, 2019). The gradual promotion of the USFD has facilitated the smooth flow of labor, capital, technology, data and other factors between cities. The inflow of labor promotes green resource matching and knowledge spillover (Zhang J et al., 2022). The free flow of capital provides financial guarantee and incentive for urban green industry development, industrial structure optimization and upgrading, and technological innovation research (Wu et al., 2020). The exchange and sharing of technologies accelerate the diffusion of knowledge and the practical application of green innovation achievements (Zhang L et al., 2022) and promote the collaborative green innovation of upstream, middle and downstream industries. The flow and sharing of data can not only release the huge potential of data elements, give full play to the economic transformation effect and spillover effect of innovation elements, but also facilitate the provision of precise support and improve the efficiency of capital allocation (Wang et al., 2021). The third driving force is the collaborative governance effect. The mechanism of coordination among government departments and uniform policies provides institutional guarantees for the USFD to promote the development of the green economy. On the one hand, eliminating the segmentation of administrative subjects in the policy-making process can smooth the channels of cooperation and sharing among cities under the market mechanism, and promote the agglomeration and complementarity of green industries (Hou and Song, 2021). On the other hand, local governments actively seek cooperation and establish supportive regional benefit-sharing and compensation mechanisms to achieve economic mutual benefit and ecological pollution co-treatment among cities. The vigorous development of China’s digital economy has given rise to an integrated digital platform for public services, which ensures the standardization and security of green factor sharing and green product circulation (Zhang M et al., 2022).
Green economic development provides a good foundation and environment for USFD to grow. One is to provide a material basis. Economic development provides a material basis for USFD development. On the one hand, regions with better green economic development have relatively better infrastructures such as information and transportation, which provide material conditions for USFD. Increasingly frequent connections between regions are conducive to increasing the speed and quality of USFD. On the other hand, the development of the green economy has greatly promoted the deepening of the division of labor and the formation of specialized economy (Perruchas et al., 2020), which provides a material basis and possibility for more population and enterprises to gather in specific regions, and helps to promote the spatial functional division of labor between cities based on the value chain. Second, to build a green environment. The decoupling of economic growth from the costly emissions reductions advocated by the green economy would create an environmentally biased macroeconomic environment for the USFD. In the context of green development, developed cities are continuously enhancing the core competitiveness of green industries and green industrial chains at all levels of the workforce, while underdeveloped cities are actively undertaking industrial transfer from developed cities based on their resources and environmental capacity. The formation of dislocation layout of industrial division of labor division of labor, coordination development (Ding et al., 2022), promoted the USFD intrinsic quality and level of ascension. Third, to promote green transformation. For historical reasons, during the period of rapid economic growth, the Chinese economy mainly adopted a crude development pattern with low USFD, unreasonable urban functional division, repeated construction in different cities, and ecological and environmental pollution caused by overcapacity in some industries in the region. On the one hand, many cities ignore environmental pollution for their own economic gain due to the lack of uniform management and division of labor among cities in the region. In order to ensure that leading industries have more advantages in market competition, some cities blindly speed up the approval and construction of industrial enterprises, adhering to the concept of “pollution first, treatment later,” making the environmental pollution problem increasingly serious (Zhou et al., 2022). On the other hand, many cities in the region share rivers and lakes, and the extensive development of individual cities not only causes severe pollution of their own waters, but also often affects the trans-regional waters of other cities. The development of a green economy, in which green values are embedded in people’s hearts, will encourage enterprises to consciously adopt green innovations and stimulate value chain transformation. As the green model gradually penetrates into all links of the enterprise supply chain, the spatial function division based on the green value chain is gradually constructed among regions (Liao and Li, 2022). The development of environmental ethics, environmental regulations, green suppliers, quality management and the strengthening of absorptive capacity of enterprises based on green economy will have a profound impact on the development of USFD based on value chain in the direction of green development (Yuan et al., 2022).
After clarifying the coupling and coordination mechanism between USFD and green economy development, we further investigate the driving factors for the development of the coupling. The factors affecting the coupling and coordinated development of USFD and green economy are analyzed in terms of external and internal drivers.
External driving forces: First, the environmental governance behavior of governments is an important external factor affecting carbon emissions and high-quality economic development. On the one hand, environmental regulation makes enterprises gradually transforming from low-end manufacturers to high-end designers (Zou and Zhong, 2022), which improves the level of USFD. On the other hand, through the comprehensive effect of “innovation compensation” and “cost effect,” it has a linear, nonlinear or spatial spillover impact on the development level of green economy (Zhao et al., 2022). Second, technological innovation capacity is seen as an endogenous driver for energy conservation, emission reduction and economic efficiency improvement. It not only promotes the development of the green economy by innovating production technology, developing clean energy and improving resource utilization efficiency (Talebzadehhosseini and Garibay, 2022), but also promotes the functional division of labor between regional central cities and non-central cities (Liao and Li, 2022). Finally, in terms of the degree of regional opening-up, on the one hand, trade diffusion has become one of the reasons for the development of the green economy due to the proposed “carbon tariff” and the intensification of the contradiction between trade activities and the environment. On the other hand, opening to the outside world forms the local independent innovation capacity through the technological spillover effect, which makes the status of the regional value chain rise continuously and promotes the quality of USFD (Pleticha, 2021).
Internal driving forces: First, there is a strong link between physical capital and the USFD and the development of the green economy. On the one hand, transportation and other infrastructure can effectively improve industrial agglomeration (Liu et al., 2022), thus promoting the level of USFD. On the other hand, the accumulation of physical capital, especially the improvement of the level of new information-based capital, has a crucial impact on the development of the green economy. Second, human capital is the key and primary vehicle for achieving low-carbon transformation and economic development. While promoting economic development to achieve endogenous growth, demographic dividend also has significant spatial spillover (Zhong and Li, 2010). In addition, with the accumulation of human capital, it provides strong talent support for the functional division of labor based on the value chain, which helps to improve the level of USFD (Ding et al., 2022). Finally, the evolution of industrial structure not only reflects the optimization of the mode and pattern of regional industrial division of labor, but also the adjustment of industrial structure has become one of the considerable measures to vary the industries with high energy consumption and high pollution (Li et al., 2022).
Figure 1 summarizes the coupling coordination relationship and driving mechanism between USFD and green economic development.
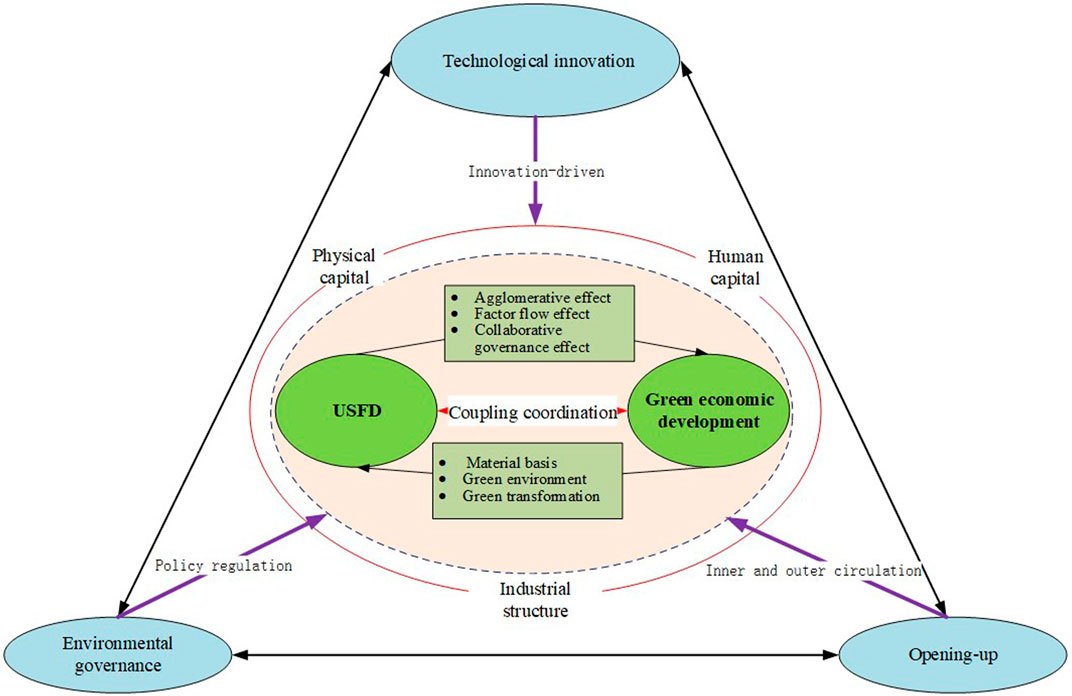
FIGURE 1. Coupling coordination relationship and driving mechanism between USFD and green economic development.
At the regional level, industrial chain-based USFD is reflected in cross-industry chain cooperation between different cities based on comparative advantages, and the pattern of urban division corresponding to industrial chain level and city level is gradually forming. In other words, big cities are mainly responsible for research and development, design, marketing management, and after-sales of products. While medium-sized cities are mainly responsible for transport, logistics and high-tech manufacturing, small and medium-sized cities are mainly responsible for specific manufacturing and other functions. The USFD is characterized by typical stratification, but the existing measurement methods mainly include functional space index, specialized division index, location entropy, and Gini coefficient (Liang, 2004; Yin, 2006; Song et al., 2013). On the one hand, these methods do not clearly reflect the hierarchical character of the division of labor, nor do they truly reflect the level of the USFD. On the other hand, the division of labor between cities can only be compared pairwise, which does not reflect the degree of division of labor among multiple cities. Therefore, based on the mentioned related studies, in this paper, we propose a metric named weighted location entropy variation coefficient method that can effectively measure the level and depth of USFD. The basic ideas are as follows: Firstly, the manufacturing industry and producer services involved in the USFD are divided into low, medium, and high levels according to the value-added level and technology intensity of the industrial chain and value chain, and the location entropy of each city in the industries at each level is calculated as follows:
Where,
Second, to reflect the hierarchical structure, we calculate the weighted location entropy index for each city by assigning 0.5, 0.3, and 0.2 to each level, in order from highest to lowest.
Where, j = 1, 2, and 3 respectively represent the low, medium and high levels of the industry within the industrial chain.
Finally, according to the above analysis, the industrial class corresponds to the urban class in the rational USFD model. That is, higher-level cities mainly cluster more high-end industrial value chains, while lower-level cities mostly cluster more low-end industrial value chains. Therefore, if the USFD is well implemented among the cities of a certain region, the degree of agglomeration of the various subdivisions in the industrial chain will be very different from one city to another. If the coefficient of variation is used to measure the difference, the coefficient of variation for the industrial sector of the city will be large. In other words, if the USFD level in a region is higher, the coefficient of variation of the weighted location entropy index between cities is larger, and vice versa. Therefore, in this paper, we refer to the weighted inter-city location entropy index as the depth index of the USFD and use this index as a proxy variable for the USFD level. The specific measurements are as follows:
Where,
There are two categories of existing measures of high-quality economic growth levels. One is to use a single metric, such as total factor productivity, to measure it. The second is to establish a comprehensive evaluation index system based on the concept of high-quality development. Considering that a single index cannot reflect the quality of regional economic development comprehensively, this paper constructed the evaluation index system of green economic development (Table 1) combined with the development characteristics of the YREB and availability of data based on the existing research results (Shi and Zhang, 2019; Liu, 2020; Zhou and Ye, 2020).
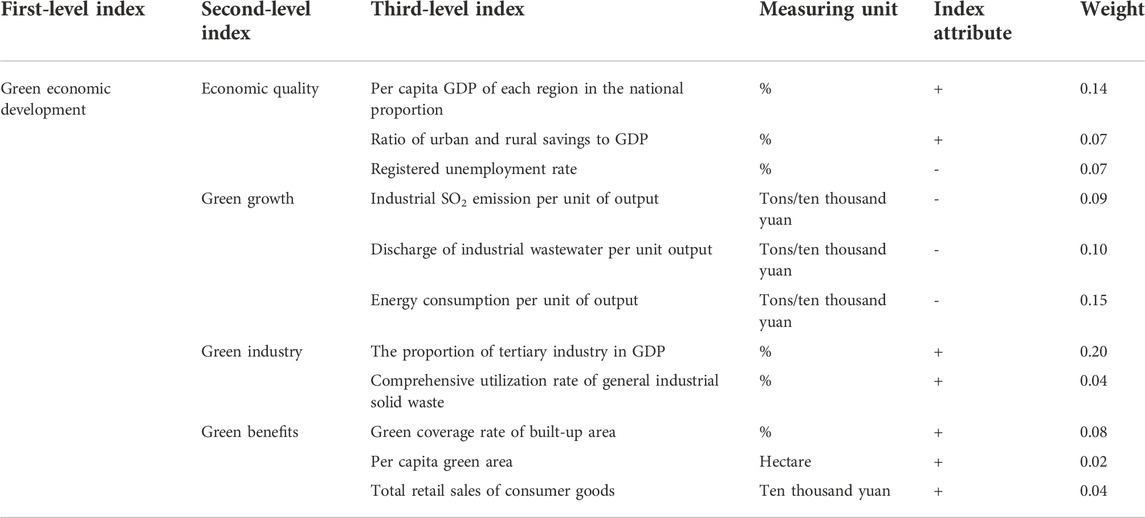
TABLE 1. The evaluation index system for green economic development.
Draw on relevant research (Yang and Sun, 2015), the improved entropy weight method is used to assign weights to each index, and the comprehensive score after the index weighting is taken as the proxy variable of the green economic development of city. The specific measurements are as follows:
Where,
Refer to previous studies (Ying et al., 2021; Mealy and Teytelboym, 2022) and driving mechanism analysis, this paper analyzes the coupling and coordination of USFD and green economic development in the YREB in terms of external and internal driving factors. The main driving factors are as follows: 1) Environmental regulation (ER), measured using the average concentration of PM2.5. 2) Technological innovation (TE) measured by the ratio of regional R&D expenditure to fiscal expenditure. 3) the opening to the outside world (OP), using the region accounts for the total amount of the actual use of foreign capital the proportion of GDP to measure. 4) physical capital (PC) measured by the material capital stock per capita. 5) human capital (HC) measured by the density of the population. 6) Industrial structure (IN) measured by the ratio of the gross product of the tertiary industry to the secondary industry.
Specific types of developmental level models include both linear and nonlinear forms. To be closer to the actual situation, this paper referred to the research of relevant scholars (Lu and Zhou, 2013), assumed that the level function of USFD and green economic development was strictly concave and returns to scale remain unchanged, and set the model form as follows:
Where,
Draw on the research of relevant scholars (Liao, 1999; Li et al., 2012), this paper constructed the coordination degree model of USFD and green economic development, as follows:
Where,
To avoid the “illusion” of a city with low development level but high coordination degree, a coupling degree model was established to comprehensively investigate the development level and coordination degree of USFD and green economic development. The calculation formula is as follows:
Draw on relevant research experience (Li et al., 2012), combined with the actual situation of the YREB, the coupling coordination degree are divided into four stages according to the corresponding numerical interval: (0,0.3) is the primary coupling coordination, (0.3, 0.5) is the intermediate coupling coordination, (0.5,0.8) is the advanced coupling coordination, (0.8,1) is the extreme coupling coordination.
Kernel density function is a nonparametric estimation method with strong robustness and weak dependence of data distribution (Silverman, 1998), and widely used in the study of agglomeration state of spatial regional distribution.
The value of kernel density function has a positive correlation with the degree of agglomeration of spatial variables. In this paper, we use the kernel density function to analyze the spatial distribution and variability of the coupling between USFD and green economic development, and the kernel density curve to reflect its dynamical characteristics. The basic formulation of the kernel density function is as follows.
Where,
To further reflect the spatial correlation degree and types of the coupling degree between USFD and green economic development in the YREB, this paper adopted global spatial Moran’s Index (GMI) and local spatial Moran’s Index (LMI) to analyze the global and local spatial autocorrelation of the coupling degree. The formula for the calculation is as follows:
Where,
The Z-test was used to test the statistical significance of the two spatial indices, and the Z-statistic was calculated using
In this paper, we additionally explore the influence of the degree of coupling between USFD and green economy using the panel Tobit model. Since the degree of coupling is used as a dependent variable, the conventional OLS model may lead to biased and inconsistent parameter estimates. The Tobit model in the dependent variable restricted model solves this problem efficiently (Su and Zhang, 2020). The standard panel Tobit model is as follows.
Where,
Considering the research questions and the need for data availability, we selected 108 prefectural-level and above cities in the YREB from 2009 to 2019 as the study subjects. We excluded Bijie and Tongren due to lack of data and removed Chaohu due to administrative zoning adjustments in 2011. The above variable data were mainly from the “China Urban Statistical Yearbook (2010–2020),” “China Statistical Yearbook (2010–2019),” the municipal “Statistical Yearbook,” “Statistical Bulletin,” and CSMAR database in China. We supplemented some of the missing data with a moving average and corrected the outliers with a single query or averaging. We normalized the metrics using the Min-Max method.
Figure 2 shows the measured results of USFD and green economic development of cities in YREB from 2009 to 2019. It can be seen that both the level of USFD and the level of green economy development showed an overall upward trend, but the level of USFD fluctuated a lot. The USFD had been on a sharp upward trend since 2016. This is because in 2016, the State Council issued “the outline of the YREB Development Plan,” which proposes an innovative regional coordinated development strategy. Cities in the region have accelerated cooperative development mode and maintained close strategic cooperation, giving full play to the radiating effect of synergistic development, thus rapidly raising the level of USFD. The level of the green economic development index was close to that of the USFD index. However, both indices were significantly lower, indicating that the level of urban green economic development and USFD in YREB needs to be further improved. While promoting high-quality economic development, the city needs to focus on improving the level of USFD, raising the level of inter-city industrial chain cooperation, and jointly promoting high-level coordinated development of industrial sectors and green economic development.
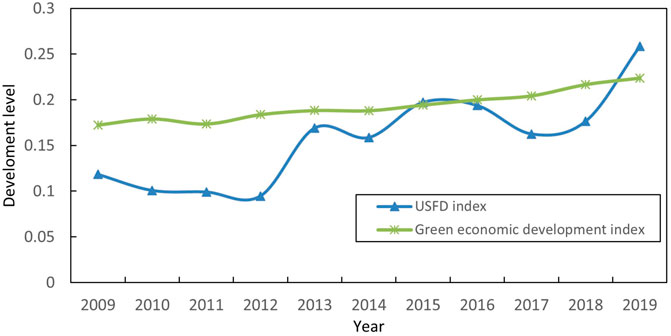
FIGURE 2. The level of USFD and green economic development in the YREB from 2009 to 2019.
Figure 3 reports changes in the level of USFD and green economic development in the three major urban agglomerations of YREB from 2009 to 2019. The development of USFD and the green economy in the three urban agglomerations showed an obvious upward trend. The green economic development of the three urban agglomerations showed an obvious hierarchy. The green economic development level increased successively in the Pan-Yangtze River Delta urban agglomerations, the middle reaches of the Yangtze River, and the Pan-Chengdu-Chongqing urban agglomerations, and the green economic development level of the Pan-Yangtze River Delta urban agglomerations was apparently higher than the other two urban agglomerations. The Pan-Yangtze River Delta urban agglomeration has achieved the highest level of green economic development, relying on the dual advantages of location and policy to take the lead in achieving a win-win situation of economic growth and environmental protection. The middle reaches of the Yangtze River benefit from superior environmental quality, resulting in high levels of green development. Due to the dual constraints of the economic environment, the economic size of the Pan-Chengdu-Chongqing urban agglomeration is smaller than that of the lower and middle parts of the region, and there is a wide gap in technological innovation, capital utilization efficiency and leading industries.
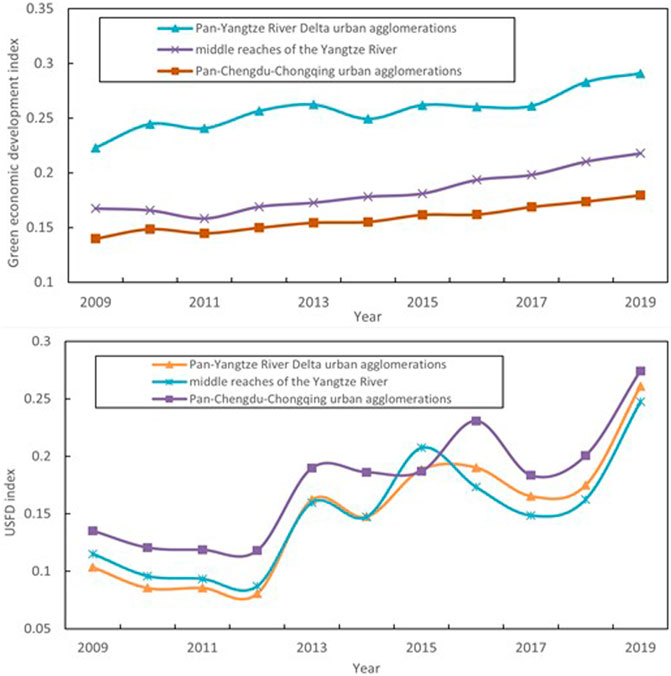
FIGURE 3. The level of USFD and green economic development in the three urban agglomerations in the YREB from 2009 to 2019.
The hierarchical relationship of the USFD level in the three urban agglomerations were not obvious. On the whole, the level of USFD in the Pan-Chengdu-Chongqing urban agglomerations was the highest, followed by the Pan-Yangtze River Delta urban agglomerations, and the middle reaches of the Yangtze River urban agglomerations was the lowest. The above phenomenon may be due to the influence of administrative intervention factors such as regional protection and development planning, which hinders the formation of a reasonable and effective USFD among cities to a certain extent. Improving the USFD level of the YREB is a key task for future coordinated development policies for regional industries.
Figure 4 shows the changes in coupling degree and coupling coordination degree of USFD and green economic development from 2009 to 2019 in YREB. From the perspective of coupling degree, during the sample period, the coupling degree was in the range (0.7,0.9) and showed a fluctuating upward trend, indicating that there is a high degree of synergy between the USFD and the development of the green economy in the YREB, and the level of synergy between the two is constantly increasing. The trends of the coupling and the coupling coordination were consistent, but the coupling coordination was significantly lower than the coupling, indicating that the USFD and green economic development in YREB are in the low-coupling phase and the effective synergistic relationship between the two needs to be improved.
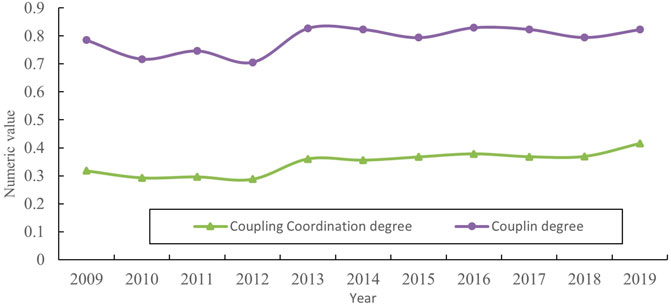
FIGURE 4. Coupling degree and coupling coordination degree of USFD and green economic development in the YREB from 2009 to 2019.
From the point of view of coupling coordination, the USFD and green development in the YREB did not have high coupling coordination on the whole. During the sample period, the coupling coordination between USFD and green development showed a positive trend of fluctuating growth, with the overall coordination level continuously improving, rising from 0.318 in 2009 to 0.415 in 2019, an increase of 30.68%. The coupling and synergistic effect between the USFD and the development of the green economy in YREB is continuously improving, which is related to China’s policy guidance in recent years on regional coordinated development, Beautiful China and the ecological civilization building demonstration belt. It is worth noting that there was a clear rise in coupling coordination after 2013. The possible reasons for this phenomenon are the State Council’s 2014 guidance on relying on the Golden Waterway to promote the development of the YREB, such as the release of a policy document, and the deepening of industrial divisions, combined with the economy growing around and the advancement of the concept of green development. The YREB further raised the requirements for industrial division and cooperation between cities, the quality of economic development and the quality of the ecological environment, and the level of USFD was gradually raised, the input-output structure of economic development was also becoming more rational, which makes the coupling and coordination of the two significantly improved.
In this paper, we used Matlab 2019 software to draw the Kernel density curve (Figure 5) of coupling coordination degree between USFD and green economic development in the years 2009–2019 in order to further reflect the temporal evolution characteristics of the two. From the full sample, the shape of the curve changed from a single peak to a slightly multi-peaked one, indicating an enhanced polarization evolution trend for the intercity coupling, which favors the formation of more high-value regions. These high-value cities should strengthen inter-regional cooperation, re-optimize resource allocation and form core areas with radiation and driving forces. The kurtosis of the curve gradually changed from “sharp peak” to “flat peak” and the peak height showed a decreasing trend, indicating that the coupling extreme value of USFD and green economic development in the YREB was decreasing, and the maximum gap of imbalance between cities was gradually decreasing. In terms of the position of the curve, on the one hand, the right tail of the curve gradually extended outward, while the change of the left tail was not obvious, indicating that the coupling value has the phenomenon of “high-value difference and low-value convergence,” that is, the high-value area of the coupling degree fluctuates greatly, and the low-value area is relatively stable. On the other hand, since 2015 the position of the curve had gradually shifted to the right, indicating that the coupling between USFD and green economic development in the YREB shows an increasing trend, in agreement with previous analyses. The possible reason is that since the YREB became a national strategy in 2014, economic and industrial development has been of great importance. The city has been focusing on improving the quality of its economy and optimizing and upgrading its industrial structure, while strengthening industrial ties and cooperation between the cities, which has enhanced the synergy between USFD and green economic development.

FIGURE 5. Kernel density estimation of coupling degree between the USFD and green economic development in the YREB and three urban agglomerations.
From the perspective of urban agglomerations, the curve position of Pan-Yangtze River Delta urban agglomeration and the middle reaches of the Yangtze River first moved to the left and then to the right, indicating that the coupling and coordination degrees of the two urban agglomerations decline first and then increase during the sample period. The location of the curve of the Pan-Chengdu-Chongqing urban agglomeration shifted first to the right and then to the left, indicating that its coupling has been on a downward trend in recent years. The development of the USFD in the Pan-Chengdu-Chongqing urban agglomeration had not matched the development of the green economy, and the two have not yet formed a favorable situation for synergistic interaction. With the exception of the Pan-Yangtze River Delta urban agglomeration, the peak-to-peak variation of the curves was less pronounced in the other urban agglomerations. The kurtosis decline means that the number of cities with low-level coupling coordination is decreasing and the structure of the number of cities with coupling coordination between USFD and green development is becoming more reasonable. The blocked decline of kurtosis indicates that the improvement of coupling coordination level of urban agglomeration in the middle reaches of the Yangtze River and Pan-Chengdu-Chongqing urban agglomeration has fallen into the trap of Matthew effect, and it is difficult to get out of the embarrassing situation of continuous low level with its own development. In this regard, the urban agglomeration in the Pan-Yangtze River Delta should give full play to its radiating and driving role, improve the efficiency of knowledge transfer, and promote the improvement of YREB coupling and coordination from the technical level. The urban agglomerations in the middle reaches of the Yangtze River and the Pan-Chengdu-Chongqing urban agglomeration should also actively seek new convergence points for the USFD and the green economy and improve the endogenous drivers of coupling coordination level.
Figure 6 shows the spatial distribution of the coupling between USFD and green economic development for the 2009 and 2019 YREB. In 2009, most of the cities were in the primary coupling stage (0.42) and intermediate coupling stage (0.65), and only Lianyungang was in the higher coupling stage. The cities in the primary coupling coordination were mainly concentrated in three regions: coastal cities along the Yancheng-Suzhou-Shanghai-Wenzhou line, Shiyan-Jiangmen-Huangshi-Nanchang-Fuzhou line, and Ziyang-Neijiang-Guiyang-Qujing line. Distribution in other cities was more sporadic. The spatial pattern of the couplings was considerably improved and optimized in 2019 compared to 2009. The mid-tier cities dominated, accounting for 81 percent of the total. In addition, the cities of Hangzhou, Shanghai, Changzhou, Ningbo, Jinhua, Hefei, Ganzhou, Wuhan, Changsha, Chengdu, Guiyang and Kunming were newly added to the list of cities with higher coupling capabilities. The primary coupling cities included only Wuxi, Suzhou, Wuhu, Shiyan, Guangyuan, Neijiang, Anshun and Lincang, all of which were scattered. In general, cities with high coupling types were mainly located in provincial capitals and upstream cities with strong economies. These cities have clear advantages in terms of economic and resource endowments and relatively high USFD levels. While focusing on the quality of green economic development, local governments have also paid more attention to deep labor division and cooperation among cities based on industrial chains. The rational division of industrial chains has led to greater efficiency and quality in green economic development. In addition, the city has a high degree of openness to the outside world and the flow of factors between cities is relatively smooth, which raises the level of USFD and thus shows a high degree of coordination between USFD and green economic development.
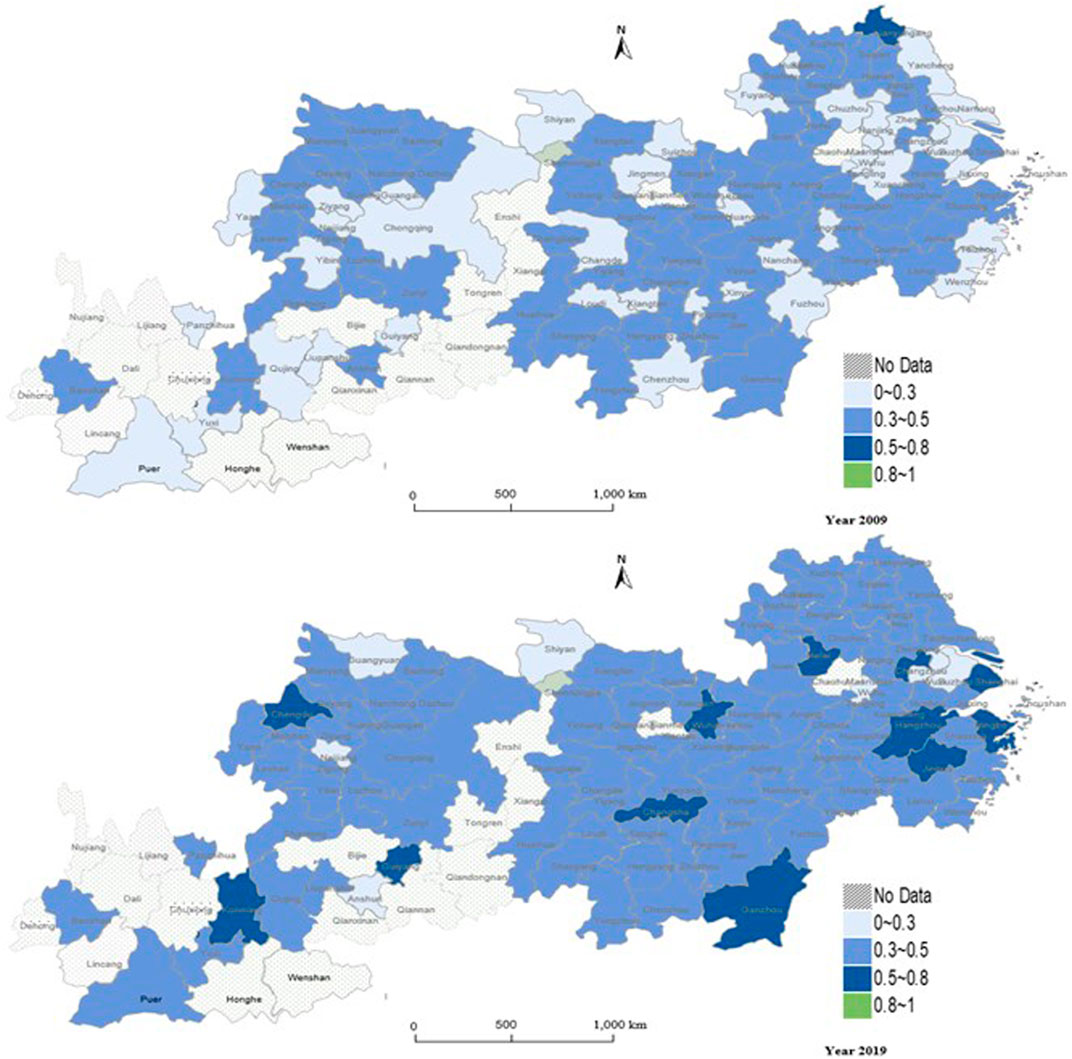
FIGURE 6. Spatial distribution of coupling degree between the USFD and green economic development in the YREB in 2009 and 2019.
The primary coupling cities have both developed cities in the upper reaches and backward cities in the middle and lower reaches, which may have two different urban development logics. First, cities with a higher economic development foundation may adopt a large and comprehensive development mode in industrial composition in pursuit of green economic development, and there is less division of industrial chain between regions, which makes the level of manufacturing and producer services not obvious in the city, resulting in a low level of USFD. The lower level of USFD and the higher level of green economic development produce a lower degree of coordination and development, and eventually form a lower degree of coupling between USFD and green economic development. Second, for cities with relatively backward economic development, there is less functional division of labor compared to other cities that are limited by geography and resource endowments. The lower level of USFD reduces the speed and level of economic development, resulting in a lower degree of coupling with green economic development.
In summary, the spatial distribution patterns of all coupled coordination types in the middle and upper reaches of the YREB were relatively stable, but some cities still had large fluctuations. Over time, the coupling in the middle and lower reaches of the Yangtze increases significantly and was higher than in the upper reaches, and the spatial “club convergence” phenomenon of coupling degree was obvious. The coupling degree distribution of USFD and green economic development among cities presented spatial agglomeration. Therefore, in this paper, we adopted the spatial correlation analysis to further analyze the evolution properties of spatial agglomerations and differences.
Table 2 reports the global spatial autocorrelation test results of the coupling degree between USFD and green economic development. We created spatial distance weight matrices for the 108 cities in the YREB using urban latitude and longitude data and performed global spatial autocorrelation tests according to Eq. 13. Table 2 showed that the global spatial Moran’s I of the USFD and the coupling degree of green economic development in the YREB from 2009 to 2019 were all positive, and passed the significance test at 1% level, indicating that there is a strong positive spatial correlation between the coupling degree of the USFD and green economic development among cities. The spatial agglomeration of coupling degree in the region was obvious. From the perspective of time, the global Moran’s I value of the coupling degree between USFD and green economic development had fluctuated slightly over the past decade, with maximum and minimum values of 0.23 and 0.192 in 2012 and 2018, respectively.
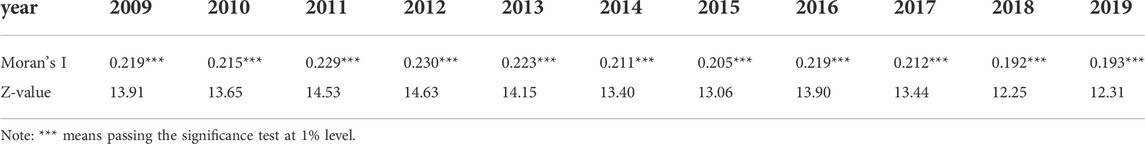
TABLE 2. Global spatial Moran’s I and the test results between the USFD and green economic development.
Figure 7 shows plots of the Moran scatter for 2009 and 2019. The horizontal axis is the value of the normalized coupling and the vertical axis represents the normalized weighted lag value. Based on the corresponding mean values, the graph is divided into four quadrants corresponding to the four types of coupling between cities: high-high (H-H), low-high (L-H), low-low (L-L) and high-low (H-L). Figure 7 showed that most of the points were distributed in the first and third quadrants, and the coupling between USFD and green economic development among cities in YREB was mostly of the H-H or L-L agglomeration type, which further confirms the positive agglomerative character of the inter-city coupling.

FIGURE 7. Moran scatter plots of coupling degree between the USFD and green economic development in 2009 and 2019.
Table 3 shows the spatial correlation type statistics of the coupling between USFD and green economic development. The number of “H-H” type cities accounted for the highest proportion of 40.74% in 2009, followed by “L-L” cities accounting for 35.19%, “L-H” and “H-L” cities accounted for 24.07% in total. In 2019, the type of “H-H” and “L-L” cities accounted for 36.11% and 38.89%, and the type of “L-H” and “H-L” cities accounted for 25%. During the decade, the distribution of city types was generally stable, with an increase in the proportion of “L-L” and “L-H” cities and a decrease in “H-H” and “H-L” cities. The non-uniform distribution of coupling degrees further suggests that the coupling between USFD and green economic development is spatially dependent: cities with close geographical locations will exhibit clustering, and cities with high coupling between USFD and green economic development will be spatially closer. At the same time, cities with a low coupling between USFD and green economic development will also be spatially closer.
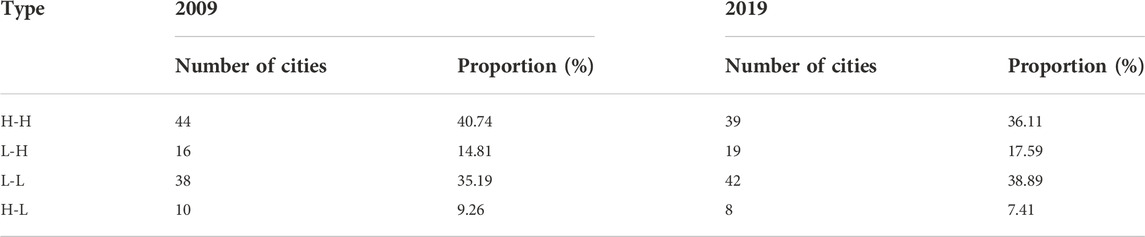
TABLE 3. Spatial correlation type statistics of coupling degree between the USFD and green economic development.
Figure 8 shows the local spatial correlation map of the coupling between USFD and green economic development. It was evident from Figure 8 that H-H and L-L cities were mainly concentrated in the lower and middle reaches of the Yangtze River, while H-L and L-H cities were mainly concentrated in the upper reaches of the Yangtze River. Over the past decade, the coupling between USFD and green economic development in YREB had shown clear spatial clustering and evolutionary features. Among them, H-H and L-L cities were clustered in large numbers, H-H cities shrank slightly and L-L cities grow slightly, while H-L and L-H cities showed a decentralized evolutionary state over time and were mostly distributed around L-L cities. Specifically, the coupling between USFD and green economic development in the YREB from 2009 to 2019 resulted in the formation of two types of relatively stable agglomeration areas. First, the central high-value cluster area was centered on Shanghai, Hangzhou and Nanjing and includes the surrounding cities of Jiaxing, Ningbo, Suzhou, Shaoxing, Jinhua, Huzhou, Xuancheng, Changzhou, Yangzhou, Zhenjiang, Chuzhou and Ma’anshan. Second, low-value belt agglomeration regions formed by cities in northern Hubei and most cities in Sichuan and Yunnan provinces. The reason for the formation and evolution of different types of spatial agglomerations is closely related to the rationalization of the allocation of regional elements caused by the USFD and the spatial radiation and spatial spillover effects of green economic development. In comparison, the coupling degree of USFD and green economic development between cities in the middle and lower reaches of the Yangtze River is higher, and the spatial radiation and spillover effect between cities are higher, gradually forming H-H-shaped cluster area, while the cities with high coupling degree and neighboring cities with low coupling degree will form L-H-shaped cluster area. In the upper reaches of the Yangtze River, the coupling degree of USFD and green economic development between cities is low, and the spatial radiation and spillover effect between cities are low, gradually forming L-L agglomeration areas. Cities with low coupling degrees and neighboring cities with high coupling degrees are prone to evolve into H-L regions.
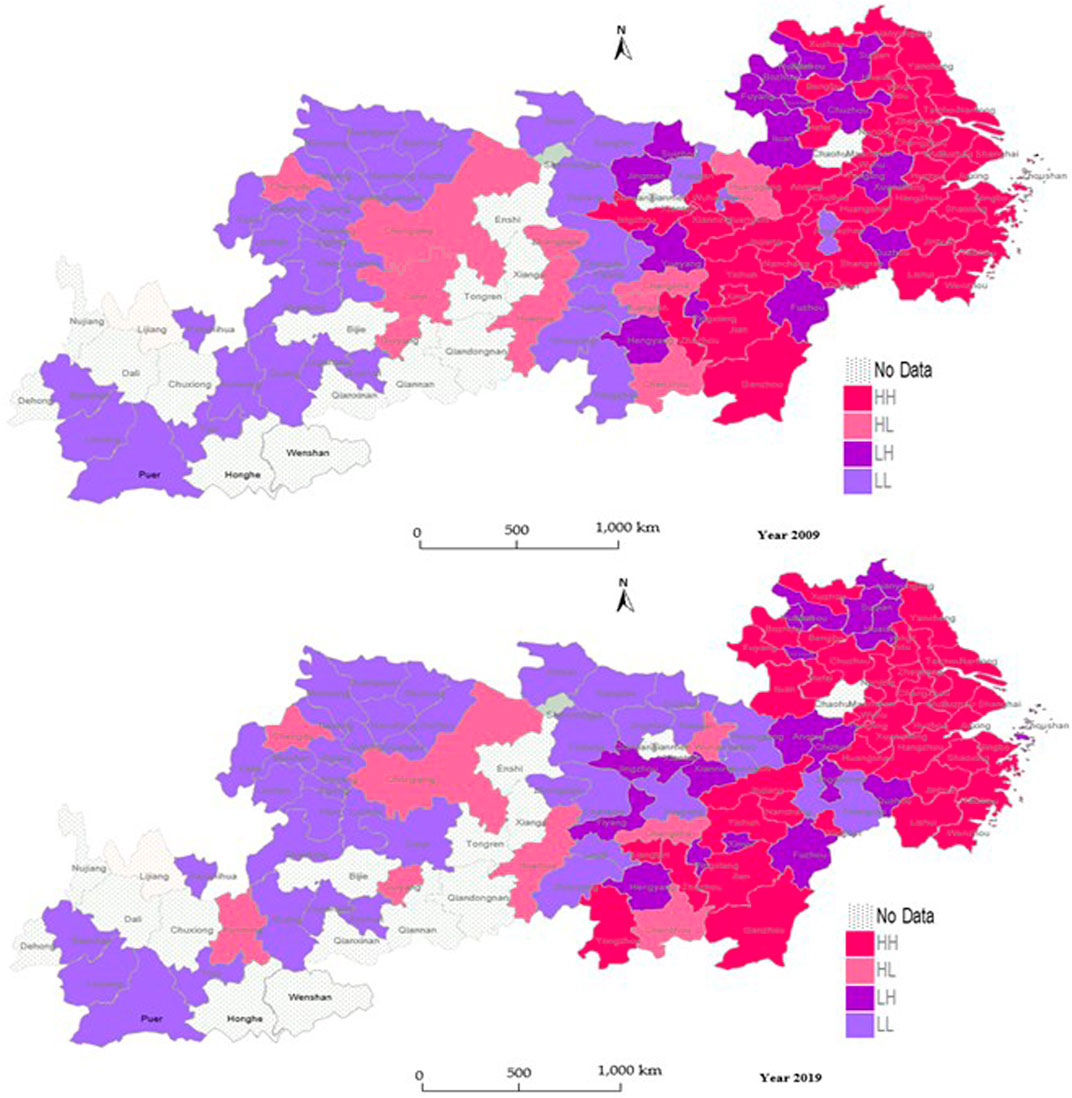
FIGURE 8. Local spatial correlation diagram of coupling degree between the USFD and green economic development in the YREB in 2009 and 2019.
Table 4 reports the impact of the six explanatory variables of environmental regulation, technological innovation, opening-up, population density, industrial structure and physical capital on the coupling between USFD and green economic development. In order to enhance the robustness of the results, Table 4 lists the regression results of the fixed effect model (FE), the random effect model (RE) and the Tobit model respectively. It can be seen that the regression coefficients for each variable in the three models are in general agreement, indicating that the regression results are robust.
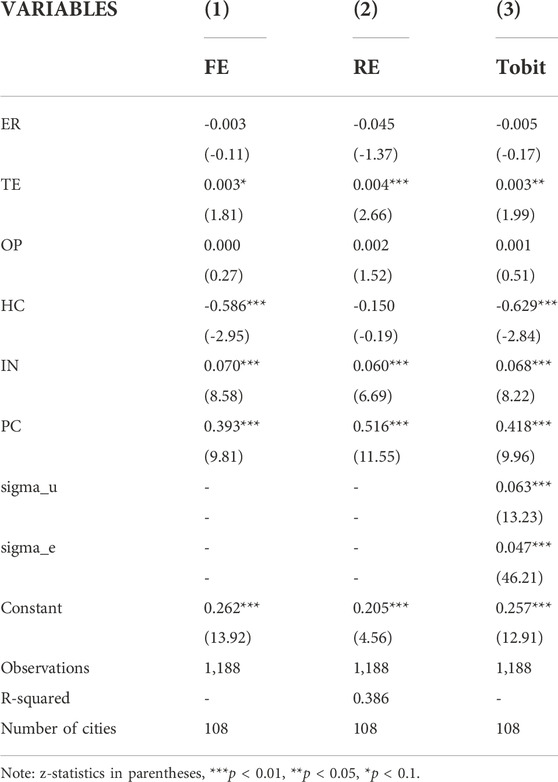
TABLE 4. The regression results for each factor on the degree of coupling coordination between USFD and green economic development in YREB.
In general, the coefficients of technological innovation, industrial structure, and physical capital all had a positive effect on the degree of coupling. However, human capital had a negative effect on the degree of coupling. The influence of other factors on the degree of coupling was not significant.
Specifically, the impact coefficient of environmental regulation was negative, indicating that environmental control can promote the coordinated development of the USFD and the green economy. A strict environmental control system will enable enterprises to increase the cost of pollution control and technological innovation, and raise the level of green production. At the same time, it can suppress the “pollution refuge effect” in non-central cities and improve the quality of USFD. However, the coefficient of environmental regulation was not significant in all three models, indicating that the synergistic development effect of overall environmental regulation on USFD and green economy in YREB is not yet evident. The coefficient of technological innovation was significantly positive, indicating that the innovation drive has given full play to the central role of technological innovation in low-carbon economic growth through channels such as research and development in clean energy and innovation in machinery and equipment. It promotes the development of the green economy under the “innovation compensation” effect, and at the same time improves the regional industrial layout and optimizes the USFD. The opening-up to the outside world has had a positive effect on the degree of coupling and coordination, indicating that adherence to regional opening-up and increasing inter-regional trade activities remain important means for the coordinated development of the green economy and the division of labor in regional industrial chains in the YREB. The coefficient of human capital was significantly negative, indicating that the high population density in YREB can bring sufficient labor to the region and stimulate consumption, but it can also increase energy consumption and pollution emissions. At the same time, the higher the population density, the higher the degree of misallocation of resources, which is detrimental to rational allocation of functions among cities. The influence of industrial structure was significantly positive at the level of 1%, indicating that as the industrial structure is optimized and upgraded, the functional division of labor among cities is deepened, the intensity of pollutant emissions is reduced, and the level of green economic development is improved. The coefficient of physical capital was also significant at the 1% level, indicating that physical capital remains an important material basis for the development of the green economy and the USFD.
The YREB spans three major regions in the east, middle and west, and the natural and economic conditions in the upper, middle and lower reaches of the river vary widely, resulting in unbalanced regional development. In this context, the driving factors for the degree of coupling between USFD and green economy will also be different. To this end, in this paper, we performed a regional heterogeneity analysis in which the middle and lower reaches of the YREB were estimated using the Tobit model, respectively. The results are shown in Table 5. It can be seen that the main drivers of the degree of coupling in Pan-Yangtze River Delta urban agglomerations were environmental regulation, human capital, industrial structure and physical capital. First, the relatively high intensity of environmental regulation in cities of Pan-Yangtze River Delta urban agglomerations has a more pronounced effect on the development of green industries and the clustering of high-end value chains, effectively enhancing the coupling between USFD and green economy. The cities in Pan-Yangtze River Delta urban agglomerations are more attractive to talent and have the highest population density in the YREB. Too high population density is not conducive to a reasonable mobility of factors, which brings many environmental problems and hinders the development of a green economy. Secondly, the upgrading effect of the industrial structure of Pan-Chengdu-Chongqing urban agglomerations is more significant and always at the forefront, which plays a more visible role in promoting the development of the green economy and USFD. Finally, the cities in Pan-Yangtze River Delta urban agglomerations have stronger physical capital and better infrastructure, laying a solid foundation for the development of the green economy and the functional division of labor among cities. The driving factors for the degree of coupling in the middle and upstream regions were relatively consistent and include mainly technological innovation, human capital, industrial structure and physical capital. This indicates that the main tasks of cities in the upper and middle reaches of the region are to improve the level of technological innovation, optimize industrial structure, increase fixed asset investment, develop green economy, and coordinate the layout of industrial chains in cities driven by endogenous factors. In addition, the coefficient of human capital was significantly positive, indicating that the current population density in the upper and the middle reaches of the Yangtze River of the region is too low to be attractive to talent, and that it is necessary to further increase the level of agglomeration of human capital.
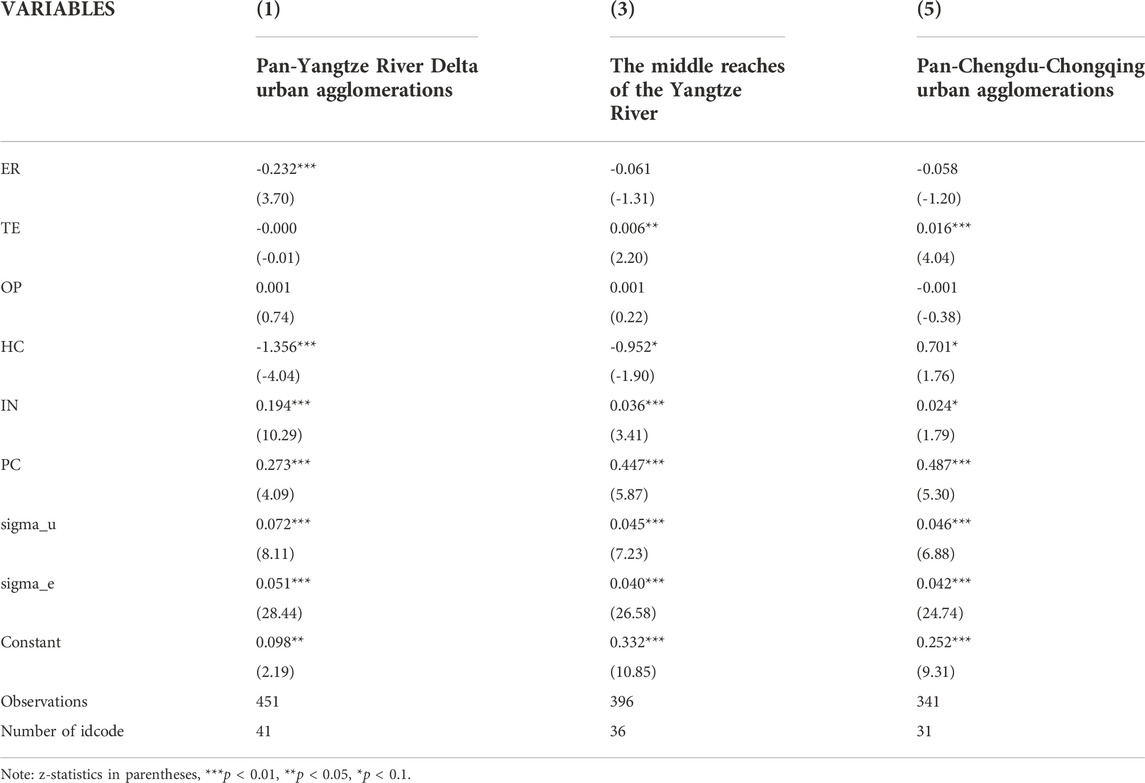
TABLE 5. Results of heterogeneity analysis.
In this paper, we comprehensively use various coupled and spatial-temporal effect models to measure and analyze the coupling between USFD and green economic development in YREB, providing an empirical basis for green sustainable development in USFD process of YREB. Compared with existing studies that measure USFD separately (Song et al., 2013; Otsuka et al., 2010) and green economic development (Li and Ji, 2021; Zhang and Li, 2022), or analyze the relationship between the two from the perspective of unidirectional impact of USFD on green economic development (Ding et al., 2022; Chen et al., 2022). Based on the perspective of coordination and interaction, this paper systematically measures the spatial-temporal differentiation, dynamic evolution and spatial effect of USFD and green economic development, analyzes the driving factors of coupling between them, and can grasp the development law of them at the regional city level more comprehensively and systematically. Therefore, as to break through the dilemma of “homogenization phenomenon” of industry (Liu et al., 2020) and the realization of urban green and high-quality development to provide a reasonable reference.
Overall, the levels of USFD and green economic development in YREB show a clear trend of improvement, and their levels of development, coordination and coupling also increase during the fluctuation. Coupled and coordinated urban types are in the majority, considerably higher than uncoupled and incongruous urban types, and show a clear upward trend. From the point of view of the time series evolution trend, the kernel density curve changes from a single peak to a slightly multi-peaked one, indicating that the coupling between USFD and green economic development in YREB tends to change toward a polarized state. The wave pattern becomes broader, indicating that the limiting difference in the coupling between the cities becomes smaller. The tendency of the waveform to shift to the right is evident, and the double tail is slightly longer, indicating that the overall coupling between USFD and green economic development in the YREB continues to rise. Improving USFD and green economy levels remains a key element of YREB’s future high-quality development. The possible reason lies in the fact that the downstream region has become a highly developed region for the USFD and the green economy due to its sound economic foundation, geographical location and strength of innovation, and is a major force leading the regional development of YREB. As the USFD in the YREB continues to deepen, manufacturing industries with relatively high pollution levels have successively shifted from downstream areas to businesses in the middle and upper reaches of the river, raising the USFD levels while inhibiting their green economy levels. As a result, the level of coupling and coordination between USFD and green economy is significantly lower in the middle and lower reaches of the YREB than in the lower reaches. But with the growing popularity of the green development concept, especially with the development of the YREB into a national strategy, the level of USFD and overall green economic development has greatly increased, and the coupling regional differences have narrowed.
According to the results of this paper, the Yangtze River Delta region and the vital provincial capital cities in the middle and lower reaches of the river belong to regions with high coupling coordination between USFD and green economic development. Apart from some growth poles or core regions with excellent coordination, regions with low coordination are mainly located in the central and western regions and some contiguous mountainous and non-riverside regions. Some of these areas lack the necessary development base (Li, 2019), resulting in low USFD levels that affect the development of the green economy. Some places are still following a broad development model, ignoring the importance of the ecological environment (Liu et al., 2020).
From the spatial point of view, the spatial pattern of urban coupling in the YREB is relatively stable, with large fluctuations in some cities and a distinct agglomerative character of the spatial distribution. The coupling degree of Pan-Chengdu-Chongqing urban agglomerations and the middle reaches of the Yangtze River is significantly higher than that of Pan-Yangtze River Delta urban agglomerations, and the spatial “club convergence” phenomenon of coupling degree is obvious over the years. Cities with higher coupling are mostly located in provincial capitals and cities with more developed economies, while cities with lower coupling do not have a clear spatial distribution pattern. The global spatial autocorrelation analysis shows that the coupling between USFD and green economic development in YREB exhibits a clear positive spatial correlation, which shows some fluctuation with time. The local spatial autocorrelation analysis shows that the degree of coupling between cities exhibits a remarkable positive spatial clustering property and the overall spatial layout does not change much over time. H-H cities have the highest proportion and are gradually concentrated in the lower and middle reaches of the Yangtze, while H-L and L-L cities are gradually concentrated in the upper reaches of the Yangtze. The possible reason lies in the favorable geographical location of the lower reaches of the YREB, the early start and high level of USFD and green economy development which form positive spatial knowledge and technology spillover to the upper and middle reaches of the region through talent exchange, technical assistance and industrial transfer.
The above findings show that it is crucial to emphasize coordinated regional development and promote urban industrial spatial division strategies to drive and develop the green economy in the YREB (Guo and Ma, 2022). Cities should make use of resources, pay attention to benefit sharing and compensation, seek common points of benefit, and establish regional coordination mechanisms (Lin et al., 2022). Select areas with decent coordination or potential in the middle and lower reaches of the basin, and focus on strengthening policy support to improve overall coordination levels across the basin.
From the perspective of internal and external driving factors of coupling coordination degree, technological innovation, industrial structure and physical capital have a significant role in promoting the improvement of coupling coordination degree. The promoting effect of environmental regulation and opening to the outside world on coupling coordination degree needs to be improved. The influence of internal driving forces on the degree of coupling is more pronounced, and cities in the YREB should focus on strengthening the endogenous driving forces of USFD and green economic development.
Due to the differences in resource endowment and policy intensity, the economic and industrial development of YREB has long had the problem of regional imbalance (Shang and Chen, 2020). The development of USFD and green economy in different regions is very different, so the sensitivity of the coupling of the two systems to each element is also different. In this paper, we examine the heterogeneous effects of six drivers on the coupling of USFD and green economic development in three different river basins in the upper, middle and lower regions. The group regression results show that there are differences in the influence factors of the coupling between the Pan-Yangtze River Delta urban agglomerations and the middle and upper reaches of the region. The policy focusses to promote improved coupling should be different in each river basin. In addition, there is a clear difference in the sensitivity factor of the coupling between the Pan-Yangtze River Delta urban agglomerations and the middle and upper reaches of the region. The degree of coupling in Pan-Yangtze River Delta urban agglomerations is more sensitive to industrial structure, environmental regulation and human capital, and policy measures should focus on strengthening these aspects. The coupling in the middle and upper reaches of the region is more sensitive to physical capital and technological innovation factors and should be mainly promoted.
The relevant policy recommendations that emerge from this paper to facilitate the coordinated development of the USFD and the level of green economy in various regions are as follows.
1) Break administrative boundaries and make overall plans for industrial and economic development. When developing local economic development plans, provinces and cities should consider the overall development of industries and economies in the economic belt and put an end to their own policies to avoid the development pattern of cities with large and complete industrial chains. At the same time, combine the endowment characteristics of each city to form a pattern of distinctive features and complementary advantages among regional and prefecture-level cities. Strengthen the unification and coordination of industrial development planning among cities in the economic belt, strengthen the guidance of relevant supporting policies, and gradually form an integrated industrial layout based on the industrial chain in the economic belt, so as to realize the overall layout optimization of economic structure and high-quality economic development.
2) Implement scientific classification by city as a unit, promote industrial function division and cooperation among cities. The spatial diffusion effect of the coupling degree leads to positive correlations among cities, while the spatial polarization effect of the coupling degree leads to negative correlations among cities. Thus, there are four types of control zones depending on the type of spatial correlation of the coupling between the cities. First, the H-H agglomeration area belongs to the interactive “virtuous cycle area,” and the diffusion effect of high coupling degree is dominant among cities. Second, the L-L agglomeration area, which belongs to the interactive “comprehensive optimization area,” mainly shows the diffusion effect of low coupling degree between cities. Thirdly, the H-L agglomeration area belongs to the interactive “low-level encirclement area,” which shows that the area with high coupling degree is surrounded by the city with low coupling degree. Under the influence of spatial polarization effects, cities with high coupling in this region are easily polarized into cities with low coupling, so that the whole region type becomes an L-L agglomeration region. Fourthly, the L-H agglomeration area, which is entirely opposite to H-L area, is characterized by a low coupling degree area surrounded by high coupling degree city among cities, and belongs to interactive “key optimization area”. Therefore, the “virtuous cycle region” in the middle and lower reaches of the Yangtze River should play a leading role in USFD and green economic development, transmit and deepen the urban division of labor model and experience based on industrial chain to other cities, and drive the cities in the other three regions to realize the rationalization of USFD and the green and sustainable growth of urban economy.
3) With the goal of achieving high-quality coupling, promoting efficient growth of the green economy and quality of urban functional division by replacing old growth drivers with new ones. Carried out rational planning to promote the integrated development of the industrial layout and functions of the city. Relying on the YERB’s national development strategy, the city should promote green technology innovation and industrial transformation and upgrading, and raise the level of high-quality capital accumulation with the help of new infrastructure development. These measures will provide a new impetus for green economic development and USFD and facilitate the transition from low to high levels of regional coupling.
We are aware that this paper still has some limitations. First, the index data from the China Statistical Yearbook, such as the green coverage rate of built-up areas, science and technology spending per 10,000 GDP, and educational participation, are only counted in municipalities, and the integrity of the research data needs to be considerably strengthened. Second, in the section on influencing mechanisms, we analyze the mechanisms of action for specific indicators of overall development. However, it is difficult to accurately understand all the essential effects limited by data availability and the model itself. Subsequent studies should further take into account the characteristics of the epoch and enrich the metrics from both endogenous dynamics and external constraints. These limitations need to be addressed in follow-up studies.
In this paper, we focus on 108 cities in YREB and explore the coupling and coordination mechanism between USFD and green development, using weighted location entropy variation coefficient method and modified entropy weighting method to measure the level of USFD and green economic development in YREB. We furthermore adopt the coupling coordination degree model, three-dimensional kernel density and spatial effect model to reveal the spatiotemporal evolution characteristics of the coupling coordination development of USFD and green economy from two dimensions of time series evolution and spatial differentiation. At the same time, we use the spatial panel model to reveal the driving factors of coupling coordination degree. The main conclusions are as follows:
1) From the point of view of integrated development level, the USFD and the green economy in the YREB showed a fluctuating upward trend from 2009 to 2019, but the development level remained low at 0.285 in 2019 and 0.231 in 2019 respectively, leaving a lot of room for improvement.
2) From the perspective of the time series change of coupling coordination degree, the coupling coordination degree of USFD and green economic development in the YREB shows a good development trend of fluctuating growth during the study period. The evolution of the coupling degree shows a trend of polarization, with large fluctuations in the high value region of the coupling degree and relatively stable values in the low value region. At the regional level, the urban agglomerations in the middle reaches of the Yangtze River and the Pan-Chengdu-Chongqing urban agglomeration have fallen into the trap of the Matthew effect by improving the level of coupling coordination.
3) From the point of view of the evolution of the spatial pattern of the coupling coordination degree, the spatial distribution of the coupling coordination degree is distinctly different in different regions and has a distinct spatial agglomerative character. The H-H and L-L cities are mainly located in the lower and middle reaches of the Yangtze River, while the H-L and L-L cities are mainly located in the upper reaches of the river.
4) In terms of driving factors, technological innovation, industrial structure and physical capital all have a significant positive impact on the coupling between USFD and green economic development, while human capital has a restraining effect on the growth of the coupling. In the sub-sample tests, the absolute values of the coefficients of the physical capital and technological innovation are larger in the middle reaches of the Yangtze River and Pan-Chengdu-Chongqing urban agglomerations than in Pan-Yangtze River Delta urban agglomerations.
This study enriches the research on the interaction mechanism between USFD and green economic development in the academic community and complements the literature with interactive content on industrial division of labor and green development. Our proposed evaluation metric system and method, which optimizes existing evaluation methods, are of some generality and significance. The research results will help other similar regions in the world understand their USFD level and green economic development level, compensate their weaknesses in development, improve their comparative advantage and achieve a higher level of coordinated and sustainable development.
The original contributions presented in the study are included in the article/Supplementary Material, further inquiries can be directed to the corresponding author.
Conceptualization, SG and YD; methodology, SG; software, SG; validation, SG and YD; formal analysis, SG; investigation, YD; resources, YD; data curation, YD; writing—original draft preparation, SG; writing—review and editing, SG; visualization, SG; supervision, YD; project administration, SG; funding acquisition, YD.
This work was supported by the National Social Science Fund Project of China, grant number 19BJL052; Shandong Provincial Key research and Development Program (Soft Science Project), grant number 2021RKY02034; the seventh National Census Project of Jinan, grant number 020.
The authors declare that the research was conducted in the absence of any commercial or financial relationships that could be construed as a potential conflict of interest.
All claims expressed in this article are solely those of the authors and do not necessarily represent those of their affiliated organizations, or those of the publisher, the editors and the reviewers. Any product that may be evaluated in this article, or claim that may be made by its manufacturer, is not guaranteed or endorsed by the publisher.
Bag, S., Dhamija, P., Bryde, D. J., and Singh, R. K. (2022). Effect of eco-innovation on green supply chain management, circular economy capability, and performance of small and medium enterprises. J. Bus. Res. 141, 60–72. doi:10.1016/j.jbusres.2021.12.011
Bi, X., Gu, R., and Su, Q. (2018). Regional industrial specialization, competition and cooperation and division of labor in numerical manufacturing: An econometric analysis based on panel data of Jiangsu province. Resour. Environ. Yangtze Basin 27 (10), 2201–2213.
Chen, C., Han, J., and Fan, P. (2016). Measuring the level of industrial green development and exploring its influencing factors: Empirical evidence from China’s 30 provinces. Sustainability 8 (2), 153. doi:10.3390/su8020153
Chen, L., Zhang, X., He, F., and Yuan, R. (2018). Regional green development level and its spatial relationship under the constraints of Haze in China. J. Clean. Prod. 210 (FEB.10), 376–387. doi:10.1016/j.jclepro.2018.11.037
Chen, S., Liu, C., and Feng, B. (2019). Capital allocation efficiency, urban size distribution and welfare analysis. Econ. Res. J. 54 (02), 133–147.
Chen, X., Xu, H., Zhang, L., and Cao, H. (2022). Spatial functional division, infrastructure and carbon emissions: Evidence from China. Energy 256, 124551. doi:10.1016/j.energy.2022.124551
Cheng, Z., and Jin, W. (2022). Agglomeration economy and the growth of green total-factor productivity in Chinese Industry. Socio-Economic Plan. Sci. 83, 101003. doi:10.1016/j.seps.2020.101003
Ding, J., Liu, B., and Shao, X. (2022). Spatial effects of industrial synergistic agglomeration and regional green development efficiency: Evidence from China. Energy Econ. 112, 106156. doi:10.1016/j.eneco.2022.106156
Duranton, G., and Puga, D. (2005). From sectoral to functional urban specialisation. J. Urban Econ. 57 (2), 343–370. doi:10.1016/j.jue.2004.12.002
Fang, M., Yang, S., Zhou, J., and Lei, Y. (2020). Research on the innovative development path of industrial agglomeration in the Yangtze River Economic Belt under the background of high-quality development China Soft. Science 29 (05), 137–150.
Fujita, M., and Tabuchi, T. (1997). Regional growth in postwar Japan. Regional Sci. Urban Econ. 27 (6), 643–670. doi:10.1016/s0166-0462(96)02167-9
Guo, S., and Ma, H. (2022). Can the spatial function division of urbanization promote regional coordinated development? Evidence from the Yangtze River economic belt in China. Sustainability 14, 7115. doi:10.3390/su14127115
He, L., Zhang, L., Zhong, Z., Wang, D., and Wang, F. (2018). Green credit, renewable energy investment and green economy development: Empirical analysis based on 150 listed companies of China. J. Clean. Prod. 208, 363–372. doi:10.1016/j.jclepro.2018.10.119
Hou, S., and Song, L. (2021). Market integration and regional green total factor productivity: Evidence from China’s Province-level data. Sustainability 13 (2), 472. doi:10.3390/su13020472
Li, B., and Wu, S. (2016). Effects of local and civil environmental regulation on green total factor productivity in China: A spatial Durbin econometric analysis. J. Clean. Prod. 153 (1), 342–353. doi:10.1016/j.jclepro.2016.10.042
Li, C., and Ji, J. (2021). Spatial–temporal characteristics and driving factors of green economic efficiency in China. Ann. Oper. Res. doi:10.1007/s10479-021-04404-6
Li, L. (2019). Selection and mechanism of urban agglomeration integration in the middle reaches of the Yangtze River: From the perspective of market, industry and space. Beijing: Social Sciences Academic Press.
Li, T., Xue, L., and Li, G. (2022). Evolution of spatial pattern of industrial agglomeration and its impact on high-quality economic development: An empirical analysis based on 278 cities in China. Geogr. Res. 41 (4), 1092–1106.
Li, W., and Yang, S. (2019). Opening up, functional division of labor and the quality of Economic growth in China. Based Spatial Dubin model 282 prefecture-level cities Reform Econ. Syst. 5, 28–36.
Li, Y., Yi, L., Yan, Z., Shi, Y., and Zhu, X. (2012). Investigation of a coupling model of coordination between urbanization and the environment. J. Environ. Manag. 98, 127–133. doi:10.1016/j.jenvman.2011.12.025
Liang, Q., and Chi, F. l. (2004). [Quantification of endolymphatic hydrops in experimental animal model]. Zhonghua Er Bi Yan Hou Ke Za Zhi 27 (12), 32–35.
Liao, B., and Li, L. (2022). Spatial division of labor, specialization of green technology innovation process and urban coordinated green development: Evidence from China. Sustain. Cities Soc. 80, 103778. doi:10.1016/j.scs.2022.103778
Liao, C. (1999). Quantitative evaluation and classification system of coordinated development of environment and economy. A case study Pearl River Delta Urban Agglom. Trop. Geogr. 2, 76–82.
Lin, Y., Peng, C., Chen, P., and Zhang, M. (2022). Conflict or synergy? Analysis of economic-social- infrastructure-ecological resilience and their coupling coordination in the Yangtze River economic belt. Ecol. Indic. 142, 109194. doi:10.1016/j.ecolind.2022.109194
Liu, R. (2020). Scale spatial effects of urban expansion and economic growth quality. Seeker 3, 157–164. doi:10.16059/j.cnki.cn43-1008/c.2020.03.019
Liu, Y., Zhang, X., Pan, X., Ma, X., and Tang, M. (2020). The spatial integration and coordinated industrial development of urban agglomerations in the Yangtze River Economic Belt, China. Cities 104, 102801. doi:10.1016/j.cities.2020.102801
Liu, Z., Zeng, S., Jin, Z., and Shi, J. (2022). Transport infrastructure and industrial agglomeration: Evidence from manufacturing industries in China. Transp. Policy 121, 100–112. doi:10.1016/j.tranpol.2022.04.001
Lu, J., and Zhou, H. (2013). Empirical analysis on the coupling relationship between human capital and economic growth at provincial level in China. J. Quantitative Tech. Econ. 30 (09), 3–19+36. doi:10.13653/j.cnki.jqte.2013.09.013
Lu, M., and Chen, Z. (2009). Economic growth in segmented markets - Why economic openness may increase local protection? Econ. Res. J. 44 (03), 42–52.
Ma, L., Long, H., Chen, K., Tu, S., Zhang, Y., and Liao, L. (2019). Green growth efficiency of Chinese cities and its spatio-temporal pattern. Resour. Conservation Recycl. 146, 441–451. doi:10.1016/j.resconrec.2019.03.049
Ma, Y., and Zhang, X. (2019). Influencing factors and development countermeasures of industrial division of labor in Urban agglomerations in China. Reg. Econ. Rev. 6, 106–116. doi:10.14017/j.cnki.2095-5766.20191120.010
Mealy, P., and Teytelboym, A. (2022). Economic complexity and the green economy. Res. Policy 51 (8), 103948. doi:10.1016/j.respol.2020.103948
Otsuka, A., Goto, M., and Sueyoshi, T. (2010). Industrial agglomeration effects in Japan: Productive efficiency, market access, and public fiscal transfer. Pap. Regional Sci. 89 (4), 819–840. doi:10.1111/j.1435-5957.2010.00286.x
Perruchas, F., Consoli, D., and Barbieri, N. (2020). Specialisation, diversification and the ladder of green technology development. Res. Policy 49 (3), 103922. doi:10.1016/j.respol.2020.103922
Pleticha, P. (2021). Who benefits from global value chain participation? Does functional specialization Matter? Struct. Change Econ. Dyn. 58, 291–299. doi:10.1016/j.strueco.2021.06.005
Qi, O., and Zhao, Y. (2014). Temporal evolution and regional differences of functional division in urban agglomerations. Finance Econ. 7, 114–121.
Rigby, D. L., Brown, W. M., and Turok, I. (2015). Who benefits from agglomeration? Reg. Stud. 49 (1), 28–43. doi:10.1080/00343404.2012.753141
Shang, Y., and Chen, Y. (2020). Does functional division within urban agglomerations contribute to economic growth? - empirical research based on panel data of ten urban agglomerations economic. Survey 37 (01), 1–8. doi:10.15931/j.cnki.1006-1096.20191118.008
Shi, F., and Zhang, B. (2019). Measurement and analysis of high-quality economic development of prefecture-level and above cities in China. Soc. Sci. Res. 3, 19–27.
Song, D., and Li, D. (2021). Research on high-quality balanced growth of national urban agglomerations. Based perspective industrial Div. labor Econ. Surv. 38 (01), 5–14. doi:10.15931/j.cnki.1006-1096.2021.01.001
Song, W., Chen, W., and Chen, P. (2013). Functional division and spatial agglomeration in the Yangtze River Delta based on employed population data. Prog. Geogr. 32 (09), 1374–1382.
Su, H., and Hao, J. (2011). Industrial specialization, functional specialization and Urban economic Growth. Based Panel Data Prefecture-level units China China Industrial Econ. 4, 25–34. doi:10.19581/j.cnki.ciejournal.2011.04.003
Su, S., and Zhang, F. (2020). Modeling the role of environmental regulations in regional green economy efficiency of China: Empirical evidence from super efficiency DEA-Tobit model. J. Environ. Manag. 261, 110227. doi:10.1016/j.jenvman.2020.110227
Talebzadehhosseini, S., and Garibay, I. (2022). The interaction effects of technological innovation and path-dependent economic growth on countries overall green growth performance. J. Clean. Prod. 333, 130134. doi:10.1016/j.jclepro.2021.130134
Van Oort, F. G., Burger, M. J., and Raspe, O. (2009). On the economic foundation of the urban Network Paradigm: Spatial integration, functional integration and economic Complementarities within the Dutch Randstad. Urban Stud. 47 (4), 725–748. doi:10.1177/0042098009352362
Wang, L., Chen, Y., Ramsey, T. S., and Hewings, G. J. D. (2021). Will researching digital technology really empower green development? Technol. Soc. 66, 101638. doi:10.1016/j.techsoc.2021.101638
Wang, M., Gao, B., and Fan, X. (2015). The measurement and growth effect of urban functional specialization: A case study of urban agglomerations in the Yangtze River Delta. Industrial Econ. Res. 6, 42–51. doi:10.13269/j.cnki.ier.2015.06.016
Wang, Q., and Peng, C. (2018). Urban agglomeration expansion and economic growth: Empirical evidence from the Yangtze River Delta. Econ. Surv. 35 (05), 51–57. doi:10.15931/j.cnki.1006-1096.20180712.011
Wu, J., Lu, W., and Li, M. (2020). A DEA-based improvement of China's green development from the perspective of resource reallocation. Sci. Total Environ. 717, 137106. doi:10.1016/j.scitotenv.2020.137106
Yang, L., and Sun, Z. (2015). Evaluation of the development level of new urbanization in Western China based on entropy method. Econ. Problems 3, 115–119. doi:10.16011/j.cnki.jjwt.2015.03.023
Yin, X. (2006). Spillover effect and attenuation boundary of producer services agglomeration on manufacturing productivity: An empirical analysis based on spatial econometric model. Fudan Journal(Social Sci. Ed. 2, 42–53.
Ying, L., Li, M., and Yang, J. (2021). Agglomeration and driving factors of regional innovation space based on intelligent manufacturing and green economy. Environ. Technol. Innov. 22, 101398. doi:10.1016/j.eti.2021.101398
Yu, Y., Liu, D., and Xuan, Y. (2016). Spillover effect and attenuation boundary of producer services agglomeration on manufacturing productivity: An empirical analysis based on spatial econometric model. J. Financial Res. 2, 23–36.
Yuan, H., Zou, L., Feng, Y., and Huang, L. (2022). Does manufacturing agglomeration promote or hinder green development efficiency? Evidence from Yangtze River economic belt. Environ. Sci. Pollut. Res. Int. doi:10.1007/s11356-022-20537-y
Yuan, Q., Yang, D., Yang, F., Luken, R., Saieed, A., and Wang, K. (2020). Green industry development in China: An index based assessment from perspectives of both current performance and historical effort. J. Clean. Prod. 250 (20), 119457. doi:10.1016/j.jclepro.2019.119457
Zhang, H., Chen, S., and Wang, S. (2022). Impact of economic growth and labor productivity dispersion on energy intensity in China. Energy 242, 123004. doi:10.1016/j.energy.2021.123004
Zhang, J., Lyu, Y., Li, Y., and Geng, Y. (2022). Digital economy: An innovation driving factor for low-carbon development. Environ. Impact Assess. Rev. 96, 106821. doi:10.1016/j.eiar.2022.106821
Zhang, L., Mu, R., Zhan, Y., Yu, J., Liu, L., Yu, Y., et al. (2022). Digital economy, energy efficiency, and carbon emissions: Evidence from provincial panel data in China. Sci. Total Environ. 852, 158403. doi:10.1016/j.scitotenv.2022.158403
Zhang, M., Yan, T., and Ren, Q. (2022). Does innovative development drive green economic growth in resource based cities? Evidence from China. Front. Environ. Sci. 9, 745498. doi:10.3389/fenvs.2021.745498
Zhang, M., and Li, B. (2022). How to design regional characteristics to improve green economic efficiency: A fuzzy-set qualitative comparative analysis approach. Environ. Sci. Pollut. Res. 29, 6125–6139. doi:10.1007/s11356-021-15963-3
Zhao, M., Tan, R., Zhang, R., Ji, R., Liu, R., and Yu, R. (2010). Decomposing the influencing factors of industrial carbon emissions in Shanghai using the LMDI method. Energy 35 (6), 2505–2510. doi:10.1016/j.energy.2010.02.049
Zhao, X., Mahendru, M., Ma, X., Rao, A., and Shang, Y. (2022). Impacts of environmental regulations on green economic growth in China: New guidelines regarding renewable energy and energy efficiency. Renew. Energy 187, 728–742. doi:10.1016/j.renene.2022.01.076
Zhao, Y., and Bai, Y. (2012). Measurement and analysis of functional division of labor in Urban agglomerations in China. China Ind. Econ. 11, 18–30. doi:10.19581/j.cnki.ciejournal.2012.11.002
Zhao, Y., and Wei, H. (2015). Emotion regulation and depressive symptoms: Examining the mediation effects of school connectedness in Chinese late adolescents. J. Adolesc. 40 (08), 14–23. doi:10.1016/j.adolescence.2014.12.009
Zhao, Z., and Hou, Y. (2019). Research on the evolution characteristics and countermeasures of central city spatial connection in urban agglomerations. Urban Environ. Stud. 2, 67–79.
Zhong, S., and Li, K. (2010). Demographic dividend, spatial spillover and provincial economic growth. J. Manag. World 4, 14–23.
Zhou, H., Liu, Y., and He, M. (2022). The spatial interaction effect of green spaces on urban economic growth: Empirical evidence from China. Int. J. Environ. Res. Public Health 19, 10360. doi:10.3390/ijerph191610360
Zhou, X., and Ye, S. (2020). Estimation of coordination degree between Basic public services and economic development in China. Statistics Decis. 36 (21), 97–101. doi:10.13546/j.cnki.tjyjc.2020.21.019
Keywords: urban spatial functional division, green economic development, coupling coordination, spatial and temporal patterns, driving factors
Citation: Guo S and Diao Y (2022) Spatial-temporal evolution and driving factors of coupling between urban spatial functional division and green economic development: Evidence from the Yangtze River Economic Belt. Front. Environ. Sci. 10:1071909. doi: 10.3389/fenvs.2022.1071909
Received: 17 October 2022; Accepted: 03 November 2022;
Published: 16 November 2022.
Edited by:
Xiaowei Chuai, Nanjing University, ChinaReviewed by:
Xufeng Cui, Zhongnan University of Economics and Law, ChinaCopyright © 2022 Guo and Diao. This is an open-access article distributed under the terms of the Creative Commons Attribution License (CC BY). The use, distribution or reproduction in other forums is permitted, provided the original author(s) and the copyright owner(s) are credited and that the original publication in this journal is cited, in accordance with accepted academic practice. No use, distribution or reproduction is permitted which does not comply with these terms.
*Correspondence: Siliang Guo, R1NMMjAwNjAxQDEyNi5jb20=
Disclaimer: All claims expressed in this article are solely those of the authors and do not necessarily represent those of their affiliated organizations, or those of the publisher, the editors and the reviewers. Any product that may be evaluated in this article or claim that may be made by its manufacturer is not guaranteed or endorsed by the publisher.
Research integrity at Frontiers
Learn more about the work of our research integrity team to safeguard the quality of each article we publish.