
94% of researchers rate our articles as excellent or good
Learn more about the work of our research integrity team to safeguard the quality of each article we publish.
Find out more
ORIGINAL RESEARCH article
Front. Environ. Sci., 04 January 2023
Sec. Environmental Economics and Management
Volume 10 - 2022 | https://doi.org/10.3389/fenvs.2022.1070212
This article is part of the Research TopicFood-Energy-Water Systems: Achieving Climate Resilience and Sustainable Development in the 21st CenturyView all 21 articles
 Catherine Obiribea Ofori-Bah*
 Vincent Amanor-Boadu
There has been increasing interest in low-carbon technologies to reduce climate change impacts. However, careful assessments of their implications for the vibrancy of local economies are rare. This paper employs techno-economic analysis to assess the technical and economic feasibility of investment in one such technology: local green ammonia production and its contribution to the economic viability of the local economy. The analysis considers price projection and debt financing options, and alternative energy-to-ammonia technologies. The approach is broadly applicable and is illustrated here using a case study in which 248,188 MT of traditional ammonia are replaced with local wind energy-produced ammonia for farmers in Southwest Kansas, United States. Economic feasibility is defined as the ability to accrue enough discounted cash flow at the end of the turbines’ 25-year lifespan to enable their replacement. The alternative technologies are the traditional Haber-Bosch and the emerging solid oxide electrolysis cell (SOEC). The total plant capital cost amounted to $781.72 million while the plant operating costs were set at $100/MT with the energy supplied by the project’s energy system. The results show how economic feasibility sensitivity to technology and financing options are evaluated and communicated to scientists, policymakers, and farmers. The 6.5 MWh/MT wind energy-to-ammonia SOEC technology presented the best economic results under all price projections. The community’s investment yielded the highest return when debt was used to finance 50% of the capital investment. Returns exceeded the average annual S&P return of about 7% from 1957 to 2021. The work shows how consideration of technology efficiencies and creative financing strategies can contribute to the economic welfare of farmers and their communities even as they contributed to reducing crop production’s carbon footprint.
Climate change concerns are continuously rising. In response, various policies and technological innovations are being developed to address greenhouse gas (GHGs) emissions such as carbon dioxide (CO2) (U.S. Congressional Research Service, 2021). Albeit, how to move toward a low-carbon economy to produce an earth system able to support human activity while maintaining viable rural economies and communities is yet to be explored. Experiences of extreme weather made more common due to climate change and its anticipated increasingly severe impacts have incentivized the shift from carbon-producing fossil fuels towards the use of low-carbon renewable energy sources.
This work evaluates progress in the global chemical manufacturing sector, particularly the production of ammonia. Ammonia is explored because it is one of the most-produced chemicals. It has an annual worldwide output of over 176 million metric tons (Royal Society, 2020) and a recent growth rate of 2.3% (Guo et al., 2018), (Smith et al., 2020). About 80 percent of total global ammonia output is used as fertilizer in crop production (Chen et al., 2019), (Funez Guerra et al., 2020), with the rest used in multiple industries including pharmaceutical, petroleum and mining, textile, and in explosive manufacturing. Ammonia synthesis is one of the highest carbon dioxide-emitting chemical industrial processes (Royal Society, 2020), accounting for almost 19% of total 2019 reported carbon emissions from the US chemical sector (US EPA, 2020).
Recent studies have assessed alternative avenues for producing green ammonia. Cardoso et al. (2021) explored biomass gasification determining that a small-scale biomass-to-ammonia power plant was economically feasible in mainland Portugal. Meanwhile, Smith and Torrente-Murciano evaluated the economic potential of green ammonia production using hydroelectric power and determined that it was economically beneficial as compared to the importation of Nitrogen fertilizer in Sub-Saharan Africa (Smith and Torrente-Murciano, 2021). Solar-powered ammonia production has also been suggested (Wang et al., 2018). Tuna et al. (2014) explored green ammonia production using wind power, biogas, and woody biomass at different plant scales with biomass being the most promising with the lowest cost of production.
Currently, the dominant industrial process for synthesizing ammonia is the Haber-Bosch process, an energy-intensive process that consumes about 1.8% of global energy output annually (Royal Society, 2020). Discovered over a century ago, the Haber-Bosch process synthesizes ammonia from atmospheric nitrogen and water under conditions of high temperatures (greater than 400°C) and pressure above 200 atm (Erisman et al., 2008). The predominant energy sources in ammonia synthesis are fossil fuels, especially natural gas, coal, and heavy fuel oil, underscoring its high contribution to global greenhouse gas (GHG) emissions.
Apart from providing energy, fossil fuels provide the hydrogen needed in traditional ammonia synthesis using the steam-methane reforming process (Liu et al., 2020), (Bicer et al., 2017). Alternative sources of hydrogen could address the dual problem of reducing ammonia’s carbon footprint and ensuring an adequate supply of ammonia for crop production to feed a growing global population. While some researchers have looked at water electrolysis as a source of hydrogen for the Haber-Bosch process (Smith et al., 2020), (Fúnez Guerra et al., 2020), (Pfromm, 2017), others have been looking at alternatives to the entire Haber-Bosch process (MacFarlane et al., 2020). Some researchers have considered the inclusion of carbon sequestration in the ammonia production process to create blue ammonia” but that adds both cost and some level of complexity to the process (MacFarlane et al., 2020). Additionally, alternative uses for ammonia [e.g., energy storage (Royal Society 2020), and hydrogen carrier (Michalsky et al., 2011), (Cinti et al., 2017)] are becoming more probable, increasing the potential for other industries, such as transportation, to reduce their carbon footprint. The success of any of these efforts would be based on the price competitiveness of their ammonia against the traditional fossil fuel-based ammonia. A promising new technology is the solid oxide electrolysis cell (SOEC) which is considered in this study.
The bulk of ammonia is consumed in small towns and rural (STAR) communities, where the majority of crop production occurs. Many STAR communities in the Great Plains of the United States have abundant land and solar and/or wind resources, making them prime production sites for green ammonia. Local green ammonia production for agriculture could allow the decoupling of natural gas prices from farm commodity prices, which directly affect farm incomes (Schnitkey, 2016). If crop producers could invest in ammonia production using locally available renewable energy, they would better control their ammonia expenditures while keeping those expenditures in their communities, enhancing their local economies.
This article addresses the potential economic competitiveness of wind-powered ammonia production within STAR communities. Thus, the overarching objective of this research is to assess the economic feasibility of harvesting wind for electricity production and using that electricity to synthesize ammonia for local agricultural use under alternative local financing options. Local financing options allow the returns on investment to remain in the community. The ammonia production project benefits from having a “captive demand” because ammonia is indispensable to crop production in the Great Plains study area.
The economic analysis is complicated because multiple systems are involved. This work includes wind energy and green ammonia production. Some recent studies have pursued similar goals as this work. Morgan et al. explored the economic feasibility of wind-powered ammonia production (Morgan et al., 2014). Funez Guerra et al. (2020) using a polymeric electrolyzer (PEM) approach, assessed the technical-economic feasibility of green ammonia production using solar energy. Their study indicated that the project would be technically and economically feasible with a net present value (NPV) of €77,414,525 and a payback period of 7.62 years. Similarly, Sousa et al. (2022) analyzed the techno-economic feasibility of ammonia production also using hydrogen from PEM electrolysis. They found that a small hydro-powered ammonia plant with an annual production of 25,000 MT is uncompetitive as compared to a conventional ammonia plant.
Like the foregoing papers, this study explored the techno-economic feasibility of green ammonia production over a maximum life expectancy for wind turbines. Unlike the foregoing studies, this study explored the alternative financing as well as community profit retention for community economic viability as critical contributions or extensions. It not only showed the feasibility of the project, but also the return on investment for the project’s investors. Given the scale of the project (discussed in Section 2.4), these extensions to the literature are important because they illuminate the financing source effect on economic feasibility. In the end, the paper highlights the importance of energy-to-ammonia efficiency, market conditions, and financing strategy on the techno-economic feasibility of green ammonia production. Its uniqueness is anchoring it in a STAR community and exploring the potential effect of the project on community viability.
The article proceeds as follows. Section 2 describes the case study area, economic feasibility assessment metrics, the conventional ammonia production system, the alternative Solid Oxide Electrolysis Cell (SOEC), and the financing options considered in this work. The results of the economic analyses of the feasibility of green ammonia production in the study area under alternative ammonia price scenarios are then presented and discussed, along with their sensitivity to two critical variables: ammonia price discount and dividend rates.
The project is deemed economically feasible if it can replace itself after its assumed useful lifespan of 25 years (Milborrow, 2020), and provide competitive and superior returns to its investors. Due to the challenge of projecting anhydrous ammonia prices, the techno-economically feasible solution is limited to one that is feasible under all price scenarios. The results of the effect of investing a portion of the project’s net cash flow in local businesses on investors and the project’s economic feasibility are also presented and discussed. The fourth section summarizes the findings while the final section offers concluding thoughts on the techno-feasibility of using green ammonia production to enhance community viability while reducing crop farmers’ income variability and carbon production.
This section describes the study area and then uses it to illustrate the methods and options used in the economic analysis, wind energy production, ammonia production, and financing evaluation.
This study uses USDA Agricultural District 30 (the southwest 14 of the 105 Kansas counties) for the case study. The region is a major contributor to grain and livestock production in Kansas, accounting for 30 percent of the cattle and calves, 26 percent of sorghum, 22 percent of corn, and 15 percent of winter wheat produced in the state. In 2017, it accounted for 8.2% of Kansas farmers (USDA-NASS, 2019a) and 18.2% of Kansas cropland with an average farm size of 347.3 ha (USDA-NASS, 2019b).
The region accounted for 4.7% of the 2019 Kansas population (U.S. Census Bureau, 2019). The region’s population was relatively flat from 2010 through 2015, growing at an average rate of 0.15%, about half of Kansas’s population growth rate of 0.31%. However, the region’s population has been declining at about 0.9% per annum since 2016, compared with an increasing, albeit nearly flat growth rate of 0.03% for Kansas.
The Southwest Kansas agricultural district depends on the Ogallala Aquifer for its irrigation and other water needs. The Ogallala Aquifer’s water levels in the study area are declining (Scott, 2019) though some areas in the western part of the region, such as in Stanton and Morton Counties, reportedly show insignificant changes in water levels. The availability trend and climate change projections suggest the potential intensification of fertilizer use to mitigate the adverse drought effects on crop production in the region (Lindsey, 2013).
The region has good to excellent availability of wind for community-scale energy production (Figure 1). There are few population centers located close to areas with excellent wind resources, reducing the social challenges associated with the development of wind energy in many communities (Gross, 2020). The research focuses on exploiting decreasing wind energy production capital costs, improving ammonia production technologies, and a growing investor confidence in renewable energy economics (Milborrow, 2020), (Sanchez and Martín, 2018; Hauch et al., 2020; Ghiyati, 2021a) to explore opportunities for changing Southwest Kansas’ economic trajectory through local green ammonia production for local use. The results will provide insights for deploying similar solutions in other regions around the world.
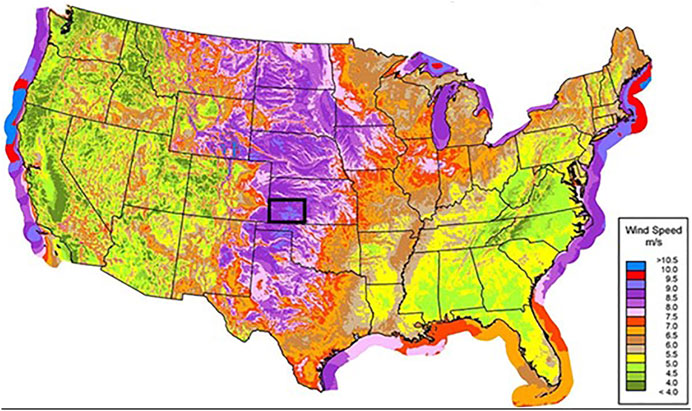
FIGURE 1. United States - Land-Based and Offshore Annual Average Wind Speed at 100 m. Source: NREL and AWS TruePower (NREL and AWS Truepower LLC, 2013) with author modifications.
The study considers only the cropland allocated to the five principal crops produced in the study area–corn, cotton, soybeans, sorghum, and wheat–and the required anhydrous ammonia (equivalent) used on those crops. The relevant cropland used was the average planted area for the five major crops between 2017 and 2019, inclusive, which accounted for about 64% of the total cropland in the study area (USDA-NASS, 2019b). Ammonia requirements in the study area are assumed to be equivalent to the product of a proportion of the area’s total cropland and the average ammonia requirement per hectare of cropland using 82% nitrogen to convert all ammonia fertilizer products into anhydrous ammonia equivalent. Production and anhydrous ammonia assumptions used for the study area are summarized in Table 1. The total average cropland used is about 1.4 million ha at 0.18 MT/ha of anhydrous ammonia, resulting in an annual requirement of 248,188 MT of anhydrous ammonia for the area. This is assumed as the project’s production target.
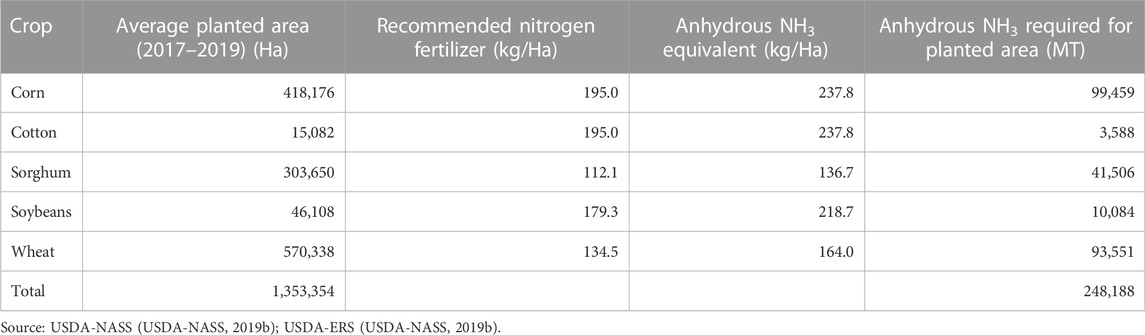
TABLE 1. Cropland and fertilizer assumptions.
Economic feasibility is often assessed using cash flows and specific indicators developed to evaluate the achievement of project objectives. Traditional economic feasibility assessment metrics depending on cash flows include Net Present Value (NPV), Payback Period (PBP), and return on investment (ROI). Given the project’s objective to enhance farm incomes by alleviating producers’ exposure to high anhydrous ammonia prices while contributing to community economic viability, anhydrous ammonia price discount value and ROI for community investors are measured. Relatively competitive thresholds are set for both variables since the project competes with all investment alternatives available to both potential crop producers and community investors in the study area. Further, because of the long duration of the project’s lifespan, all monetary benefits are measured in present value terms to provide a clear performance of the project for potential investors.
NPV recognizes the time value of money by discounting net cash flows from the project at a specified discount rate. The discount rate incorporates potential investors’ perceptions about the project’s risk, and therefore, differs from the interest rate, which is the price of capital. Therefore, the discount rate is generally higher than the interest rate. NPV is formally defined as the sum of discounted cash flow, i.e.,:
where
Some investors have a minimum IRR–hurdle rate (HR)—below which the project is deemed unfavorable for investment. If investors’ hurdle rate exceeds the IRR, then the project requires higher cash flows to be attractive to investors, otherwise, it may not be deemed favorable for investment. Different investors would have different HR for different projects.
It is sensible to expect investors to make a single investment in the project and for the project to not only maintain itself from its cash flows but replace both its energy and ammonia systems at the end of its 25-years lifespan. Another indicator used to specifically measure the extent to which the project can replace itself from its cash flows is the discounted replacement multiplier, RM, estimated as:
The higher the RM, the more confident investors will be that they would not be asked to make more investments to sustain the project. The discounted payback period, PBPT, is defined as the earliest time (in years) it takes for cumulative cash flows to equal the initial investment, i.e.,
where all variables are as defined.
The ROI is an efficiency metric for equity use, comparing the gain from an investment given the amount invested. It measures how well the investments of both producer and community investors do, allowing them to compare their investments in this project with alternative investments available to them. Three specifications of ROI are measured for this project: 1) Producer investors’ ROI; 2) Community investors’ ROI; and 3) Overall project ROI. The overall project ROI is estimated as follows:
where all variables are as previously defined. The value of the price discount or savings on anhydrous ammonia expenditure as a result of investing in the project is defined for each producer investor i in period t as follows:
where
where vt is the value of the price discount accruing to all producer investors in each year and K0p is the total value of capital producer investors contributed to the project. Aggregate community investors’ return on investment, ROIC, is estimated using their dividend payouts over time, i.e.,
where
where all variables are as defined, and
where all variables are as defined above. The return accruing to each community investor from their investment would be the product of the RPS and the number of shares they own. The total number of shares is based on the plant’s anhydrous ammonia production capacity, which is 248,188 MT. The total number of shares each investor group owns is determined by its proportional contribution to the project’s initial capital investment. Project funding emanating from debt is distributed to investors on a proportional basis of this initial contribution to capital. Therefore, producer and community investors own equal equity under the 100% Equity Financing condition, 46.67% and 53.33% under the Debt I condition, and 70% and 30% under the Debt II condition.
The sensitivity of project results to the price discount and the dividend rates are explored. The goal is to ensure that investors are getting the highest value from their investments constrained by the project’s ability to replace itself after 25 years. Thus, unlike many farmer/community investments that seek to build capital for the “business”, the investment objective of this project is maintained by paying out returns from the project to investors, retaining only enough to maintain operations.
The study assumes that anhydrous ammonia is produced using locally produced wind energy. The electricity production system uses parameters from NREL’s SAM (System Advisors Model) version 2020.11.29 (Blair et al., 2018) for the Vestas V100–1.8, a 1.8 MW rated turbine manufactured by Vestas Wind Systems (https://www.vestas.com/). Its 50 m blades and 100 m rotor diameter and hub height enable the turbine to deliver a high rotor-to-generator ratio, maximizing productivity in low to medium wind sites. Its three blades sweep an area of 7854.0 m2. Figure 2 shows SAM’s simulated average monthly energy output for the V100-1.8 for the study area’s wind parameters. Based on this output profile, the total annual energy output is estimated at 6,997 MWh per annum per turbine. The power curve for the V100-1.8 is presented in Figure 3, showing a cut-in wind speed of about 4.0 m/s and a cut-out wind speed of 20.0 m/s.
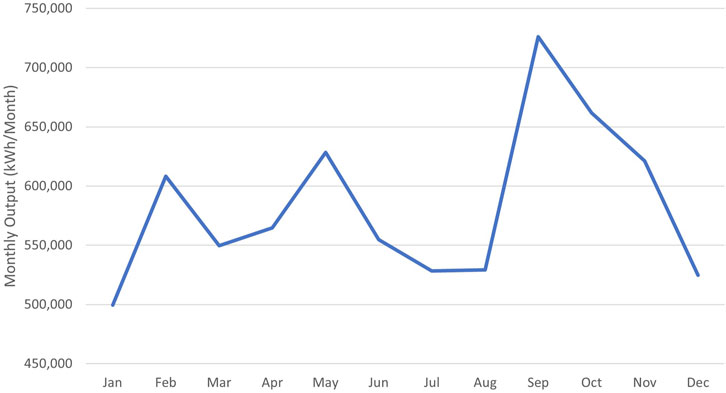
FIGURE 2. SAM simulated average monthly energy output (kWh/Month) from vesta V100-1.8 wind turbine for southwest Kansas region. Source: Developed from SAM simulation data (NREL, 2018).
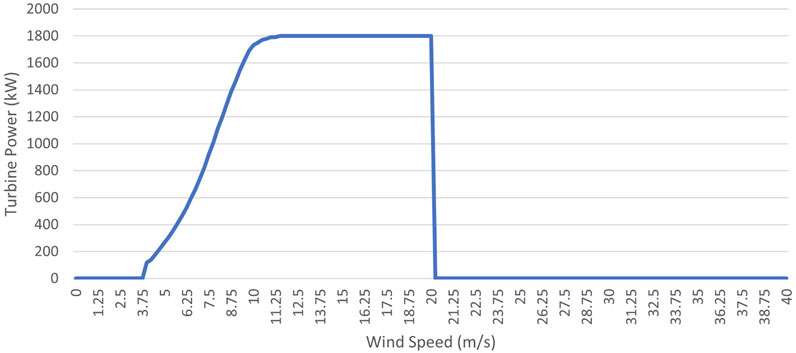
FIGURE 3. V100-1.8 turbine power curve. Source: Developed from SAM simulation data (NREL, 2018).
The economic analysis in the study considers the conventional Haber-Bosch Process and the SOEC with Exothermal Haber-Bosch Reactor.
Ammonia is derived from fusing nitrogen and hydrogen atoms. The traditional Haber-Bosch process involves producing hydrogen by reacting methane (from fossil fuels like natural gas) and water, referred to as steam-methane reforming, an endothermic process requiring a significant amount of heat in the presence of a catalyst. It produces hydrogen with carbon monoxide and a small amount of carbon dioxide as by-products.
Molecular nitrogen (N2), an inert colorless, odorless, tasteless atmospheric gas, at normal temperatures and pressures, is held together by a strong triple bond between its atoms (N). For hydrogen to react with nitrogen in ammonia synthesis, the nitrogen molecule is broken into its atoms to increase its reactivity. Successfully breaking the nitrogen bond guarantees ammonia synthesis only in the presence of both high temperature and high pressure, the original genius of the Haber-Bosch process, along with their discovery of an inexpensive and highly efficient iron-based catalyst.
Most modern industrial ammonia plants operate at capacities of 2,000 to 3,000 tons per day in a single production line. Methane (CH4) and water (H2O) enter the primary reformer to create carbon monoxide (CO) and H. Air is fed into the system as the CO and H move into the secondary reformer, where they react to create two CO and four H molecules in the presence of N2 from the air. The gas mixture (N2, H2, and CO) enters the CO converter under high temperature and pressure and flows into the scrubber where water is added under pressure. The by-products of water and CO2 are released, while the N2 and H2 enter the pre-heater and move to the reactor where ammonia is produced at temperatures of about 450°C and pressures of 300 bars in the presence of a catalyst. The (NH3) is harvested and excess N2 and H2 are recycled into the pre-heater for further processing.
Concerns about climate change and sustainability have resulted in the development of technologies that reduce or eliminate carbon footprints using renewable energy sources instead of fossil fuels. The search for these solutions has been fraught with challenges. For example, while renewable energy is beneficial from its low or zero carbon footprint, solar and wind energy have limitations during the day and certain periods of the year, suggesting a need for energy storage systems, supplementary sources of energy, or both (Sanchez and Martin, 2018). Yet, Morgan et al. (2017) and V Parmar (2019) have both shown that wind energy may be used effectively in the Haber-Bosch process.
Recent discoveries associated with solid oxide electrolysis cell (SOEC) technology suggest unrivaled conversion efficiencies for the renewable-energy-to-ammonia process (Cinti et al., 2017), (Tang et al., 2016) and a solution to the nitrogen and hydrogen feedstock production for ammonia synthesis. Its effective oxygen-selective inorganic membranes (Figure 4) use an electrical field as a driving force to remove the oxygen split in the electrolysis process, eliminating the need for air separation. The potential energy savings from the SOEC technology compared to conventional Haber-Bosch processes is about 20% (Ghiyati, 2021b). Cinti et al. (2017) report the possibility of up to a 40% reduction in power input compared to equivalent plants. This increases the economic competitiveness of green ammonia.
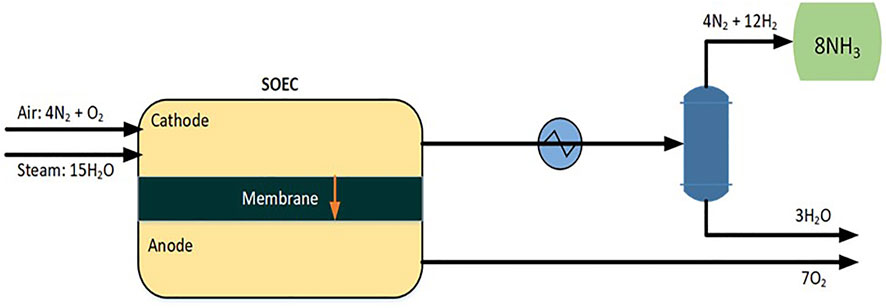
FIGURE 4. Haldor topsoe SOEC technology model with downstream exothermal Haber-Bosch reactor. Source: Adapted from Ghiyati (Ghiyati, 2021a).
Conventional alkaline electrolysis requires about 8.4–10.5 MWh/MT of ammonia, meaning between 2,085 and 2,606 GWh of electricity is required to produce the estimated 248,188 MT/year of anhydrous ammonia. The output profile for the V100-1.8 implies installing between 302 and 378 turbines.
Emerging research and development in thermodynamics and kinetics are producing solid oxide electrolysis cell (SOEC) technologies with significant efficiency gains from electrolysis (Hauch et al., 2020). These advances in SOEC, according to Haldor Topsoe (www.topsoe.com), suggest that energy for the production of the same level of hydrogen yield could be reduced by 23%, and without air separation (Ghiyati, 2021b). Cinti et al. (2017) suggested the possibility of a lower energy requirement for equivalent hydrogen output. Tang et al. (2016), and others indicated that waste heat from the SOEC technology may be employed in splitting water, thereby further improving the system’s energy efficiency. Based on these energy savings, the range of energy required could be between 6.5 MWh/MT to 8.1 MWh/MT, translating into installing between 234 and 291 V100-1.8 turbines for the production of the region’s ammonia need.
The four technological options analyzed in this work are listed in Table 2. The assumed balance of system cost (BOSC) is $350/kW (NREL, 2018), which is equivalent to $630,000 per turbine, yielding the total BOSC shown. For total capital expenditure, there is about 23% savings between the higher energy efficiency SOEC technology relative to the higher energy efficiency conventional technology. These technological parameters and capital costs are used to determine the project’s ability to replace itself while providing an acceptable return on investment to producer investors.
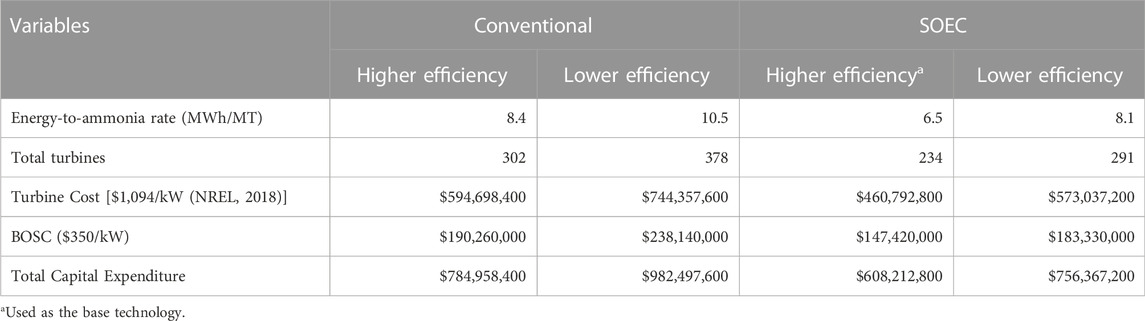
TABLE 2. Capital cost expenditures for turbines under alternative energy conversion rates to produce 248,188 MT of anhydrous ammonia per annum.
Since most traditional ammonia plants produce between 2,000 and 3,000 MT/day, it is important to consider the proposed 680 MT/day facility. Such small-scale plants built around the US and elsewhere in recent years have demonstrated economic viability (Brown, 2018). For example, Fortigen (https://www.facebook.com/fortigen/), located in Geneva, Nebraska, built a skid-mounted 90 MT/day plant designed by N-Ren (Amopak process) for $75 million. Similarly, Simplot (https://www.simplot.com/) invested $350 million to build a 544 MT/day plant in Wyoming. Companies like Proton Ventures (https://www.protonventures.com/) of the Netherlands have been building very small and low capital intensity plants in the order of about 20,000 MT/year at about $36 million, or $1,800/MT. Typically, these small projects are greenfield plants costing between $1,300 and $2,000/MT of annual production (Brown, 2018). While the plant operates year-round, the seasonal nature of crop production suggests a need for anhydrous ammonia storage between October and March. In this study, it was assumed that the ammonia plant will store at most 40% of its annual output at any one time. The cost of pressurized tanks used for anhydrous ammonia storage was estimated at $955/MT (National Tank Outlet, 2021), putting the estimate for storage tanks at about $94.81 million.
Fixed and variable costs are listed in Table 3. The ammonia production capital expenditures include storage (described in the last paragraph) and balance of plant costs. A balance of plant cost was assumed at $1.30 million. The total cost of a traditional 2,000 MT/day ammonia plant is assumed at $430 million ($215,000/MT) (Brown, 2018). Given the maximum daily output of 900 MT, the prorated cost of the full plant is $172 million. The SOEC reactor technology is more expensive than the conventional reactor technology. We assume that the former is 45% of the prorated cost of the reactor portion of the traditional ammonia plant cost and the latter is 40%. These are equivalent to $77.4 million and $68.8 million. Together, the facility cost, the storage tank cost, and the balance of system cost results in the estimated cost of $173.51 million for the SOEC ammonia production system and $164.94 million for the conventional system. The total capital cost to build the energy supply system using the higher-efficiency SOEC technology and the ammonia production system is estimated at approximately $781.72 million (Table 3). The distribution of total capital cost between the electricity generation system and the ammonia production system is about 77.8% and 22.2%, respectively. The project’s capital intensity for the higher-efficiency SOEC technology energy-to-ammonia was about $3,149.71 compared to $3,827.34 for the higher-efficiency conventional energy-to-ammonia technology. The capital intensity estimates for this project are significantly higher than those described by Brown (Brown, 2018), which positions the analysis presented here in a position of enhanced confidence in the results if these operations pass the specified economic feasibility tests.

TABLE 3. Fixed and variable cost under energy conversion to ammonia assumptions.
Financing the capital is important. Suppose a minimum of 35% of total capital investment (equity) is reserved for local crop producers, then the remainder is assumed financed with community equity investment and/or debt. The debt share of the capital investment is distributed pro rata to the equity shareholders after the debt is paid off. Community investors may be local businesses or individual citizens who embrace the project’s vision of enhancing the communities’ economic viability. Because anhydrous ammonia price risk is a major project objective, it is assumed producer investors receive a price discount and non-producer investors receive dividends, estimated as a percent of net cash flows after any debt payments and anhydrous ammonia price discount. The price discount rate and dividend rate are defined to ensure 1) the project can replace itself after its 25-years useful lifespan (Renewables First. (n.d.)), (Jacobson, 2016), and 2) investors receive returns that adequately justify their participation in the project.
The research explored three financing formulas: 50% producer and 50% community investment (100% Equity Financing); 35% producer and 40% community investment with 25% of debt financing (Debt Financing I); and 35% producer and 15% community investment with 50% of debt financing (Debt Financing II). This fundraising approach was used by Greenfield Nitrogen in Garner, Iowa (Greenfield, 2018), and by numerous producer value-added initiatives, such as ethanol plants.
Ammonia prices are directly influenced by natural gas prices and commodity prices (Schnitkey, 2016), (Ibendahl, 2021). Steadily increasing natural gas prices and volatile corn prices between 1990 and 2020 contributed to anhydrous ammonia prices growing at an average annual rate of approximately 4.5% and exhibiting high volatility (Schnitkey, 2016), (Ag Update, 2018). The weakening of commodity prices in the last decade has contributed to the decline in the ammonia price annual growth rate to 1.4%. However, a reversal in both natural gas and commodity prices in 2021 tripled ammonia prices from about $500 per tonne in August 2021 to $1,600 in February 2022.
The foregoing indicates the challenge of projecting long-term ammonia prices when various forces contribute to its level and volatility. To minimize the risk of projection error, two different anhydrous ammonia price scenarios are investigated for their effect on the economic feasibility of green ammonia production in this study. Each price series projection was derived from the average of 100 randomly generated prices for each of the 25 years of the project’s lifespan using the normal distribution random number generation routine in Microsoft Excel®. The mean and standard deviation parameters for the two series were, respectively, the average and standard deviation of anhydrous ammonia prices from 2012 to 2020 obtained from the US Geological Survey (US Geological Survey, 2020), and from 2010 to 2020 obtained from the Economic Research Service (Mosheim, 2019). The two projected prices are presented in Figure 5. A time-based analysis of their variability showed that the average standard deviation increased towards the end of the series for both price series. Also, while the figure shows the two price series were different, their correlations coefficient confirmed that they were independent of each other, providing two distinct future price possibilities for consideration. The summary statistics for the two projected price series over the 25-years duration are presented in Table 4. Table 4 shows that the average price for anhydrous ammonia under Scenario 1 was $610.08/MT compared to $475.16/MT for Scenario 2. The correlation coefficients between the two-price series were not statistically significant, suggesting that they represent different expectations about the future of the ammonia market.
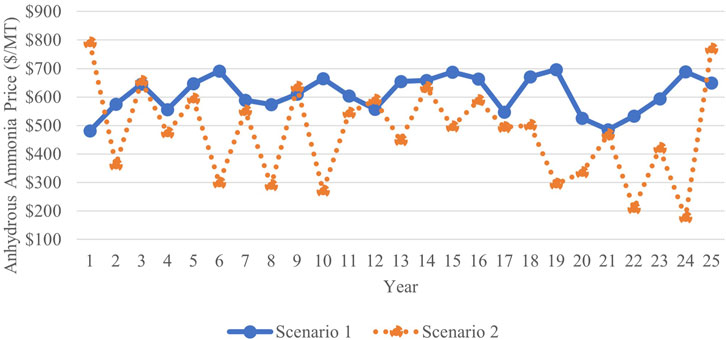
FIGURE 5. Projected anhydrous ammonia price scenarios.

TABLE 4. Summary Statistics of Randomly Generated Annual Anhydrous Ammonia Prices Based on Different Price Series derived from the US Geological Survey (US Geological Survey) (Scenario 1) and Economic Research Service (Mosheim, 2019) (Scenario 2).
The simulated prices generated from the 100 replications above for the 25 years are presented in Figure 5.
Anhydrous ammonia production in the study area was simulated to remain unchanged for the 25-years projections. Total expenditures on anhydrous ammonia over the 25-years project lifespan are approximately $3.79 billion under Scenario 1 and $2.95 billion under Scenario 2. These expenditures are equivalent to annual expenditures of $151.42 million under Scenario 1 and $117.94 million under Scenario 2.
Discounted and undiscounted results under 23% anhydrous ammonia price discount and 30% dividend rate and 100% equity financing of the higher efficiency SOEC technology are presented in this section.
Table 5, presenting the undiscounted results, shows that the project accumulated $1.26 billion at the end of the 25 years under Scenario 1, and nearly $808 million under Scenario 2. Producer investors saved $484 million in anhydrous ammonia expenditure over the 25 years under Price Scenario 1 compared to $292 million under Scenario 2. The dividend payout was structured to produce about the same amount for both groups of investors with 50:50 share ownership. Due to the distribution equity, both investor groups experienced about 124.5% ROI or about $7,000 in return or value per share under Scenario 1. The ROI under Scenario 2 was lower, about 75%. Payback period was estimated at 10 years for Scenario 1 and 12 years for Scenario 2.
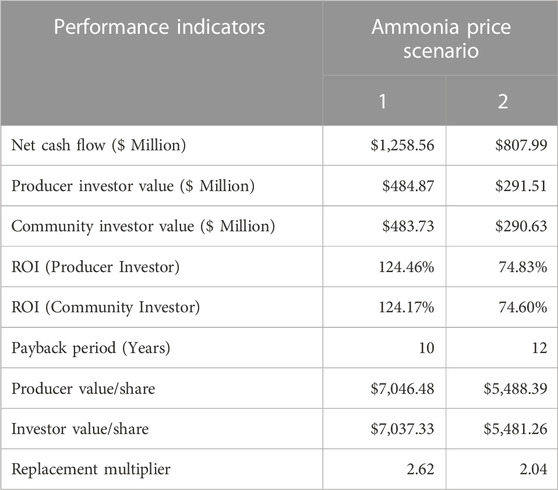
TABLE 5. Undiscounted performance indicators with 100% equity financing and higher efficiency SOEC energy-to-ammonia technology (6.5 MWh/MT).
Compared to investments that have received significant producer support, such as ethanol plants, this green ammonia production investment seems less risky. This is because its output is a necessary input consumed by its investors, and investors gain control over the price of this necessary input. Indeed, they are promised to pay only a portion of the prevailing market price in each year.
On the critical indicator of replacement multiple, the undiscounted replacement multiplier is above two under both scenarios. Thus, after providing a price discount and paying dividends to investors, the project is still able to accumulate enough cash flow to replace itself twice at the end of 25 years. While undiscounted metrics can be deceiving because a dollar tomorrow is not worth as much as a dollar today, this suggests substantial confidence in the ability to make needed replacements when necessary.
Discounted results under 100% equity financing, presented in Table 6, show that the NPV is positive under all scenarios at a discount rate of 5.0%. The fact that all the indicators meet their threshold conditions suggests that the project is economically feasible under the 100% equity financing situation. Yet, the discounted ROI for investors was about 26% under Scenario 1 and only about 2% under Scenario 2, making the investment uncompetitive with the long-term S&P 500 return of 7% (Maverick, 2020). This means that the investment will be less attractive to investors if Scenario 2 prevails. Because the discounted replacement multiplier is greater than unity under both anhydrous ammonia price scenarios, the project could increase the price discount and dividend rates to increase its attractiveness to potential producers and community investors.

TABLE 6. Discounted performance indicators under 100% equity financing situation with discount rate of 5.0% and higher efficiency SOEC energy-to-ammonia technology (6.5 MWh/MT).
The sensitivity of the returns on investment (ROI) for producer (ROIP) and community (ROIC) investors were investigated with the view of determining the potential effects of increasing investor payouts to increase project attractiveness on overall project economic performance. The limit of increases in these rates is determined by the project’s ability to accrue enough to replace itself, i.e., positive NPV.
The parameters used for the sensitivity analysis were increased by 1 percentage point over 10 steps from their base values of 23% price discount and 30% dividend. The summary statistics are presented in Table 7. While ROIP dominates ROIC for all scenarios after the initial price discount and dividend rates of 23% and 30%, respectively, dividend rate elasticities are higher than price discount elasticities for each scenario (Table 7).
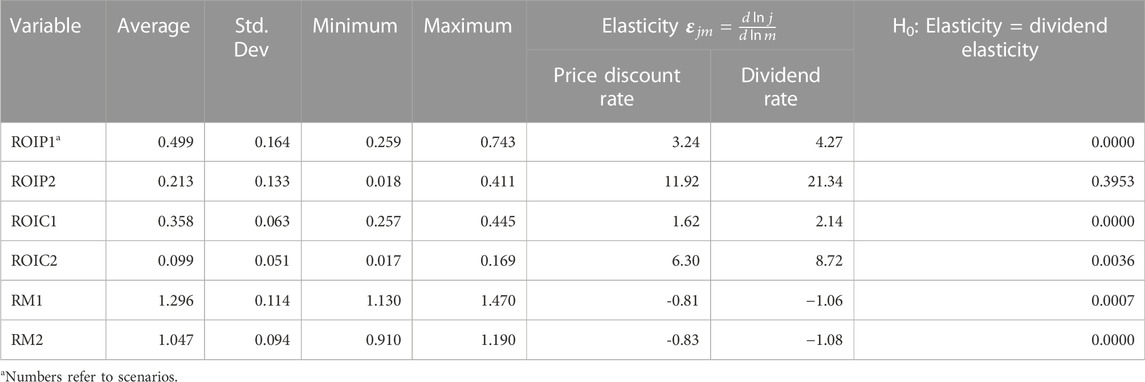
TABLE 7. Summary statistics for ROIP and ROIC results for sensitivity to changes in price discount rate and dividend rate under 100% equity financing and higher efficiency SOEC energy-to-ammonia technology (6.5 MWh/MT).
Unlike ROIP and ROIC, increasing the price discount and dividend rates decrease the replacement multiplier. Hence the price and dividend rate elasticities of the replacement multiplier were all negative. For example, the price discount rate elasticity of the replacement multiple was −0.81 under Scenario 1 and −0.83 under Scenario 2. The dividend rate elasticity of the replacement multiple was −1.06 for Scenario 1 and −1.08 for Scenario 2.
The test of the hypothesis that there is no difference between price discount and dividend rate elasticity was rejected for all variables under all scenarios except ROIP under Scenario 2, setting the significance level at 0.05. This provides a strategic direction for project managers on how the attractiveness question may be addressed. Because the dividend rate produces larger absolute elasticities than the price discount rate, it would seem that increasing the dividend rate more than the price discount rate could produce a higher impact on ROIP and ROIC. However, this must be done with a focus on their effect on the replacement multiplier.
Financing the project without debt requires producer and community investors to put up significant capital. Assuming that there are 4,000 eligible “average farmers” in the study area, this would require each of them to put in about $98,000 for 50% equity! At an average anhydrous ammonia price of $500/MT, the average farm must be about 1,062 Ha for the required capital to equal 1 year’s expenditure on anhydrous ammonia.
The difficulties described above for 100% equity financing can be addressed with Debt Financing. Debt Financing I assumes 25% of the project’s capital cost is debt, farmers put up 35%, and the community 40%. The interest rate on debt is assumed at 5.75% and it is financed over 7 years. At this level of farmer equity, the average investment for 4,000 farmers is about $68,174. This was about 38% higher than what the average Iowa farmer invested in ethanol processing facilities in the early 2000s (Institute for Agriculture and Trade Policy, 2006).
The discounted net cash flow from the foregoing financing strategy and other associated performance indicators using a 5% discount rate are presented in Table 8. The 25-years total discounted net cash flow was estimated at $242 million under the first price scenario compared to approximately $24 million under the second price scenario. The discounted total investment value to producers was about $215 million under the first price scenario and about $122 million under the second. The results also indicated that while the conditions under the first price scenario contributed to a replacement multiplier of 1.3, i.e., the turbines and ammonia production plant can be replaced in 25 years from cash flow and investors will have more than 30% of their equity left over after such replacement. On the other hand, replacement under the second price scenario leaves a surplus of only about 3%. Finally, community investor returns on their investment were about four times higher under the first price scenario compared to the second price scenario and about one-and-a-half times under the first price scenario under 100% equity financing.

TABLE 8. Discounted performance indicators under debt financing I (producers = 35%; community = 40%; debt = 25%) with a discount rate of 5.0% and higher efficiency SOEC energy-to-ammonia technology (6.5 MWh/MT).
Debt Financing II tests the sensitivity of the project to debt financing, increasing debt to 50% compared to 25% under Debt Financing I. Producers’ equity contribution remains at 35% but community investment goes down to 15% from 40%.
Increasing the debt used to finance the project reduces the replacement multiplier from about 1.31 under Debt Financing I to 1.15 under the first price scenario and from 1.03 to 0.87 under the second price scenario. Therefore, the project would be unable to replace itself from cash flow if debt financing is doubled to 50% and community financing is reduced from 40% to 15% and the projected ammonia prices under the second price scenario prevail. The project is, however, economically feasible under the first price scenario but not under the second price scenario. Yet, the financing arrangement under Debt Financing II produces a higher return to community investors because the dividend rate is not changed despite the lower contribution from community investors. The foregoing results are summarized in Table 9.

TABLE 9. Discounted performance indicators under debt financing II (producers = 35%; community = 15%; debt = 50%) with a discount rate of 5.0% and higher efficiency SOEC energy-to-ammonia technology (6.5 MWh/MT).
For the project to be economically feasible under both scenarios, the ammonia price discount and dividend rates must be adjusted. Holding the price discount rate at its current rate of 23%, the project can become economically feasible if the dividend rate is set over the 25 years at no higher than 19.6%. That dividend rate drives the discounted net cash flow to zero for Scenario 2 and increases the replacement multiple for Scenario 1 to 1.3 and Scenario 2 to 1.0. If the dividend rate is maintained at 30% and the price discount is adjusted instead, the results show that it has to decrease from 23% to 14.7% for the project to be feasible under both price scenarios. However, because producer return on investment is negative (−7.8%) under Scenario 2 for this condition, it will not be attractive for producers. This means this higher level of debt financing makes the project infeasible.
The foregoing results are for the most efficient (6.5 MWh/MT) energy-to-ammonia SOEC technology system. The results for the lower efficiency energy-to-ammonia SOEC technology (8.1 MWh/MT) are presented in Table 10 under the Debt Financing I conditions, i.e., 25% debt, 35% producer equity, and 40% community investment. The specified energy-to-ammonia rate would require a higher number of turbines to produce the required electricity for the 248,188 MT of ammonia needed annually in the community. The capital intensity under this conversion efficiency was presented in Table 2 above. The table showed that total capital expenditure under the 8.1 MWh/MT efficiency condition was about 25% higher compared to the 6.5 MWh/MT efficiency condition.
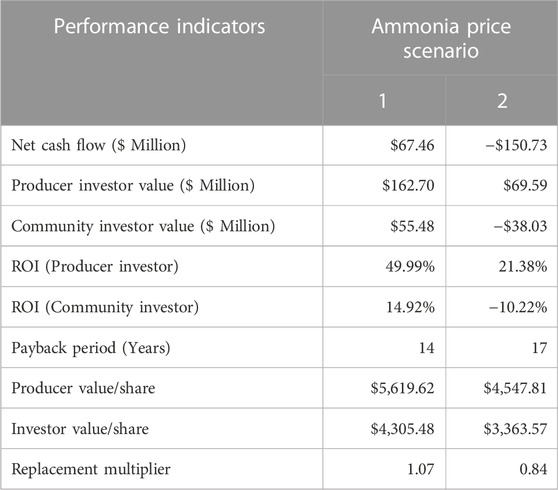
TABLE 10. Discounted performance indicators under debt financing I (producers = 35%; community = 40%; debt = 25%) with a discount rate of 5.0% and lower efficiency SOEC energy-to-ammonia technology (8.1 MWh/MT).
Table 10 shows the discounted financial results for the project under the two projected price scenarios. It shows that the project is only feasible under ammonia price scenario 1, posting a discounted net cash flow of about $67.5 million and a replacement multiple of 1.07. While producer investors’ made about 50% return on their investments, community investors only made about 15%. Since the price projection under scenario 1 is fairly optimistic, making investments based on these results carries a higher level of risk than under the more efficient energy-to-ammonia situation. It was determined that for the project to be feasible under both scenarios, the discount rate must be no higher than 3.38%, which, being below the market cost of capital, suggests that the idea is impractical.
Since the 8.1 MWh/MT energy-to-ammonia conversion technology is deemed infeasible for this more advantageous SOEC technology, the conventional technologies are irrelevant alternatives given their higher capital cost outlays to produce the same quantity of anhydrous ammonia under the assumed conditions of prices, interest rate, and discount rate.
This research sought to highlight the potential economic viability that may be engendered by local green ammonia production in small towns and rural (STAR) communities. The local production of green ammonia ensures that money that currently flows out of STAR communities to purchase ammonia will stay within those communities. Local production boosts local economies by creating new jobs, increasing local populations, and fueling economic development. Local green ammonia production also protects farmers from the vicissitudes in the ammonia market, enabling them to have better planning of their production and cost management. Having local production also eliminates supply chain problems that often force farmers to purchase their ammonia well ahead of time without any guarantee of receiving it.
The research focused on returning dividends to investors while providing a guaranteed discount to farmers no matter the market price for ammonia. This ensures that producers in the community have an ammonia fertilizer input cost advantage, allowing them to deal with crop prices a lot more effectively. That the project pays dividends to its community investors implies it improves their cash position, allowing them to support local businesses through reinvestment of their dividends in those businesses or consumption of their products and services. Ultimately, once the replacement cost of the project has been banked, investors and owners may decide to collaborate with their community to recruit businesses that have the potential to enhance the community’s economic viability and also fit its social values. This way, STAR communities have more active control over shaping their future, sustaining or growing their populations, and making themselves attractive as a destination for economic progress in an increasingly competitive market.
Money leaving STAR communities can be invested in local projects. Assuming an equal probability of the two price projections occurring, the projected expenditures on ammonia alone leaving the case community average about $131.2 million per year. With the assumed 25-years lifespan of the project, the community could retain approximately $3.28 billion, holding all other things constant under the assumed conditions of the research. A local anhydrous ammonia plant using local wind energy as its energy source could terminate this capital migration and enhance economic activity in these STAR communities. Additionally, bringing anhydrous ammonia prices under local control decouples its price from traditional natural gas and commodity prices for local producers, thereby reducing the variability that they cause in farm incomes (Huang et al., 2009).
This research sought to determine the techno-economic feasibility of producing green ammonia under alternative energy-to-ammonia conversion efficiencies and financing options. An innovative financing alternative was to include the community for which the ammonia is being produced and in which it is being produced in the investment options. The expected outcome is to capture money that is currently leaving the community for reinvestment in community economic development. The case community was defined as the southwest Kansas region that forms USDA Agricultural District 30. This region is remote, arid, and yet a major food and livestock production in Kansas. Ammonia production for the region was premised on the average ammonia used on the five principal crops produced in the region over the past 3 years, estimated at 248,188 MT. Being this specific about place and output was necessary because economic feasibility can be influenced extensively by location. The region’s major natural resource is wind.
The project used Vestas V100-1.8 turbines, rated at 1.8 MW and the projected energy output from the NREL SAM as the source of energy. The best case of energy-to-ammonia conversion efficiency was the employment of the SOEC technology that used 6.5 MWh/MT of anhydrous ammonia. All capital costs regarding energy production were obtained from the NREL SAM simulator. Industry sources provided the information on reactors, storage tanks, vehicles, and other capital expenditures and personnel. It assumed that the project would produce all the ammonia needed in the case community. At the stated energy-to-ammonia conversion above, this implied building 234 turbines to produce a total of 6,997 MWh/turbine per year. The total capital expenditure for the energy system was estimated at $608.21 million. The capital cost of the ammonia plant, including storage tanks, was estimated at $173.51 million, bringing the total plant capital cost for the most efficient system to $781.72 million. The plant operating costs were set at $100/MT since all energy was being supplied by the project’s energy system.
The best outcome financing structure comprised 35% of total capital emanating from community farmers who would consume all the ammonia produced, 40% from community investors, and the remaining 25% by debt at 5.75% amortized over 7 years. The results indicated that the project was feasible under all scenarios with a 23% anhydrous ammonia price discount and a 30% dividend payout. This implies that investor farmers paid 23% less for their ammonia fertilizer regardless of the prevailing market prices. The results indicated that the discounted cash flow was positive and the replacement multiplier under the two price scenarios were both greater than one, meaning the project was able to replace itself after its 25-years lifespan without any need for capital infusion. This also implies that both farmers and community investors continue to reap the benefits from their investment ad infinitum, as long as the project is able to replace itself and keep pace with changing technologies by putting excess cash aside for that purpose. The cash flow generated for investors is how the project’s support for community economic viability is realized. Investors may invest in local businesses and the community may attain a position to more successfully attract people and businesses that fit its core values.
Emerging energy-to-ammonia technologies are altering the economics of ammonia production and creating opportunities for small towns and rural communities to rethink their socio-economic viability futures. One of such emerging technologies–solid oxide electrolysis cell (SOEC) technology–has received significant attention in recent years as a promising breakthrough technology in the production of green ammonia. With its abundant wind resources, the study explored the techno-economic feasibility of producing all the ammonia required by farmers in the USDA Agricultural District 30 in southwest Kansas. Using capital expenditure estimates from NREL and literature and personal interviews, and a combination of debt, community, and equity financing, the results show that a project to build a green ammonia facility in the case region was economically feasible. It not only produced the required ammonia needed in the region, but it was able to provide the green ammonia to farmer investors at a 23% discount and pay a 30% dividend to all investors and still be economically feasible under two alternative projected price series. This puts its farmer investors at a competitive advantage in their crop markets, giving them more leeway in managing other risks. It also creates the opportunity for community residents to retain their expenditures in their community and invest their dividends in enhancing the economic viability of their community.
The original contributions presented in the study are included in the article/Supplementary Material, further inquiries can be directed to the corresponding author.
VA-B devised and supervised the research. Both CO-B and VA-B contributed to the data collection, to the analysis and interpretation of results and to the writing of the manuscript.
This study was funded by the National Science Foundation grant 1856084 for the FEWtures project.
Assistance from PI Mary C. Hill and conversations with fellow FEWtures students are greatly appreciated.
The authors declare that the research was conducted in the absence of any commercial or financial relationships that could be construed as a potential conflict of interest.
All claims expressed in this article are solely those of the authors and do not necessarily represent those of their affiliated organizations, or those of the publisher, the editors and the reviewers. Any product that may be evaluated in this article, or claim that may be made by its manufacturer, is not guaranteed or endorsed by the publisher.
The Supplementary Material for this article can be found online at: https://www.frontiersin.org/articles/10.3389/fenvs.2022.1070212/full#supplementary-material
Ag Update, (2018). U.S. reports document anhydrous price decline in 2016. Available at: https://www.agupdate.com/u-s-reports-document-anhydrous-price-decline-in-2016/article_84b607f6-12a2-11e8-b9ac-d32befe42d8c.html (Accessed April 22, 2021).
Bicer, Y., Dincer, I., Vezina, G., and Raso, F. (2017). Impact assessment and environmental evaluation of various ammonia production processes. Environ. Manage. 59 (5), 842–855. doi:10.1007/s00267-017-0831-6
Blair, N., DiOrio, N., Freeman, J., Gilman, P., Janzou, S., Neises, T., et al. (2018). System advisor Model (SAM) general description (version 2017.9.5). Golden, CO: National Renewable Energy Laboratory, NREL/TP-6A20-70414.
Cardoso, J. S., Silva, V., Chavando, J. A. M., Eusébio, D., Hall, M. J., and Costa, M. (2021). Small-scale biomass gasification for green ammonia production in Portugal: A techno-economic study. Energy fuels. 35 (17), 13847–13862. doi:10.1021/acs.energyfuels.1c01928
Chen, S., Perathoner, S., Ampelli, C., and Centi, G. (2019). Electrochemical dinitrogen activation: To find a sustainable way to produce ammonia. 1st ed. Amsterdam, Netherlands: Elsevier B.V.
Cinti, G., Frattini, D., Jannelli, E., Desideri, U., and Bidini, G. (2017). Coupling solid oxide electrolyser (SOE) and ammonia production plant. Appl. Energy 192, 466–476. doi:10.1016/j.apenergy.2016.09.026
Erisman, J. W., Sutton, M. A., Galloway, J., Klimont, Z., and Winiwarter, W. (2008). How a century of ammonia synthesis changed the world. Nat. Geosci. 1 (10), 636–639. doi:10.1038/ngeo325
Energy.gov, (2008). United States - land based and offshore annual average wind speed at 100 meters. Wind Energy Technologies Office, Office Energy Efficiency and Renewable energy. Available at: https://www.energy.gov/eere/wind/downloads/united-states-land-based-and-offshore-annual-average-wind-speed-100-meters.
Fúnez Guerra, C., Reyes-Bozo, L., Vyhmeister, E., Jaén Caparrós, M., Salazar, J. L., and Clemente-Jul, C. (2020). Technical-economic analysis for a green ammonia production plant in Chile and its subsequent transport to Japan. Renew. Energy 157, 404–414. doi:10.1016/j.renene.2020.05.041
Ghiyati, Y. I. Z. (2021a). Green hydrogen. Haldo Topsoe. Available at: https://info.topsoe.com/green-hydrogen?hsCtaTracking=0eadc23d-d4c7-4c75-81e8-0aa220e0c24c%7C56907e9b-d033-410c-86bb-29c2c85927c6 (Accessed Apr. 29, 2021).
Ghiyati, Y. I. Z. (2021b). Hydrogen process. Haldor Topsoe. Available at: https://www.topsoe.com/processes/hydrogen (Accessed Apr. 18, 2021).
Greenfield Nitrogen LLC, (2018). Greenfield Nitrogen, LLC, to build regional Iowa ammonia plant through grass-roots ownership. CISION PRNewswire. Available at: https://www.prnewswire.com/news-releases/greenfield-nitrogen-llc-to-build-regional-iowa-ammonia-plant-through-grass-roots-ownership-300610195.html.
Gross, S. (2020). Renewables, land use, and local opposition in the United State. Foreign Policy. Washington, DC: The Brookings Institution. Available at: https://www.brookings.edu/research/renewables-land-use-and-local-opposition-in-the-united-states/.
Guo, C., Ran, J., Vasileff, A., and Qiao, S. Z. (2018). Rational design of electrocatalysts and photo(electro)catalysts for nitrogen reduction to ammonia (NH3) under ambient conditions. Energy Environ. Sci. 11 (1), 45–56. doi:10.1039/c7ee02220d
Hauch, A., Kungas, R., Blennow, P., Hansen, A. B., Hansen, J. B., Mathiesen, B. V., et al. (2020). Recent advances in solid oxide cell technology for electrolysis. Recent Advances in Solid Oxide Cell Technology for Electrolysis. 370, eaba6118–6513. doi:10.1126/science.aba6118
Huang, W., McBride, W. D., and Vasavada, U. (2009). Recent volatility in U.S. Fertilizer prices. Amber Waves, Economic Research Service. Available at: https://www.ers.usda.gov/amber-waves/2009/march/recent-volatility-in-us-fertilizer-prices/.
Institute for Agriculture & Trade Policy, (2006). Ethanol ownership shifting from farmers. [Online] Available at: https://www.iatp.org/news/ethanol-ownership-shifting-from-farmers.
Jacobson, R. (2016). Where do wind turbines go to die? Inside Energy. Available at: https://insideenergy.org/2016/09/09/where-do-wind-turbines-go-to-die/.
Lindsey, R. (2013). Climate change to increase water stress in many parts of U.S. ClimateWatch Magazine. Available at: https://www.climate.gov/news-features/featured-images/climate-change-increase-water-stress-many-parts-us.
Liu, X., Elgowainy, A., and Wang, M. (2020). Life cycle energy use and greenhouse gas emissions of ammonia production from renewable resources and industrial by-products. Green Chem. 22 (17), 5751–5761. doi:10.1039/d0gc02301a
MacFarlane, D. R., Cherepanov, P. V., Choi, J., Suryanto, B. H., Hodgetts, R. Y., Bakker, J. M., et al. (2020). A roadmap to the ammonia economy. Joule 4 (6), 1186–1205. doi:10.1016/j.joule.2020.04.004
Maverick, J. B. (2020). What is the average annual return for the S&P 500?. Available at: https://www.investopedia.com/ask/answers/042415/what-average-annual-return-sp-500.asp (Accessed May 4, 2021).
Michalsky, R., Pfromm, P., Parman, B., and Amanor-Boadu, V. (2011). “Solar thermochemical production of solar-grade silicon: Thermodynamic and economic analyses,” in 11AIChE - 2011 AIChE Annual Meeting, Conference Proceedings, Minneapolis, United State, October 2011.
Milborrow, D. (2020). Energy cost analysis 2020: Wind is ready for zero-subsidy future, Windpower Monthly. Haymarket Media Group. Available at: https://www.windpowermonthly.com/article/1671659/energy-cost-analysis-2020-wind-ready-zero-subsidy-future.
Morgan, E., Manwell, J., and McGowan, J. (2014). Wind-powered ammonia fuel production for remote islands: A case study. Renew. Energy 72, 51–61. doi:10.1016/j.renene.2014.06.034
Morgan, E. R., Manwell, J. F., and McGowan, J. G. (2017). Sustainable ammonia production from U.S. Offshore wind farms: A techno-economic review. ACS Sustain. Chem. Eng. 5 (11), 9554–9567. doi:10.1021/acssuschemeng.7b02070
Mosheim, R. (2019). Fertilizer use and price. Available at: https://www.ers.usda.gov/data-products/fertilizer-use-and-price/ (Accessed April 13, 2021).
National Tank Outlet, (2021). Ammonia tanks: Anhydrous ammonia (NH3) storage tanks. Available at: https://www.ntotank.com/ammonia-storage-tanks (Accessed April 18, 2021).
NREL and AWS Truepower LLC, (2013). United States - Land based and offshore annual average wind speed at 100 meters. Wind Energy Technologies Office, Office Energy Efficiency and Renewable energy. Available at: https://www.energy.gov/eere/wind/downloads/united-states-land-based-and-offshore-annual-average-wind-speed-100-meters (Accessed December 4, 2022).
Pfromm, P. H. (2017). Towards sustainable agriculture: Fossil-free ammonia. J. Renew. Sustain. Energy 9 (3), 1–11. doi:10.1063/1.4985090
Renewables First. (n.d.), . How long does a wind turbine last?. Available at: https://www.renewablesfirst.co.uk/windpower/windpower-learning-centre/how-long-do-wind-turbines-installations-last/ (Accessed April 27, 2021).
Royal Society, (2020). Ammonia: Zero-Carbon fertiliser, fuel and energy store. Policy Briefing. London, United Kingdom: The Royal Society, 1–40. Available at: https://royalsociety.org/topics-policy/projects/low-carbon-energy-programme/green-ammonia/.
Sánchez, A., and Martín, M. (2018). Optimal renewable production of ammonia from water and air. J. Clean. Prod. 178, 325–342. doi:10.1016/j.jclepro.2017.12.279
Schnitkey, G. (2016). “Anhydrous ammonia, corn, and natural gas prices over time” farmdoc daily. Department of Agricultural and Consumer Economics, University of Illinois at Urbana-Champaign, (6), 112.
Scott, M. (2019). National climate assessment: Great Plains’ Ogallala aquifer drying out. NOAA, ClimateWatch Magazine. Available at: https://www.climate.gov/news-features/featured-images/national-climate-assessment-great-plains’-ogallala-aquifer-drying-out.
Smith, C., Hill, A. K., and Torrente-Murciano, L. (2020). Current and future role of Haber-Bosch ammonia in a carbon-free energy landscape. Energy Environ. Sci. 13 (2), 331–344. doi:10.1039/c9ee02873k
Smith, C., and Torrente-Murciano, L. (2021). The potential of green ammonia for agricultural and economic development in Sierra Leone. One Earth 4 (1), 104–113. doi:10.1016/j.oneear.2020.12.015
Sousa, J., Waiblinger, W., and Friedrich, K. A. (2022). Techno-economic study of an electrolysis-based green ammonia production plant. Ind. Eng. Chem. Res. 61 (39), 14515–14530. doi:10.1021/acs.iecr.2c00383
Tang, E., Wood, T., Brown, C., Casteel, M., Pastula, M., Richards, M., et al. (2016). Solid oxide based electrolysis and stack technology with ultra-high electrolysis current density (>3A/cm2) and efficiency. FuelCell Energy, Inc.
Tunå, P., Hulteberg, C., and Ahlgren, S. (2014). Techno-economic assessment of nonfossil ammonia production. Environ. Prog. Sustain. Energy 33, 1290–1297. doi:10.1002/ep.11886
U.S. Census Bureau, (2019). Kansas Counties by population. Annual estimates of the resident population. Available at: https://www.census.gov/data/datasets/time-series/demo/popest/2010s-counties-total.html (Accessed April 1, 2010 to July 1, 2019.).
USDA-NASS, (2019a). USDA/NASS QuickStats ad-hoc query tool (Ag cropland - Kansas counties). National Agricultural Statistics Service.
USDA-NASS, (2019b). USDA/NASS QuickStats ad-hoc query tool (Ag Cropland - Kansas Counties). Washington, United States; United States Department of Agriculture, National Agricultural Statistics Service. Available at: https://quickstats.nass.usda.gov/results/0C0FAB59-567B-3E76-A543-118043D43F5C.
U.S. Congressional Research Service, (2021). U.S. Climate Change Policy Summary. (R46947; Oct. 28, 2021), by Richard K. Lattanzio, Jane A. Leggett, Kezee Procita, Jonathan L. Ramseur, Corrie E. Clark, Genevieve K. Croft, and Rena S. Mille.
V Parmar, V. (2019). Ammonia production from a non-grid connected floating Offshore wind-farm : A system-level techno-economic review. Amherst, United State: University of Massachusetts Amherst, 1–63. Master Thesis.
Keywords: wind energy, green ammonia, economic feasibility, STAR communities, solid oxide electrolysis cell (SOEC)
Citation: Ofori-Bah CO and Amanor-Boadu V (2023) Directing the wind: Techno-economic feasibility of green ammonia for farmers and community economic viability. Front. Environ. Sci. 10:1070212. doi: 10.3389/fenvs.2022.1070212
Received: 14 October 2022; Accepted: 29 November 2022;
Published: 04 January 2023.
Edited by:
Donald Wuebbles, University of Illinois at Urbana-Champaign, United StatesReviewed by:
Patrick Thabang Sekoai, Council for Scientific and Industrial Research (CSIR), South AfricaCopyright © 2023 Ofori-Bah and Amanor-Boadu. This is an open-access article distributed under the terms of the Creative Commons Attribution License (CC BY). The use, distribution or reproduction in other forums is permitted, provided the original author(s) and the copyright owner(s) are credited and that the original publication in this journal is cited, in accordance with accepted academic practice. No use, distribution or reproduction is permitted which does not comply with these terms.
*Correspondence: Catherine Obiribea Ofori-Bah, Y29vZm9yaWJhaEBrc3UuZWR1
Disclaimer: All claims expressed in this article are solely those of the authors and do not necessarily represent those of their affiliated organizations, or those of the publisher, the editors and the reviewers. Any product that may be evaluated in this article or claim that may be made by its manufacturer is not guaranteed or endorsed by the publisher.
Research integrity at Frontiers
Learn more about the work of our research integrity team to safeguard the quality of each article we publish.